Abstract
Water resources management (WRM) is a global strategic issue. Effectively evaluating WRM performance and analyzing its influencing factors have strong practical significance for improving regional WRM performance. Data envelopment analysis (DEA) is one of the most popular models to measure the efficiency of decision-making units (DMUs). Taking regional WRM performance as efficiency DMUs, this paper proposes the indicator system to quantify WRM performance from the perspectives of resource endowments, economic and technological development, and ecosystem protection. The WRM performance of 31 provincial administrative regions in mainland China from 2013 to 2019 are measured, and the temporal and spatial changes are explored using the window DEA model and the Malmquist index model. Finally, the Tobit model is used to quantitatively analyze the affecting factors. The results indicate that: (1) in 2015 and 2019, WRM performance of Sichuan, Shaanxi, Xinjiang, Inner Mongolia, and Guangxi were slightly higher than that in other years, and the areas with more room for WRM performance improvements were areas with abundant water resources; (2) from 2013 to 2019, China’s overall WRM performance showed a slow rise, and there were obvious fluctuations in 2018; (3) the improvement in WRM performance was primarily the result of an improvement to comprehensive technical efficiency changes (EC), whereas technological progress changes (TC) have largely restricted China’s WRM performance; (4) the main influencing factors of WRM performance in China were as follows: industrial development level, water resources utilization rate, and urban sewage discharge per capita.
1. Introduction
Under the realistic background of uneven temporal and spatial distributions, pollution, and overexploitation of water resources systems, the effective management of water resources is an urgent need [1]. The world will face a 40% gap between projected demand and the supply of available water resources by 2030 [2,3,4]. Obviously, the scarcity of water resources in the future highlights the importance of water resources management (WRM) in the economically vigorous region, which is highly industrialized and densely populated [5]. In order to strengthen water security in the context of increasing water demand and shortages [6,7,8], regional governments need to improve their WRM performance. Human factors, such as the capital investment in management and the manager’s overall planning ability and risk awareness, have a great influence on WRM [9]. The influencing degree of these factors on WRM is of great uncertainty. Thus, scientifically evaluating WRM performance and analyzing the influencing factors was always the pursuit of government personnel and scientific researchers.
In the past few decades, a wealth of discussions on WRM issues were planted [10,11,12]. In the exploration of WRM paths and models, European Union (UN) countries implement the Integrated water resources management model (IWRM) set by the EU [13,14]. In the IWRM system, rivers combined with other natural basins are managed in a unified and hierarchical manner to ensure their integrity [15,16,17]. Some countries, such as Singapore, adopted a unified management model that can more effectively implement the WRM policies to ensure their effectiveness [9]. In China, as well as in the United States, the regional WRM model was applied. The central government formulated WRM planning policies and guidelines [18], then the provinces, states, cities, and counties implemented these policies systematically.
Some countries tried to improve their WRM model consisting of political, social, environmental, and economic conditions, while some jointly implement a shared WRM model through a community. After the promulgation and implementation of the water framework directives (WFD) [19], good results were achieved in the field of water resources protection in the EU and they also enjoyed a high reputation internationally. In order to evaluate the performance of each WRM model and seek the optimal way to improve it, many scholars have conducted in-depth research on the WRM evaluation [20]. It is believed that the factors affecting WRM performance mainly include several aspects: the input of water resources, the development of the regional economy, the protection of the ecological environment, and the development of science and technology [21]. Thus some researchers try to use social, economic, environmental, and institutional standards to evaluate watershed or regional WRM performance at different scales [22,23]. Due to the great influence of human factors in the process of WRM, the evaluation of WRM performance can hardly be a simple linear presentation [20]. At the same time, the traditional evaluation methods find it difficult to reflect the system [24], as each factor in WRM influences each other. The system dynamics model (SD) can simulate WRM performance under different scenarios, and the optimization model can obtain the optimal path of WRM under different constraints [25,26]. A large amount of research involving environmental impact evaluation, including WRM, adopted SD [27]. SD modeling provides an overall view of complex dynamics, feedback processes, and interdependencies for the decision-making of WRM [28,29].
However, most of the evaluation methods need to assume a certain amount of parameters, which is difficult to realize a non-parametric quantitative evaluation of the evaluation object [30]. Compared with the methods mentioned above, the DEA model has the advantage of adopting non-parametric calculations [31]. The DEA model cannot perform dynamic analysis of data, the Malmquist index model is a method for processing time series data, and the two are usually combined to compensate for the limitations of the DEA model. Therefore, the authors integrate the DEA model and Malmquist index model to evaluate the WRM performance of 31 provincial administrative regions in China. Since WRM performance is affected by many factors, improvement and effective suggestions cannot be addressed when evaluation is conducted alone. At the same time, there are few research results on the spatial difference and influencing factors of WRM performance evaluation in the national area [32,33,34]. This paper uses the Tobit model to systematically analyze influencing factors on the basis of WRM performance evaluation. China has a vast area, and there are obvious differences in the number of regional water resources. Therefore, this paper conducts a regional assessment of China’s WRM performance based on geographic location.
For the reasons above, the current study focuses on the following aspects: (1) to define the connotation of WRM from multiple perspectives and establish an indicator system accordingly; (2) to introduce a practical evaluating method of management combining the window DEA model with the Malmquist index model into the evaluation of WRM performance; (3) to calculate the temporal and spatial changes in the WRM performance of 31 provincial administrative regions in China from 2013 to 2019; (4) to identify the main influencing factors of WRM in China with the Tobit model.
2. Literature Review
Data envelopment analysis (DEA) is widely used to evaluate the relative efficiency of different industries. Witte et al. [35] claimed that the DEA model is flexible because it does not require any assumption regarding the functional relationship between inputs and outputs. Additionally, it is widely utilized for its incentive-efficient properties. Omrani et al. [36] proposed an RCDEA model to measure the efficiency scores of 28 hospitals in the northwestern region of Iran. Rodrigues et al. [37] used the DEA model in conjunction with data mining techniques such as K-media and principal component analysis, evaluating the technical efficiency of the private school sector in Brazil. Similarly, Chen et al. [38] tried to utilize an extended two-stage network DEA approach for measuring the operating efficiency of 52 Chinese universities. The results show that one-third of universities in China are efficient and the others are inefficient, and the operating efficiency of “non-985” universities is significantly higher than that of “985” universities. Singh et al. [39] applied the DEA model to optimize the resource use efficiency (RUE) of wheat farms in northwestern India. The result shows that the DEA model helps to reduce the energy input of 1953.4 MJ ha−1 (~7.2%) and saved 70.5% fertilizer-K and 34.8% electricity. Michali et al. [40] adopted the DEA model to evaluate the environmental efficiency of railways in Europe considering environmental factors and found that asset efficient countries are also service efficient. Using the global innovation index (GII), published jointly by Cornell University and WIPO in 2020 in terms of innovation inputs and outputs, Aytekin et al. [41] performed DEA and EATWIOS techniques to benchmark the innovation efficiency of EU member and candidate countries.
2.1. Research on Window DEA (W-DEA) Model Application
The premise of the DEA model is to assume the homogeneity of the sample objects. While meeting the requirement of homogeneity, the number of sample objects will inevitably be reduced. The W-DEA model can solve the problem of small sample size and is more flexible. The W-DEA analysis method was first proposed by Charnes et al. [42] who used the method of moving each decision-making unit to examine the decision-making unit (DMU). W-DEA regards different periods of a DMU as different DMUs. In this way, for a particular DMU, it could be compared with others sequentially or with others in the same period. Halkos et al. [43] used power plant level data for two inputs and three undesirable outputs by employing the W-DEA model to measure environmental efficiency in 50 states of the USA. The result shows a stable N-shape relationship between regional economic and environmental growth efficiency in the case of total and global pollutants but an inverted N-shape in the case of provincial pollutants. Vlontzos et al. [44] undertook a study to assess greenhouse gas (GHG) emissions efficiency and identify efficiency change of EU countries’ primary sectors by applying the W-DEA model, quantifying positive or negative impact on a national basis, and then providing hints for counteractive actions. Sefeedpari et al. [45] set the W-DEA model with energy use as input and milk production as output using data from 25 provinces during the last 22 years (1994–2016) in Iran. They compared the model with the slack-based model (SBM) in a dynamic environment by window analysis.
2.2. DEA Application on WRM
Although the DEA model is widely used to evaluate energy efficiency, the research on its application in WRM is limited. From the perspective of research objects, the application of the DEA model is mostly focused on studying the utilization efficiency of water resources. Scholars have evaluated the utilization efficiency of water resources by applying the DEA model [46]. For example, agricultural water utilization efficiency [39,47,48], industrial water utilization efficiency [49,50], urban water utilization efficiency [51], and ecological efficiency of water resources [52].
However, the literature available in various regions of the world has contributed to a new body of knowledge focusing mainly on the following topics. Most studies have adopted the DEA model to evaluate the utilization efficiency of water resources. Rare research has regarded regional WRM performance as an efficient DMU and applied the DEA model to the evaluation of WRM performance. Therefore, the novelties of this paper are: Firstly, the connotation of WRM from multiple perspectives is defined. An index system for WRM performance evaluation is established from four aspects, namely, regional water resource endowments, local economic development, ecosystem protection, and regional technology development. Then, regional WRM performance could be viewed as a DMU whose efficiency can be measured by the DEA model. Secondly, this study combines the W-DEA model with the Malmquist index model to achieve a dynamic evaluation of regional WRM performance. Additionally, the Tobit model is used to estimate the determinants of technical efficiency for WRM performance, which is not applied in the existing literature. In addition, the analysis of reasons for the inefficient regions of WRM is the most important input to form the policies and identify effective strategies to make them efficient.
3. Study Area and Data Sources
3.1. Overview of the Study Area
China is one of the world’s poorest countries in terms of water resource reserves availability per capita (2300 m3), which is only 1/4 of the world average. In addition to the shortage, the temporal and spatial distributions of China’s water resources are extremely uneven (Figure 1). China is located on the western coast of the Pacific Ocean, with a vast territory, complex topography, and significant continental monsoon climate. From the southeast coast to the northwest inland China, precipitation decreases successively. In many places, especially the northern coastal areas, the increasingly serious water problem has become a “bottleneck”, restricting the sustainable development of China’s social economy [53].
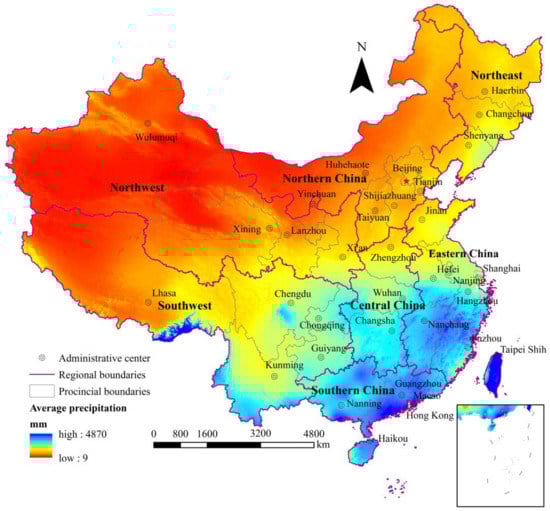
Figure 1.
Schematic diagram of the average annual precipitation amounts in the study area.
Based on the characteristics of geographic location, physical geography, and human geography, China is typically divided into seven regions: Northeast, Eastern China, Northern China, Central China, Southern China, Southwest, and Northwest [54] (Table 1). Figure 1 presents the average annual precipitation amount of China’s seven regions, showing that it varies significantly. The overall improvement of WRM in different areas is of great significance to maintain regional stability and sustainable development.

Table 1.
Division of China’s 31 provincial administrative regions.
3.2. Data Sources
To ensure the realization of primary goals of water resource development, utilization, conservation, and protection in accordance with the “Water Law of the People’s Republic of China”, the “Decisions of the Central Committee of the Communist Party of China and the State Council on Accelerating Water Conservancy Reform and Development” and “Opinions of the State Council on Implementing the Most Strict Water Resources Management System” were promulgated in 2011 and 2012, respectively (http://www.stats.gov.cn/ (accessed on 17 January 2022)). In 2013, China officially launched the assessment work for the implementation of the national “strictest water resources management system.” [55] Therefore, 2013 was chosen as the year to begin this research. The 31 provincial administrative regions of China were viewed as the research area. Data from the “China Statistical Yearbook” [56], the “China Water Resources Bulletin” [57], the “China Environment Yearbook” [58], the “Statistical Yearbook” of various provinces, and the relevant data from China’s National Bureau of Statistics were compiled to obtain the original data.
For the input–output index data used in the window DEA model, the “Per capita water consumption” was collected from the water resources bulletin of each province. The “percentage of water management personnel” was derived from the ratio of the number of employees in the water conservancy industry and the number of employees in non-private organizations collected from the “China Statistical Yearbook”, showing the difference in WRM human resource input in different regions. “Water-saving irrigation rate” was determined by the ratio of water-saving irrigation area to the regional irrigated area. The data was collected from the “China Rural Statistical Yearbook”, except for one missing aspect in 2013. The data of “effective irrigation area” in 2013 from the “China Water Conservancy Yearbook” was used instead of the data for “irrigated area”. Since the urban sewage discharge data of various provincial administrative regions in 2019 was not yet released, in order to ensure data consistency in the time series, the TREND function was used to fit the data of regional urban sewage discharge in 2019.
4. Research Methods and Indicators
4.1. Indicator Selection
This research attempts to select an evaluation index system that can better reflect WRM performance. The authors standardized the selection range of indicators through a series of methods. Additionally, the indicators were chosen based on the principles of the scientific, representative, complete, and operable data. The selection basis of indicators are as follows:
- (1)
- Based on related theories. WRM is the use of administrative, legal, economic, technological, and educational means by the water administrative department. The content of WRM involves developing water conservancy and preventing water disasters, coordinating the relationship between social-economic development and water resources utilization, dealing with conflicts in water users, supervising unreasonable actions that endanger water sources, and formulating water supply systems and reservoir projects [3]. Therefore, based on the basic theories of WRM combined with the characteristics of the elements of the humanistic system involved in the management process, the indicators were chosen from four aspects: (i) regional water resources endowments, (ii) local economic development, (iii) ecosystem protection, and (iv) regional technological development.
- (2)
- According to relevant literature. Based on the above four aspects, the large-scale research conducted by scholars on the situation in various regions was summarized to help better understand the connotation of WRM. Bibliometrics and its visualization tools were used as a quantitative method to investigate the important literature, hot topics, and research frontiers of WRM since 1980. VOSviewer was chosen to search the Web of Science database of the Institute for Scientific Information using the keyword “water resource management”. A total of 237,489 documents were retrieved, and the operation time was 16 March 2021.
- (3)
- According to the research hotspots in the field of WRM, the following operations were conducted: (i) Keywords having nothing to do with research substance, such as “framework”, “ratio”, “decade”, and “case study”, were eliminated. (ii) Some keywords with similar connotations were combined as one. For example, the authors kept the keyword “wastewater” instead of “wastewater treatment” and “waste”, for they all indicate research on wastewater. (iii) According to the clustering situation analyzed by VOSviewer, the categories of keywords in the field were combined with the definition of the connotations of WRM [59,60,61] analyzed above. In this study, it was concluded that the clustering results of WRM should be divided into four parts for discussion (Table 2).
Table 2. The content and evaluation indicator system of WRM.
- (4)
- Based on practical research. Aiming at checking the WRM evaluation indicator system, the authors consulted professors from the School of Water Conservancy Science and Engineering in Zhengzhou University and the North China University of Water Conservancy and Electric Power. Finally, according to the actual situation regarding China’s WRM process, the indicators were selected, as shown in Table 2.
4.2. Research Methods
4.2.1. The Window DEA Model
Data envelopment analysis (DEA) is a non-parametric technical efficiency analysis method based on the relative comparison between the evaluated objects [62]. Since DEA bears the characteristics of a wide application range and relatively simple principle, it has special advantages, especially when analyzing multiple input and output indicators. DEA can evaluate the relative efficiency of a group of decision making units (DMU) through a specific mathematical programming model.
DEA is commonly used to evaluate the natural resource allocation efficiency [63]. When evaluating the performance of multiple regions in a long-term series, the ordinary DEA model would not be suitable due to the different production frontiers in the different years. In the ordinary DEA model, the entire panel data is directly measured. However, the panel data is decomposed into cross-sectional data for static calculations, which leads to efficiency results measured by the ordinary DEA model alone that are not comparable between years [64]. Window DEA model can solve the above problems. In this study, it is used to dynamically evaluate the efficiency values of 31 provincial administrative regions in China from 2013 to 2019.
The basic principle of the window DEA model is to regard the same DMU in different years as multiple DMUs and then calculate the efficiency values of different decision units [47]. Using a window DEA model, the need for dynamic comparison and analysis of the time series of each DMU is met. The same cross-sectional data is repeatedly involved in the calculation, which can fully tap the value of the data and reflect performance. Combined with the research of Halkos et al. [65], the optimal window width was determined to be 3a, that is, to participate in the calculation of DMU every three years. The time series length of this research was seven. Therefore, each DMU was established as Window1 (2013–2015), Window2 (2014–2016), Window3 (2015–2017), Window4 (2016–2018), and Window5 (2017–2019), and a total of 93 DMUs in the 31 provincial administrative regions under each window were calculated.
4.2.2. The Malmquist Index Model
In this study, the window DEA model can measure the technical efficiency of WRM, but it cannot represent the change of total factor productivity of WRM. Therefore, the Malmquist index model is used to explore the change of total factor productivity of WRM. The Malmquist index model was first proposed by the Swedish economist Sten Malmquist in 1953 [66], and later Caves et al. [67] applied this idea to production analysis. Nowadays, the decomposition method of the Malmquist index model in academic circles is different. This study adopts the decomposition method proposed by Fare et al. [68]. In addition, the WRM performance of each region in every period is measured. Changes in the WRM performance are also investigated. Compared with period t, the reasons for changes in the production efficiency in period t + 1 could be decomposed into comprehensive technical efficiency changes (EC) and technical progress changes (TC), and EC could be decomposed into pure technical efficiency changes (PEC) and the scale efficiency changes (SEC), namely:
where, xt, xt+1 represent the input indicator vectors for periods t and t+1 respectively; yt, yt+1 represent the output indicator vectors for periods t and t+1 respectively. MI is the total factor productivity index, representing the change of total factor productivity; Dt is the efficiency value of DMU in t period; MI can be decomposed into EC and TC. EC can be further decomposed into PEC and SEC. MIt,t+1 > 1 means that the DMU’s water resources total factor productivity during the t+1 period is higher than that in the t period; ECt,t+1 > 1 indicates that the DMU was better than that during the period t+1. The period was nearer to the production frontier, which meant that the comprehensive technical efficiency changes were improved. TCt,t+1 > 1 means that the production frontier of period t+1 had changed compared with period t, which represents an improvement in the management performance.
4.2.3. The Tobit Model
Since the value of WRM performance is between 0 and 1, the management performance value (the reciprocal of the efficiency value minus 1, i.e., 1/WRM-1) is the left-bound cut data from 0 to infinity. If the parameters are estimated using the ordinary least squares method, they will be biased and inconsistent. To solve this problem, Tobin [69] first proposed the Tobit model, which is also known as the truncated regression model. An important feature of the model is that the explained variables are truncated data; that is, the explained variables are greater or less than a certain value. Therefore, in order to more comprehensively analyze the factors affecting WRM performance, the values of WRM performance measured by the window DEA model are set as the dependent variables. The economic, political, and other regional factors are set as the independent variables of the Tobit model. This model explores the influencing degree of different factors on WRM.
The general form of the Tobit model is as follows:
if there is no lower cut-off point, set ; and if there is no higher cut-off point, set .
During the actual process of WRM, there are many factors that affect WRM performance. According to the connotation of WRM discussed in Section 3.1, this study selects six factors in four general parts of WRM to analyze the affecting factors of WRM (Table 3). The economic development of China’s provincial administrative regions differs greatly from each other. The famous research called “Hu Huanyong Line” [70] summarized the great differences of China’s economic development between the eastern coastal areas and that in western inland areas. This paper uses GDP per capita to represent local economic development. Additionally, the industrial structure, representing the local economic growth pattern, can have a certain impact on WRM. In this study, the output value of secondary industry accounts for the proportion of regional GDP used to represent the industrial structure. The third kind is the factor expressed in terms of per capita urban sewage discharge, representing local ecosystem protection. With the acceleration of China’s urbanization process, the local carrying capacity of water resources also changed. Generally speaking, the pressure on water resources in areas with high population densities will also be greater. Therefore, the population density and the water resource development and utilization rate are used to express the level of regional factors on WRM impacts. The final type is local water-saving technology development expressed in terms of the water-saving irrigation rate.
Table 3.
Definition of the variables of the WRM performance and influencing factors.
Therefore, in this study, the Tobit regression model shows:
Among them, WRM is the WRM performance, GDPP is GDP per capita; IDL is the level of industrial development; EM is per capita urban sewage discharge; PD1 is population density; PD2 is water resources development and utilization rate; SWRL is water-saving irrigation rate; ξit is a random disturbance; β0 is a constant, βn (n = 1, 2, … 6) are the parameters to be evaluated. To solve the dimension problem between the variables, the logarithm of each variable is taken.
5. Results and Discussion
5.1. Analysis of the Spatio-Temporal Evolution of the WRM Performance
The indicators used in this study are all selected from the above four parts of WRM. When applying the DEA model, the rationality of selecting the input–output indicators directly affects the accuracy of performance measurement results. Therefore, it is particularly important to construct a set of comprehensive and effective input–output indicators. In this study, the primary idea of quantitative evaluation of WRM performance is that the lower the resource consumption, the greater the output value and the higher the WRM performance. Under the guidance of this ideology, based on the principles of scientific, availability, and representativeness of the data, eight indicators are chosen (Table 4). In the indicator system of WRM performance evaluation: per capita water consumption reflects natural resource input; per capita urban sewage discharge reflects environmental carrying inputs; per capita total investment in place reflects government capital investment; percentage of water management personnel reflects human resource input. Unilateral water GDP output reflects the economic benefits of water use; water-saving irrigation rate reflects the agricultural benefits of water use; water consumption per 10,000 yuan of industrial added value reflects the industrial benefits of water use; water penetration rate reflects the living benefits of water use.
Table 4.
Input–output indicator system of the WRM performance.
As was discussed in Section 4.2.1, the paper takes 3 years as the window width to analyze five windows. Software DEA-Solver-Pro13.1 is used to calculate the index of the WRM performance of 93 DMUs under each window. Figure 2 show the WRM performance of 31 provinces from 2013 to 2019.
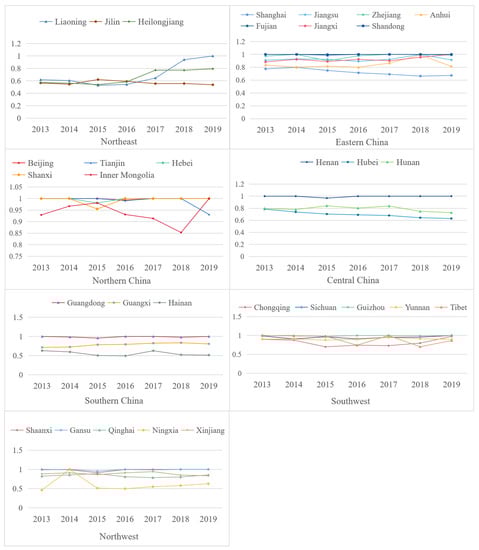
Figure 2.
WRM performance index of 31 provinces in China from 2013 to 2019 based on Window DEA model.
According to the calculation results of the DEA model, the temporal and spatial evolution of the WRM performance of China’s provincial administrative regions from 2013 to 2019 presented the following characteristics.
Firstly, the authors analyzed it diachronically. Figure 2 show that the overall WRM performance of each region generally stayed still before 2017. Except for the five provinces of Qinghai, Tibet, Hubei, Hainan and Chongqing, other regions showed an increase in 2016 and the following two years. Ningxia showed a fluctuation in 2014 and 2015. Though the WRM performance of each region fluctuated to different degrees in 2019, the overall performance showed an improvement. It is difficult to judge the optimization of the temporary and adjusting factor allocation due to the turbulence in the factor market based on one year’s data, but it is certain that China’s WRM performance is substantially close to the optimal allocation in 2019. The WRM performance of Tibet, Chongqing, and Inner Mongolia improved the most during 2018–2019, increasing greater than 25%.
Second, WRM performance was shown to be spatially different (Figure 3). The red poly-line in Figure 3 shows the national 7 year average of WRM performance. The national 7 year average of WRM performance remained above 0.8. The WRM performance of Central China was nearest to the national 7 year average performance and their trend of change was also roughly the same. In contrast, the WRM performance of the three provinces in the Northeast region showed an upward trend for seven years and greatly improved to greater than 0.5 in 2018 and 2019. However, the overall performance of the region was below the national average for WRM performance. Compared with the substantial increase in the Northeast, WRM performance in Southern China was relatively stable, fluctuating near 0.8, which is also lower than the national average performance. WRM performance in Eastern China, Northern China, and Southwest China fluctuated between 0.7 and 0.8, exceeding the national average performance, and the fluctuation trend was the same. Among them, the provinces in South China and North China are more economically developed, with better market mechanisms and relatively fierce market competition; therefore, the resource input has already shifted to an intensive type.
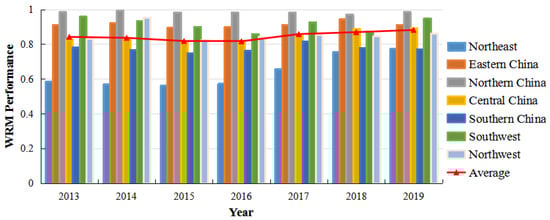
Figure 3.
Change in the WRM performance of the different regions in China.
It is worth noting that the total water resources of the five provinces in the Northwest (Shaanxi, Gansu, Qinghai, Ningxia, and Xinjiang) are low. Per capita, in 2019, the water resources of the region were only 3756 m3/person, much lower than the national average of 6487 m3/person. Moreover, the economic development performance in the Northwest was also relatively low. In 2019, the per capita GDP was 43,278 yuan, lower than the national average of 57,619 yuan. However, due to its input of a high percentage of water management personnel and per capita total investment in place, the WRM performance of the Northwest region was higher than the national average. The WRM performance of the five provinces in Northern China fluctuated near 0.9, ranking them first among the seven major regions of the country. (Figure 3)
Third, in order to distinguish the relative WRM performance of each region, the WRM performance in China was divided into four levels within the range of 0–1 according to the distribution characteristics of the calculated results of the WRM performance index. Figure 4 show the spatial distribution characteristics of WRM performance in China’s 31 provincial administrative regions from 2013 to 2019. From the perspective of individual provinces, Fujian, Beijing, Shandong, Hebei, and Henan are the areas with the top five WRM performances. Since Tianjin, Beijing, Shanghai, Henan, and Ningxia were all water-scarce regions in terms of per capita resources, the per capita water resources of these five regions were ranked as the bottom five in the country in 2019. Compared with Beijing, Tianjin, Fujian, and other regions, the per capita water resources of Tibet and Qinghai are greater than 15,000 m3, which is much higher than the national average, ranking the first and the second in the nation. Though the water resource utilization rate of Xinjiang in 2019 was only 69.4%, its utilization intensity ranked the top in the country, and its capital, labor allocation ratio, and technological development were relatively high. As a result, the WRM performance of Xinjiang is high. The WRM performance of Hainan, Jilin, Ningxia, and Heilongjiang rank the lowest in China. During the research period, the average WRM performance of the above four provincial administrative regions was less than 0.66. Water resource investments, environment, capital, labor, and other inputs in these areas all have room for improvement. The added value of water consumption and high urban sewage discharge should become a key control point for the optimal allocation of water resources and technology for those regions with poor WRM performance in the future.
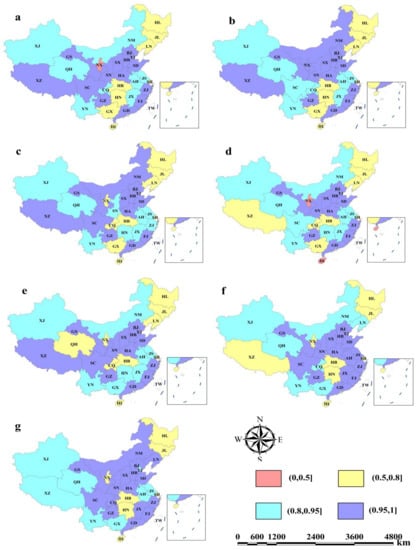
Figure 4.
Spatial distribution of the WRM performance in the 31 provinces of China from 2013 to 2019 ((a–g) represents the year 2013–2019, respectively).
5.2. Productivity Analysis Based on the Malmquist Index Model
Based on the input–output variable panel data of the 31 provincial administrative regions in China from 2013 to 2019, Software DEAP2.1 was used to calculate the Malmquist productivity index for each region. Figure 5 show the total factor productivity index and its decomposition results for different years, respectively.
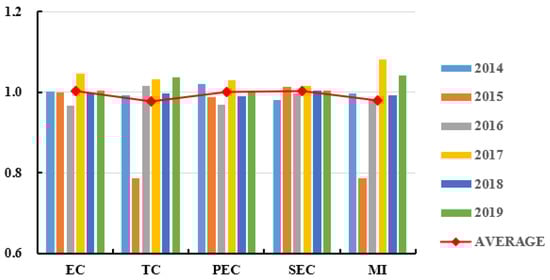
Figure 5.
Total factor productivity index and the decomposition of WRM in China. Note: EC = Comprehensive technical efficiency changes; TC = Technical progress changes; PEC = Pure technical efficiency changes; SEC = Scale efficiency changes; MI = Total factor productivity; AVERAGE = the 7 year average WRM performance and the decomposition.
Judging from the overall average WRM performance in China’s 31 provincial administrative regions during the seven years from 2013 to 2019, the total factor productivity for WRM shows a downward trend first and then an upward trend. Among them, the total factor productivity of the overall WRM in most of the 31 provincial administrative regions declined year by year before 2016, and the most obvious rate of decline was in the year 2014 and 2015. Since 2016, the total factor productivity of the overall WRM began to increase year by year. This is greatly because the Chinese government increased their control of sewage discharge and implemented strict water pollution prevention and control policies [37]. In addition, some local governments, especially those in economically developed regions, increased investment in environmental protection. Additionally, many legal terms and management rules and regulations were released during these years in China, showing that the prerequisite for economic development in various regions was not to destroy the ecological environment [77,78]. In this context, from 2017 to 2019, there were different degrees of growth in WRM. Among them, the degrees of growth in 2017 were the highest, reaching 9.9%.
From the results of EC, EC was greater than 1 in 2014, 2017, and 2019, indicating that EC had a positive effect on driving total factor productivity in these years. Among them, the EC value was the largest in 2017, reaching 1.047, and in 2017; therefore, the positive effect of EC on MI was the most obvious. The multi-year average of 1.003 for EC was greater than 1. Therefore, EC can be seen as the main reason for the increase in total factor productivity of water management over multiple years. Further decomposition of EC reveals that the multi-year average value of SEC was greater than 1. Compared with PEC, SEC contributed more to the overall total factor productivity of water resources management in 31 provinces and regions in China, indicating that China has made great progress in water resources management restructuring and management model optimization in recent years. From the results of TC, its multi-year average value of 0.977 was less than 1. Therefore, TC limited the overall improvement of total factor productivity of water resources management in the 31 provinces and regions of China. This shows that some provinces and regions need to increase their investment in scientific research regarding water resources management to promote the production frontier and effectively promote the transformation of advanced technology into productivity.
In economically developed areas, due to their technological progress, advanced management models are constantly updated, and the WRM performance is constantly improved. In relatively undeveloped areas, it is necessary to continuously optimize the WRM model, strengthen technological innovation, and promote technological progress.
5.3. Analysis of the WRM Performance Influencing Factors
The indicators of the Tobit model include explanatory variables and explained variables. This research takes the WRM performance data shown in Figure 2 as explained variables. Therefore, based on the discussion of the basis of indicator selection in Section 3.1, indicators that can reflect the factors affecting WRM performance are also selected from the four aspects (see Table 3). Table 5 show the Tobit regression results.
Table 5.
The Tobit regression results of factors affecting China’s WRM performance.
Most empirical studies show that provinces with higher levels of economic development will invest a lot of money in WRM activities [79]. However, China’s economic growth has always been manifested as extensive economic growth that produces a large number of pollutants. Rapid economic development has also led to an increase in water demand and serious water pollution [80]. In addition, restoration projects have experienced a certain lag period. Therefore, it can be seen from Table 5 that the economic scale of this study is negatively correlated with WRM performance at the level of 1%.
In terms of the industrial structure, the impact coefficient of the output value of the secondary industry, accounting for the proportion of regional GDP on WRM performance, is −0.265. In addition, an increase in the proportion from secondary industries reduced WRM performance. This is because the secondary industry is dominated by industry, and a large amount of sewage and wastewater is generated during the production process. This result demonstrates that under the current production methods and resource environment in China’s provincial administrative regions, the greater the proportion of secondary industries, the less conducive to improvements in regional WRM. Therefore, in the future, all regions need to improve their own industrial structure in accordance with local conditions. By restricting the construction of industrial enterprises that consume large amounts of water (such as traditional manufacturing industries), provinces with more developed industries, such as Jiangsu, Shandong, and Henan, can make the development of industry and commerce a priority.
The influence coefficient of per capita urban sewage discharge on China’s WRM performance is 0.045, and it passes the significance test at the 1% level. This indicates that the per capita sewage discharge has a more obvious positive effect on the WRM capacity. Aiming at protecting the environment and promoting sustainable economic and social development, the Chinese government has attached great importance to the management of urban sewage discharge in recent years. The “Water Pollution Prevention and Control Law of the People’s Republic of China” was revised and implemented twice in 2018, and the “Regulations on Urban Drainage and Sewage Treatment” was promulgated in 2013. According to China Statistical Yearbook, the sewage treatment capacity of all the provinces in China reached 90% in 2019, indicating that an improvement in the sewage treatment capacity will improve regional water resource management capabilities [56].
The influence coefficient of population density on WRM performance in China’s provincial administrative regions was negative −0.030. Generally speaking, population density has a two-way effect on environmental resource performance [56]. However, an increase in the population density in various regions of China reduced the ability of WRM. This is because the increase in population density will increase domestic water consumption. In addition, the impact has passed the 1% level of the significance test. Hence, the impact of population density on China’s WRM performance requires urgent attention.
The coefficient influence of water resources development and utilization rate on China’s WRM performance was −0.070, and it passed the 1% level of the significance test. This indicates that the degree of water resource development and utilization has largely restrained WRM performance. The spatial distribution of water resources in China is extremely uneven, and the ratio of water resources in the south to the north is approximately 4:1. Although the Chinese government has implemented cross-basin water transfer projects, such as the South-to-North Water Diversion, it has not yet fundamentally solved the problem of water scarcity in Northern and Western China. According to statistics, the utilization rate of water resources development in China has exceeded 50% over the years [39]. Among them, the utilization rate of the Haihe River and the Yellow River basins has reached more than 70%, far exceeding the internationally recognized safest water resources development level of 40% [40]. Therefore, the utilization rate of water resources in China has largely restricted improvements in regional WRM performance.
The water-saving irrigation rate can reflect the performance of regional intelligent water management capabilities [19], which was positively correlated with the performance of WRM. This may be because increasing the water-saving irrigation area was conducive to strengthening the intensive use of water resources by crop planting. However, the water-saving irrigation rate did not show a significant impact on water management capabilities. One of the reasons is that China is a largely agricultural country, and agricultural water accounts for more than half of the total water consumption. However, there is still a big gap in the level of agricultural water-saving irrigation between China and developed countries. On the other hand, the rapid development of urbanization in the short term also risks increasing the pressure on water resources. Therefore, although the water-saving irrigation rate can increase regional water resources, the impact level on resource management is limited.
Based on the panel data of 31 provincial administrative regions in China from 2013 to 2019, the following conclusions are obtained: (1) In terms of a temporal perspective, China’s overall WRM performance displayed a slow rise from 2013 to 2019. According to the calculated results, the WRM performance of Liaoning, Chongqing, Inner Mongolia, and Jiangxi improved the most during 2018–2019, with increases greater than 25%. (2) In terms of a spatial perspective, WRM performance was largely different. Sichuan, Shaanxi, Xinjiang, Inner Mongolia, and Guangxi had significantly higher WRM performance in 2015 and 2019. Furthermore, different from the traditional understanding, the areas where there was more room for WRM performance improvement were areas with abundant water resources per capita. (3) From 2013 to 2019, China’s WRM total factor productivity showed a trend of decline first and then increased. In most years, EC was the main driver of total factor productivity in WRM. TC limits the improvement of total factor productivity in WRM to some extent. Therefore, it is still necessary to continuously improve the research and development of WRM, take technological progress as the main driving force of the water resources management production front, and improve the overall WRM performance in China. (4) WRM performance is affected by multiple factors, and the degree of influence of different factors varies greatly. Using the Tobit model to analyze the selected six influencing factors, this research found that economy, industrial structure, environmental management capabilities, and regional factors had the greatest impact on WRM capabilities. Among them, economic and environmental management capabilities were negatively correlated with WRM performance.
6. Conclusions
Based on the calculation results and the above analysis, there are some suggestions that can provide a reference for WRM in China and other countries or regions adopting a regional WRM model: (1) Since limited resources will be allocated to industries that can use resources most effectively [81], the effective way to improve WRM in water-scarce areas is to strengthen the construction of factor markets and promote the construction of market mechanisms. In areas where water resource efficiency is already relatively high, a certain intensity of market supervision can ensure the continuous and efficient use of water resources. (2) Though there are abundant water resources per capita in some regions such as Tibet Province, relatively backward economic conditions and low production efficiency lead to poor WRM performance. For these areas, the principle of sustainable utilization must be upheld. In particular, the utilization efficiency of water resources and the number of WRM technical personnel must be largely improved. (3) The dependence of the total factor productivity index on technological changes was obvious, indicating that technological backwardness in most regions was the primary restricting factor for low WRM performance. Regions such as the Southwest, Central China, and Northeast should increase investment in science and technology, calling people to use water in a more scientifically sustainable manner. In addition, it was also found that changes in technical efficiency changes (EC) did not show positive growth. Therefore, optimizing the industrial structure and strengthening the management systems are the only ways to improve WRM performance. (4) Currently, China’s economic development has shifted from a stage of rapid growth to a stage of high-quality development [82,83]. Thus, the industrial structure needs to be transformed from an extensive industrial structure to an intensive one urgently. During the rapid progress of China’s urbanization, the promotion of the industrial structure, gradual improvements in independent innovation capabilities, and the optimization of the internal structure of the tertiary industry will help to realize improvements in WRM performance.
In another study on the evaluation of water resources utilization efficiency (WRUE) in China [80], the research indicates that the WRUE increased from 0.342 in 2003 to 0.876 in 2018, with an average annual growth rate of 6.451%. This efficiency varied significantly from northern to southern regions. The results of this paper showed good consistency with the results of previous research. By introducing the window DEA–Malmquist model and the Tobit model, the WRM performance of different regions under the same management model can be effectively evaluated to further promote the sharing of WRM experience in neighboring areas or areas with similar conditions. In the selection of research methods, more econometric methods, such as spatial regression analysis can be used to measure WRM performance. Not only will the application of various methods promote the interdisciplinary development of disciplines theoretically, but it can also provide guidance for the government to practically improve WRM capacity. This paper is a preliminary study on the measurement of WRM performance. Exploring the effective evaluation of WRM performance provides an opportunity for the construction of a National Modern Water Network in China and has become the focus of many studies.
Author Contributions
Conceptualization, W.L.; methodology, W.L.; software, Z.Z.; validation, L.J.; formal analysis, Z.Z. and J.W.; investigation, J.W.; resources, W.L.; data curation, J.M.; writing—original draft preparation, W.L.; writing—review and editing, Q.Z.; funding acquisition, Q.Z. All authors have read and agreed to the published version of the manuscript.
Funding
This research was funded by the National Key Research and Development Program of China (No. 2021YFC3200201) and The Natural Sciences Foundation of China (No. U1803241).
Institutional Review Board Statement
Not applicable.
Informed Consent Statement
Not applicable.
Data Availability Statement
Some or all data, models, or code that support the findings of this study are available from the corresponding author upon reasonable request.
Conflicts of Interest
The authors declare no conflict of interest regarding the publication of this paper.
References
- Akhoundi, A.; Nazif, S. Sustainability assessment of wastewater reuse alternatives using the evidential reasoning approach. J. Clean. Prod. 2018, 195, 1350–1376. [Google Scholar] [CrossRef]
- Kanakoudis, V.; Tsitsifli, S.; Papadopoulou, A.; Curk, B.C.; Karleusa, B. Estimating the water resources vulnerability index in the Adriatic sea region. Procedia Eng. 2016, 162, 476–485. [Google Scholar] [CrossRef] [Green Version]
- Kanakoudis, V.; Tsitsifli, S.; Papadopoulou, A.; Curk, B.C.; Karleusa, B. Water resources vulnerability assessment in the Adriatic Sea region: The case of Corfu Island. Environ. Sci. Pollut. Res. 2017, 24, 20173–20186. [Google Scholar] [CrossRef] [PubMed]
- Kanakoudis, V.; Tsitsifli, S.; Papadopoulou, A.; Curk, B.C.; Karleusa, B.; Matic, B.; Altran, E.; Banovec, P. Policy recommendation for drinking water supply cross-border networking in the Adriatic region. J. Water Supply Res. Technol. 2017, 66, 489–508. [Google Scholar] [CrossRef]
- Motlaghzadeh, K.; Kerachian, R.; Tavvafi, A. An evidential reasoning-based leader-follower game for hierarchical multi-agent decision making under uncertainty. J. Hydrol. 2020, 591, 125294. [Google Scholar] [CrossRef]
- Zarrineh, N.; Abbaspour, K.C.; Van Griensven, A.; Jeangros, B.; Holzkämper, A. Model-based evaluation of land management strategies with regard to multiple ecosystem services. Sustainability 2018, 10, 3844. [Google Scholar] [CrossRef] [Green Version]
- Alavijeh, N.K.; Falahi, M.A.; Shadmehri, M.T.A.; Salehnia, N.; Larsen, M.A.D.; Drews, M. Perspectives of current and future urban water security in Iran. J. Clean. Prod. 2021, 321, 129004. [Google Scholar] [CrossRef]
- Moghadam, S.H.; Ashofteh, P.-S.; Loáiciga, H.A. Application of climate projections and Monte Carlo approach for assessment of future river flow: Khorramabad River Basin, Iran. J. Hydrol. Eng. 2019, 24, 05019014. [Google Scholar] [CrossRef]
- Li, W.; Zuo, Q.; Li, D.L.; Han, C.H.; Ma, J.X. Comparison of water resources management system of the nations in “belt and road” main water resources area. Water Resour. Power 2020, 38, 49–53. (In Chinese) [Google Scholar]
- Mohammed, R.; Scholz, M. Modeling the internal processes of farmers’ water conflicts in arid and semi-arid regions: Extending the theory of planned behavior. J. Hydrol. 2020, 580, 124241. [Google Scholar] [CrossRef]
- Al-Kalbani, M.S.; Price, M.F.; O’Higgins, T.; Ahmed, M.; Abahussain, A. Integrated environmental assessment to explore water resources management in Al Jabal Al Akhdar, Sultanate of Oman. Reg. Environ. Chang. 2016, 16, 1345–1361. [Google Scholar] [CrossRef]
- Pires, A.; Morato, J.; Peixoto, H.; Botero, V.; Zuluaga, L.; Figueroa, A. Sustainability assessment of indicators for integrated water resources management. Sci. Total Environ. 2017, 578, 139–147. [Google Scholar] [CrossRef]
- Ngene, B.U.; Nwafor, C.; Bamigboye, G.; Ogbiye, A.; Ogundare, J.; Akpan, V. Assessment of water resources development and exploitation in Nigeria: A review of integrated water resources management approach. Heliyon 2021, 7, e05955. [Google Scholar] [CrossRef]
- Godinez-Madrigal, J.; Cauwenbergh, N.; Zaag, P. Production of competing water knowledge in the face of water crises: Revisiting the IWRM success story of the Lerma-Chapala Basin, Mexico. Geoforum 2019, 103, 3–15. [Google Scholar] [CrossRef]
- Tantoh, H.B.; McKay, T.M. Assessing community-based water management and governance systems in North-West Cameroon using a cultural theory and systems approach. J. Clean. Prod. 2021, 290, 125804. [Google Scholar] [CrossRef]
- Carolyn, J.; VanNijnatten, D. Using indicators to assess transboundary water governance in the Great Lakes and Rio Grande-Bravo regions. Environ. Sustain. Indic. 2021, 10, 100102. [Google Scholar] [CrossRef]
- Al-Jawad, J.Y.; Alsaffar, H.M.; Bertram, D.; Kalin, R.M. A comprehensive optimum integrated water resources management approach for multidisciplinary water resources management problems. J. Environ. Manag. 2019, 239, 211–224. [Google Scholar] [CrossRef]
- Vergara-Fernandez, L.; Aguayo, M.; Moran, L.; Obreque, C. A MILP-based operational decision-making methodology for demand-side management applied to desalinated water supply systems supported by a solar photovoltaic plant: A case study in agricultural industry. J Clean. Prod. 2022, 334, 130123. [Google Scholar] [CrossRef]
- Directives 2000/60/EC of the European Parliament and of the Council of 23 October 2000 Establishing a Framework for Community Action in the Field of Water Policy. Available online: https://www.wipo.int/news/en/wipolex/2019/article_0008.html (accessed on 17 January 2022).
- Behboudian, M.; Kerachian, R. Evaluating the resilience of water resources management scenarios using the evidential reasoning approach: The Zarrinehrud river basin experience. J. Environ. Manag. 2021, 284, 112025. [Google Scholar] [CrossRef]
- Seifert-Dähnn, I.; Furuseth, I.S.; Vondolia, G.K. Costs and benefits of automated high-frequency environmental monitoring—The case of lake water management. J. Environ. Manag. 2021, 285, 112108. [Google Scholar] [CrossRef]
- Chen, X.; Chen, Y.; Shimizu, T.; Niu, J.; Nakagami, K.; Qian, X.; Jia, B.; Nakajima, J.; Han, J.; Li, J. Water resources management in the urban agglomeration of the Lake Biwa region, Japan: An ecosystem services-based sustainability assessment. Sci. Total Environ. 2017, 586, 174–187. [Google Scholar] [CrossRef]
- Bertule, M.; Glennie, P.; Koefoed Bjørnsen, P.; James Lloyd, G.; Kjellen, M.; Dalton, J.; Rieu-Clarke, A.; Romano, O.; Tropp, H.; Newton, J.; et al. Monitoring water resources governance progress globally: Experiences from monitoring SDG indicator 6.5.1 on integrated water resources management implementation. Water 2018, 10, 1744. [Google Scholar] [CrossRef] [Green Version]
- Zhang, Y.; Li, X.; Šimůnek, J.; Shi, H.; Chen, N.; Hu, Q.; Tian, T. Evaluating soil salt dynamics in a field drip-irrigated with brackish water and leached with freshwater during different crop growth stages. Agric. Water Manag. 2021, 244, 106601. [Google Scholar] [CrossRef]
- Naderi, M.M.; Mirchi, A.; Bavani, A.R.M.; Goharian, E.; Madani, K. System dynamics simulation of regional water supply and demand using a food-energy-water nexus approach: Application to Qazvin Plain, Iran. J. Environ. Manag. 2021, 280, 111843. [Google Scholar] [CrossRef]
- Sušnik, J.; Masia, S.; Indriksone, D.; Brēmere, I.; Vamvakeridou-Lydroudia, L. System dynamics modelling to explore the impacts of policies on the water-energy-food-land-climate nexus in Latvia. Sci. Total Environ. 2021, 775, 145827. [Google Scholar] [CrossRef]
- McAvoy, S.; Grant, T.; Smith, C.; Bontinck, P. Combining life cycle assessment and system dynamics to improve impact assessment: A systematic review. J. Clean. Prod. 2021, 315, 128060. [Google Scholar] [CrossRef]
- Bakhshianlamouki, E.; Masia, S.; Karimi, P.; Zaag, P.; Sušnik, J. A system dynamics model to quantify the impacts of restoration measures on the water-energy-food nexus in the Urmia Lake Basin, Iran. Sci. Total Environ. 2020, 708, 134874. [Google Scholar] [CrossRef]
- Thuc, D.; Edoardo, B.; Rodney, A.S. Critical review of system dynamics modelling applications for water resources planning and management. Clean. Environ. Syst. 2021, 2, 100031. [Google Scholar] [CrossRef]
- Campitelli, A.; Schebek, L. How is the performance of waste management systems assessed globally? A systematic review. J. Clean. Prod. 2020, 272, 122986. [Google Scholar] [CrossRef]
- Martín-Gamboa, M.; Iribarren, D.; García-Gusano, D.; Dufour, J. A review of life-cycle approaches coupled with data envelopment analysis within multi-criteria decision analysis for sustainability assessment of energy systems. J. Clean. Prod. 2017, 150, 164–174. [Google Scholar] [CrossRef]
- Liu, Y.; Zhuo, L.; Varis, O.; Fang, K.; Liu, G.; Wu, P. Enhancing water and land efficiency in agricultural production and trade between Central Asia and China. Sci. Total Environ. 2021, 780, 146584. [Google Scholar] [CrossRef] [PubMed]
- Mahdiloo, M.; Lim, S.; Duong, T.; Harvie, C. Some comments on improving discriminating power in data envelopment models based on deviation variables framework. Eur. J. Oper. Res. 2021, 295, 394–397. [Google Scholar] [CrossRef]
- Zhang, Y.; Lu, X.; Liu, B. Spatial relationships between ecosystem services and socioecological drivers across a large-scale region: A case study in the Yellow River Basin. Sci. Total Environ. 2021, 766, 142480. [Google Scholar] [CrossRef] [PubMed]
- Witte, K.; Marques, R. Designing performance incentives, an international benchmark study in the water sector. Cent. Eur. J. Oper. Res. 2010, 18, 189–220. [Google Scholar] [CrossRef] [Green Version]
- Omrani, H.; Alizadeh, A.; Emrouznejad, A.; Teplova, T. A robust credibility DEA model with fuzzy perturbation degree: An application to hospitals performance. Expert Syst. Appl. 2022, 189, 116021. [Google Scholar] [CrossRef]
- Rodrigues, L.; Santos, M.; Rocha Junior, C. Application of DEA and group analysis using K-means; compliance in the context of the performance evaluation of school networks. Procedia Comput. Sci. 2022, 199, 687–696. [Google Scholar] [CrossRef]
- Chen, Y.; Ma, X.; Yan, P.; Wang, M. Operating efficiency in Chinese universities: An extended two-stage network DEA approach. J. Manag. Sci. Eng. 2021. Available online: https://www.sciencedirect.com/science/article/pii/S209623202100055X?via%3Dihub (accessed on 17 January 2022). [CrossRef]
- Singh, G.; Singh, P.; Sodhi, G.; Tiwari, D. Energy auditing and data envelopment analysis (DEA) based optimization for increased energy use efficiency in wheat cultivation (Triticum aestium L.) in north-western India. Sustain. Energy Technol. Assess. 2021, 47, 101453. [Google Scholar] [CrossRef]
- Michali, M.; Emrouznejad, A.; Dehnokhalaji, A.; Clegg, B. Noise-pollution efficiency analysis of European railways: A network DEA model. Transp. Res. D Transp. Environ. 2021, 98, 102980. [Google Scholar] [CrossRef]
- Aytekin, A.; Ecer, F.; Korucuk, S.; Karamaşa, C. Global innovation efficiency assessment of EU member and candidate countries via DEA-EATWIOS multi-criteria methodology. Technol. Soc. 2022, 68, 101896. [Google Scholar] [CrossRef]
- Charnes, A.; Clark, C.; Cooper, W. A developmental study of data envelopment analysis in measuring the efficiency of maintenance units in the U.S. air forces. Ann. Oper. Res. 1985, 2, 95–112. [Google Scholar] [CrossRef]
- Halkos, G.; Polemis, M. The impact of economic growth on environmental efficiency of the electricity sector: A hybrid window DEA methodology for the USA. J. Environ. Manag. 2018, 211, 334–346. [Google Scholar] [CrossRef]
- Vlontzos, G.; Pardalos, P.M. Assess and prognosticate green house gas emissions from agricultural production of EU countries, by implementing, DEA Window analysis and artificial neural networks. Renew. Sustian. Energy Rev. 2017, 76, 155–162. [Google Scholar] [CrossRef]
- Sefeedpari, P.; Shokoohi, Z.; Pishgar-Komleha, S. Dynamic energy efficiency assessment of dairy farming system in Iran: Application of window data envelopment analysis. J. Clean. Prod. 2020, 275, 124178. [Google Scholar] [CrossRef]
- Storto, C. Measuring the efficiency of the urban integrated water service by parallel network DEA: The case of Italy. J. Clean. Prod. 2020, 276, 123170. [Google Scholar] [CrossRef]
- Wei, J.; Lei, Y.; Yao, H.; Ge, J.; Wu, S.; Liu, L. Estimation and influencing factors of agricultural water efficiency in the Yellow River basin, China. J. Clean. Prod. 2021, 308, 127249. [Google Scholar] [CrossRef]
- Grassauer, F.; Herndl, M.; Nemecek, T.; Guggenberger, T.; Fritz, C.; Steinwidder, A.; Zollitsch, W. Eco-efficiency of farms considering multiple functions of agriculture: Concept and results from Austrian farms. J. Clean. Prod. 2021, 297, 126662. [Google Scholar] [CrossRef]
- Xie, Q.; Xu, Q.; Rao, K.; Dai, Q. Water pollutant discharge permit allocation based on DEA and non-cooperative game theory. J. Environ. Manag. 2022, 302, 113962. [Google Scholar] [CrossRef]
- Liu, K.; Yang, G.; Yang, D. Investigating industrial water-use efficiency in mainland China: An improved SBM-DEA model. J. Environ. Manag. 2020, 270, 110859. [Google Scholar] [CrossRef]
- Gidion, D.; Hong, J.; Adams, M.; Khoveyni, M. Network DEA models for assessing urban water utility efficiency. Util. Policy 2019, 57, 48–58. [Google Scholar] [CrossRef]
- Liu, Y.; Qu, Y.; Cang, Y.; Ding, X. Ecological security assessment for megacities in the Yangtze River basin: Applying improved emergy-ecological footprint and DEA-SBM model. Ecol. Indic. 2022, 134, 108481. [Google Scholar] [CrossRef]
- Chen, N.; Xu, L.; Chen, Z. Environmental efficiency analysis of the Yangtze River economic zone using super efficiency data envelopment analysis (SEDEA) and tobit models. Energy 2017, 134, 659–671. [Google Scholar] [CrossRef]
- An, T.; Wang, L.; Gao, X.; Han, X.; Zhao, Y.; Lin, L.; Wu, P. Simulation of the virtual water flow pattern associated with interprovincial grain trade and its impact on water resources stress in China. J. Clean. Prod. 2021, 288, 12567. [Google Scholar] [CrossRef]
- Dou, M.; Wang, Y. The construction of a water rights system in China that is suited to the strictest water resources management system. Water Sci. Technol. Water Supply 2017, 17, 238–245. [Google Scholar] [CrossRef]
- National Bureau of Statistics of the People’s Republic of China. China Statistical Yearbook; China Statistics Press: Beijing, China, 2013–2019. Available online: http://www.stats.gov.cn/tjgz/ (accessed on 17 January 2022). (In Chinese)
- China Water Resources Bulletin; Water Resources and Hydropower Publishing House: Beijing, China, 2013–2019. Available online: http://www.gov.cn/xinwen/2021-07/13/content_5624515.htm (accessed on 17 January 2022). (In Chinese)
- China Environment Yearbook; National Bureau of Statistics: Beijing, China, 2013–2019. Available online: http://www.stats.gov.cn/ztjc/ztsj/hjtjzl/ (accessed on 17 January 2022). (In Chinese)
- Navarro-Ramírez, V.; Ramírez-Hernandez, J.; Gil-Samaniego, M.; Rodríguez-Burgueño, J.E. Methodological frameworks to assess sustainable water resources management in industry: A review. Ecol. Indic. 2020, 119, 106819. [Google Scholar] [CrossRef]
- Bob, H. Science-driven integrated River Basin manegement. In Interdisciplinary Science Reviews; Oxford University Press: Cambridge, UK, 2007; Volume 32. [Google Scholar]
- Zuo, Q.; Li, W.; Zhao, H.; Ma, J.; Han, C.; Luo, Z. A harmony-based approach for assessing and regulating human-water relationships: A case study of Henan province in China. Water 2021, 13, 32. [Google Scholar] [CrossRef]
- Wang, M.; Huang, Y.; Li, D. Assessing the performance of industrial water resource utilization systems in China based on a two-stage DEA approach with game cross efficiency. J. Clean. Prod. 2021, 312, 127722. [Google Scholar] [CrossRef]
- Khodadadipour, M.; Hadi-Vencheh, A.; Behzadi, M.H.; Rostamy-malkhalifeh, M. Undesirable factors in stochastic DEA cross-efficiency evaluation: An application to thermal power plant energy efficiency. Econ. Anal. Policy 2021, 69, 613–628. [Google Scholar] [CrossRef]
- Haynes, K.E.; Dinc, M. Data envelopment analysis (DEA). Encycl. Soc. Meas. 2005, 609–616. [Google Scholar] [CrossRef]
- Halkos, G.E.; Tzeremes, N.G. Exploring the existence of Kuznets curve in countries’ environmental efficiency using window DEA. Ecol. Econ. 2009, 68, 2168–2176. [Google Scholar] [CrossRef]
- Malmquist, S. Index numbers and indifference surfaces. Trab. Estad. 1953, 4, 209–242. [Google Scholar] [CrossRef]
- Caves, D.; Christensen, L.R.; Diewert, W.E. Multilateral comparisons of output, input, and productivity using superlative index numbers. Econ. J. 1982, 92, 73–86. Available online: https://www.scienceopen.com/document?vid=407c025a-78cb-4e87-8870-4a0341686bf9 (accessed on 17 January 2022). [CrossRef]
- Fare, R.; Grosskopf, S.; Norris, M. Productivity growth, technical progress, and efficiency change in industrialized countries. Am. Econ. Rev. 1994, 84, 66–83. Available online: https://www.researchgate.net/publication/284045088_Productivity_Growth (accessed on 17 January 2022).
- Tobin, J. Estimation of relationships for limited dependent variables. Econom. J. Econom. Soc. 1958, 31, 24–36. [Google Scholar] [CrossRef] [Green Version]
- Zhang, M.; Sun, X.; Wang, W. Study on the effect of environmental regulations and industrial structure on haze pollution in China from the dual perspective of independence and linkage. J. Clean. Prod. 2020, 256, 120748. [Google Scholar] [CrossRef]
- Sivagurunathan, V.; Elsawah, S.; Khan, S. Scenarios for urban water management futures: A systematic review. Water Res. 2022, 211, 118079. [Google Scholar] [CrossRef]
- Bar-Nahum, Z.; Reznik, A.; Finkelshtain, I.; Kan, I. Centralized water management under lobbying: Economic analysis of desalination in Israel. Ecol. Econ. 2022, 193, 107320. [Google Scholar] [CrossRef]
- Ramírez-Agudelo, N.; Pablo, J.; Roca, E. Exploring alternative practices in urban water management through the lens of circular economy—A case study in the Barcelona metropolitan area. J. Clean. Prod. 2021, 329, 129565. [Google Scholar] [CrossRef]
- Zoli, M.; Paleari, L.; Confalonieri, R.; Bacenetti, J. Setting-up of different water managements as mitigation strategy of the environmental impact of paddy rice. Sci. Total Environ. 2021, 799, 149365. [Google Scholar] [CrossRef]
- Lv, T.; Wang, L.; Xie, H.; Zhang, X.; Zhang, Y. Evolutionary overview of water resource management (1990–2019) based on a bibliometric analysis in Web of Science. Ecol. Inform. 2021, 61, 101218. [Google Scholar] [CrossRef]
- Ahmed, S.; Bali, R.; Khan, H.; Mohamed, H.; Sharma, S. Improved water resource management framework for water sustainability and security. Environ. Res. 2021, 201, 111527. [Google Scholar] [CrossRef]
- State Council of China. The Most Stringent Water Management System. 2012. Available online: http://www.gov.cn/zhuanti/2015-06/13/content_2878992.htm (accessed on 17 January 2022). (In Chinese)
- State Council of China. Proposal of the Central Committee of the Communist Party of China on Formulating the Thirteenth Five-Year Plan for National Economic and Social Development; China Planning Press: Beijing, China, 2015; Available online: http://www.xinhuanet.com/politics/2016lh/2016-03/17/c_1118366322.htm (accessed on 17 January 2022).
- Baraldi, L.G.; Steele, E.M.; Louzada, M.L.; Monteiro, C.A. Associations between ultraprocessed food consumption and total water intake in the US population. J. Acad. Nutr. Diet. 2021, 121, 1695–1703. [Google Scholar] [CrossRef]
- Deng, J.; Li, C.; Wang, L.; Yu, S.; Zhang, X.; Wang, Z. The impact of water scarcity on Chinese inter-provincial virtual water trade. Sustain. Prod. Consum. 2021, 28, 1699–1707. [Google Scholar] [CrossRef]
- Wang, R.; Wang, Q.; Yao, S. Evaluation and difference analysis of regional energy efficiency in China under the carbon neutrality targets: Insights from DEA and Theil models. J. Environ. Manag. 2021, 293, 112958. [Google Scholar] [CrossRef]
- Nassani, A.; Aldakhil, M.; Zaman, K. Ecological footprints jeopardy for mineral resource extraction: Efficient use of energy, financial development and insurance services to conserve natural resources. Resour. Policy 2021, 74, 102271. [Google Scholar] [CrossRef]
- Chang, I.; Zhao, M.; Chen, Y.; Guo, X.; Zhu, Y.; Wu, J.; Yuan, T. Evaluation on the integrated water resources management in China’s major cities—Based on city blueprint® approach. J. Clean. Prod. 2021, 262, 121410. [Google Scholar] [CrossRef]
Publisher’s Note: MDPI stays neutral with regard to jurisdictional claims in published maps and institutional affiliations. |
© 2022 by the authors. Licensee MDPI, Basel, Switzerland. This article is an open access article distributed under the terms and conditions of the Creative Commons Attribution (CC BY) license (https://creativecommons.org/licenses/by/4.0/).