Article

Hydrogeochemical Characteristic of Geothermal Water and Precursory Anomalies along the Xianshuihe Fault Zone, Southwestern China

1
United Laboratory of High-Pressure Physics and Earthquake Science, Key Laboratory of Earthquake Prediction, Institute of Earthquake Forecasting, CEA, Beijing 100036, China
2
Earthquake Administration of Fujian Province, Fuzhou 350003, China
3
School of Water Resources and Environment, China University of Geosciences, Beijing 100083, China
*
Authors to whom correspondence should be addressed.
Water 2022, 14(4), 550; https://doi.org/10.3390/w14040550
Submission received: 6 January 2022 / Revised: 6 February 2022 / Accepted: 9 February 2022 / Published: 12 February 2022
(This article belongs to the Section Hydrology)

Abstract

:
Hydrogeochemical changes in association with earthquakes are considered as a potential means of identifying earthquake precursors. The Xianshuihe fault zone (XSHF) is considered one of the most active seismic fault zones in China; 43 hot springs were sampled and analysed in the laboratory for major elements, silica, stable isotopes (δD and δ18O) and strontium isotopes were investigated from 2008 to 2021. The meteoric water acted as the primary water source of the hot spring in the XSHF, and recharged elevations ranged from 1.9 to 4.8 km. The geothermometers method was used to estimate the region of thermal storage temperature and its temperature between 8 and 142 °C. And the circulation depth ranged from 0.1 to 6.9 km. Most of the hot spring water was immature water with a weak degree of water-rock reaction. However, the degree of water-rock reaction and the depth of hot spring water circulation were high in part of the Kangding and Daufu segments, which also had the highest reservoir temperature and the most frequent strong earthquakes. Temporal variations of hydrogeochemical showed that Na+, Cl and SO42− decreased obviously following the 12 May 2008 Wenchuan Ms8.0 and existed abnormal value fluctuations from the 20 April 2013 Lushan Ms7.0 to 22 November 2014 Kangding Ms6.3 occurred and after 20 July 2017 returned to the normal levels. And the ion concentrations in hot springs increased by 5% to 35% three months before 22 November 2014 Kangding Ms6.3 with the obvious precursor anomaly. Hydrogeochemical anomalies could be useful for predicting an earthquake in the study area.

1. Introduction

Since the 1960s, there have been extensive reports of changes in groundwater chemistry before and after the earthquake [1,2], including the changes in concentrations of Na, Si and Ca, radon count rates and stable isotope ratios [3,4,5,6]. The precursor changes reported from the literature range from 1 day to 6 months and from 5 to 400 km over time and length scales, respectively [7,8,9,10]. Tsunogai and Wakita (1995) [11] found obvious changes in groundwater flow and ion concentrations (Cl and SO42−) changes were observed at the two monitoring stations around the Kobe earthquake. Skelton et al. (2019) [9] predicted earthquake-related hydrochemical changes before and after earthquakes based on long-term groundwater chemistry (Na+ and Ca2+) and isotopic data (δD and δ18O). Based on a large-scale stable isotope dataset, Hosono et al. (2020) [12] showed improved permeability after the 2016 Mw7.0 Kumamoto earthquake.
The XSHF is one of the primary left-lateral strike-slip faults originating from Tibet. It crosses the entire lithosphere and cut into the upper mantle [13]. As one of the most dynamic faults in the world. It is similar to the San Andreas fault, where at least 10 earthquakes with a magnitude greater than 7 have occurred along 350 km segments of the XSHF [14]. Chen et al. (2014) [15] studied the changes of dissolved ion concentrations in hot springs in western Sichuan during the 12 May 2008 Wenchuan Ms8.0 earthquake and 20 April 2013 Lushan Ms7.0 earthquake. Li et al. (2019) [16] showed significant changes in water chemistry in the Erdaoqiao (EDQ), Longtougou (LTG) and Guanding (GD) hot springs in the Kangding geothermal area during the 2008 Ms8.0 Wenchuan earthquake, 2013 Ms7.0 Lushan earthquake and 2014 Ms6.4 Kangding earthquake. Zhang et al. (2021) [17] researched the temporal variations in stable isotope ratios at the EDQ, LTG and GD hot springs in the Kangding geothermal area experienced obvious changes before and after the 2019 Ms6.0 Changning earthquake. Previous studies have mostly focused on the Kangding region, and systematic comparative studies on the distribution of other regions on the XSHF are still lacking.
This paper aims to analyse the elemental composition and isotopic characteristics of thermal springs distributed in the XSHF. We analysed physicochemical parameters of groundwater, such as the temperature, flow rate, dissolved hydrogen, oxygen and ion concentrations which may capture seismic anomalies before and after to explore the relationship between changes in the hydrogeochemical characteristic along the XSHF in southwestern China. It is critical for identifying earthquake precursors and learning about water-rock interactions in fault zones.

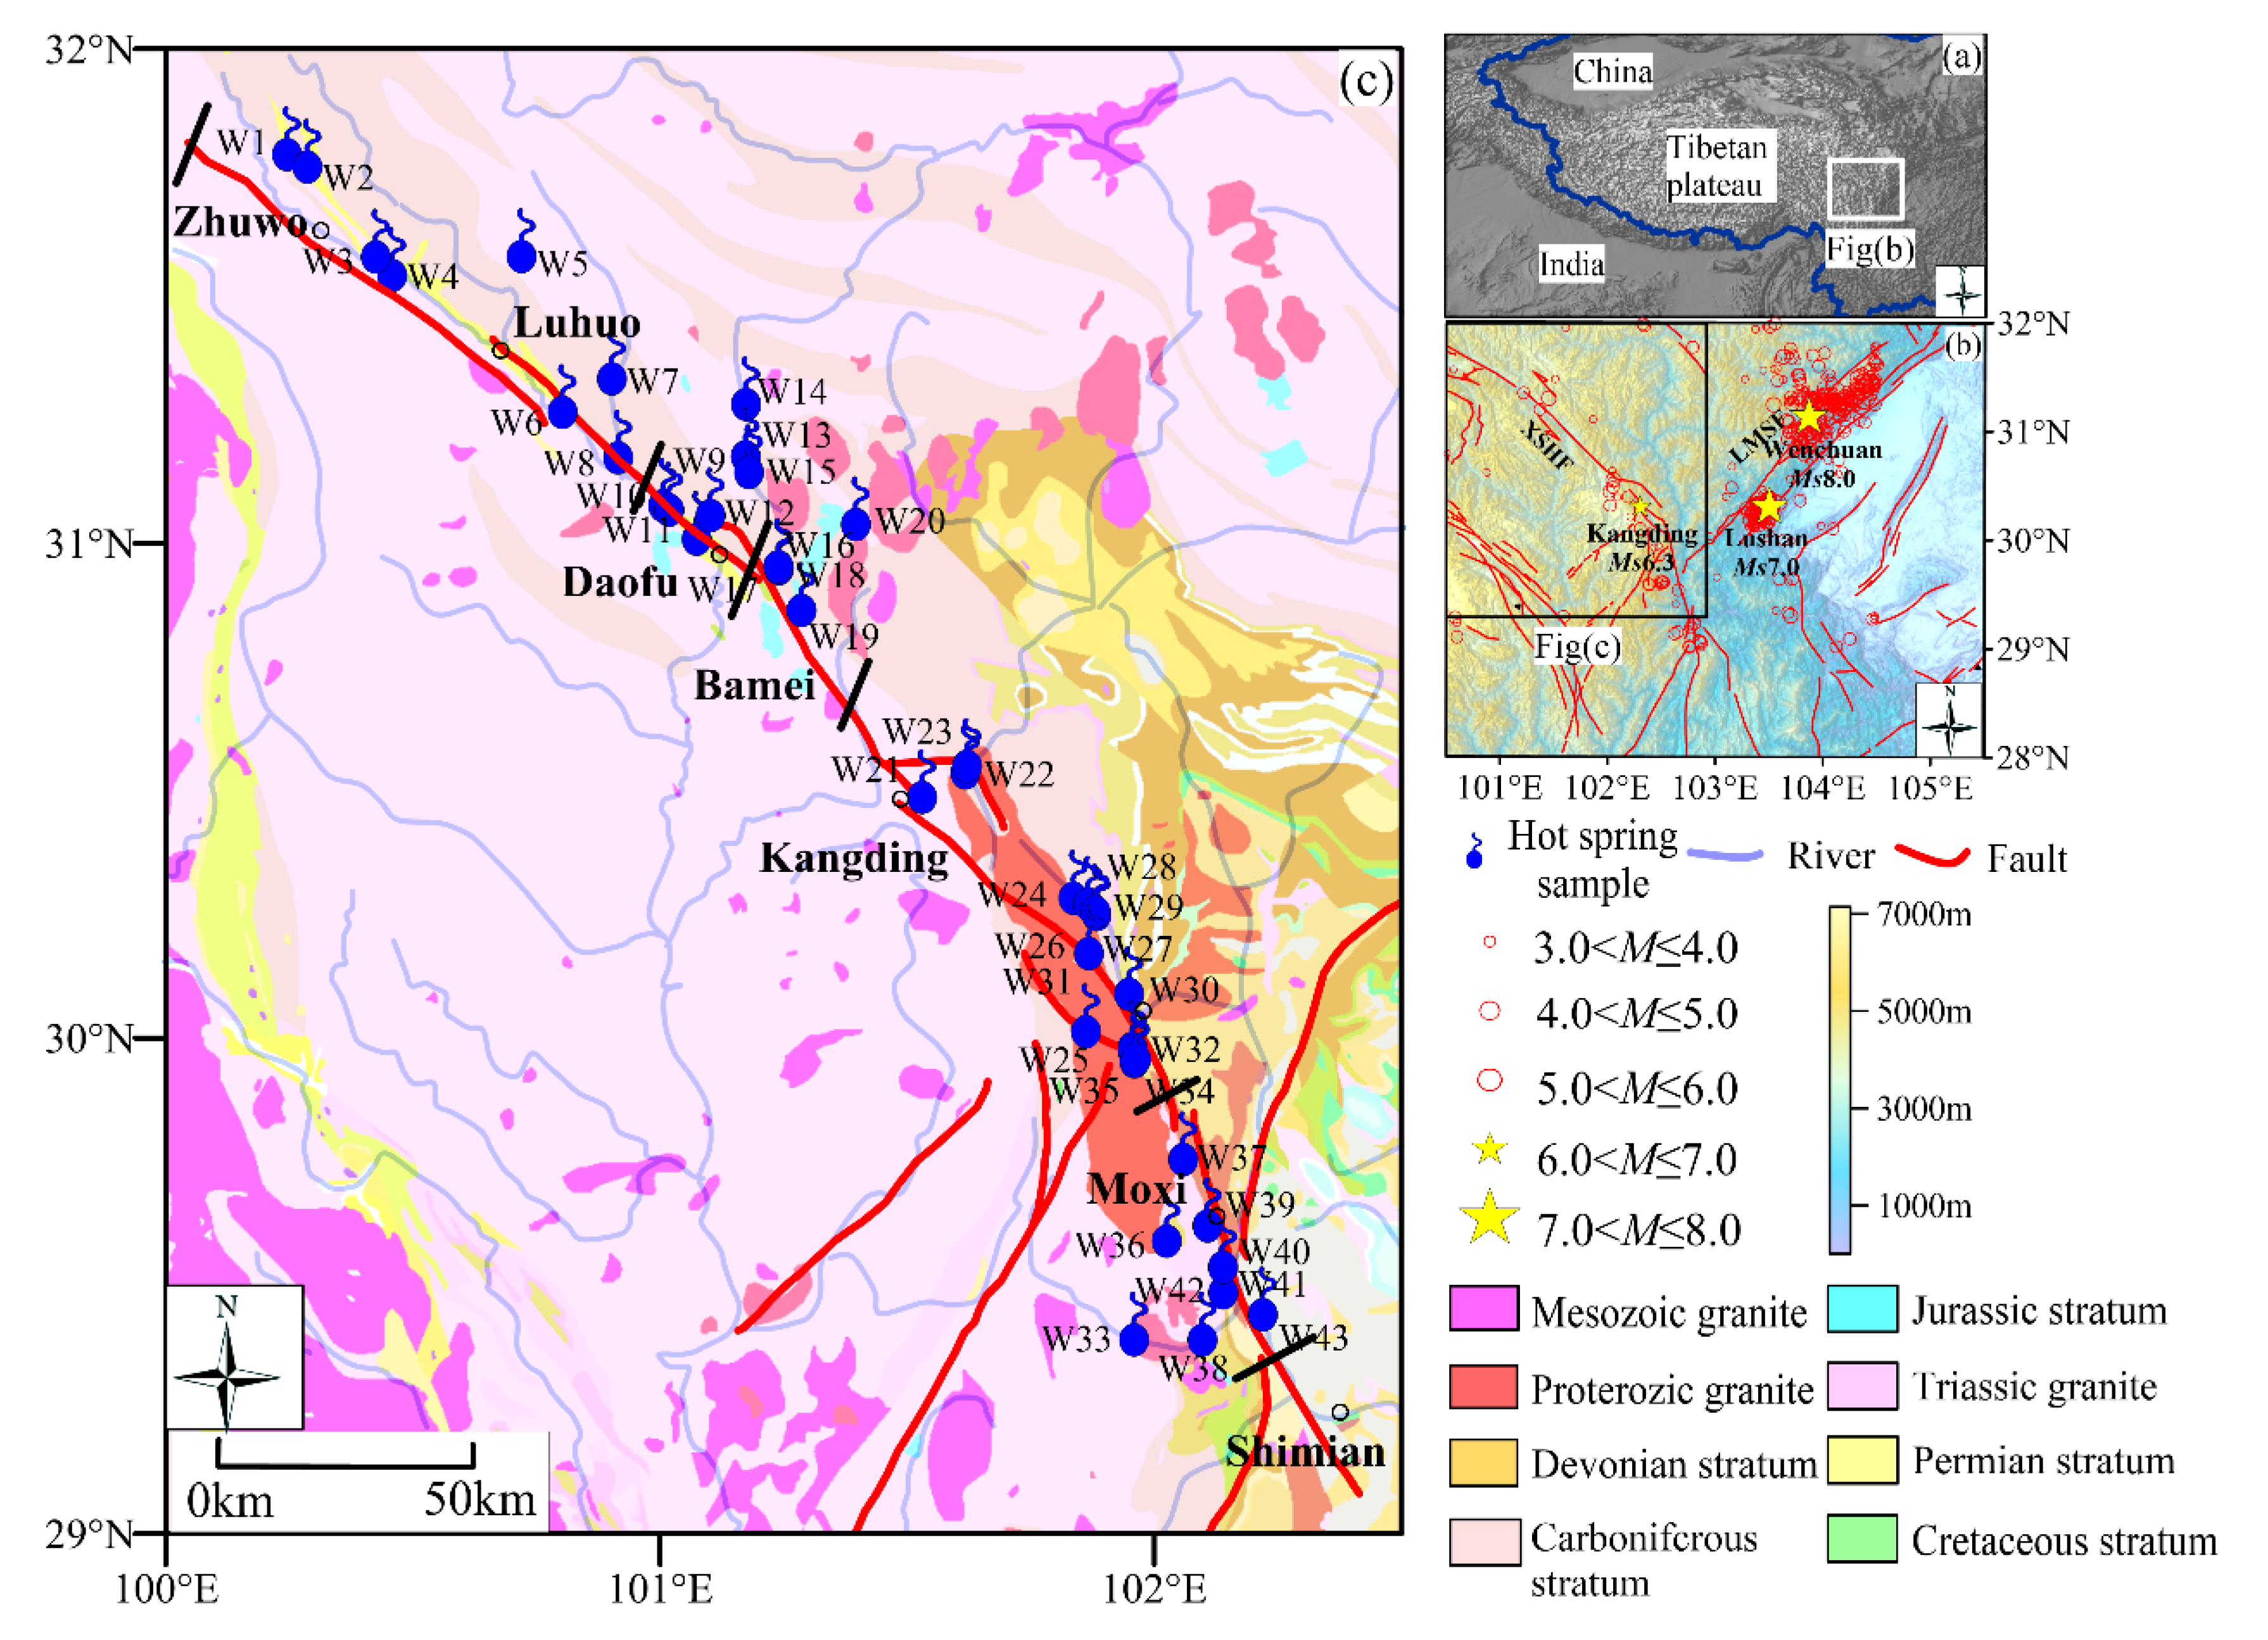
2. Geological Setting

Due to the continuing clash between the Eurasian and Indian plates, the Tibetan Plateau squeezed southeastward and was blocked by the Sichuan Basin and the South China Block [18,19]. An active fault belt was formed with near-N-S oriented strike-slip features, comprising the XSHF, Anninghe fault zone (ANHF), Zemuhe fault zone (ZMHF) and Xiaojiang fault zone (XJF) from north to south (1) [20]. The XSHF is the most active fault in the left-slip fault zone on the eastern edge of the Qinghai-Tibet Plateau [21]. The activation of the XSHF began in the Early Permian, and during the Permian-Late Triassic, a large number of mixed rock systems, large-scale basal magmatic overflows, and deep-sea tensional rift deposits represented by radiolarian siliciclastic rocks developed within the fault zone, marking the formation of the initial oceanic crust [22]. The XFZ is composed of northwestern, middle and southeastern segments. The northwestern segment includes the Luhuo, Daofu and Bamei faults. The middle segment consists of the Yalahe, Zheduotang and Selaha faults which are called the Kangding section here. The southeastern segment contains the Moxi faults [23]. The slip rate of the Zhuwo, Luhuo, Daofu, Bami, Yalahe, Selaha, Zheduotang and Moxi segments were about 4 mm·a-1, 13 mm·a-1, 13 mm·a-1, 12 mm·a-1, 4.0 mm·a-1, 7.0 mm·a-1, 6.5 mm·a-1 and 9.5 mm·a-1, respectively [14]. The geographical of the XSHF were high mountains with low valleys. The elevations of the XSHF ranged from 3000 to 7556 m [16].
The regional stratigraphy mainly includes Triassic rocks consisting of deformed metamorphic feldspathic quartz sandstone, tuffaceous sandstone, siltstone and mudstone on both sides of the Chuanxi Depression, and Precambrian and Paleozoic rocks consisting of shallow metamorphic sandstone, slate, limestone lenses, limestone and metamorphic quartz sandstone on the east side of the rift zone. The XSHF is widely distributed with late Mesozoic—Cenozoic granite and diorite intrusions [24]. A larger number of geothermal springs has been investigated in the middle and southeastern segments of the XSHF, the sources of which include the deep magma heat, radioactive heat from granitoids and strike-slip frictional heat [25].
Numerous earthquakes, including the 2008 Wenchuan Ms8.0 earthquake, the 2013 Lushang Ms7.0 earthquake and the 2014 Ms6.4 Kangding earthquake, have occurred in the Longmenshan Fault Zone near the XSHF (Figure 1) [14]. The Wenchuan Ms8.0 earthquake occurred on 12 May 2008 in Wenchuan, Sichuan Province. It has caused a 285 km surface rupture belt which includes the Yingxiu–Beichuan, Guanxian–Anxian and Qingchuan faults, with a vertical offset of up to 6.2 m from the surface. The Lushan earthquake occurred ~85 km southwest of the Wenchuan earthquake on 20 April 2013, with a rupture length of approximately 66.5 km along the strike of the Longmenshan Fault Zone [26]. These two large earthquakes caused significant hydrochemical variation of thermal springs in this study area [16].

3. Sampling and Methods

The groundwater samples were obtained from 43 springs along the XSHF fault in June 2008, June 2009, June 2010, April 2013, August 2014, June 2015, January 2016, February 2017, March 2018 and April 2019, respectively (Figure 1, Table 1, Table 2 and Supplementary Table S1). Geochemical analysis of hot water sampled every 3 days taken from five of these springs during 2019 and 2021, but some of these data from 2008 to 2013 are based on other scholars (Chen and Zhang) [15,17] in the study area.
At each site, four samples were collected after filtration through a 0.45 μm membrane to analyse the water samples for major element concentrations, the isotopes of hydrogen and oxygen, SiO2 concentration and strontium isotopes. The water temperatures were measured in the field with a digital thermometer with an accuracy of 0.1 °C. The conductivity and pH, which are unstable parameters, were measured in situ with handheld meters calibrated prior to sampling. The concentrations of cations (K+, Na+, Mg2+ and Ca2+) and anions (Cl, Br, NO3 and SO42−) were determined with a Dionex ICS-900 ion chromatograph and an AS40 automatic with a ±5% or less reproducibility and a 0.01 mg/L detection limit [27] sampler from the Earthquake Forecasting Key Lab of China Earthquake Administration. We determined HCO3 and CO32− concentrations using a ZDJ-100 potentiometer titrator procedure with titrator procedures of 0.05 mol/L HCl with 0.1% methyl orange and 1% phenolphthalein (reproducibility within ±2%). The ionic charge equilibrium defined in meq/L is expressed as (cations − anions)/(cations + anions) and is within ±5% of the ionic equilibrium for each sample [28]. The hydrogen and oxygen isotopes were analysed using a Finnigan MAT253 mass spectrometer with the TC/EA method. The isotope accuracies of V-SMOW and analysed water samples were ±0.2% and ±1%, respectively [29]. The SiO2 concentration of the samples was analysed using an inductively coupled plasma emission spectrometer Optima-5300 DV [30]. Sr elements were measured by Element XR ICP-MS from the Test Center of the Research Institute of Uranium Geology [31].

4. Results and Discussion

4.1. Recharge Sources of Hot Springs

The comparison of δ18O and δD of water samples with global and regional atmospheric precipitation lines provided insight into the hydrological cycle of water sources and recharge, water-rock interaction and groundwater mixing [32]. The oxygen and hydrogen isotopic of water samples from the XSHF varied from −129.80 ‰ to −78.77 ‰, and from −21.70 ‰ to −10.04 ‰. The Global Meteoric Water Line (GMWL) equation was found to be δD = 8δ18O + 10 [28]. The study area was located on the eastern edge of the Tibetan Plateau and the atmospheric precipitation line for the Tibetan Plateau is the Local Meteoric Water Line (LMWL) with the equation δD = 8.41δ18O + 16.72 [33]. The δ18O and δD distribution maps showed that most of the hot springs in the study area were in close proximity to the GMWL and LMWL (Figure 2). This provided important information about the source of geothermal water, which is that they were recharged by infiltrating atmospheric precipitation.
The following two interesting characteristics of geothermal waters can be identified in this figure. (1) The hydrogen and oxygen isotopes from 2008 showed a strong δ18O right shift effect (Figure 2b), which the strong positive δ18O shift was generally owed to strong water–rock interactions influenced by three factors [34]: ① the high temperature of the reservoirs, ② the long circulation time and ③ the high ratios of rock to water. Nevertheless, it was unclear what factor controlled the δ18O shift occurring; (2) The hydrogen and oxygen isotopes from 2013 showed a strong δ18O left shift that may be because of the δ18O exchange that occurred during the dissolution of CO2 from deep source [35].
Previous studies have shown that the elevation effect was an important factor affecting the isotope of atmospheric precipitation, showing a decrease in the isotope value with increasing elevation, so the recharge elevation of hot spring water can be estimated by using the elevation effect of the isotope [36]. The formula for calculating the δD value of precipitation and elevation H in western China was δD = −0.026 H − 30.2 [37]. Based on the equation, we calculated the recharge elevation of the study area to be 1.9–4.8 km.

4.2. Origin of Water-Soluble Ions in Hot Springs

4.2.1. Origin of Major Elements

The water samples collected from the hot springs were analysed, and the results are shown in Supplementary Table S1. The ion balances of all samples were less than 5%, indicating that the analytical results for these samples were plausible. Temperatures of water springs were in the range of 10 °C to 82 °C, with a pH ranging from 6.25 to 9.45. Conductivity ranged from 3.67 to 57600.00 μs/cm, and TDS values ranged from 80.86 to 2754.01 mg/L. The main cations in hot springs were Na+, Ca2+ and Mg2+, while the main anions were HCO3. The concentrations of Na+, K+, Mg2+ and Ca2+ranged from 2.75 to 958.23 mg/L, 0.00 to 128.24 mg/L, 0.00 to 440.35 mg/L and 0.00 to 286.59 mg/L, respectively; the concentrations of Cl, SO42−, and HCO3 ranged from 0.31 to 871.45 mg/L, 0.00 to 688.86 mg/L, and 37.82 to 2588.79 mg/L, respectively.
The results of chemical analyses of hot spring waters from the study area were given in Supplementary Table S1. The main chemical compositions of the waters were plotted on the Piper diagram, and water samples were plotted in 1, 2, 4 and 6 blocks (Figure 3). The type of hydrochemistry of most groundwater from the XSHF were HCO3-Na, apart from some samples which were of the HCO3⋅Cl-Na, HCO3-Ca-Na, HCO3-Na-Ca, HCO3-Na·Mg, HCO3-Ca and HCO3-SO4-Mg type, The correlation graph of Na+ +K+ vs. Ca2+ +Mg2+, in which iso-ionic-salinity lines are drawn for reference (Figure 4) [38,39]. The hot spring samples have different total salinity (TIS), ranging from 3.7 to 90.9 meq/kg. Twenty-four hot springs were of the HCO3-Na type. Based on previous studies, HCO3-Na type geothermal water was typical of high-temperature geothermal systems and was generated by chemical reactions between infiltrated meteoric water, dissolved carbon dioxide, and reservoir rocks containing dolomite and microcline as the primary minerals [40]. The total salinity (TIS) ranged from 3.7 to 90.9 meq/kg. The process could be illustrated in the Equations of (1) and (2).
However, the hot springs of W31, W32, W34, W35, W37 and W41 were HCO3⋅Cl-Na types. The total salinity (TIS) ranged from 29.5 to 90.3 meq/kg. Interestingly, the primary properties of these six hot springs are high temperature and high Cl concentrations, which suggests that the parent geothermal fluid was formed by the mixing of snow and juvenile water deep in the subsurface under the influence of magma, with the deep parent geothermal fluid having travelled long distances to get to the surface, where water from different sources participated in the mixing during the ascent. It included three mixed endmembers of the cold water, consisting of local precipitation, river water and snowmelt water [16].
Furthermore, the high Ca2+, Mg2+ and SO42− concentrations of most geothermal waters (W1–W3, W8, W9, W11, W19, W21, W38 and W42) also indicated that the geothermal waters in the study area might not have been influenced by magma indicating that the magma-influenced hydrochemical signature was instead masked by mixing processes. The total salinity (TIS) ranged from 5.2 to 71.8 meq/kg. The process could be illustrated in the Equations of (3)–(5).
2NaAlSi3O8 + 9H2O + 2H2CO3 → Al2Si2O5(OH)4 + 4H4SiO4 + 2Na+ + 2HCO3
2KAlSi3O8 + 3H2O + 2CO2→Al2(Si2O5)(OH)4 + 4SiO2 + 2K+ + 2HCO3
CaCO3 + H2O + CO2 → Ca2+ +2HCO3
MgCO3 + H2O + CO2 → Mg2+ + 2HCO3
CaSO4 · H2O → Ca2+ + SO42−+ H2O

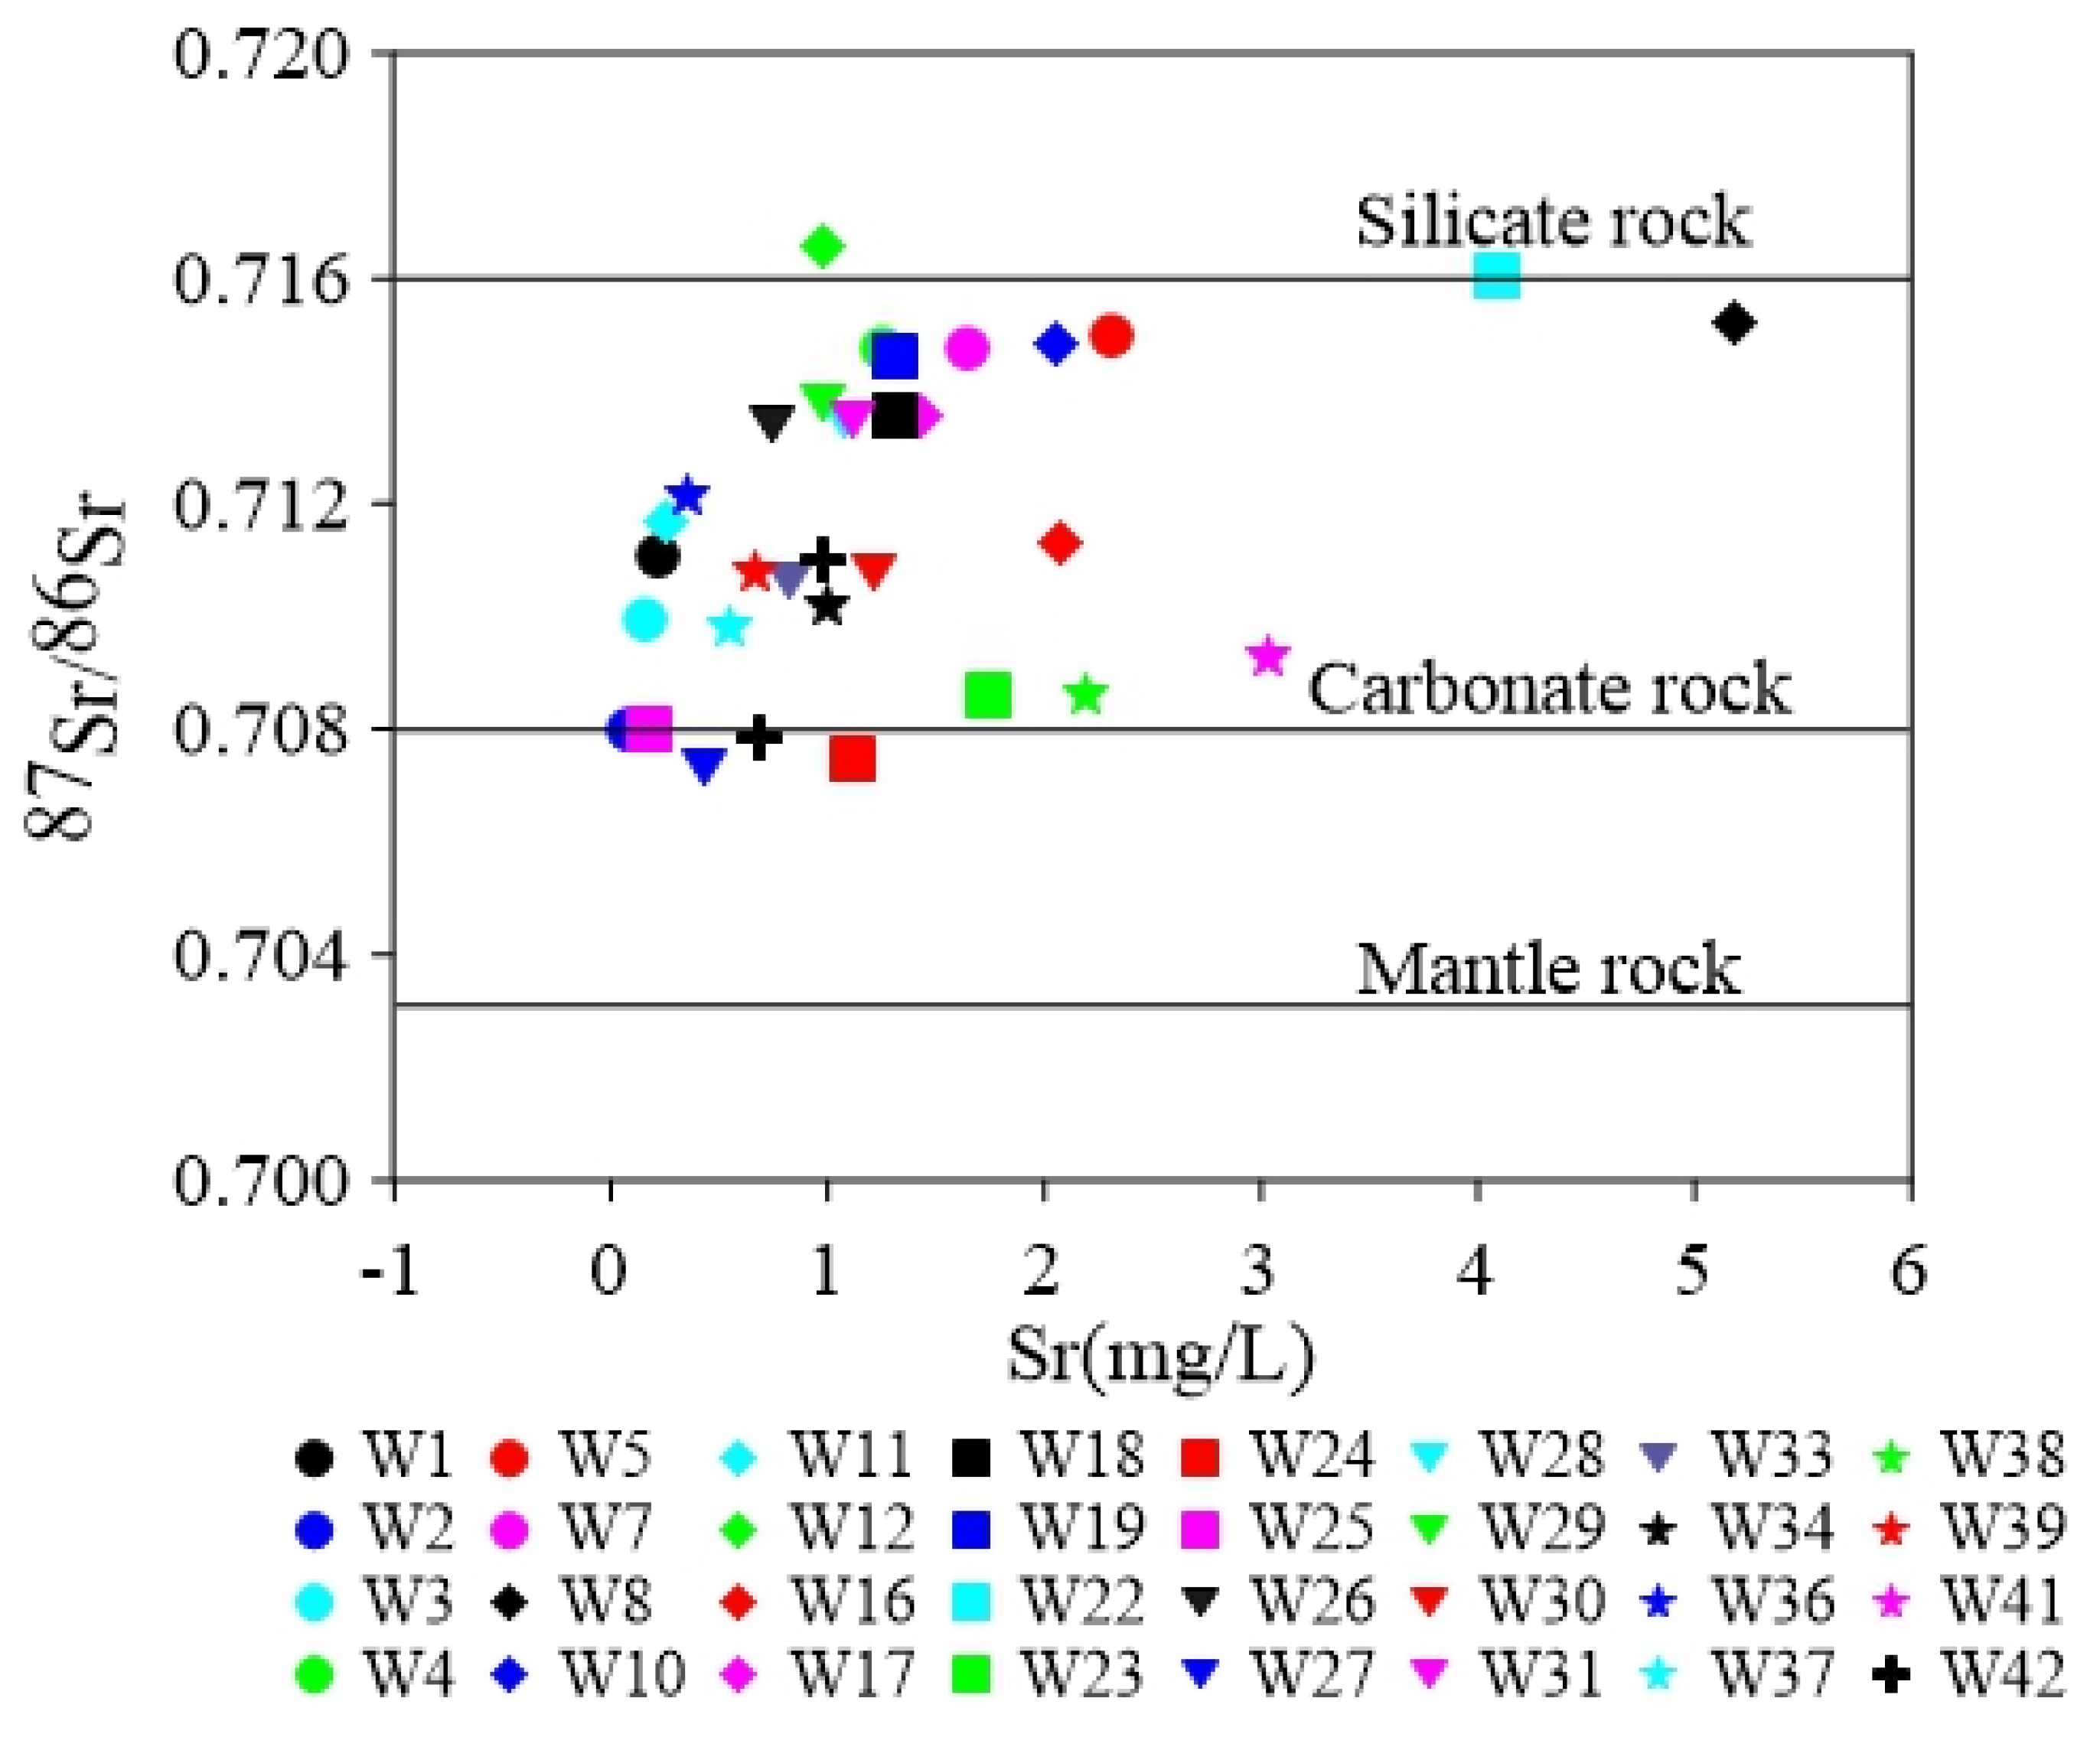
4.2.2. Characteristics of Strontium Isotopes

The 87Sr/86Sr in a hot spring was frequently similar to the rock minerals it comes in touch with [41]. Therefore, this ratio can be an effective tracer of the interaction between various rock minerals. Silicate, carbonate and sulphate minerals are important sources of Sr in groundwater and influence the 87Sr/86Sr of groundwater [42]. The 87Sr/86Sr values of carbonate and sulphate weathering sources were about 0.708000, and the aluminosilicate weathering sources varied between 0.716000 and 0.720000 [40,43]. The ratio of 87Sr/86Sr in the thermal springs in the study area ranged from 0.707290 to 0.716574 (Figure 5 and Table 2). The W12 and W22 hot springs belong to the silicate mineral weathering, and the W24, W25, W27 and W42 hot springs belong to the carbonate mineral weathering, and the remnant springs were between carbonate and silicate mineral weathering. They were formed by the deep circulation of atmospheric precipitation in the local heat flow system interacting with Sr-bearing rocks in the crust consistent with the results of hot spring chemistry.

4.3. Water–Rock Interaction of Hot Springs

4.3.1. The Water–Rock Reaction Equilibrium

The Na-K-Mg triangle can be used to assess whether the groundwater was in equilibrium, partially in equilibrium or immature, which indicated the degree of water–rock reaction [44]. The Na-K-Mg triangular plot (Figure 6) showed that W4, W6, W7, W12, W16, W25 and W35 water samples were located in the partial equilibration zone, while other hot spring samples were located in the immature water zone. This indicated that most of the hot springs on the XSHF were mainly recharged by atmospheric precipitation and circulated at a relatively rapid rate, with a few having some degree of hydromorphic reaction.

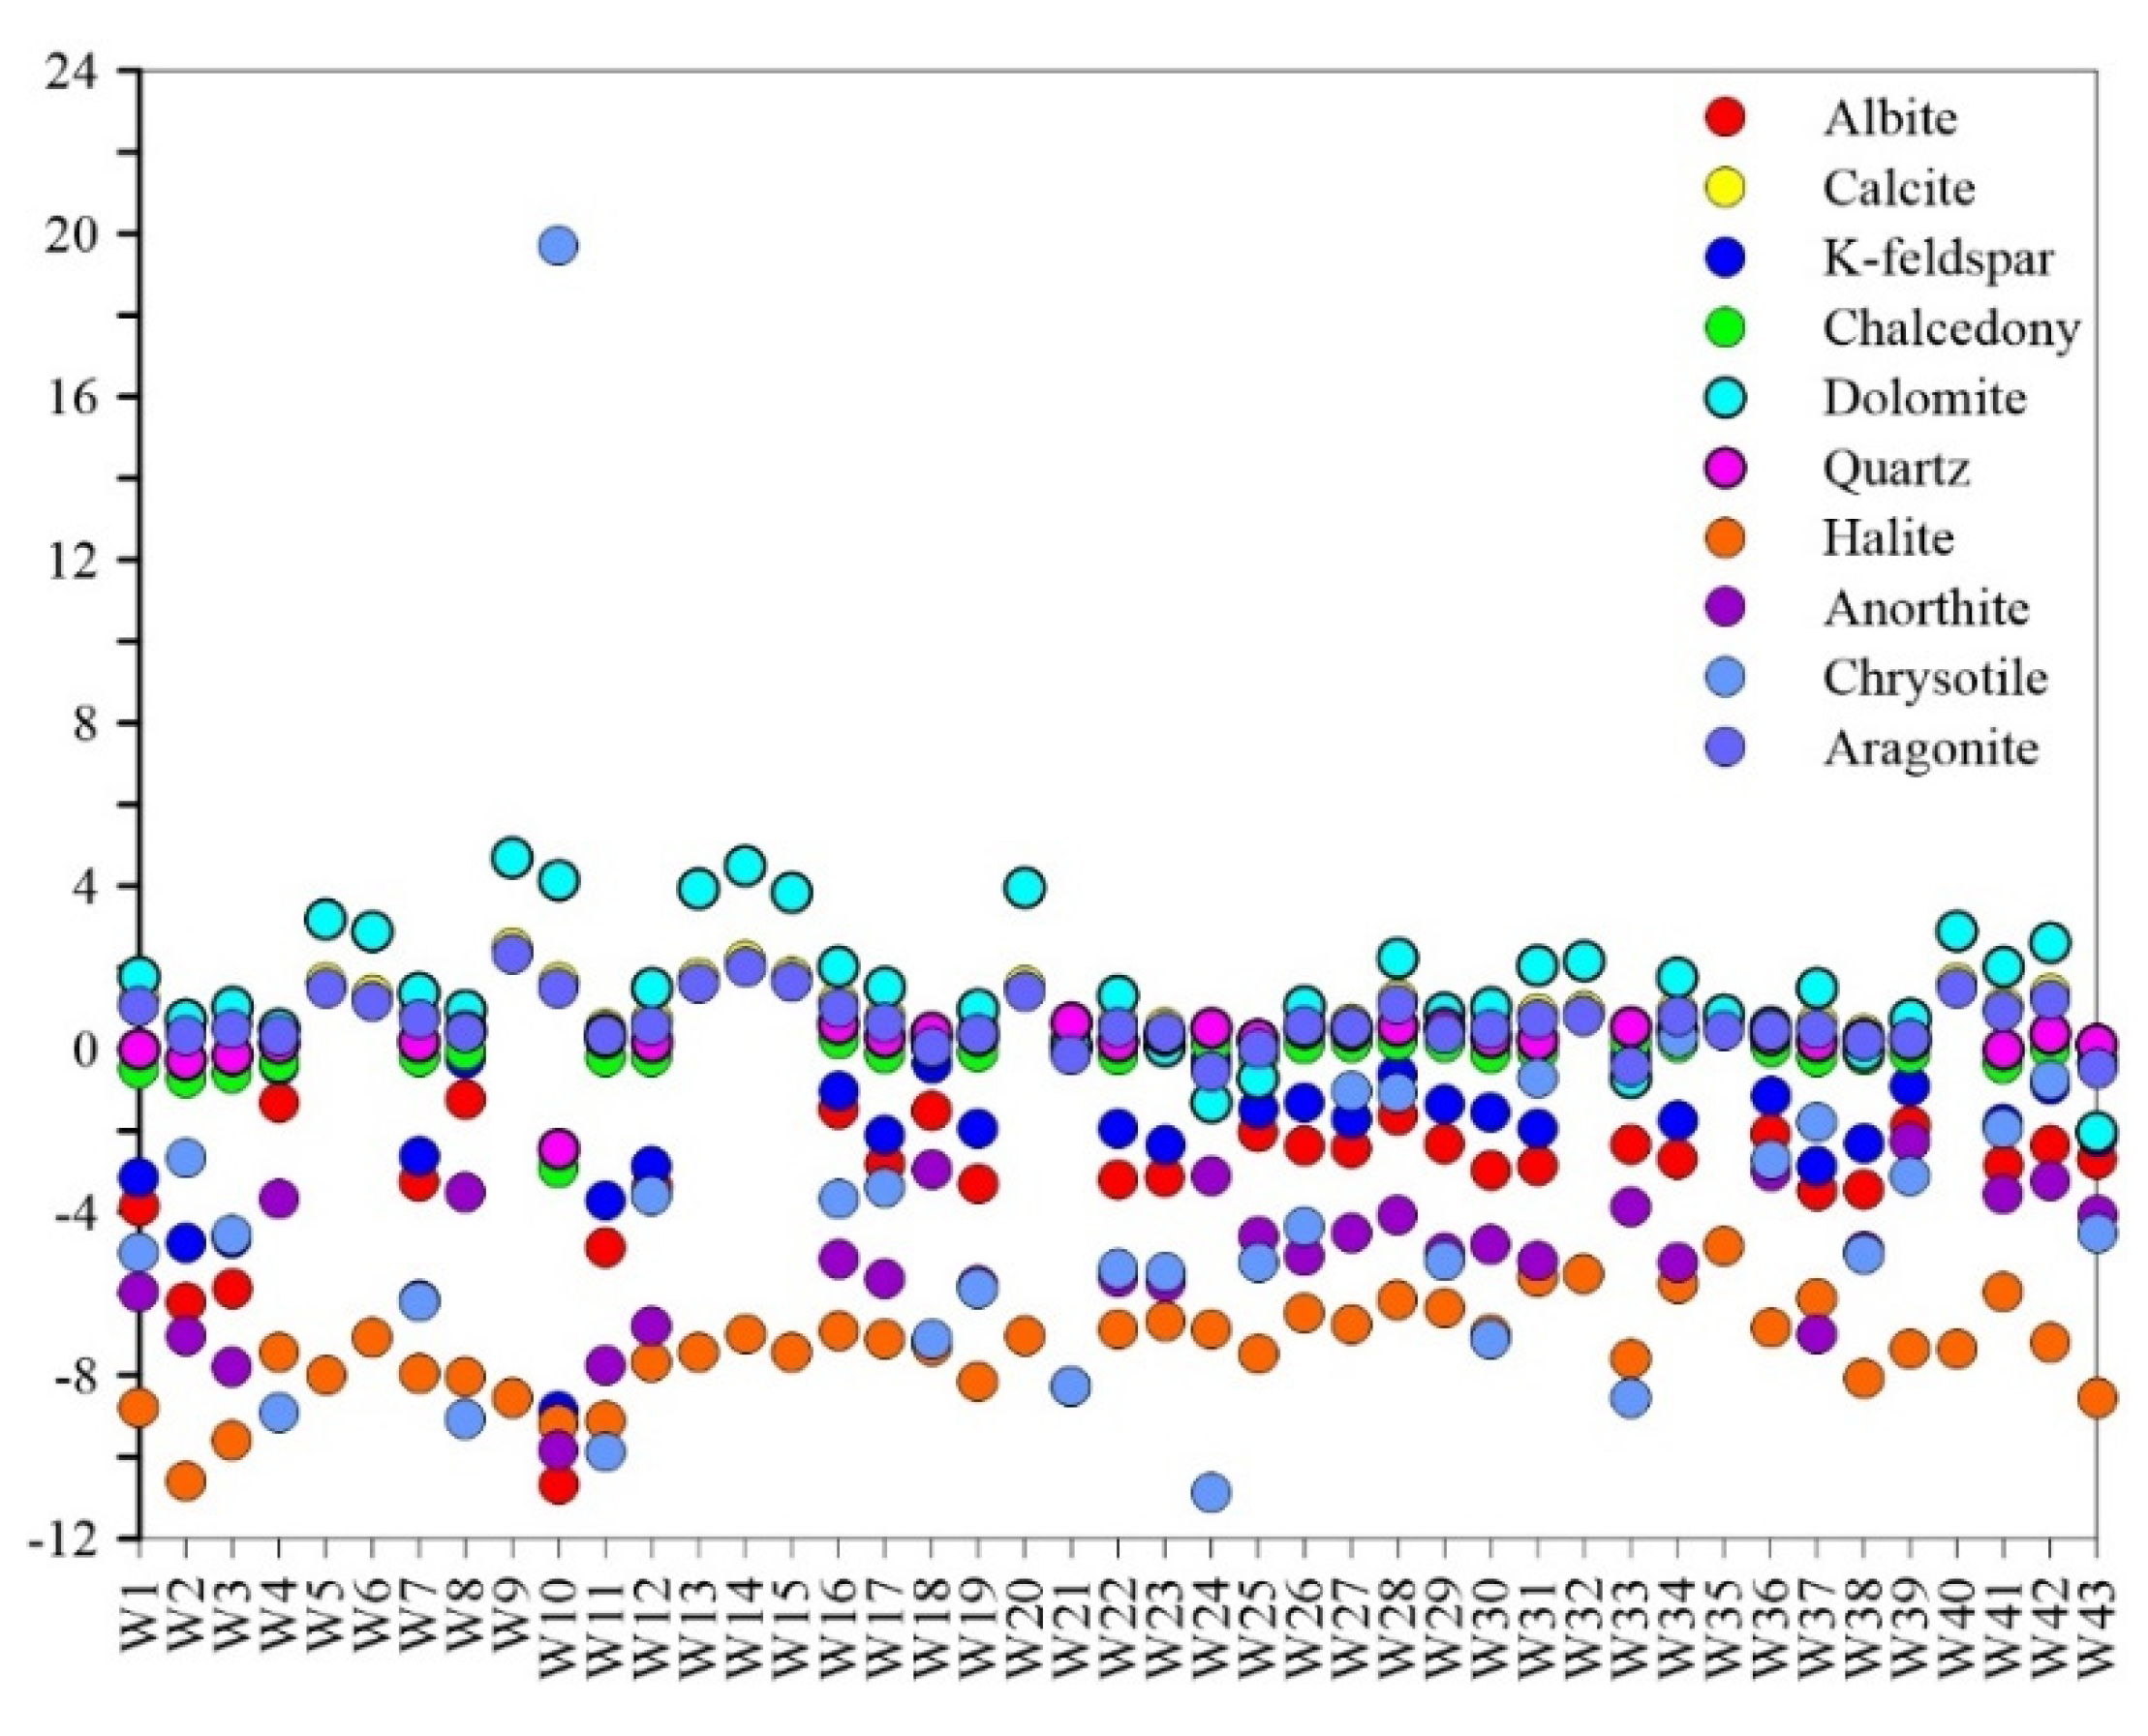
4.3.2. Mineral Saturation States

Regarding the analysis of hot spring water samples, the mineral saturation index (SI) is calculated using the PHREEQC software. The results of this study are presented in Figure 7: it can be noticed that all spring water samples are saturated (SI > 0) with respect to Calcite, Chalcedony, Dolomite, Quartz, Halite and Aragonite are basically in equilibrium (SI ≈ 0). However, SI with respect to Dolomite varies greatly in each hot spring water. Groundwater samples in W5, W9, W10, W13, W14, W15, and W20 are in a supersaturated state (SI values are 3.18, 4.69, 4.14, 3.93,4.49,3.84 and 3.96, respectively). However, they are unsaturated in W24, W25, W33, W38 and W43 (SI values are −1.31, −0.73, −0.71, −0.04 and −2.04, respectively), and the rest is basically in equilibrium (SI ≈ 0). This phenomenon may reflect the difference in the surrounding rock characteristics. The supersaturation indicates a high content of these minerals and a long residence time in the aquifer system [45]. However, albite, K-feldspar, anorthite, chrysotile and halite are found in an unsaturated state in the majority of spring waters, indicating that they are relatively soluble or have insufficient reaction time with hot water.

4.3.3. Reservoir Temperature and Circulation Depth

Geothermometers can be used to estimate the thermal storage temperature of hot springs. Frequently used geothermal temperature scales include cationic temperature scales as well as SiO2 temperature scales [46]. A comprehensive analysis of the Na-K-Mg triangle diagram and the hydrochemical characteristics of the hot springs, The Na-K and K-Mg geothermometers were used to calculate the thermal storage temperature in study areas with W4, W6, W7, W12, W16, W25, W35 and SiO2 was more stable than other minerals and can therefore indicate the thermal storage temperature of immature water. The Na-K geothermometers indicated the more complete equilibrium of geothermal water, with the result corresponding to the highest temperature at the equilibrium of geothermal water-rock action [47], while the K-Mg geothermometers indicated the shallower equilibrium of geothermal water, with the result corresponding to the lowest temperature at the equilibrium of geothermal water-rock action [44,48]. Therefore, we used multiple geothermal temperatures scaling methods to calculate the thermal storage temperature in the study area (Table 3). Therefore, the reservoir temperature of spring samples in the XSHF was mainly 8–142 °C. The depth of circulation of the hot spring samples was assessed according to formulation (6):
Z = Z0 + (T − T0)/Tgrad
Z is the circulation depth (km); Z0 is the depth of constant temperature zone (km); T is the reservoir temperature (°C); T0 is the temperature of constant temperature zone (°C), namely the average local temperature; Tgrad is the geothermal gradient (°C/km), and reflects the geothermal changes for each kilometre below the constant temperature zone [49]. Based on previous studies in the area, the geothermal gradient Tgrad was assumed as 20.4 °C/km, the annual mean temperature T0 assumed as 7 °C, and the depth Z0 of the constant temperature zone assumed as 30 m [17]. The circulation depth of the XSHF was about 0.1–6.9 km, as calculated.

4.4. Spatial Distribution of Hydrogeochemical Characteristics in XSHF

The 43 hot springs were distributed along the five segments of the XSHF. As shown in Figure 8. The hot springs in the study area were consistent in terms of the magnitude and depth of the earthquakes that occur, the depth of circulation and the slip rate in the different sections. The rate of slip in the Zhuwo (W1, W2) and the Luhuo faults (W3, W4, W5) was 4 mm·a−1, The water temperature of the hot springs in these two segments was low, ranging from 10 to 26 °C. The depth of circulation was shallow, ranging from 0.1 to 2.7 km, and the magnitude of the earthquakes in these two areas was small, with most earthquakes less than magnitude 3, with shallow source depths. Next were the Bamei (W16–W20) and the Moxi (W36–W43) segment hot springs, finally, The rate of slip, reservoir temperature and circulation depth of the Kangding (W21–W35) and the Daofu (W9–W15) segments were ranged from 13 mm·a−1 to 6.5 mm·a-1, 16 °C to 142 °C and 0.5 km to 6.7 km, which had the highest reservoir temperature and the most frequent strong earthquakes in the study area (Figure 8). Some of the hot springs had high temperatures, and the highest temperature reached 82 °C (W35).
The XSHF was a fracture at a depth that reached the Moho phase; multiple phases of magmatism have occurred in the Kangding area [25]. Therefore, there was a high probability that the Kangding hydrothermal system would have been influenced by the hydrochemical species of the hydrothermal fluids by the magma. The value of 3He/4He indicated that helium from the springs was partially derived from the mantle of the Kangding segment [13,50]. Thus, the hydrochemical characteristics of spring water in the Kangding geothermal field were controlled by the Kangding hydrothermal system. In contrast, the Kangding hydrothermal system has developed several fractures, which cut deep into the crust, established channels for hydrothermal activity, and provided a tectonic basis for the hydrothermal system [25].

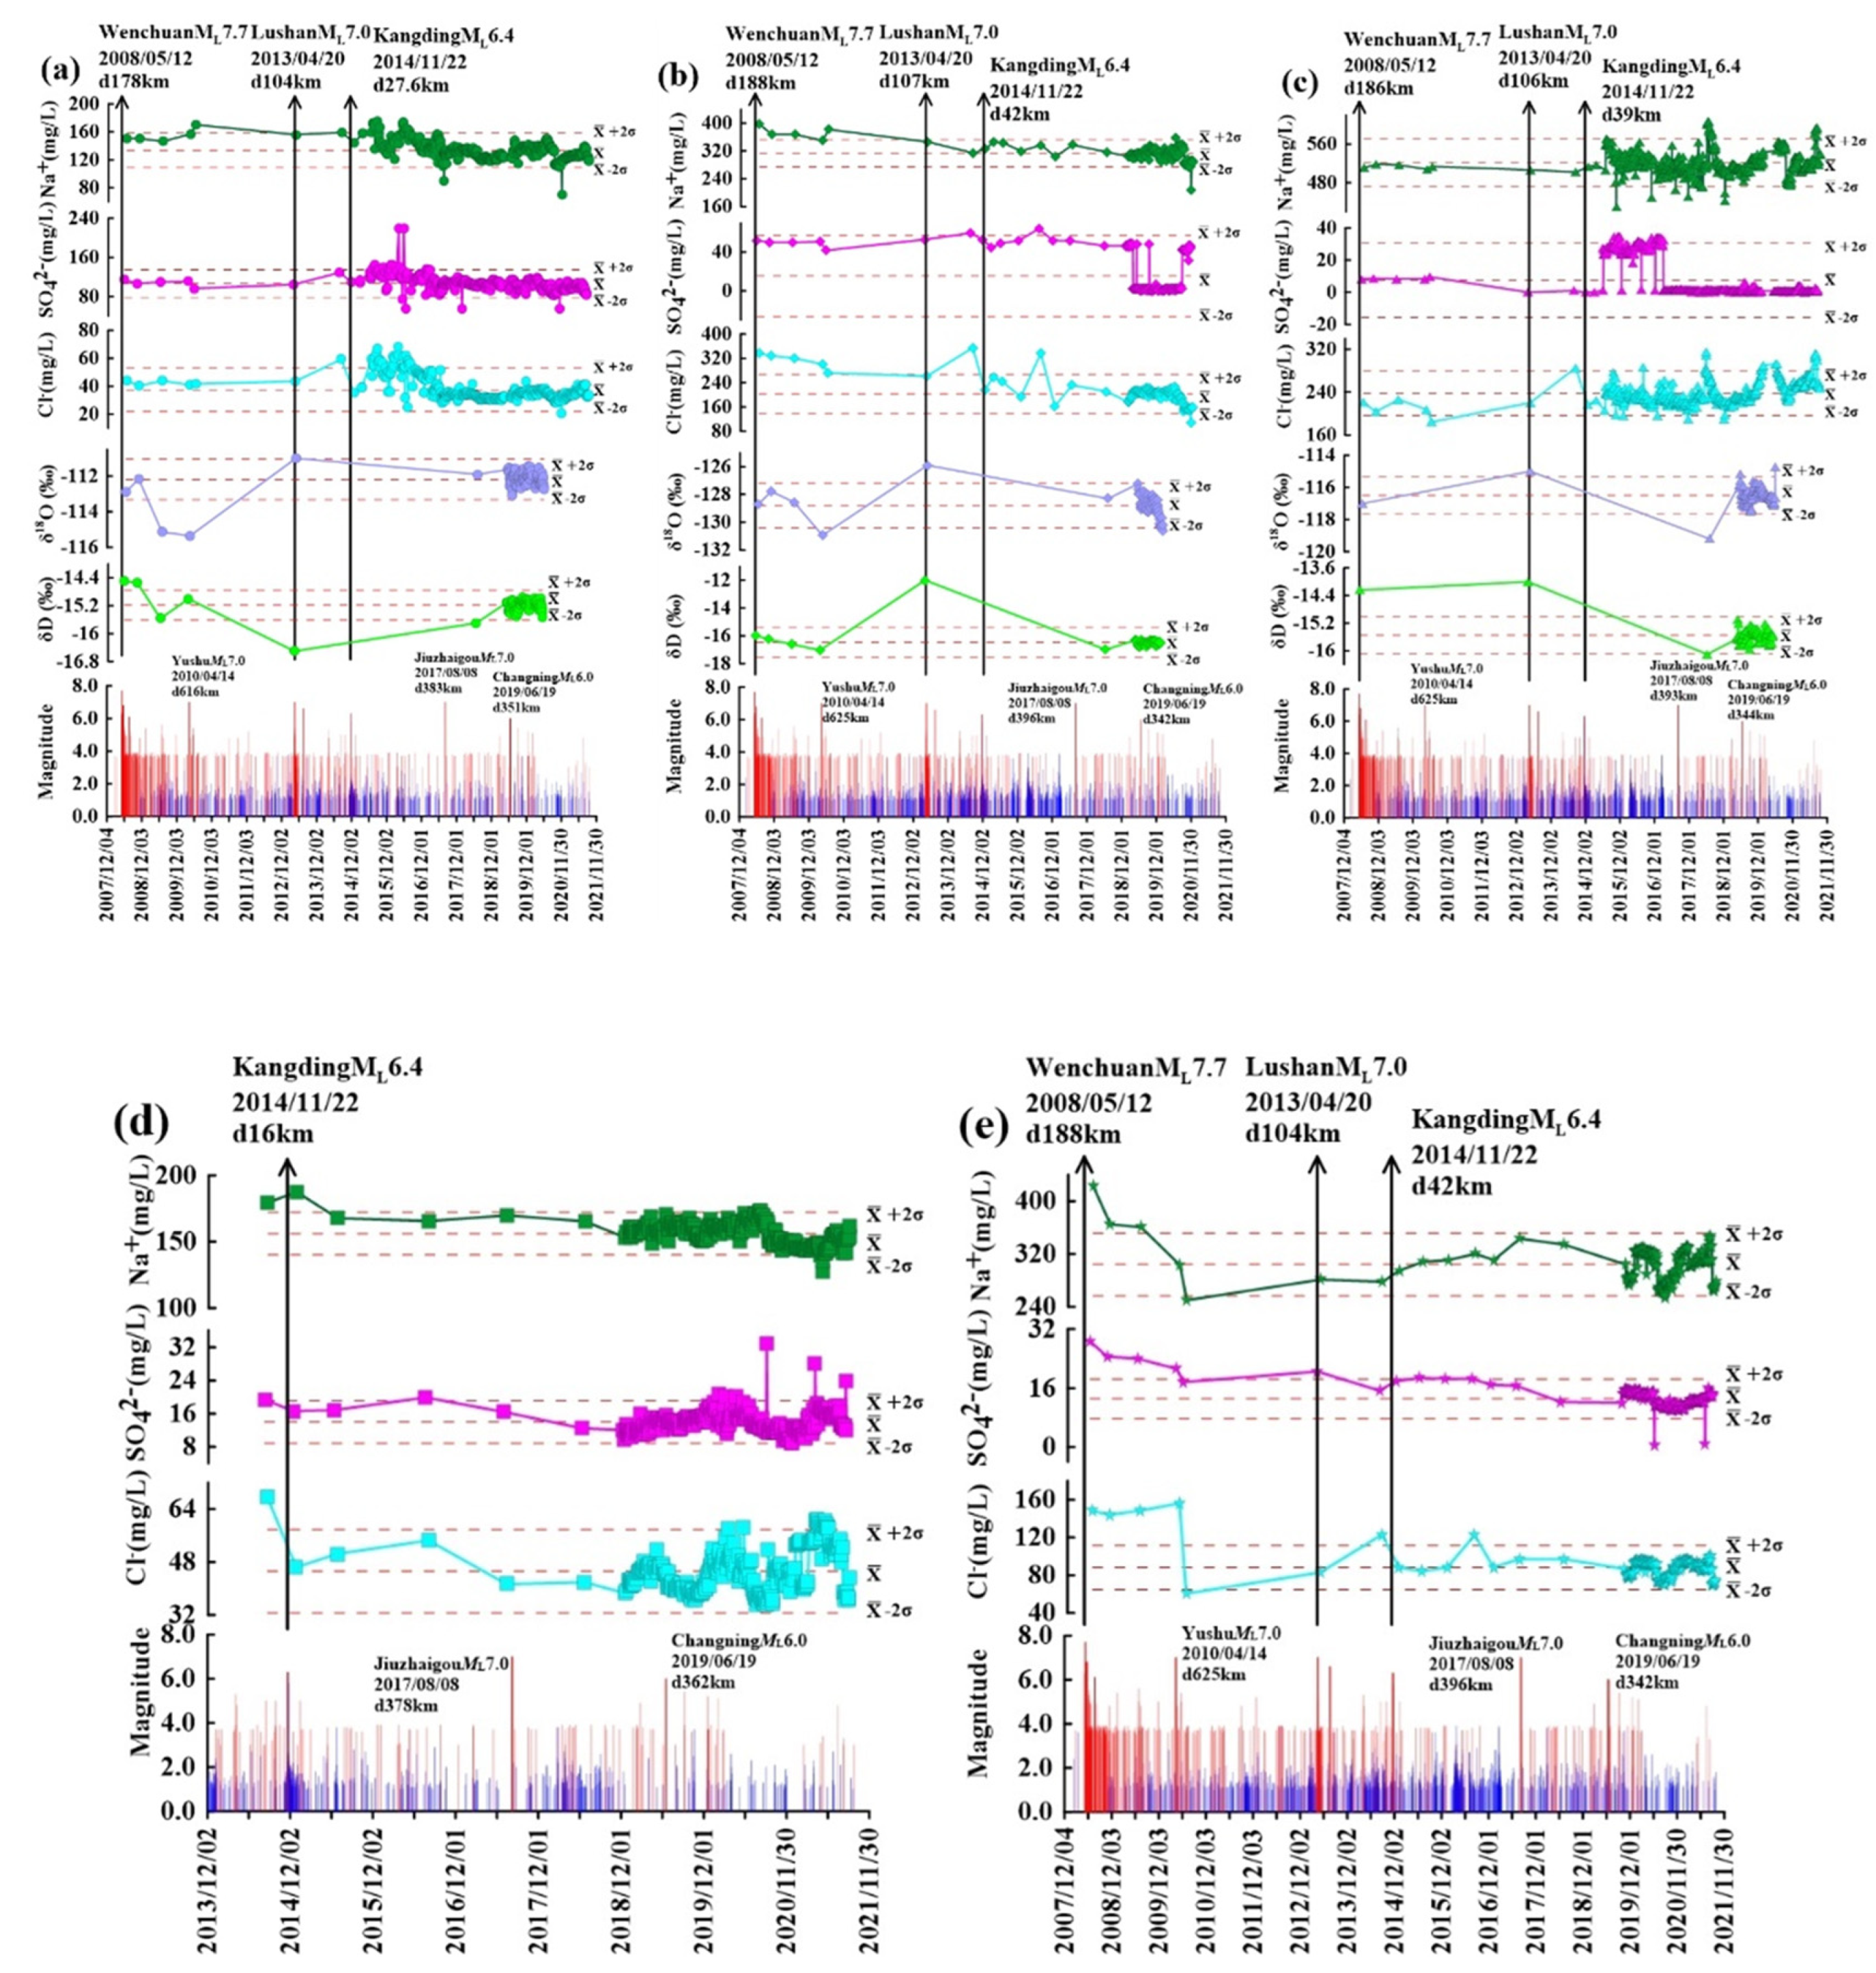
4.5. Correlation between Hydrogeochemical Changes and Earthquakes

Precursory and Post-Seismic Anomalies

Great earthquakes are usually associated with the physicochemical variations of groundwater and hot springs [51,52]. The short-term hydrogeochemical precursors for earthquakes, the co-seismic response of hydrochemistry and post-seismic geochemical and isotopic changes of hot springs have been reported [37,51,53,54]. We studied the changes in water chemistry in nine thermal springs (W25, W27, W30, W31, W34, W36, W37, W39 and W43) from 2008 to 2021 in the XSHF, western Sichuan, China. During the study period, six large earthquakes (12 May 2008 Wenchuan Ms8.0, 20 April 2013 Lushan Ms7.0, 22 November 2014 Kangding Ms6.3 earthquakes, 14 April Yushu Ms7.0, 8 August 2017 Jiuzhaigou Ms7.0 and 19 June 2019 Changning Ms6.0 earthquakes) occurred near the XSHF (Table 4 and Figure 7). The ion concentrations (Na+, Cl and SO42) in the hot springs in the XSHF were plotted as a line graph of the main ion concentrations over time, and the mean + 2 times the standard variance of the collected samples was used to determine the threshold of anomalies in the study area. The results showed that the temporal variation of ions (such as Na+, Cl and SO42) in the hot spring waters decreased obviously after the 12 May 2008 Wenchuan Ms8.0, with unusual value fluctuations between the 20 April 2013 Lushan Ms7.0 and 22 November 2014 Kangding Ms6.3 earthquakes occurred. In addition, the concentrations of these ions returned to the normal levels after 20 July 2017 (Table 4 and Figure 9).
Many mechanisms have been proposed to explain the post-seismic anomalies. For example, Hydrostatic strain caused by earthquakes leads to mixing of deep and shallow water, increased reactive surface area following rock surface rupture leads to accelerated water-rock interaction, and the hydrological barrier between two chemically distinct aquifers may rupture, re-establishing water-rock chemical equilibrium [1,55,56]. Stable isotope changes can be traced to hydrogeological processes such as changes in permeability, groundwater mixing degree and water–rock interactions [1,47,51], which are closely related to seismically induced stress changes. Hence, we also obtained some hydrogen and oxygen isotope data for some hot springs from 2008 to 2019. Although D and 18O isotope data were not complete, it is important to discuss the isotope evolution after the 2008 Wenchuan Ms8.0 earthquake and the 2013 Lushan Ms7.0 earthquake. As shown in Figure 2b, the δD and δ18O values in the thermal springs deviated from the LMWL after the 2008 Wenchuan earthquake but shifted toward the LMWL in 2009 and 2010. These δ18O was more negative after the 2008 Wenchuan Ms8.0 earthquake was due to hydrostatic interaction with δ18O-rich enclosing rocks during deep circulation, accompanied by oxygen isotope exchange, increasing in groundwater δ18O [34]. The hydrogen and oxygen isotopes of the hot spring water were collected in May 2013 deviated to the upper left of the atmospheric precipitation line. This is probably because of the exchange of δ18O isotopes during the dissolution of hot spring water with CO2 from deeper sources [36]. Therefore, it was assumed that the change in ion concentration in each hot spring during the 2013 Lushan Ms7.0 earthquake was due to increased permeability between aquifers and groundwater mixing.
The obvious seismic precursors were captured in the study area, the concentration of dissolved ions (Na+, Cl and SO42−) in these hot springs increased by 5% to 36%, with the obvious precursor anomaly three months before the 22 November 2014 Kangding Ms6.3 earthquakes. These phenomena were found in one hot spring and shown in W25, W27, W30, W31, W34, W36, W37, W39 and W43 hot springs. In addition, changes in hydrochemical compositions were more obvious and increased rate about 20% to 30%, which was located 40 km away from the epicentre of the Kangding Ms6.3 earthquake, and the ion concentrations of W36, W37, W38 and W43 hot springs increased slightly only about 10%, which was located 80 km away from the epicentre of the Kangding Ms6.3 earthquake. Moreover, the hydrogeochemical changes of these hot springs showed less pronounced to other three large earthquakes (2010 Yushu Ms7.0, 2017 Jiuzhaigou Ms7.0, and 2019 Changning Ms6.0 earthquakes) occurred around the XSHF may be caused by the distance of the epicentre. The ion concentration of these hot springs (W25, W27, W30, W31, W34, W36, W37, W39 and W43) were sensitive to seismicity located in a huge left-lateral strike-slip active fault (XSHF) [57], which set the eastern boundary of the large-scale clockwise rotation of crustal materials of the Himalaya syntaxis [54,58]. When the stress increased up to the sub-instability stress state of the XSHF, the Kangding Ms6.3 earthquakes occurred [59]. The concentrations of Na+, Cl and SO42− were sensitive to the increase of stress in the XSHF, which could enhance the opening of microfractures under these hot springs [60]. Based on the various characteristics of stress and strain, the ion concentration also showed different anomalous characteristics with the change of permeability between aquifers, groundwater mixing and water–rock interactions, showing a positive increase in ion concentration of hot springs [61,62].

4.6. Conceptual Model of Hot Springs in the XSHF

Geothermal water was recharged by the infiltrated precipitation and heated by fractures that seep deep into the earth and through a deep cycle of groundwater [40]. The XSHF is a typical deep-developed fracture system that accompanies high-temperature geothermal systems. The deep faults serve not only as a conduit for further groundwater infiltration but also as a conduit for the upward flow of deep geothermal fluids. The heat source of the high-temperature hydrothermal system is mostly from the deep magmatic heat of the fracture zone, radioactive heat from granitoids and frictional heat (Figure 10). Ai et al. (2021) [63] studied the effect of shear frictional heat on high-temperature hydrothermal activity in the XSHF through numerical simulations. They concluded that shear frictional heat was the controlling heat source for the geothermal field as it may lead to crustal melting at 20–25 km depth. Therefore, the shear frictional heat of the XSHF may have provided energy for a range of high-temperature geothermal systems. Meteoric water penetrates into the aquifer at around 5 km in the Gunga snow mountain and the Great Snow Mountain through the hydraulic conductivity fracture zone along the fractures between and around the mountain ranges and river terraces. As the groundwater circulates downwards to about 6.9 km, it is heated by deep magmatic heat, granite-like radiogenic heat, or sliding frictional heat sources from the XSHF, and the water is heated to a maximum of 124 °C. During the heating process, water-rock reactions occur with the surrounding rocks at different depths, influenced by temperature and pressure. As it rises to the surface, it mixes with surface water or shallow groundwater and is finally exposed to the surface to form the hot spring. If the crustal stresses in the area change, this can affect the equilibrium state of the hot spring water and lead to changes in its hydrogeochemical characteristics [64]. Therefore, continuous monitoring could be conducted on a proper hot spring spot of the fault zone to further study the pre-seismic hydrochemical precursors.

5. Conclusions

Using extensive hydrochemical data from 43 hot spring sites, the mechanisms and processes of geochemical changes in the XSHF were described from the perspective of the regional groundwater flow system. The results of the study showed that,
(1)
The hot spring water at XSHF is recharged by infiltrating precipitation at recharge elevations of 1.8 to 4.5 km.
(2)
The hydrochemical types of most hot springs were mainly controlled by aquifer lithology. The heat storage temperature range was inferred from an equation based on SiO2 and chemical geothermometers method as 8–124 °C. The circulation depths for springs were estimated to range from 0.1 to 6.9 km.
(3)
The spatial distribution of hydrogeochemical characteristics of hot springs in the XSHF indicates part of the hot springs in the Kangding (W21–W35) and the Daofu (W9–W15) segments which had the highest reservoir temperature and the most frequent strong earthquakes in the two segments.
(4)
The temporal variations of dissolved chemical concentrations (Na+, Cl and SO42) decreased obviously after the Wenchuan Ms8.0 earthquake, with abnormal value fluctuations between the Lushan Ms7.0 and Kangding Ms6.3 earthquake occurred and after the 30 July 2017 returned to normal levels. And the ion concentrations (Na+, Cl and SO42) in hot springs increased by 5% to 35% three months before 22 November 2014 Kangding Ms6.3 with the obvious precursor anomaly. These results indicate that synchronous isotopic changes, as well as changes in water chemistry between multiple hot springs, were important for earthquake forecasting and the study of the response of earthquake precursors.

Supplementary Materials

The following are available online at https://www.mdpi.com/article/10.3390/w14040550/s1, Table S1: Field and analytical data of major elements and stable isotopes (δD, δ18O) on water samples.

Author Contributions

Conceptualization, Y.Y., X.Z. and L.L.; methodology, Y.Y. and X.Z.; software, Y.Y., J.T. and F.L.; validation, S.O., Y.L. and F.L.; formal analysis, J.T. and Y.L.; investigation, S.O., Z.S. and F.L.; data curation, Z.S. and J.T.; writing—original draft preparation, Y.Y.; writing—review and editing, Y.Y., X.Z. and L.L.; visualization, Y.Y. All authors have read and agreed to the published version of the manuscript.

Funding

The work was funded by National Key Research and Development Project (2017YFC1500501-05, 2019YFC1509203) and the National Natural Science Foundation of China (41673106, 42073063, 4193000170) and The Special Fund of the Institute of Earthquake Forecasting, China Earthquake Administration (2021IEF0101, 2021IEF1201). Spark Program for Earthquake Science and Technology (XH20066).

Institutional Review Board Statement

Not applicable.

Informed Consent Statement

Informed consent was obtained from all subjects involved in the study.

Data Availability Statement

The raw data supporting the conclusions of this article will be made available by the authors, without undue reservation.

Conflicts of Interest

The authors declare no conflict of interest.

References

  1. Claesson, L.; Skelton, A.; Graham, C.; Dietl, C.; Morth, M.; Torssander, P.; Kockum, I. Hydrogeochemical changes before and after a major earthquake. Geology 2004, 32, 641–644. [Google Scholar] [CrossRef]
  2. Reddy, D.V.; Nagabhushanam, P. Groundwater electrical conductivity and soil radon gas monitoring for earthquake precursory studies in Koyna, India. Appl. Geochem. 2011, 26, 731–737. [Google Scholar] [CrossRef]
  3. Wasteby, N.; Skelton, A.; Tollefsen, E.; Andren, M.; Stockmann, G.; Liljedahl, L.C.; Sturkell, E.; Morth, M. Hydrochemical monitoring, petrological observation, and geochemical modeling of fault healing after an earthquake. J. Geophys. Res.-Solid Earth 2014, 119, 5727–5740. [Google Scholar] [CrossRef]
  4. Skelton, A.; Andren, M.; Kristmannsdottir, H.; Stockmann, G.; Morth, C.-M.; Sveinbjoernsdottir, A.; Jonsson, S.; Sturkell, E.; Gudorunardottir, H.R.; Hjartarson, H.; et al. Changes in groundwater chemistry before two consecutive earthquakes in Iceland. Nat. Geosci. 2014, 7, 752–756. [Google Scholar] [CrossRef] [Green Version]
  5. Zhao, Y.; Liu, Z.; Li, Y.; Hu, L.; Chen, Z.; Sun, F.; Lu, C. A case study of 10 years groundwater radon monitoring along the eastern margin of the Tibetan Plateau and in its adjacent regions: Implications for earthquake surveillance. Appl. Geochem. 2021, 131, 105014. [Google Scholar] [CrossRef]
  6. Favara, R.; Grassa, F.; Inguaggiato, S.; Valenza, M. Hydrogeochemistry and stable isotopes of thermal springs: Earthquake-related chemical changes along Belice Fault (Western Sicily). Appl. Geochem. 2001, 16, 1–17. [Google Scholar] [CrossRef]
  7. Igarashi, G.; Saeki, S.; Takahata, N.; Sumikawa, K.; Tasaka, S.; Sasaki, Y.; Takahashi, M.; Sano, Y. Ground-water radon anomaly before the kobe earthquake in Japan. Science 1995, 269, 60–61. [Google Scholar] [CrossRef]
  8. Sano, Y.; Takahata, N.; Igarashi, G.; Koizumi, N.; Sturchio, N.C. Helium degassing related to the Kobe earthquake. Chem. Geol. 1998, 150, 171–179. [Google Scholar] [CrossRef]
  9. Skelton, A.; Liljedahl-Claesson, L.; Wästeby, N.; Andrén, M.; Stockmann, G.; Sturkell, E.; Mörth, C.M.; Stefansson, A.; Tollefsen, E.; Siegmund, H.; et al. Hydrochemical Changes before and after Earthquakes Based on Long-Term Measurements of Multiple Parameters at Two Sites in Northern Iceland—A Review. J. Geophys. Res. Solid Earth 2019, 124, 2702–2720. [Google Scholar] [CrossRef]
  10. Martinelli, G.; Ciolini, R.; Facca, G.; Fazio, F.; Gherardi, F.; Heinicke, J.; Pierotti, L. Tectonic-Related Geochemical and Hydrological Anomalies in Italy during the Last Fifty Years. Minerals 2021, 11, 107. [Google Scholar] [CrossRef]
  11. Tsunogai, U.; Wakita, H. Precursory chemical changes in ground water: Kobe earthquake, Japan. Science 1995, 269, 61–63. [Google Scholar] [CrossRef] [PubMed]
  12. Hosono, T.; Yamada, C.; Manga, M.; Wang, C.Y.; Tanimizu, M. Stable isotopes show that earthquakes enhance permeability and release water from mountains. Nat. Commun. 2020, 11, 2776. [Google Scholar] [CrossRef] [PubMed]
  13. Zhou, X.; Wang, W.; Chen, Z.; Yi, L.; Liu, L.; Xie, C.; Cui, Y.; Du, J.; Cheng, J.; Yang, L. Hot Spring Gas Geochemistry in Western Sichuan Province, China After the Wenchuan Ms 8.0 Earthquake. Terr. Atmos. Ocean. Sci. 2015, 26, 361–373. [Google Scholar] [CrossRef] [Green Version]
  14. Papadimitriou, E.; Wen, X.; Karakostas, V.; Jin, X. Earthquake Triggering along the Xianshuihe Fault Zone of Western Sichuan, China. Pure Appl. Geophys. 2004, 161, 1683–1707. [Google Scholar] [CrossRef]
  15. Chen, Z.; Du, J.; Zhou, X.; Yi, L.; Liu, L.; Xie, C.; Cui, Y.; Li, Y. Hydrochemistry of the hot springs in western Sichuan province related to the Wenchuan MS 8.0 earthquake. Sci. World J. 2014, 2014, 901432. [Google Scholar] [CrossRef] [Green Version]
  16. Li, B.; Shi, Z.; Wang, G.; Liu, C. Earthquake-related hydrochemical changes in thermal springs in the Xianshuihe Fault zone, Western China. J. Hydrol. 2019, 579, 124–175. [Google Scholar] [CrossRef]
  17. Zhang, L.; Guo, L.; Zhou, X.; Yang, Y.; Shi, D.; Liu, Y. Temporal variations in stable isotopes and synchronous earthquake-related changes in hot springs. J. Hydrol. 2021, 599, 126–316. [Google Scholar] [CrossRef]
  18. Xu, L.; Rondenay, S.; van der Hilst, R.D. Structure of the crust beneath the southeastern Tibetan Plateau from teleseismic receiver functions. Phys. Earth Planet. Inter. 2007, 165, 176–193. [Google Scholar] [CrossRef]
  19. Zheng, G.; Wang, H.; Wright, T.J.; Lou, Y.; Zhang, R.; Zhang, W.; Shi, C.; Huang, J.; Wei, N. Crustal Deformation in the India-Eurasia Collision Zone From 25 Years of GPS Measurements. J. Geophys. Res. Solid Earth 2017, 122, 9290–9312. [Google Scholar] [CrossRef]
  20. Chen, Z.; Burchfiel, B.C.; Liu, Y.; King, R.W.; Royden, L.H.; Tang, W.; Wang, E.; Zhao, J.; Zhang, X. Global Positioning System measurements from eastern Tibet and their implications for India/Eurasia intercontinental deformation. J. Geophys. Res. Solid Earth 2000, 105, 16215–16227. [Google Scholar] [CrossRef]
  21. Tapponnier, P.; Peltzer, G.; Armijo, R. On the mechanics of the collision between India and Asia. Geol. Soc. Lond. Spec. Publ. 1986, 19, 113–157. [Google Scholar] [CrossRef]
  22. Xu, Z.; Li, H.; Tang, Z.; Qi, X.; Li, H.; Cai, Z. The transformation of the terrain structures of the Tibet Plateau through large-scale strike-slip faults. Acta Petrol. Sin. 2011, 27, 3157–3170. [Google Scholar]
  23. Xueze, W.; Allen, C.; Zhuoli, L.; Hong, Q.; Huawei, Z.; Weishi, H. Segmentation, geometric features, and their seismotectonic implications for the Holocene Xianshuihe fault zone. Acta Seismol. Sin. 1989, 11, 362–372. [Google Scholar]
  24. Liu, Z.; Yuan, D.; He, S.; Zhang, M.; Zhang, J. Geochemical features of the geothermal CO2-watercarbonate rock system and analysis on its CO2 sources. Sci. China Ser. D Earth Sci. 2000, 43, 569–576. [Google Scholar] [CrossRef]
  25. Zhang, J.; Li, W.; Tang, X.; Tian, J.; Wang, Y.; Guo, Q.; Pang, Z. Geothermal data analysis at the high-temperature hydrothermal area in Western Sichuan. Sci. China Earth Sci. 2017, 60, 1507–1521. [Google Scholar] [CrossRef]
  26. Liu, C.; Zheng, Y.; Ge, C.; Xiong, X.; Hsu, H. Rupture process of the M s7.0 Lushan earthquake, 2013. Sci. China Earth Sci. 2013, 56, 1187–1192. [Google Scholar] [CrossRef]
  27. Chen, Z.; Zhou, X.; Du, J.; Xie, C.; Liu, L.; Li, Y.; Yi, L.; Liu, H.; Cui, Y. Hydrochemical characteristics of hot spring waters in the Kangding district related to the Lushan MS = 7.0 earthquake in Sichuan, China. Nat. Hazards Earth Syst. Sci. 2015, 15, 1149–1156. [Google Scholar] [CrossRef] [Green Version]
  28. Baird, R.B.; Eaton, A.D.; Rice, E.W. Standard Methods for Examination of Water and Wastewater, 23rd ed.; American Public Health Association (APHA): Washington, DC, USA, 2017; American Water Works Association (AWWA): Camden, NJ, USA, 2017; Water Environment Federation (WEF): Washington, DC, USA, 2017. [Google Scholar]
  29. Zhang, Y.; Zhang, L.; Yang, C.; Fan, Z.; Guo, D. Determining Trace Elements in Rock Samples Containing Refractory Minerals by Pressurize-microwave Inductively Coupled Plasma Mass Spectrometry. Uranium Geol. 2018, 34, 105–111. [Google Scholar]
  30. Wang, P.; Song, X.; Han, D.; Zhang, Y.; Liu, X. A study of root water uptake of crops indicated by hydrogen and oxygen stable isotopes: A case in Shanxi Province, China. Agric. Water Manag. 2010, 97, 475–482. [Google Scholar] [CrossRef]
  31. Barbieri, M.; Franchini, S.; Barberio, M.D.; Billi, A.; Boschetti, T.; Giansante, L.; Gori, F.; Jonsson, S.; Petitta, M.; Skelton, A.; et al. Changes in groundwater trace element concentrations before seismic and volcanic activities in Iceland during 2010-2018. Sci. Total Environ. 2021, 793, 148635. [Google Scholar] [CrossRef]
  32. Pang, Z.; Kong, Y.; Li, J.; Tian, J. An Isotopic Geoindicator in the Hydrological Cycle. Procedia Earth Planet. Sci. 2017, 17, 534–537. [Google Scholar] [CrossRef]
  33. Kong, Y.; Wang, K.; Li, J.; Pang, Z. Stable Isotopes of Precipitation in China: A Consideration of Moisture Sources. Water 2019, 11, 1239. [Google Scholar] [CrossRef] [Green Version]
  34. Luo, J.; Pang, Z.; Kong, Y.; Wang, Y. Geothermal potential evaluation and development prioritization based on geochemistry of geothermal waters from Kangding area, western Sichuan, China. Environ. Earth Sci. 2017, 76. [Google Scholar] [CrossRef]
  35. Benavente, O.; Tassi, F.; Reich, M.; Aguilera, F.; Capecchiacci, F.; Gutiérrez, F.; Vaselli, O.; Rizzo, A. Chemical and isotopic features of cold and thermal fluids discharged in the Southern Volcanic Zone between 32.5°S and 36°S: Insights into the physical and chemical processes controlling fluid geochemistry in geothermal systems of Central Chile. Chem. Geol. 2016, 420, 97–113. [Google Scholar] [CrossRef]
  36. Clark, I.D.; Clark, I.D.; Clark, I.D. Environmental Isotopes in Hydrogeology: Boca; CRC Press/Lewis Publishers: Boca Raton, FL, USA, 1998; Volume 80, p. 532. [Google Scholar]
  37. Li, C.; Zhou, X.; Yan, Y.; Ouyang, S.; Liu, F. Hydrogeochemical Characteristics of Hot Springs and Their Short-Term Seismic Precursor Anomalies along the Xiaojiang Fault Zone, Southeast Tibet Plateau. Water 2021, 13, 2638. [Google Scholar] [CrossRef]
  38. Apollaro, C.; Vespasiano, G.; De Rosa, R.; Marini, L. Use of mean residence time and flowrate of thermal waters to evaluate the volume of reservoir water contributing to the natural discharge and the related geothermal reservoir volume. Application to Northern Thailand hot springs. Geothermics 2015, 58, 62–74. [Google Scholar] [CrossRef]
  39. Vespasiano, G.; Marini, L.; Muto, F.; Auque, L.F.; Cipriani, M.; De Rosa, R.; Critelli, S.; Gimeno, M.J.; Blasco, M.; Dotsika, E.; et al. Chemical, isotopic and geotectonic relations of the warm and cold waters of the Cotronei (Ponte Coniglio), Bruciarello and Repole thermal areas, (Calabria- Southern Italy). Geothermics 2021, 96, 102–228. [Google Scholar] [CrossRef]
  40. Tian, J.; Pang, Z.; Wang, Y.; Guo, Q. Fluid geochemistry of the Cuopu high temperature geothermal system in the eastern Himalayan syntaxis with implication on its genesis. Appl. Geochem. 2019, 110, 102–442. [Google Scholar] [CrossRef]
  41. Capo, R.C.; Stewart, B.W.; Chadwick, O.A. Strontium isotopes as tracers of ecosystem processes: Theory and methods. Geoderma 1998, 82, 197–225. [Google Scholar] [CrossRef]
  42. Palmer, M.R.; Edmond, J.M. Controls over the strontium isotope composition of river water. Geochim. Cosmochim. Acta 1992, 56, 2099–2111. [Google Scholar] [CrossRef]
  43. Wang, Y.; Chen, J.; Chen, L. Tracing Groundwater with Strontium Isotopic Compositions in the Hexi Corridor Basin, Northwestern China; Springer: Berlin/Heidelberg, Germany, 2009; pp. 184–187. [Google Scholar]
  44. Giggenbach, W.F. Geothermal solute equilibria. Derivation of Na-K-Mg-Ca geoindicators. Geochim. Cosmochim. Acta 1988, 52, 2749–2765. [Google Scholar] [CrossRef]
  45. Aiuppa, A.; Dongarra, G.; Capasso, G.; Allard, P. Trace elements in the thermal groundwaters of Vulcano Island (Sicily). J. Volcanol. Geotherm. Res. 2000, 98, 189–207. [Google Scholar] [CrossRef]
  46. Fournier, R.; Rowe, J. The deposition of silica in hot springs. Bull. Volcanol. 1966, 29, 585–587. [Google Scholar] [CrossRef]
  47. Fournier, R.; Potter, I. Revised and expanded silica (quartz) geothermometer. Bull. Geotherm. Resour. Counc. Davis Calif. U. S. 1982, 11, 55–70. [Google Scholar]
  48. Tonani, F. Some remarks on the application of geochemical techniques in geothermal exploration. In Advances in European Geothermal Research; Springer: Berlin/Heidelberg, Germany, 1980; pp. 428–443. [Google Scholar]
  49. Pang, Z.H.; Wang, J.Y.; Fan, Z.C. Calculation of reservoir temperature using a SiO2 mixing model, Zhangzhou geothermal-field, SE China. Chin. Sci. Bull. 1990, 35, 1360–1363. [Google Scholar]
  50. Tian, J.; Pang, Z.; Guo, Q.; Wang, Y.; Li, J.; Huang, T.; Kong, Y. Geochemistry of geothermal fluids with implications on the sources of water and heat recharge to the Rekeng high-temperature geothermal system in the Eastern Himalayan Syntax. Geothermics 2018, 74, 92–105. [Google Scholar] [CrossRef]
  51. Hosono, T.; Masaki, Y. Post-seismic hydrochemical changes in regional groundwater flow systems in response to the 2016 Mw 7.0 Kumamoto earthquake. J. Hydrol. 2020, 580, 124–340. [Google Scholar] [CrossRef]
  52. Wang, B.; Zhou, X.; Zhou, Y.; Yan, Y.; Li, Y.; Ouyang, S.; Liu, F.; Zhong, J. Hydrogeochemistry and Precursory Anomalies in Thermal Springs of Fujian (Southeastern China) Associated with Earthquakes in the Taiwan Strait. Water 2021, 13, 3523. [Google Scholar] [CrossRef]
  53. Hosono, T.; Yamada, C.; Shibata, T.; Tawara, Y.; Wang, C.Y.; Manga, M.; Rahman, A.T.M.S.; Shimada, J. Coseismic Groundwater Drawdown Along Crustal Ruptures During the 2016 M. w 7.0 Kumamoto Earthquake. Water Resour. Res. 2019, 55, 5891–5903. [Google Scholar] [CrossRef] [Green Version]
  54. Martinelli, G.; Facca, G.; Genzano, N.; Gherardi, F.; Lisi, M.; Pierotti, L.; Tramutoli, V. Earthquake-Related Signals in Central Italy Detected by Hydrogeochemical and Satellite Techniques. Front. Earth Sci. 2020, 8, 584–716. [Google Scholar] [CrossRef]
  55. Thomas, D. Geochemical precursors to seismic activity. Pure Appl. Geophys. PAGEOPH 1988, 126, 241–266. [Google Scholar] [CrossRef]
  56. Tokunaga, T. Modeling of earthquake-induced hydrological changes and possible permeability enhancement due to the 17 January 1995 Kobe Earthquake, Japan. J. Hydrol. 1999, 223, 221–229. [Google Scholar] [CrossRef]
  57. Cheng, J.; Liu, J.; Gan, W.; Yu, H.; Li, G. Characteristics of strong earthquake evolution around the eastern boundary faults of the Sichuan-Yunnan rhombic block. Sci. China Earth Sci. 2011, 54, 1716–1729. [Google Scholar] [CrossRef]
  58. Wang, M.; Shen, Z.K. Present-Day Crustal Deformation of Continental China Derived From GPS and Its Tectonic Implications. J. Geophys. Res. Solid Earth 2020, 125. [Google Scholar] [CrossRef] [Green Version]
  59. Ma, J. On whether earthquake precursors help for prediction do exist. Chin. Sci. Bull. 2016, 61, 409–414. [Google Scholar] [CrossRef] [Green Version]
  60. Zhou, X.; Yan, Y.; Fang, W.; Wang, W.; Shi, H.; Li, P. Short-Term Seismic Precursor Anomalies of Hydrogen Concentration in Luojishan Hot Spring Bubbling Gas, Eastern Tibetan Plateau. Front. Earth Sci. 2021, 8, 586279. [Google Scholar] [CrossRef]
  61. Paonita, A.; Caracausi, A.; Martelli, M.; Rizzo, A.L. Temporal variations of helium isotopes in volcanic gases quantify pre-eruptive refill and pressurization in magma reservoirs: The Mount Etna case. Geology 2016, 44, 499–502. [Google Scholar] [CrossRef]
  62. Sano, Y.; Takahata, N.; Kagoshima, T.; Shibata, T.; Onoue, T.; Zhao, D. Groundwater helium anomaly reflects strain change during the 2016 Kumamoto earthquake in Southwest Japan. Sci. Rep. 2016, 6, 37939. [Google Scholar] [CrossRef]
  63. Ai, Y.; Zhang, J.; Dong, M.; Wang, B.; Fang, G. Heat generation effects from shear friction along Xianshui river strike-slip fault in western Sichuan, China. Geothermics 2021, 89, 101936. [Google Scholar] [CrossRef]
  64. Claesson, L.; Skelton, A.; Graham, C.; MÖRth, C.M. The timescale and mechanisms of fault sealing and water-rock interaction after an earthquake. Geofluids 2007, 7, 427–440. [Google Scholar] [CrossRef]
Figure 1. The plot of sampling site distribution. (a) Localization of the area of this study; (b) Topographic map in the XSHF. XSHF: Xianshuihe fault; LMSF: Longmenshan fault; (c) Geological map in the XSHF.
Water 14 00550 g001
Figure 2. Stable oxygen and hydrogen isotope of the 43 hot springs and their correlations with GMWL and LMWL. LMWL: δD = 8.41δ18O + 16.72 [33]. (a) Hydrogen and oxygen isotope distribution of all hot spring sites in the study area. (b) The distribution of hydrogen and oxygen isotopes at the hot spring sites that were measured after the 12 May 2008 Wenchaun Ms8.0 and 20 April 2013 Lushan Ms7.0, respectively. The rosy symbol represented samples collected after the 20 April 2013 Wenchaun Ms8.0 and the sky-blue symbol stands for samples collected after the 20 April 2013 Lushan Ms7.0.
Water 14 00550 g002
Figure 3. Piper diagram showing major ion chemistry of the sampled points.
Water 14 00550 g003
Figure 4. Correlation plot of Na+ + K+ vs. Ca2+ + Mg2+ for the spring water samples along XSHF, also showing iso-ionic-salinity lines for reference.
Water 14 00550 g004
Figure 5. Strontium isotopic composition of 43 hot springs in XSHF.
Water 14 00550 g005
Figure 6. Distribution of aqueous samples on the Na/1000-K/100-Mg1/2 ternary diagram.
Water 14 00550 g006
Figure 7. Saturation indices values of groundwater samples with respect to minerals.
Water 14 00550 g007
Figure 8. The spatial distribution of temperature, the depth of circulation of 43 hot springs and slip rates, magnitudes and focal depths in the XSHF. The different colours represent different areas of the Xianshui River Fault Zone, with blue representing the Zhuwo and Luhuo segment, Green representing the Daofu segment, Rose representing the Bamei segment, Light red representing the Kangding segment, Orange representing the Moxi segment.
Water 14 00550 g008
Figure 9. Temporal variations of concentration of Na+, Cl, SO42−, δD, δ18O and earthquake: (a) is the Erdaoqiao spring (W30); (b) is the Guanding spring (W34); (c) is the Longtougou spring(W31); (d) is the Mugecuo spring (W27) and (e) is the Xinxingxiang spring (W37), Blue bars show the near-field earthquakes within 50 km and magnitude range from ML1.0 to ML3.0. Red bars show the far-field earthquakes within 300 km and magnitude range over ML3.0. Hydrogen and oxygen isotope data for 2019–2020 in the figure are from Zhang et al. (2021) [17].
Water 14 00550 g009
Figure 10. Conceptual model of the origin of groundwater and the hydrogeochemical cycling process in the XSHF.
Water 14 00550 g010
Table 1. Location of the surveyed area of hot spring in the XSHF.
No.SiteLongitudeLatitudeAltitudeStructural Location
(°)(°)(km)
W1Niku100.2531.793293Zhuwo and Luhuo segment
W2Kale100.2931.763995
W3Goudi100.4331.583441
W4Shawan100.4631.543447
W5Ridu100.7231.583352
W6Luhuoguyicun100.831.273102
W7Nilachatuo100.931.333511
W8Jinka100.9231.173131
W9Benglong101.0131.083007Daofu segment
W10Niri101.0231.07----
W11Wakamu101.0831.013050
W12Xinjianggou101.131.063258
W13Qimei member1101.1731.183889
W14Jiazong101.1831.283686
W15Qimei member2101.1831.143941
W16Loho Hot Springs ReWort101.2430.953392Bamei segment
W17Longpugou member1101.2430.953392
W18Longpugou member2101.2430.953373
W19Canglonggou101.2930.863540
W20Danba101.431.043665
W21Kama101.5330.493622Kangdign segment
W22Bameihaoniu member1101.6230.543467
W23Bameihaoniu member2101.6230.553570
W24Yalashenshan101.8430.283217
W25Zheduotang101.8630.013245
W26Zhonggu101.8730.273095
W27Mugecuo101.8730.173565
W28Washangfang101.8830.253066
W29Yala101.8830.253027
W30Erdaoqiao101.9530.093003
W31Longtougou101.9629.982968
W32Kuaishuang101.9629.972878
W34Guanding101.9629.953027
W35Kangdingzk1101.9629.962978
W33Gongjiagou101.9629.392492Moxi segment
W36Erhaoyingdi102.0329.592672
W37Xinxingxiang102.0629.752234
W38Caoke102.129.391954
W39Gonghe102.1129.621601
W40Luding102.1129.621601
W41Wandong102.1429.541311
W42Tianwanhekou102.1429.492089
W43Whimiandizhentai102.2229.44977
Table 2. The data of silicon dioxide, strontium and strontium isotope from hot springs.
NO.SiO2
(mg/L)
Sr
(μg/L)
87Sr/86Sr
(‰)
W13.6224.000.711059
W23.571.100.708004
W34.6164.000.709966
W41259.000.714769
W58.82313.000.715018
W6924.00
W71639.000.714765
W812.45189.000.715205
W91773.00
W104.62062.000.714804
W117.6255.000.711686
W12981.000.716574
W13584.90
W14660.20
W15386.60
W162075.000.711284
W1720.51434.000.713561
W1825.31302.000.713566
W1921.61306.000.714624
W2015.99
W2134.9568.000.712532
W2223.94092.000.716061
W2354.81739.000.708563
W2443.41124.000.707432
W25182.000.707982
W2646.0747.000.713419
W2776.3436.000.707290
W2859.71073.000.713503
W2951.4988.000.713756
W3019.81208.000.710813
W3141.41116.000.713452
W32224.00
W3479.91001.000.710176
W35
W3336.1818.000.710616
W3660.5351.000.712110
W37549.000.709801
W3819.52184.000.708619
W3920.9663.000.710776
W4027.3833.00
W4120.13024.000.709245
W4245.0978.000.711021
W4311.9
“—” represent no data.
Table 3. Apparent equilibrium temperatures were computed through multi-geothermometers for the samples collected from the thermal springs of XSHF.
NO.SiO2
(°C)
K-Mg
(°C)
Na-K
(°C)
Temperature
(°C)
Reservoir
Temperature (°C)
Circulation
Depth
(km)
Structural Location
W19.548.7199.810.09.50.2Zhuwo and Luhuo segment
W28.389.3257.225.08.30.1
W316.165.7234.026.216.10.5
W423.5141.511.082.53.7
W535.320.6195.319.735.31.4
W620.9133.137.577.03.5
W753.421.9150.139.975.23.4
W846.440.1165.616.546.42.0
W954.9230.914.3142.96.7Daofu segment
W1015.965.5303.215.315.90.5
W1130.580.4200.812.630.51.2
W1215.1152.052.083.53.8
W1320.4194.351.5107.45.0
W1416.5224.135.4120.35.6
W1517.8205.553.0111.75.2
W1614.6131.042.872.83.3Bamei segment
W1764.430.4160.941.064.42.8
W1872.520.9163.139.672.53.2
W1966.423.0264.339.666.42.9
W2017.8206.873.0112.35.2
W2185.821.5288.232.085.83.9Kangding segment
W2270.3−1.6275.855.070.33.1
W23106.1−6.0216.572.0106.14.9
W2495.39.7211.739.095.34.4
W259.4119.135.064.32.8
W2698.04.9237.252.098.04.5
W27122.60.7217.074.7122.65.7
W28110.34.2228.156.0110.35.1
W29103.18.6229.755.4103.14.7
W3063.118.9275.540.563.12.8
W3193.23.2237.072.093.24.3
W32−6.0240.772.0117.45.4
W34125.01.4250.775.8125.05.8
W35−31.3256.782.0112.75.2
W3387.217.8284.940.887.24.0Moxi segment
W36110.94.1253.175.3110.95.1
W3722.3152.447.087.34.0
W3862.528.5236.145.762.52.8
W3965.129.4233.357.065.12.9
W4075.625.9222.557.275.63.4
W4163.68.3250.665.363.62.8
W4297.022.4307.750.697.04.4
W4345.032.5156.135.045.01.9
“—” represent no data.
Table 4. The occurrence time of precursory and post-seismic anomalies in the continuous monitoring sites before three earthquakes.
Monitoring SitesChanges2008 Wenchuan Ms8.02013 Lushang Ms7.02014 Kangding Ms6.3
Post-Seismic
Anomalies
Post-Seismic
Anomalies
Precursory
Anomaly
Postseiscxxx
Anomalies
W25Na+(%)↑6.0↑5.2↑8.0↑7.6
Cl↑21.4↑2.9↓7.8↑15.8
Epicenter distance(km)19011433
W27Na+(%)↑5.4↑10.0
Cl↑28.2↑44.8
SO42↑14.7↑15.9
Epicenter distance(km)17911016
W30Na+(%)↑1.5↑5.3↑7.4↓2.8
Cl↑9.1↑8.4↑22.6↓12.1
SO42↑6.4↓2.8↑19.8↑2.0
δD↑1.9↑0.2
δ18O↓3.1↑10.3
Epicenter distance(km)17810428
W31Na+(%)↓0.1↓1.0↓1.8↑0.4
Cl↓1.2↓1.4↑27.7↓3.3
SO42
δD↑2.3↑0.1
δ18O↑2.5↓23.1
Epicenter distance(km)18610639
W34Na+(%)↑16.5↑1.6↓7.8↓4.7
Cl↑28.4↑0.0↑35.6↓17.2
SO42↑2.2↑3.9↑16.9↑3.5
δD↑3.9↑2.1
δ18O↓0.4↓2.1
Epicenter distance(km)18810742
W36Na+(%)↓4.2↑16.1↓15.2↑17.5
Cl↑0.5↑20.0↑13.8↑22.5
Epicenter distance(km)21412382
W37Na+(%)↑32.4↓11.9↓12.9↓7.6
Cl↑37.4↓23.0↑14.4↓18.1
SO42↑52.1↑8.5↓18.9↓5.3
Epicenter distance(km)19810966
W39Na+(%)↑10.8↓5.3↓19.7↓15.9
Cl↑23.9↓8.0↓8.7↑1.1
Epicenter distance(km)20711481
W43Na+(%)↑7.3↓2.8↓0.3↓2.0
Cl↑1.2↓7.9↑4.6↑8.8
Epicenter distance(km)218122105
‘—’ represents not over anomaly threshold.
Publisher’s Note: MDPI stays neutral with regard to jurisdictional claims in published maps and institutional affiliations.

