Article

Effects of Agriculture and Animal Husbandry on Heavy Metal Contamination in the Aquatic Environment and Human Health in Huangshui River Basin

1
School of Environmental Science and Engineering, Shandong University, Qingdao 266237, China
2
Shandong Lunan Institute of Geological Engineering Survey, Yanzhou 272100, China
3
Shandong Provincial Eco-Environment Monitoring Center, Jinan 250101, China
*
Author to whom correspondence should be addressed.
Water 2022, 14(4), 549; https://doi.org/10.3390/w14040549
Submission received: 9 January 2022 / Revised: 6 February 2022 / Accepted: 8 February 2022 / Published: 12 February 2022
(This article belongs to the Section Water Quality and Contamination)

Abstract

:
Huangshui River (HSR) is the mother river of Qinghai province. Croplands and grasslands cover more than 76% of the total area, and highland agriculture and animal husbandry are the dominant industries. The use of pesticides, fertilizers, and feed additives increases the risk of heavy metal (HM) contamination. In this study, the concentration of HMs in the main stream and tributaries of HSR were investigated. The Positive Matrix Factorization model was used for source apportionment, and Health Risk Assessment method was used to assess the human health risks. To further analyze the effect of agriculture and animal husbandry on aquatic environment and human health, we considered agriculture and animal husbandry as two factors in the source apportionment process, defined the effect of the factors, established the calculation formula, and quantified the effects. The results show that the overall situation of aquatic environment in HSR is good; natural processes, traffic tail gas and atmospheric deposition, agricultural planting, industrial wastewater discharge, and animal husbandry are the main sources of HMs in the water. These HMs present noncarcinogenic and carcinogenic risks for infants. A total effect of agricultural and animal husbandry on HMs or HI in HSRB is approximately 20%, while on TCR is 40%. However, the effects of agriculture on the hazard quotient of arsenic, carcinogenic risk of nickel and lead, and that of animal husbandry on carcinogenic risk of cadmium were significant. This study can provide a theoretical basis for local managers of agriculture and animal husbandry to perform their work effectively.

1. Introduction

There is a direct relationship between agricultural chemical use and pollution of groundwater and surface water, which is a major concern in most countries in the world [1]. In the process of promoting China as an agricultural power, the excessive use of pesticides and fertilizers has led to the intensification of agricultural non-point source pollution. As a result, industrial point source pollution has been controlled, and non-point source pollution has become the main source of water pollution in China [2]. Most of these pollutants come from agricultural resources such as agricultural cultivation, animal excrement, and aquaculture [3,4,5]. Chemical pesticides are mainly used in China, with widespread use of arsenic in insecticides, fungicides, and herbicides [6]. Moreover, the heavy metal (HM) content in phosphate fertilizers is very high [7], and additives containing HMs, such as copper and zinc, are often added to animal feed [8]. If people use animal manure as fertilizer or pile it in the natural environment, these HMs will enter the surface and ground water with the manure, causing HM pollution.
HMs are metals with a density greater than 5 g/cm3, including chromium (Cr), nickel (Ni), copper (Cu), zinc (Zn), lead (Pb), mercury (Hg), cadmium (Cd), cobalt (Co), and arsenic (As, which is a metalloid but is usually classified as a HM) [9,10]. HM pollution includes environmental pollution caused by HMs and their compounds. In the natural environment, most of the harmful HMs become stable by going through a series of physical, chemical, or biological transformations to exist in the environment for a longer time [11]. In recent years, due to the rapid development of industry and urbanization, HM pollution has substantially increased in China and the world [12]. The characteristics of HM pollution are toxicity, persistence, nondegradability, bioavailability, and bioaccumulation [13,14]. The accumulation of HMs can lead to soil and water degradation, ecosystem failure, and a threat to human and animal health by entering the food chains. HM pollution has affected 80.1% of lakes in China to varying degrees [12].
HMs in the aquatic environment can migrate, transform, and combine with various substances to form complexes, posing exposure risks to the population and environment [15,16,17]. Hg, As, Cu, Cr, Pb, Zn, and Cd can directly affect human health by affecting the food chain [18,19]. Exposure to these HMs through skin absorption, inhalation, and direct ingestion can lead to serious diseases such as hypertension, renal insufficiency, and cancer [20,21]. The distribution of cancer in villages in China is significantly correlated with the distribution of HM pollution [22]. Therefore, it is important to analyze the sources and health risks of HMs in the aquatic environment [18,23].
In 2018, Y. Huang et al. [24] investigated the soil pollution of As, Cd, Hg, and Pb in the surrounding areas of southeastern China, and found that 50% of Pb and As, and approximately 33% of Cd, came from anthropogenic emissions. Huang et al. [25] found that chronic soil exposure from food intake had significant adverse effects on human health, and 87.5% of the health risks came from food consumption, with significant differences in health risks among different cropping systems. As for pollution caused by agricultural production, most of the literature focuses on soil HM pollution and risk assessment, while studies focused on tracing the source of water HMs are limited. Keskin [1] studied the water pollution in Eskimpazar, Turkey and its surrounding areas, and observed that the use of chemical fertilizers and pesticides in agricultural activities is the primary reason for the pollution of Cr, Mn, Fe, Cu, Zn, and Hg. Muhammad et al. [26] investigated the content of HMs in the drinking water of the Kohistan region in northern Pakistan and found that the concentration of HMs had no health risk to the local population. Moreover, they observed that geological activities and human activities were the main sources of water pollution in the Kohistan region. The agricultural activities mentioned in the literature mainly refer to agricultural planting, while research on animal husbandry is missing. Studies on the relationship between HM pollution and human health risk in agriculture, animal husbandry, and water bodies are limited.
The Huangshui River (HSR) is an important tributary of the upper reaches of the Yellow River, located in the east of Qinghai Province, China. It is called the “mother river” of Qinghai province. The upstream Halejing river, and the tributary Beichuan river upstream are drinking water sources. The HSR is also the main irrigation water source of the basin. The HSR Basin (HSRB) is home to approximately 70% of the total population and 62% of the cropland in Qinghai. It is an important agricultural and animal husbandry production base. In the HSRB, 1294.64 tons of pesticides were used in 2017, and 387.17 kg/hm2 of chemical fertilizer was used in 2018, exceeding the international safety limit of 225 kg/hm2 set to prevent water pollution. In 2017, there were more than 400 cattle, sheep, and chicken farms in the basin, and the total number of livestock and poultry stocks exceeded 20 million. The non-point source pollution caused by animal husbandry is relatively severe.
Currently, studies in the HSRB mainly focus on groundwater chemical evolution, spatiotemporal changes of nitrogen and phosphorus in water, and ecological footprint analysis of water pollution [27,28,29]. There are no reports on the characteristics of HM pollution in surface water, especially the source analysis, and risk assessment of HM pollutants in the aquatic environment for human health. Based on the characteristics of the HSRB, we investigated the HM concentrations in the water bodies of the main stream and three tributaries of the HSR. The relationship between HM pollution in the aquatic environment and agricultural and animal husbandry activities was analyzed by source apportionment. The potential risk of HM pollution to human health was identified by the health risk assessment (HRA). To better understand the impact of agriculture and animal husbandry on water bodies and human health, we considered agricultural planting and animal husbandry as two factors in the source apportionment process, defined the effect of the factors, and established a calculation formula to quantify the impact, which can provide a theoretical basis for local managers to carry out their work effectively.

2. Materials and Methods

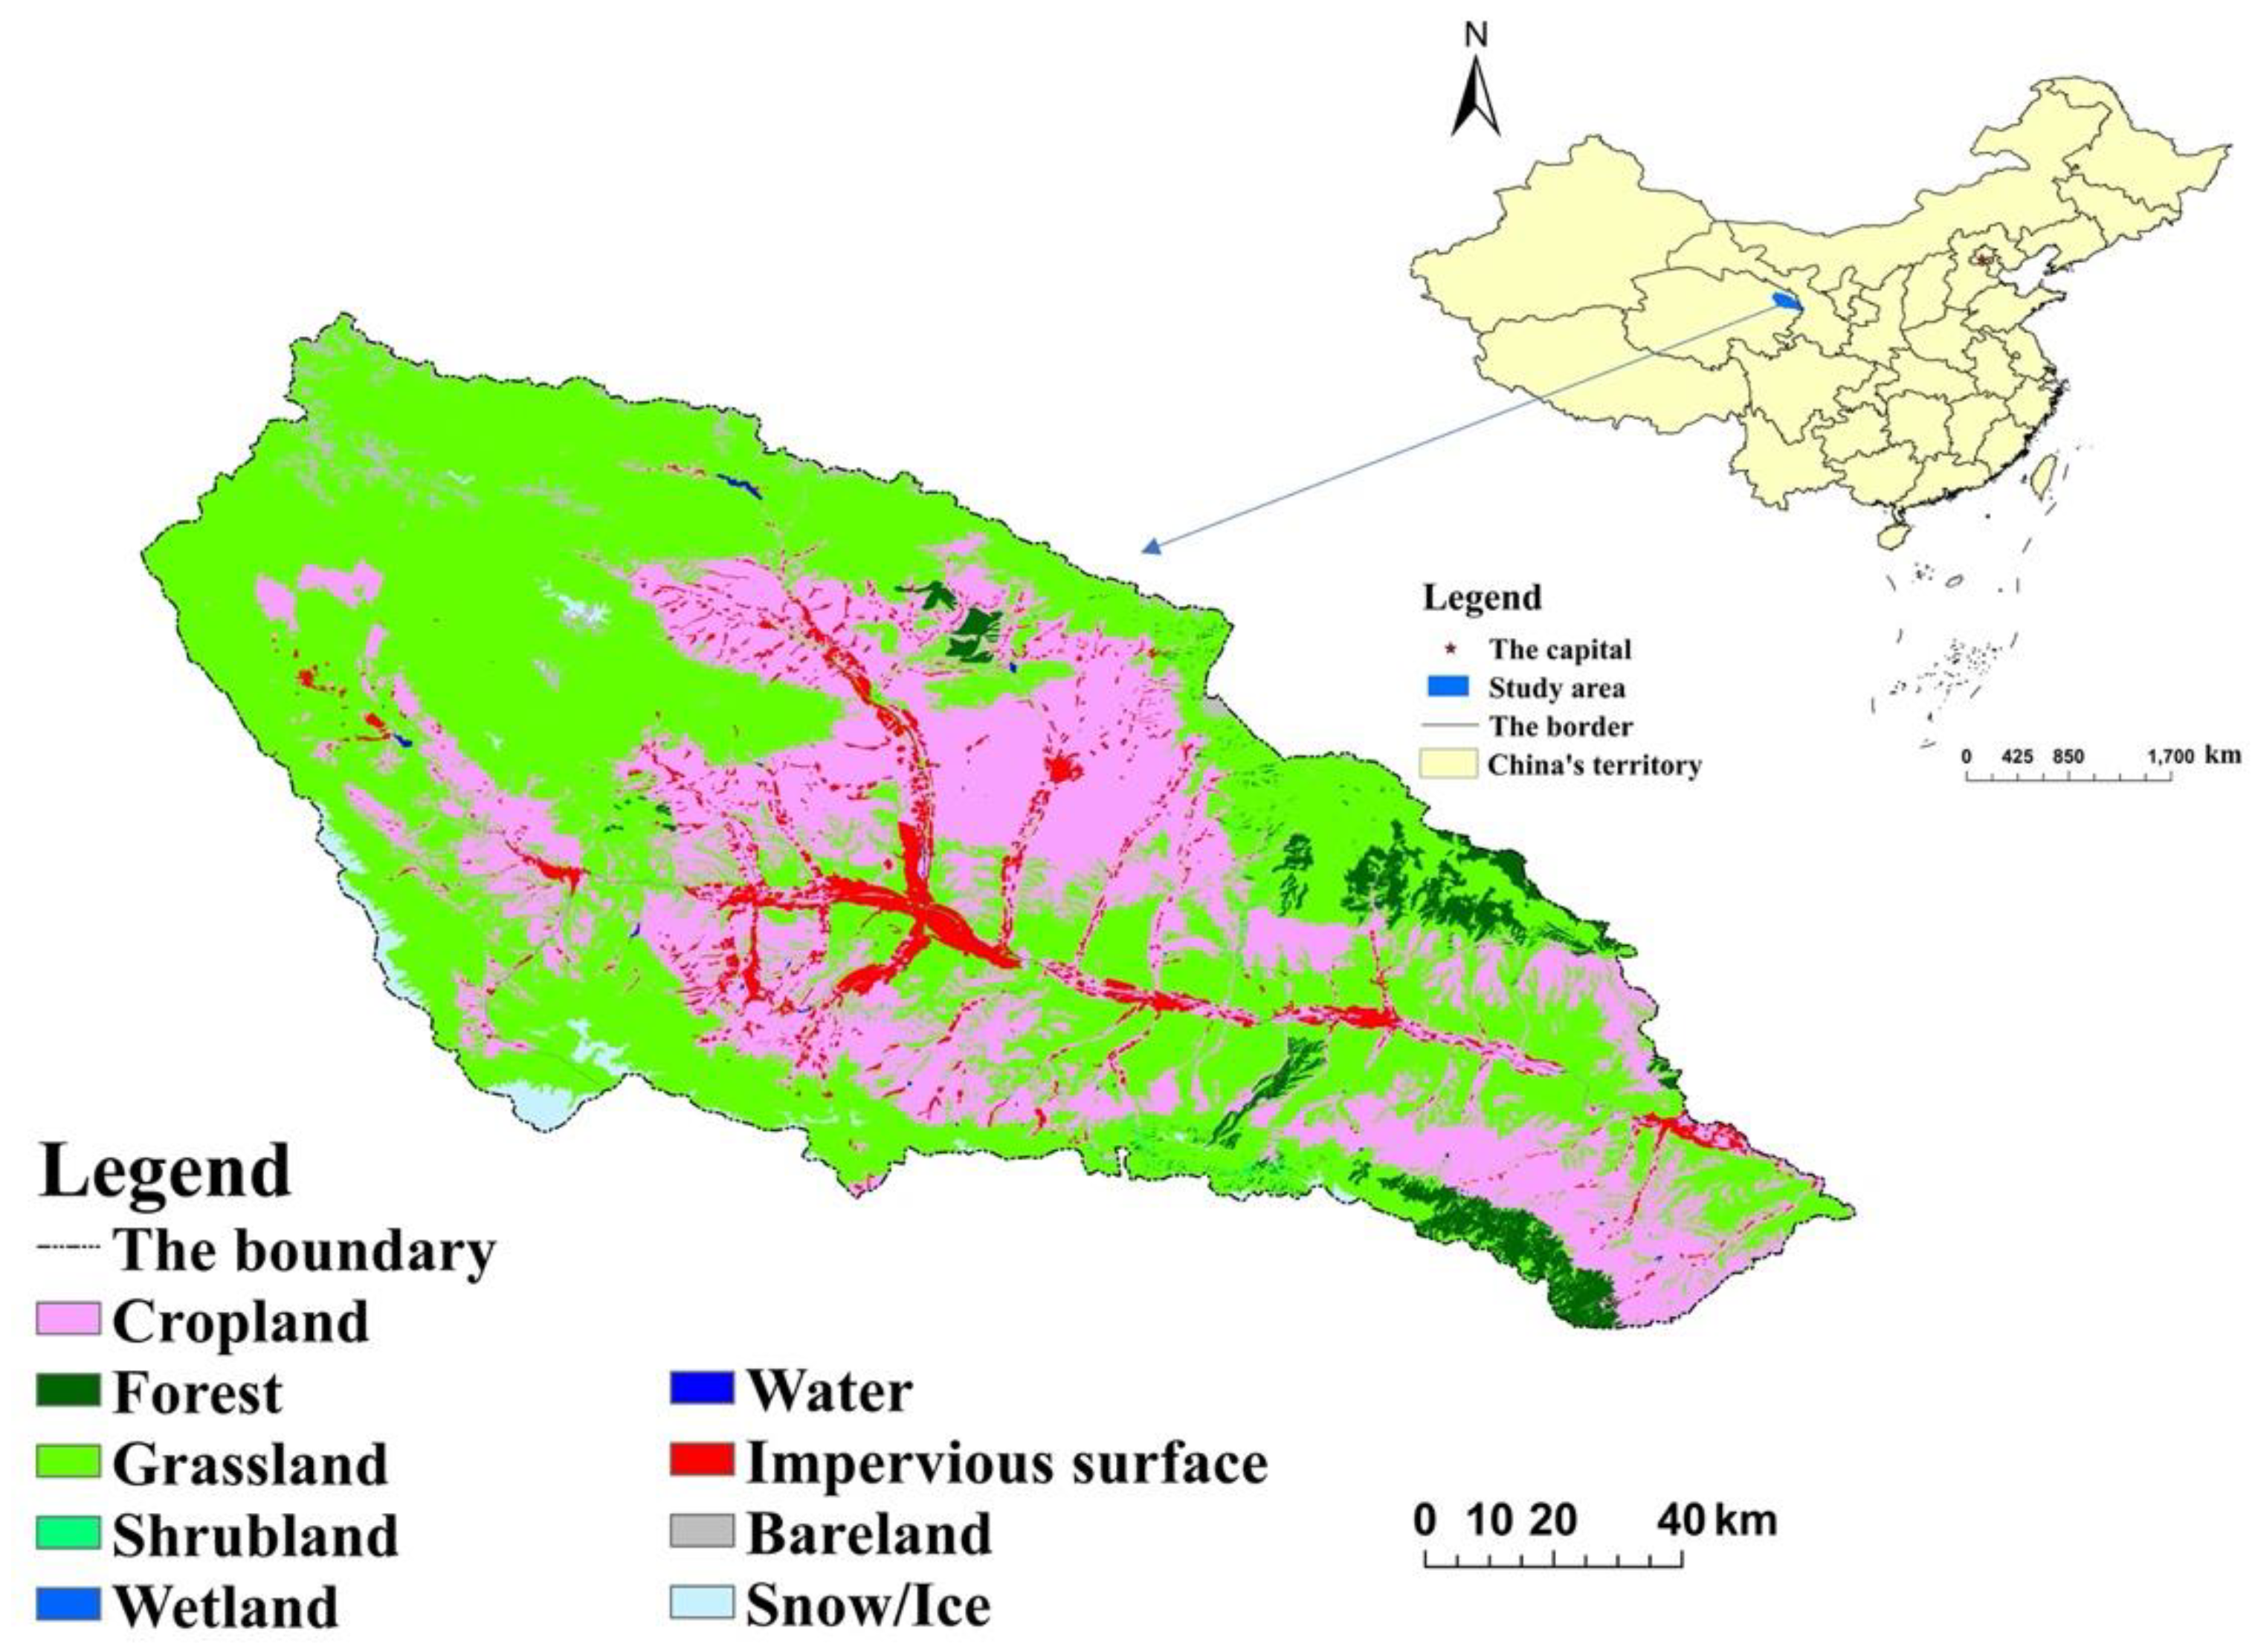
2.1. Study Area and Data Source

HSRB is located between 100°42′ and 103°4′ E and 36°2′ and 37°28′ N. HSR rises in Haibei Prefecture, Qinghai Province, flows west to east through Xining and Haidong city, and joins the Yellow River in Yongdeng County, Gansu Province. The river length in Qinghai province is 336 km, with a river area of 1.61 km2 and an annual average runoff of 1.62 billion m3. The altitude ranges from 1576 m to 5142 m and the terrain gradually lowers from northwest to southeast, forming a beaded and feathery water system. The HSRB has a semi-arid type of climate with an annual average temperature of 2.7–7.8 °C and an annual average precipitation of 486.6 mm, which is unevenly distributed in space. The annual precipitation in a long narrow ringlike area formed by the main stream between Xining and Haidong is 250–350 mm, and in the surrounding mountainous area is more than 600 mm. The precipitation of HSRB is concentrated from April to September, and the evaporation is generally concentrated from May to July. The annual average surface evaporation is 889.3 mm, and the evaporation decreases with the increase in altitude. Figure 1 shows the geographical location of the study watershed and the land use type in 2020 (data from GlobeLand30; http://www.globallandcover.com (accessed on 20 October 2021)).
The HSRB is mainly cropland and grassland. The total area of the HSRB is 16,119.59 km2, with the cropland area accounting for 32.50% (5239.76 km2) and the grassland area accounting for 43.73% (7048.33 km2) of the total area. There is a river area with broken land, good temperature conditions, and intensive crop plantations on both sides of the HSR. Both of them are irrigated lands, mainly planted with spring wheat, spring corn, spring rape, spring beans, and antiseason plastic-film vegetables, and use significant amounts of agricultural materials per unit area. The mountains on both sides of the valley are shallow mountain areas with dry land, which allows dry farming, mainly planting full-film corn, spring wheat, plastic-film potatoes, spring rape, spring beans, and flax. The mountain areas higher than the valley are also mostly dry land and are mainly used for growing highland barley and forage grass crops. Application of fertilizer mainly includes nitrogen, phosphate, and compound fertilizers such as carbamide, urea, and diammonium phosphate. Fertilizers contain HMs such as As, Cd, Cr, Pb, and Hg [30,31]. A large amount of Pb is present in phosphate fertilizers, mainly because the raw material of phosphate fertilizer production is naturally associated with Pb. Pesticide use includes glyphosate, trifluralin, and other herbicides, insecticides, and fungicides. Urea is also used as a feed additive, which can strengthen the nutritional value of basic feed, ensure animal health, and save feed costs. Feed additives often contain Pb, Cd, Cr, As, and other HM trace elements [32].
The majority of the research data in this paper were obtained through field investigations and laboratory testing. The statistical analysis software includes Microsoft Excel 2016 and IBM SPSS 26. The source apportionment software was EPA PMF 5.0. The images were acquired from ESRI ArcGIS 10.7.

2.2. Sampling and Experimental Methods

According to the distribution of water system and pollution sources of HSR, and referring to the national, provincial, and municipal monitoring requirements for surface water in the HSRB, a total of 15 sampling points were set up, including 8 in the main stream, 2 in the tributary Halejing River, 4 in the Beichuan River, and 1 in the Donggou River (Figure 2). The research team collected three samples each on 18 April, 9 July, and 18 October, 2021. The sampling process was strictly in accordance with the Technical Specifications Requirements for Monitoring of Surface Water and Waste Water (HJ/T91-2002) [33]. According to Environmental Quality Standards for Surface Water (GB3838-2002) [34], Cr, Ni, Cu, Zn, Cd, Co, and Pb are required to be determined for soluble content, while the total content of As and Hg is required. Two samples were taken. One sample, which was used to measure the soluble content is filtered through the water microporous filter membrane (0.45 μm) immediately after collection. The initial 100 mL filtrate was discarded. After the sample collection, nitric acid was added to adjust hydrogen ion concentrations (pH < 1) for cold storage, and the samples were immediately sent to the laboratory for detection or pretreatment. Filtered samples were directly detected. Digestion is required before the total content determination. For sample digestion, 5.0 mL of 50% nitric acid was added to 100 mL sample, which was then placed on an electric heating plate. The sample was heated to dry it without boiling. The sample was removed from the heating plate and left to cool. After cooling, nitric acid and a small amount of experimental water were added, and the sample was again heated on a hot plate to dissolve the residue. The process was repeated until the color of the sample solution became lighter or stable. Finally, a constant volume of experimental water was added to the original sample volume to maintain a 1% (volume ratio) nitric acid acidity of the solution. After the treatment, the concentrations of Cr, Ni, Cu, Zn, Cd, As, Hg, Co, and Pb were detected by the iCAP 7000 (Thermo Fisher, Dreieich, Germany) with ASX 560 (Teledyne CETAC Technolo-gies, Omaha, NE, USA).

2.3. PMF Model

In the past few decades, receptor model methods including multivariate statistical analysis (MSA), multiple linear regression (MLR), and Positive Matrix Factorization (PMF) have been used to analyze the sources of HM pollution [35]. MSA methods include correlation analysis, principal component analysis (PCA), and cluster analysis (CA). Correlation analysis is used to analyze the interactions between different elements [36]. PCA and CA can classify pollutants and characterize HM pollution by extracting principal components [37]. However, they could not draw quantitative conclusions [38]. The MLR method can analyze the quantitative sources of environmental pollutants [39], but there are few identified sources recorded, which makes it difficult to explain complex pollution. PMF is more accurate in source allocation than MLR [40,41,42], and is mainly used to analyze the air pollution sources [43] and lake and groundwater pollution sources [42]. However, it has been applied to analyze the sources of HM in agricultural soil in recent years [35,43,44].
The PMF is one of the most widely used receptor models recommended by the United States Environmental Protection Agency (USEPA) and was developed by Dr. Paatero of the University of Helsinki, Finland [45,46]. It estimates the composition of pollution sources and their contributions to environmental concentrations based on a large number of observations at recipient points. It is a matrix decomposition method that integrates error estimates from data to solve constrained weighted least squares linear models. The sampled data is regarded as a matrix composed of multiple samples and multiple elements, which can be divided into two components: the spectrum matrix and the contribution matrix of pollution sources. The goal of the PMF analytical model is to find the component spectrum matrix (f) of pollution sources and the contribution matrix (g) of pollution sources in each sample [47]. The measured mass concentration xij of sample ij can be expressed as:
x i j = k = 1 p g i k f k j + e i j
where, p is the number of pollution sources, k ∈ [1, p] denotes that k belongs to the set [1, p], and eij is the residual between the measured mass concentration of the ij sample and its analytical value [47]. The PMF defines the sum of all residuals of sample eij and its uncertainty uij ratio as the objective function Q:
Q = i = 1 n   j = 1 m [ x i j k = 1 p g i k f k j u i j ] 2
where, n is the number of samples, i ∈ [1, n], m is the number of elements, j∈ [1, m], and uij is the uncertainty. uij is calculated as:
u i j = { 5 6 × M D L ,                                                 c M D L ( δ + c ) 2 + M D L 2 ,             c > M D L
where, MDL is the method detection limit, δ is the relative standard deviation, and c is the element content. The uncertainty mainly comes from the uncertainty brought by the sample collection, the instruments used, and the uncertainty of the concentration of the sample itself. Theoretically, data uncertainty can be reduced by parallel sampling [48].

2.4. HRA Method

The HRA is an evaluation method that links environmental pollution with human health to quantitatively describe the health risks to the people exposed to the polluted environment [49,50]. It uses internationally recognized procedures and standards introduced by the USEPA, which consist of four steps: hazard identification, dose-effect analysis, deterministic assessment, and risk characterization [51]. This paper refers to the USEPA model published in 2002, including carcinogenic risk assessment and noncarcinogenic risk assessment. Exposure is mainly through oral ingestion, respiratory inhalation, and skin contact [52]. Previous studies have attempted to estimate the human health risks associated with bathing and the factors influencing these risks, but the results of these studies have not been conclusive [49,53]. Only oral exposure was considered in this study. The formula for daily exposure dose ADD is as follows:
A D D = C × I R × E F × E D BW × AT
where, C is the measured value of the indicator element (mg/L), IR is the daily oral water intake (L/d), EF is the exposure frequency (d/a), ED is the exposure period (a), BW is the average body weight (kg), and AT is the average time of noncarcinogenic and carcinogenic effect (d). The infants, children, teenagers, and adults were evaluated, and the respective values of each factor are shown in Table 1.
In this study, the non-carcinogenic and carcinogenic risks of HMs were assessed using hazard index (HI) and total cancer risk (TCR) methods [52]. HI is calculated by:
H I = j = 1 m H Q j = j = 1 m A D D j R f D j
where HQj is the noncarcinogenic risk of element j and RfDj is the reference dose (mg/(kg·d)) of element j under this exposure pathway, as shown in Table 2. The value of hazard quotient (HQ) or HI < 1, indicates no noncarcinogenic health risk, and the higher the value, the higher the risk is. The calculation formula for TCR is as follows:
T C R = C R j = A D D j × S F j
where, CRj is the carcinogenic risk index of the carcinogenic element j and SFj is the reference dose (mg/(kg·d)) of carcinogenic element j under this exposure pathway, as shown in Table 2. According to the carcinogenic characteristics of HMs, Cr, Ni, Cd, As, and Pb were considered as carcinogenic elements. Carcinogenic risk is considered when the value of TCR or CR is >10−4; values of 10−6 < TCR or CR < 104, indicates an acceptable carcinogenic risk exists and values of TCR or CR < 106, indicates no carcinogenic risk.

2.5. Effects Calculation

In this study, the ratio of factor contribution to total contribution of all factors is defined as factor effect (E, %), and the calculation formula is:
E = C f T C × 100 %
where, Cf is the contribution value of the factor and TC is the total contribution value. The effects of agricultural planting or animal husbandry on HM, HI, TCR, and HM elements at risk were calculated. Among them, water HM and HI have the same effect results, because they both consider the contribution of all the elements. TCR only considers carcinogenic HM elements, and the effect of factors on TCR is calculated as:
E T C R = C f T C c a n c e r × 100 %
The effect of factor on each element is calculated as:
E j = C f T C j × 100 %

3. Results

3.1. Descriptive Statistics

The statistics of 9 HMs are shown in Table 3. Except for Hg, the concentrations of all elements were more than the class 3 limits of Environmental Quality Standards for Surface Water (GB3838-2002) [34]. In the samples taken on April 18, the concentration of Hg at some points exceeded the limits of class 3, but it was still within the limits of class 4. According to the standard, the water of class 1, 2, and 3 can be used for drinking after treatment. The overall situation of water in HSR is good. Relative standard deviation (RSD) values of all HM elements were greater than 50%, and the RSD of Ni even reaches 211.65%, indicating that the detection results of each point are quite different, and there are local sources leading to the spatial diversity of these HMs.

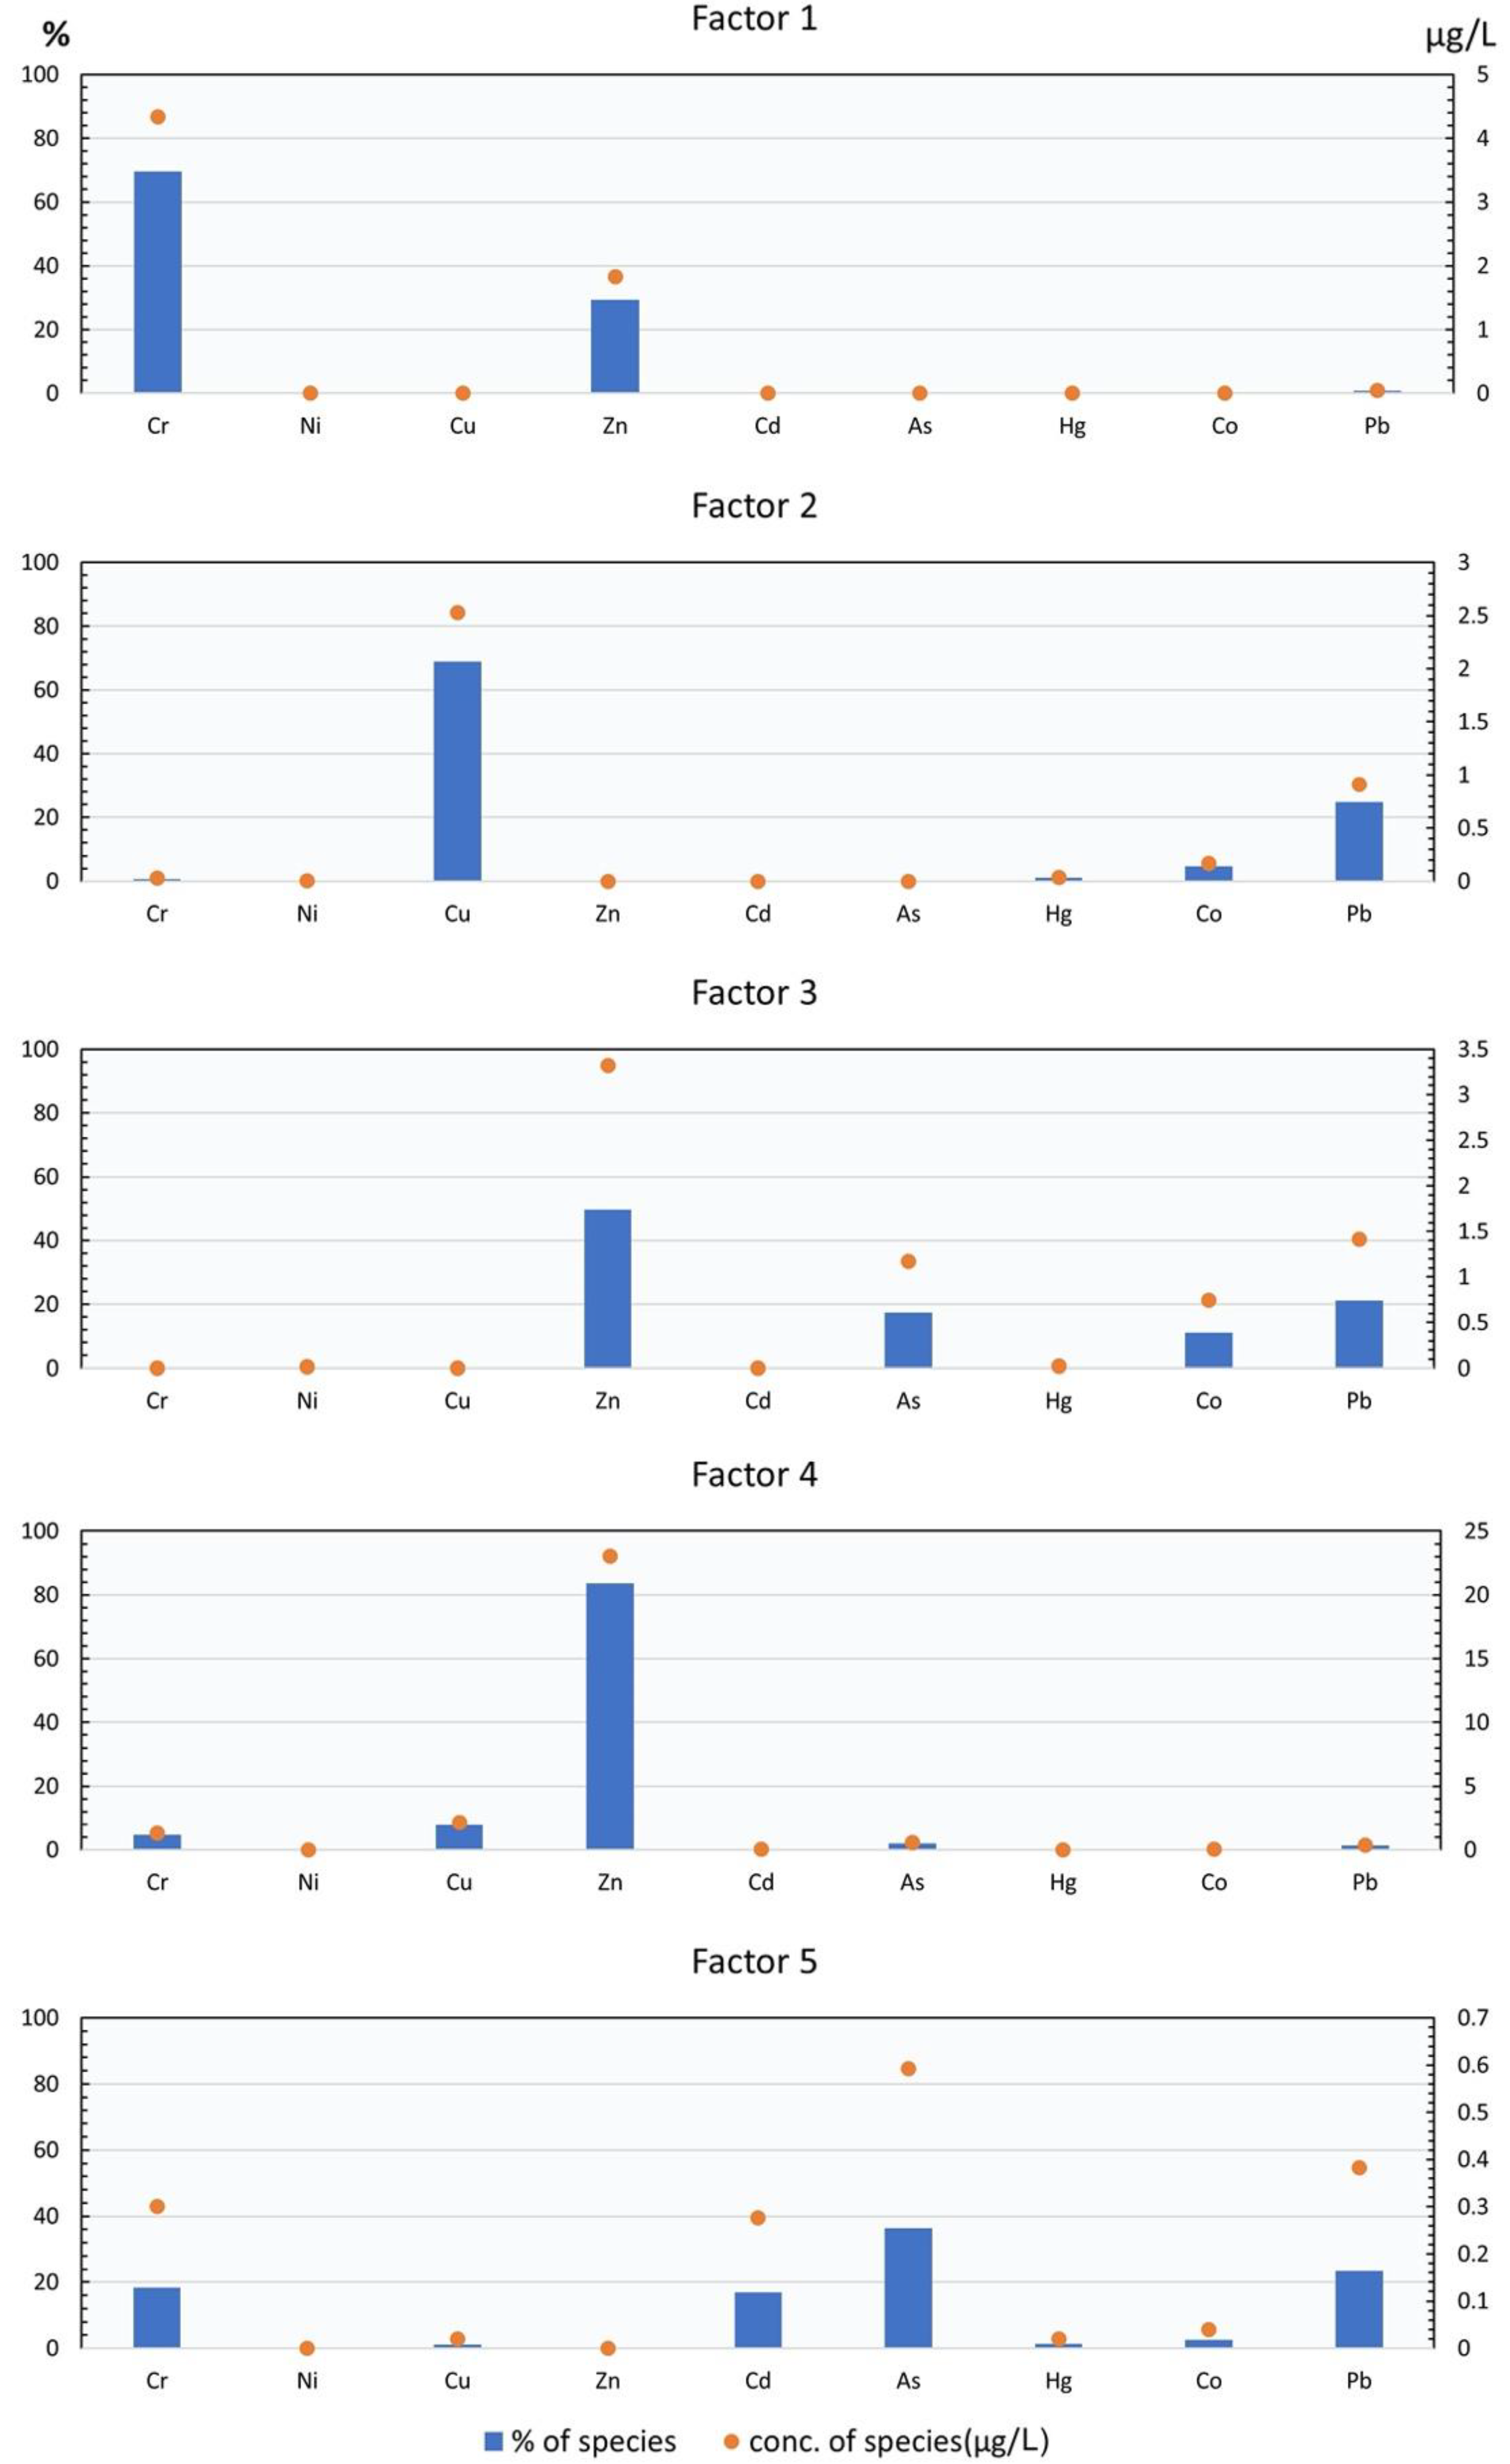
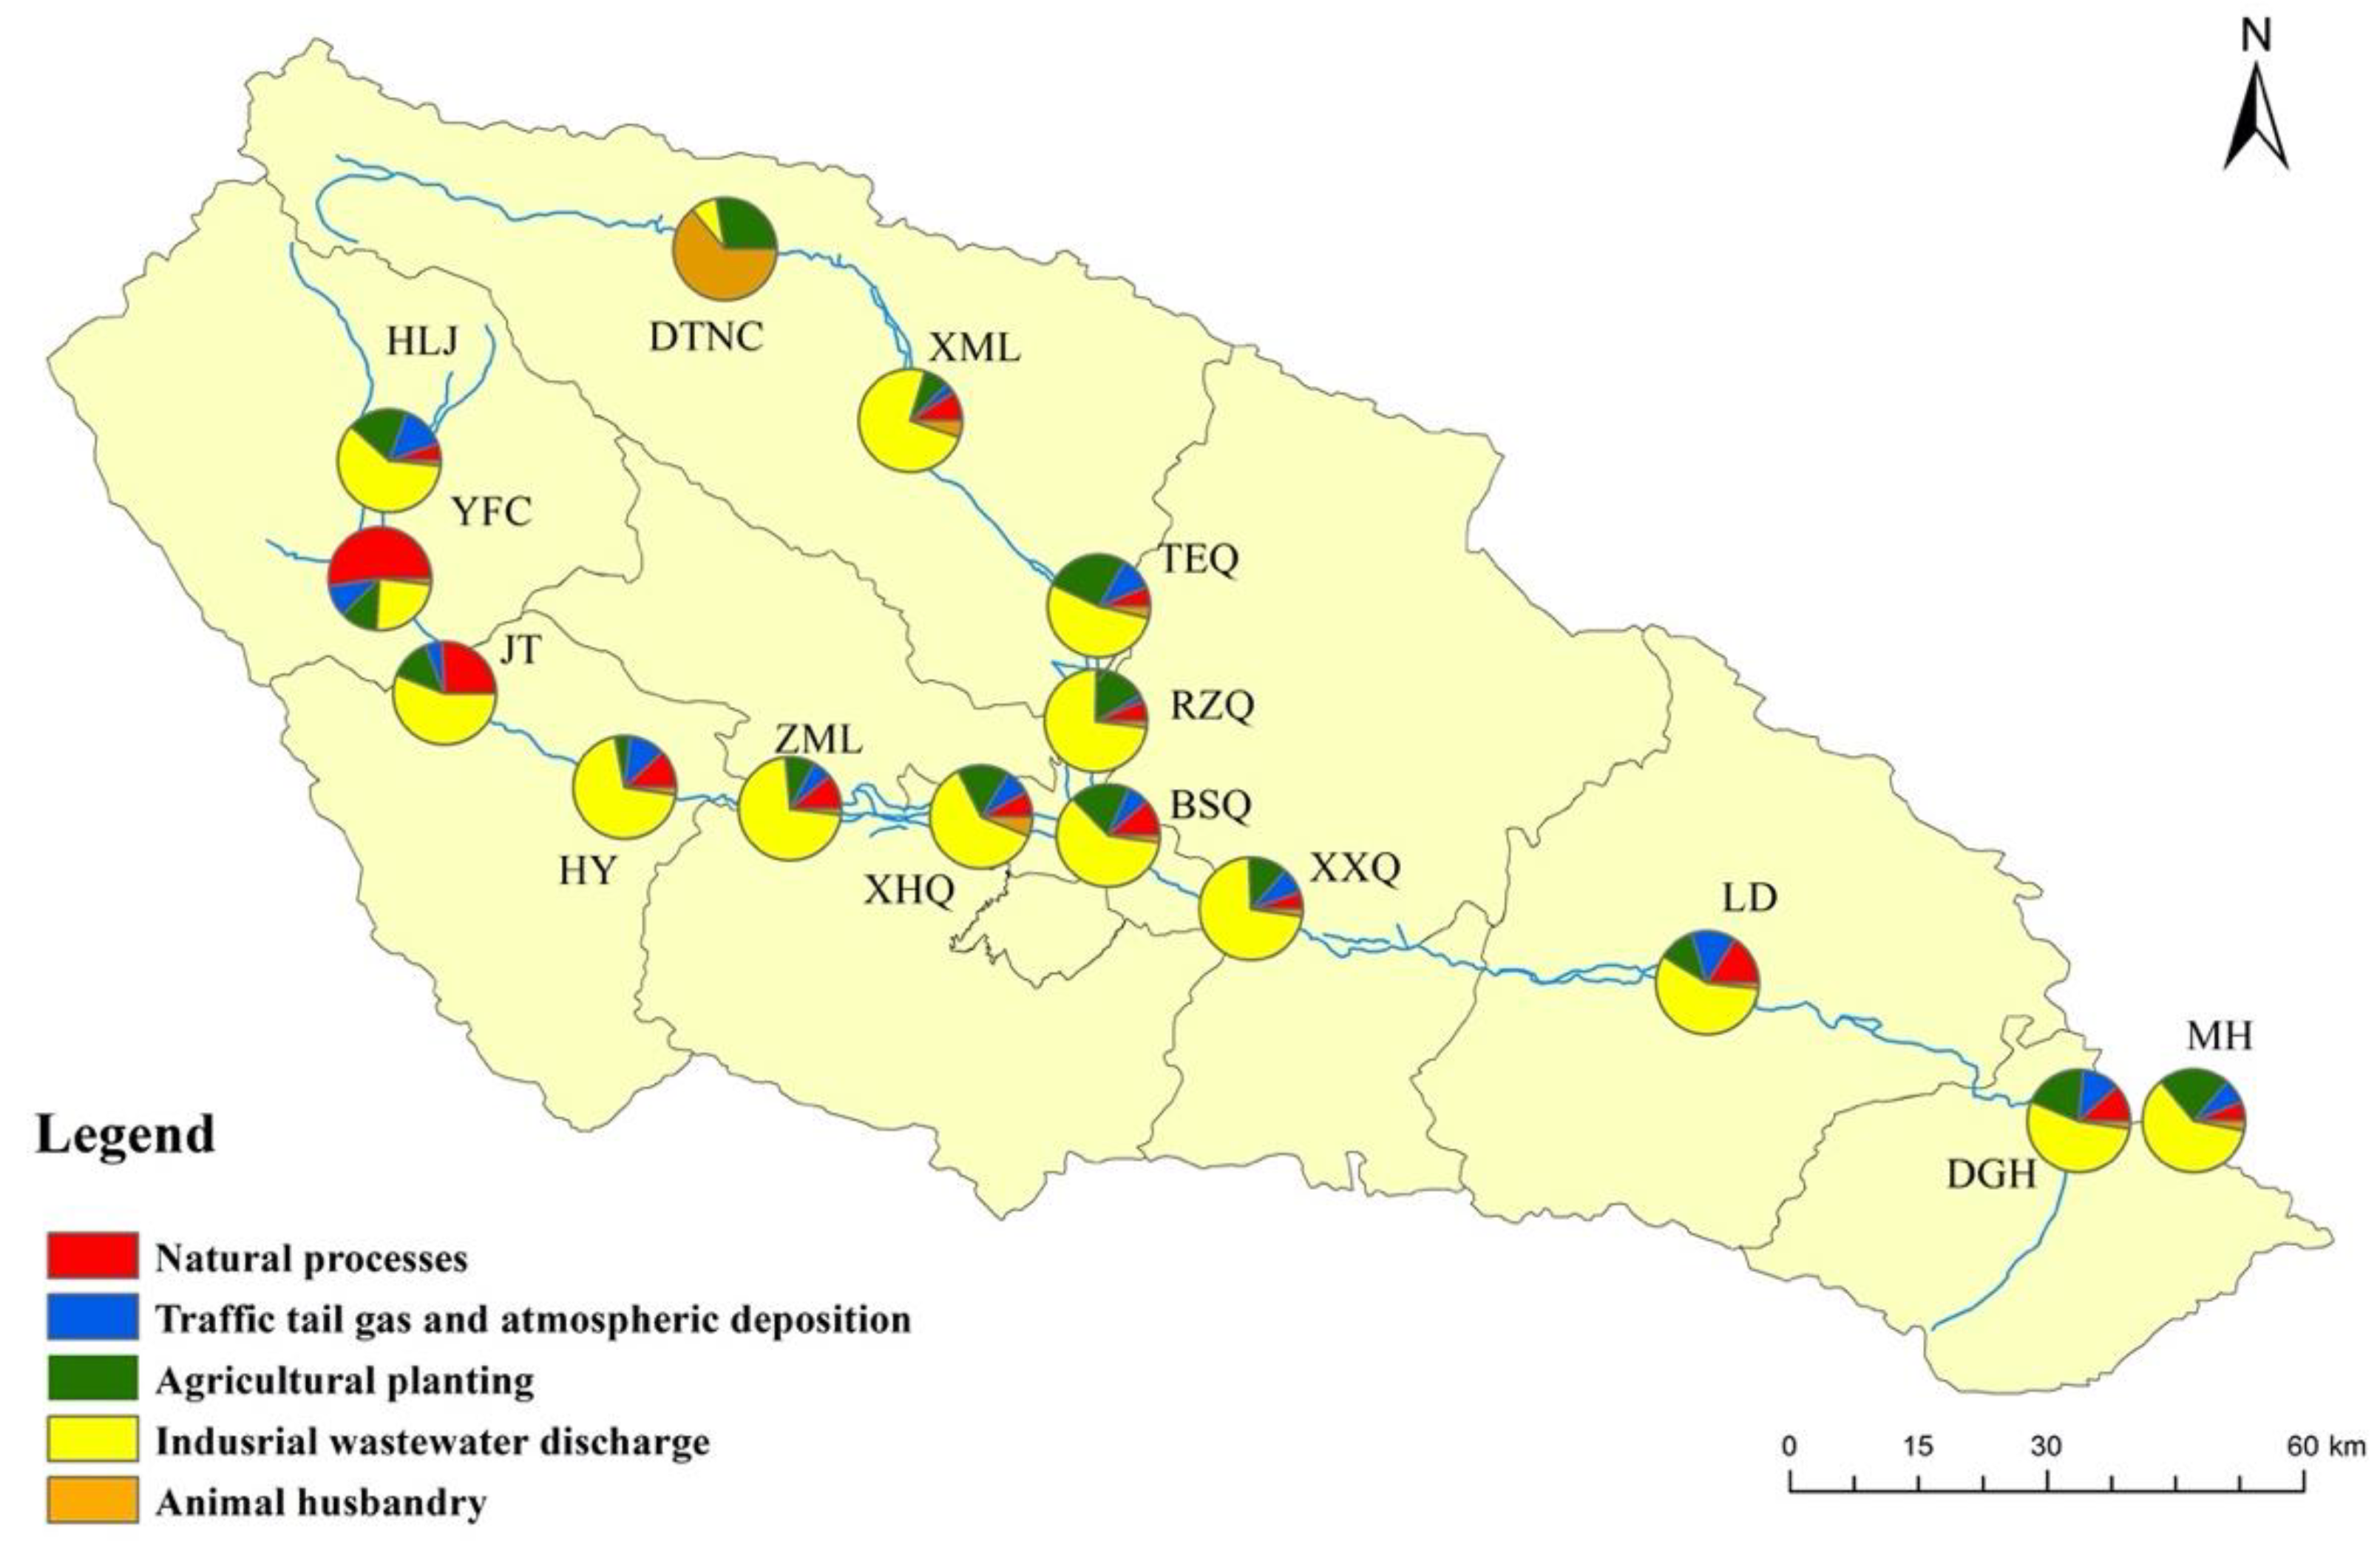
3.2. Source Apportionment
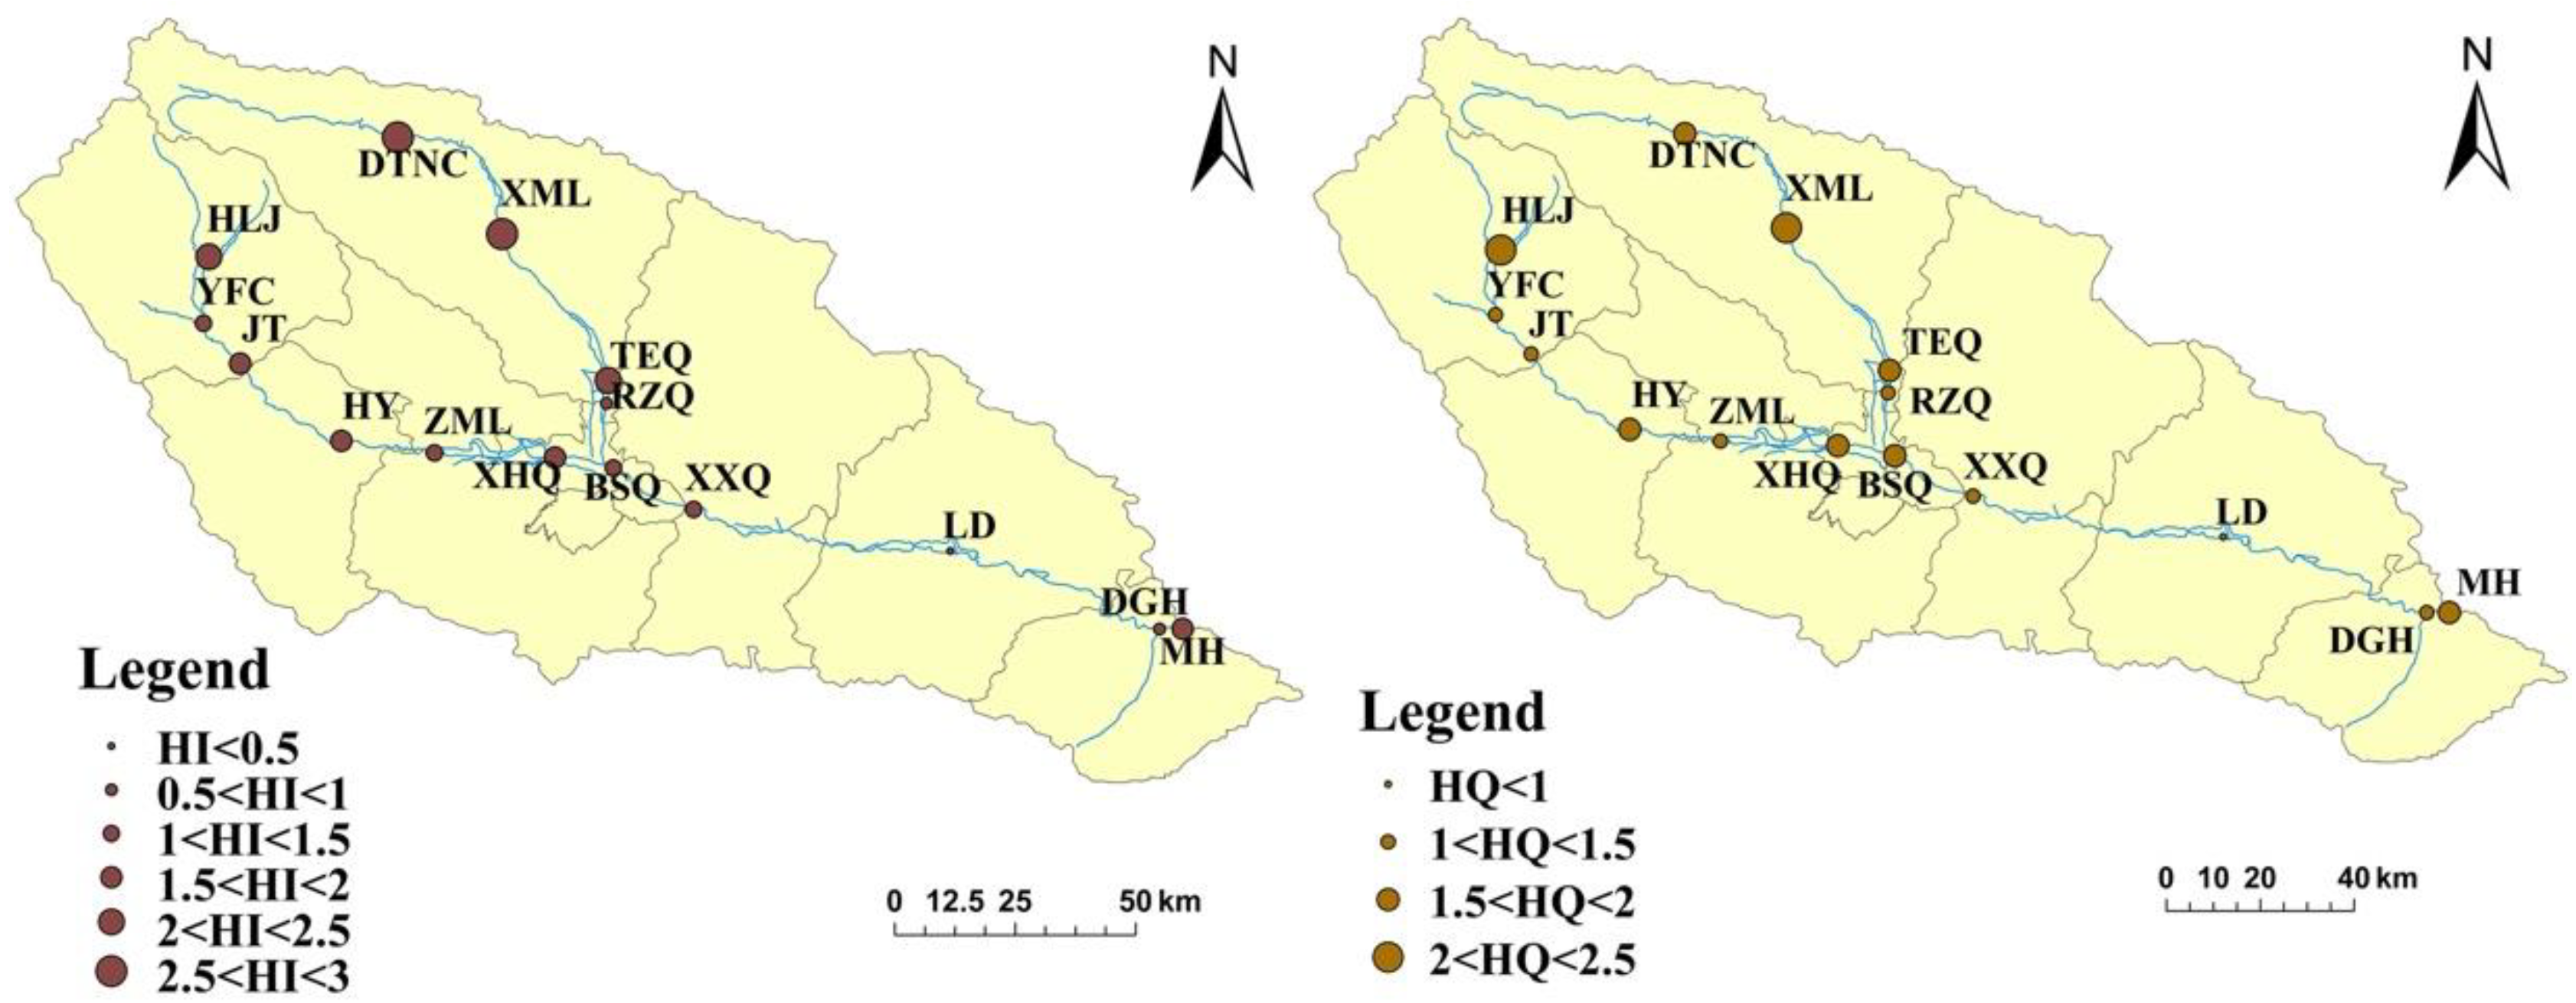
IBM SPSS 10.7 software was used for factor analysis, and PCA was used to extract five factors. The cumulative variance percentage was calculated to be 87.15%, which could represent the overall characteristics of the samples. The EPA PMF 5.0 model was used for 20 iterations of Base Model runs to obtain the minimum Q value. The Base Model Displacement Method (DISP) and Base Model Bootstrap Method (BS) were used to test the results. DISP results show that the largest observed drop in Q value during DISP is 0. BS results show that more than 98% of the BS factors mapped to the same base factor and 0 for no mapped, indicating that 5 factors fit and the result is reliable.
The sources of HM pollution include natural processes and human activities. Natural processes are mainly volcanic eruptions, forest fires, and rock weathering, whereas anthropogenic sources include transportation, industrial wastewater, livestock and poultry breeding, and agricultural cultivation [4,40,56]. Figure 3 shows the percentage and concentration of each element apportioned to the factors. The concentration of F4 elements is the highest, and Zn exceeds 20 µg/L. Cr and Ni mainly come from parent material weathering and soil action [57], and F1 may be a natural process source. Pb emissions are mainly related to road transportation and fertilizer use [58], and mainly exist in F2 and F3. Therefore, F2 is estimated to be the source of traffic tail gas and atmospheric deposition. The measured and predicted concentrations of As and Ni vary greatly over time, which may be influenced by the farming season. As is the main component of F3, which may be the source of agricultural planting. The HSRB is rich in mineral resources, and there are a large number of mining and gold smelting enterprises in the basin. The discharge of industrial wastewater has a direct impact on the aquatic environment, so the industrial wastewater source was considered as F4. The main components of F5 were As, Pb, Cr, and Cd, which were consistent with HMs that may be brought about by animal husbandry.
The location of each sampling point was further analyzed to verify the source hypothesis of each factor. Figure 4 shows the standardized contribution values of each factor to point locations during different sampling periods. During the sampling period of 18 April 2021 local farmers were interviewed. It was observed that almost all the farmland was sown and fertilized. In HSRB, April is the month with the most precipitation, and the land runoff has a great impact on river water quality. Therefore, F3, as agricultural planting, played a leading role in all points. DTNC is located in a natural pasture that mainly breeds yaks, a livestock species unique to the Qinghai–Tibet Plateau. During the survey, 12,000 bred wild-blood yaks were counted. DTNC is located in a mountainous area, where annual precipitation is higher than the annual average precipitation of HSRB, and the surface runoff has a greater impact on the water body than the mainstream area. The main source of water pollution at this point is yak breeding, so F5 can be identified as the source of animal husbandry. The points with large contributions to F2 are distributed near the main traffic roads of the basin, with high traffic flow and a great influence of traffic tail gas. The areas surrounding roads were mainly construction lands and industrial parks, and industrial coal combustion and smelting waste gas settlement also have a certain impact on water bodies. On 9 July 2021, the contribution of each factor was relatively small, mainly because the HSR was in a wet season and the concentration of HMs decreased overall. At this time, the influence caused by natural processes (F1) was dominant in the upper reaches, such as YFC and JT. The influence of F1 on water decreased with the increase of inflow from tributaries and other pollution sources. In this season, the climate is relatively suitable and the animal growth is vigorous. Animal husbandry (F5) was also a leading factor. The difference in the contributions of each factor on 18 October 2021 is small. However, the contribution of each factor rises with the dry season in the HSRB. In peak production season, the discharge of industrial wastewater is large, and the contribution of F4 is even larger. At the same time, with the growth of crops, the application amount of pesticide increased, and the F3 contribution also increased. The effects of traffic exhaust and atmospheric deposition, natural processes, and animal husbandry also existed.
Through time and point factor analysis, combined with local production situation and land use type distribution, F1 was identified as the natural process source, F2 was the traffic tail gas and atmospheric deposition source, F3 was the agricultural planting source, F4 was the industrial wastewater discharge source, and F5 was the animal husbandry source.

3.3. HRA Results

The average value of the three tests at each point was used as the evaluation concentration for HRA. Except for infants, the HI values for children, teenagers, and adults were less than 1, indicating that there is no noncarcinogenic risk of HMs in the water body. The HI values for infants were greater than 1 except at the point LD. As is the main influencing factor, and HI and HQAs values at each point are shown in Figure 5. The HI of DTNC and XML was above 2.5, with the surrounding area being mainly pasture and farmland. The HI value of TEQ and HLJ is also greater than 2. HLJ is also located in the agriculture–husbandry transitional zone. TEQ is surrounded by an industrial park, and its water quality is greatly affected by the upstream. The distribution of HQAs was similar to that of HI, suggesting that the noncarcinogenic risk was mainly caused by As. Agriculture and animal husbandry have noncarcinogenic risks.
Except for infants, TCR values for children, teenagers, and adults were less than 106, indicating that HMs in water have no carcinogenic risk to the human body. However, for infants, TCR values at all points are greater than 104, indicating a risk of cancer. As shown in Figure 6, carcinogenic risk analysis of each element showed that Cr, Cd, As, and Ni at all points have CR, while Pb at all points and Ni at some points have acceptable CR. The maximum value of TCR was observed at DTNC, which exceeded 0.003. The CR of Cd and Pb at DTNC was also the highest. The XML site had the greatest risk of As. The point with the highest CRCr is YFC, which is the upstream water source area with great influence from natural processes and is also the agriculture-husbandry transitional zone. The highest values of CRNi were observed in TEQ and LD, and the surrounding area is mainly cropland. Through point analysis, agriculture and animal husbandry were also observed to have an impact on CR.

3.4. Effects Analysis

Figure 7 shows the contribution of each factor at each point. Overall, F4 industrial wastewater discharge was the main influencing factor because industrial wastewater is discharged directly into the water body in the form of a point source and the pollutant concentration is relatively high. However, the pollutants released by agricultural planting and animal husbandry are transmitted through the soil and then affect water bodies through surface runoff and infiltration. Nevertheless, the contribution of F3 agricultural planting was also considerable, and its influence was widely distributed. The main pollution source of HM in DTNC was F5 animal husbandry.
Table 4 shows the results of calculated effects of F3 (agricultural planting) and F5 (animal husbandry) on HMs in water, Hg exceeding class 3 limit of water body, human carcinogenic and noncarcinogenic risks, and HM elements with risks. The effect of agriculture on HMs or HI in HSRB is 15.90%, while the effect of animal husbandry is 5.51%. A total effect of agricultural and animal husbandry on TCR in HSRB is approximately 40%. The effect of agricultural planting on Hg in the whole basin was 26.58%, and at point locations JT, BSQ, RZQ, and MH it was more than 40%. The effect of animal husbandry on Hg was 33.23%, mainly due to the effect at DTNC point, which reached 88.77%. Although only JT and DTNC of these influential points exceed the limits of category 3 water bodies, the effect of agriculture and animal husbandry on Hg cannot be ignored.
The noncarcinogenic and carcinogenic risks of Ni, Cd, As, and Pb were greatly affected. At 60% of the points, agricultural planting affected more than 50% of HQAs, and the highest effect was in the upstream and downstream points of HSR. The effect of agricultural planting on CRNi was greater than 50% at 87% of the points. The effect of agricultural planting on CRPb was greatest at RZQ. Agricultural planting had no effect on CRCr and CRCd. Animal husbandry had little effect on HQAs except at point DTNC, while the effect on CRCd was more than 60%. At DTNC, except for CRNi, the effect of animal husbandry on other indices was more than 67%. The effect associated with CRCd is nearly 100% and requires special attention.

4. Discussion

4.1. Comparative Analysis

Luo et al. (2019) studied Cu, Zn, Pb, and Cd in stream sediments from Wenzhou city, eastern China, and found that livestock density significantly contributed to Zn and Cu, and that pesticides, fertilizers, or feed and feces may be potential sources of Cu [59]. However, this study observed that the effects of agriculture and animal husbandry on Cu and Zn were only 0.67% and 12.41% in the HSRB (Figure 3). This may be due to the differences in crop and farming types, rainfall, and land use types. Wenzhou is a subtropical monsoon climate zone with moderate temperatures and abundant rainfall, with an annual precipitation of 1113–2494 mm. The main food crop is rice, which has higher requirements for nitrogen and zinc fertilizers. For every 100 kg of rice produced, 2–2.4 kg of nitrogen was absorbed, and 1500–2250 kg of zinc sulfate was applied to paddy fields per km2. Aquaculture is mainly pig-raising and coastal tidal flat aquaculture. Copper is an indispensable trace element for the growth and development of piglets. Pig farmers believe that the more the copper is added, the higher is the digestibility of the feed and the faster the piglets grow. When the dietary copper level increased from 20 ppm to 100 ppm, its excretion in feces increased 7.9 times. Therefore, the contribution of agriculture and animal husbandry to HM pollution was mainly Zn and Cu.
Islam et al. (2018) took surface sediment samples from the Feni River estuary in Bangladesh as research objects and found that the use of fertilizers, metal-containing pesticides, fungicides, and herbicides in agriculture and aquaculture may greatly increase the concentration of Ag, Ni, and Co [60]. This is consistent with the results of this study (Figure 3). Bangladesh is a typical agricultural country. It believes in Islam and therefore has basically no pig farming. The farming industry mainly consists of cattle, sheep, and chickens. The Feni River Basin has a rainy season from June to November and a dry season from December to May. Most of the catchment areas are suitable for growing temporary or permanent crops such as wheat, beans, and vegetables. To increase the yield of these crops, fertilizers and metal-containing pesticides, herbicides, and fungicides are applied to the soil indiscriminately and repeatedly over long periods. This is similar to HSRB, so the analysis results are consistent.

4.2. Limitations

The EPA PMF 5.0 model has an input uncertainty file in the calculation process, which fully considers the uncertainty of data. In this study, the error of data detection was avoided as much as possible by collecting parallel samples, and the analysis process and results were reliable. However, there are still some limitations, such as fewer sampling points. This mainly refers to the distribution of China’s state monitoring points. Due to the fluidity of the water, there is little difference in concentration between the dense points. In future studies, other tributary points and sampling times can be considered. In addition, only one sampling was conducted at DTNC because it is located in a state-owned breeding farm in China, which is 92 km away from Xining city, the capital of Qinghai Province, and entry requires approval. The analysis of the influence of change at this point in time is missing. The author hopes to improve it in future research work.

5. Conclusions

This study investigated the sources of HM contamination in the water bodies of the main stream and tributaries of HSR, carried out source apportionment and human health risk assessment, defined the effect of factors, established the calculation formula, and quantified the influence of agriculture and animal husbandry. The results showed that the aquatic environment of HSR was good, but there was a big difference in the detection results at each point, and there was spatial diversity in HMs caused by local sources. HMs in water mainly come from natural processes, traffic tail gas and atmospheric deposition, agricultural planting, industrial wastewater discharge, and animal husbandry. HMs in water have both noncarcinogenic and carcinogenic risks for infants. Noncarcinogenic risk is mainly caused by As. Cr, Cd, and As in all sites and Ni in some sites have carcinogenic risk, while Pb in all sites and Ni in some sites have acceptable carcinogenic risk. The effect of agriculture on HMs or HI in HSRB is 15.90%, while the effect of animal husbandry is 5.51%. A total effect of agricultural and animal husbandry on TCR in HSRB is approximately 40%. Only JT and DTNC points had significant effects on Hg and exceeded the limits of class 3. However, the noncarcinogenic and carcinogenic risks of Ni, Cd, As, and Pb were greatly affected. This was mainly due to the effects of agricultural planting on HQAs, CRNi, and CRPb, and the effect of animal husbandry on CRCd. The effect of agriculture in HSR upstream and downstream and animal husbandry in DTNC should be taken seriously by local managers. Managers could consider measures to reduce HMs from farming and livestock activities, such as strengthening the management of fertilizer and pesticide use, popularizing precise fertilization, spray technology, improving the use of organic fertilizer proportion, strictly controlling the HM content of pesticides and chemical fertilizers, improving livestock waste collection and treatment systems, the promotion of green farming technology, reducing the use of trace HM elements in animal feed additives, and other initiatives. Through the analysis of the impact of highland agriculture and animal husbandry on HMs and human health risk assessment in the HSRB, this study provides a theoretical basis for local managers of agricultural planting and animal husbandry to carry out their work effectively.

Author Contributions

L.Z.: conceptualization, methodology, investigation, data curation, software, writing—original draft preparation. X.T.: data curation, writing—original draft preparation. H.C.: visualization, investigation. Y.L.: investigation, data curation. Z.C.: supervision, writing—reviewing and editing. All authors have read and agreed to the published version of the manuscript.

Funding

This study was funded by the National Natural Science Foundation of China (Grant No. U20A20115) and the Key Research and Development Program of Shandong Province (Grant No. 2020CXGC011403).

Institutional Review Board Statement

Not applicable.

Informed Consent Statement

Not applicable.

Data Availability Statement

The data are available on request from the corresponding author.

Acknowledgments

The authors thank all the editors and anonymous referees for their constructive comments and suggestions.

Conflicts of Interest

The authors declare no conflict of interest.

References

  1. Keskin, T.E. Nitrate and heavy metal pollution resulting from agricultural activity: A case study from Eskipazar (Karabuk, Turkey). Environ. Earth Sci. 2010, 61, 703–721. [Google Scholar] [CrossRef]
  2. Sun, B.; Zhang, L.; Yang, L.; Zhang, F.; Norse, D.; Zhu, Z. Agricultural non-point source pollution in China: Causes and mitigation measures. Ambio 2012, 41, 370–379. [Google Scholar] [CrossRef] [PubMed] [Green Version]
  3. Yi, X.; Lin, D.; Li, J.; Zeng, J.; Wang, D.; Yang, F. Ecological treatment technology for agricultural non-point source pollution in remote rural areas of China. Environ. Sci. Pollut. Res. 2021, 28, 40075–40087. [Google Scholar] [CrossRef] [PubMed]
  4. Zhang, Q.; Zhang, X. Quantitative source apportionment and ecological risk assessment of heavy metals in soil of a grain base in Henan Province, China, using PCA, PMF modeling, and geostatistical techniques. Environ. Monit. Assess. 2021, 193, 655. [Google Scholar] [CrossRef] [PubMed]
  5. Li, Z.; Ma, Z.; van der Kuijp, T.J.; Yuan, Z.; Huang, L. A review of soil heavy metal pollution from mines in China: Pollution and health risk assessment. Sci. Total Environ. 2014, 468–469, 843–853. [Google Scholar] [CrossRef]
  6. Marković, M.; Cupać, S.; Durović, R.; Milinović, J.; Kljajić, P. Assessment of heavy metal and pesticide levels in soil and plant products from agricultural area of Belgrade, Serbia. Arch. Environ. Contam. Toxicol. 2010, 58, 341–351. [Google Scholar] [CrossRef]
  7. Jastrzębska, M.; Kostrzewska, M.K.; Saeid, A.; Jastrzębski, W.P. Do new-generation recycled phosphorus fertilizers increase the content of potentially toxic elements in soil and plants? Minerals 2021, 11, 999. [Google Scholar] [CrossRef]
  8. Wang, H.; Dong, Y.; Yang, Y.; Toor, G.S.; Zhang, X. Changes in heavy metal contents in animal feeds and manures in an intensive animal production region of China. J. Environ. Sci. (China) 2013, 25, 2435–2442. [Google Scholar] [CrossRef]
  9. Järup, L. Hazards of heavy metal contamination. Br. Med. Bull. 2003, 68, 167–182. [Google Scholar] [CrossRef] [Green Version]
  10. Chen, H.; Zheng, C.; Tu, C.; Zhu, Y.G. Heavy metal pollution in soils in China: Status and countermeasures. Ambio 1999, 28, 130–134. [Google Scholar] [CrossRef]
  11. Yang, L.; Ren, Q.; Zheng, K.; Jiao, Z.; Ruan, X.; Wang, Y. Migration of heavy metals in the soil-grape system and potential health risk assessment. Sci. Total Environ. 2021, 806, 150646. [Google Scholar] [CrossRef] [PubMed]
  12. Bi, B.; Liu, X.; Guo, X.; Lu, S. Occurrence and risk assessment of heavy metals in water, sediment, and fish from Dongting Lake, China. Environ. Sci. Pollut. Res. 2018, 25, 34076–34090. [Google Scholar] [CrossRef]
  13. Jia, Y.; Wang, L.; Qu, Z.; Yang, Z. Distribution, contamination and accumulation of heavy metals in water, sediments, and freshwater shellfish from Liuyang River, Southern China. Environ. Sci. Pollut. Res. 2018, 25, 7012–7020. [Google Scholar] [CrossRef] [PubMed]
  14. Imseng, M.; Wiggenhauser, M.; Müller, M. The Fate of Zn in Agricultural Soils: A Stable Isotope Approach to Anthropogenic Impact, Soil Formation, and Soil–Plant Cycling. Environ. Sci. Technol. 2019, 53, 4140–4149. [Google Scholar] [CrossRef] [PubMed]
  15. Yan, J.; Qu, Z.; Li, F.; Li, H. Heavy metals in the water environment of Yangtze River Economic Belt: Status, fuzzy environmental risk assessment and management. Urban Clim. 2021, 40, 100981. [Google Scholar] [CrossRef]
  16. Sun, C.; Zhang, Z.; Cao, H.; Xu, M.; Xu, L. Concentrations, speciation, and ecological risk of heavy metals in the sediment of the Songhua River in an urban area with petrochemical industries. Chemosphere 2019, 219, 538–545. [Google Scholar] [CrossRef]
  17. Nguyen, B.T.; Do, D.D.; Nguyen, T.X.; Nguyen, V.N.; Phuc Nguyen, D.T.; Nguyen, M.H.; Thi Truong, H.T.; Dong, H.P.; Le, A.H.; Bach, Q.V. Seasonal, spatial variation, and pollution sources of heavy metals in the sediment of the Saigon River, Vietnam. Environ. Pollut. 2020, 256, 113412. [Google Scholar] [CrossRef]
  18. Li, J.; Chen, Y.; Lu, H.; Zhai, W. Spatial distribution of heavy metal contamination and uncertainty-based human health risk in the aquatic environment using multivariate statistical method. Environ. Sci. Pollut. Res. 2021, 28, 22804–22822. [Google Scholar] [CrossRef]
  19. Martínez-Cortijo, J.; Ruiz-Canales, A. Effect of heavy metals on rice irrigated fields with waste water in high pH Mediterranean soils: The particular case of the Valencia area in Spain. Agric. Water Manag. 2018, 210, 108–123. [Google Scholar] [CrossRef]
  20. Saha, N.; Rahman, M.S.; Ahmed, M.B.; Zhou, J.L.; Ngo, H.H.; Guo, W. Industrial metal pollution in water and probabilistic assessment of human health risk. J. Environ. Manag. 2017, 185, 70–78. [Google Scholar] [CrossRef]
  21. Tepanosyan, G.; Sahakyan, L.; Belyaeva, O.; Asmaryan, S.; Saghatelyan, A. Continuous impact of mining activities on soil heavy metals levels and human health. Sci. Total Environ. 2018, 639, 900–909. [Google Scholar] [CrossRef] [PubMed]
  22. Lu, Y.; Song, S.; Wang, R.; Liu, Z.; Meng, J.; Sweetman, A.J.; Jenkins, A.; Ferrier, R.C.; Li, H.; Luo, W.; et al. Impacts of soil and water pollution on food safety and health risks in China. Environ. Int. 2015, 77, 5–15. [Google Scholar] [CrossRef] [PubMed] [Green Version]
  23. Swain, R.; Sahoo, B. Mapping of heavy metal pollution in river water at daily time-scale using spatio-temporal fusion of MODIS-aqua and Landsat satellite imageries. J. Environ. Manag. 2017, 192, 1–14. [Google Scholar] [CrossRef] [PubMed] [Green Version]
  24. Huang, Y.; Deng, M.; Wu, S.; Japenga, J.; Li, T.; Yang, X.; He, Z. A modified receptor model for source apportionment of heavy metal pollution in soil. J. Hazard. Mater. 2018, 354, 161–169. [Google Scholar] [CrossRef]
  25. Huang, Y.; Chen, Q.; Deng, M.; Japenga, J.; Li, T.; Yang, X.; He, Z. Heavy metal pollution and health risk assessment of agricultural soils in a typical peri-urban area in southeast China. J. Environ. Manag. 2018, 207, 159–168. [Google Scholar] [CrossRef]
  26. Muhammad, S.; Shah, M.T.; Khan, S. Health risk assessment of heavy metals and their source apportionment in drinking water of Kohistan region, northern Pakistan. Microchem. J. 2011, 98, 334–343. [Google Scholar] [CrossRef]
  27. Zhou, B.; Wang, H.; Zhang, Q. Assessment of the evolution of groundwater chemistry and its controlling factors in the Huangshui river basin of northwestern China, using hydrochemistry and multivariate statistical techniques. Int. J. Environ. Res. Public Health 2021, 18, 7551. [Google Scholar] [CrossRef]
  28. Zhang, X. Analysis of Water Pollution and Calculation of Ecological Compensation Standards in Huangshui River Basin Based on Ecological Footprint. J. Phys. Conf. Ser. 2020, 1533, 022070. [Google Scholar] [CrossRef]
  29. Dong, B.; Qin, T.; Wang, Y.; Zhao, Y.; Liu, S.; Feng, J.; Li, C.; Zhang, X. Spatiotemporal variation of nitrogen and phosphorus and its main influencing factors in Huangshui River basin. Environ. Monit. Assess. 2021, 193, 1–22. [Google Scholar] [CrossRef]
  30. Ministry of Agriculture, People’s Republic of China. Water-Soluble Fertilizers-Content-Limits of Mercury, Arsenic, Cadmium, Lead and Chromium (NY 1110-2010); Ministry of Agriculture: Beijing, China, 2010.
  31. State Administration of Quality Supervision and Inspection. Ecological Index of Arsenic, Cadmium, Lead, Chromium and Mercury for Fertilizers (GBT23349-2009); State Administration of Quality Supervision and Inspection, Standardization Administration Committee: Beijing, China, 2009.
  32. Liaoning Market Supervision Administration. Determination of Copper, Zinc, Iron, Manganese, Calcium, Phosphorus, Sodium, Magnesium, Lead, Chromium, Cadmium and Arsenic in Feeds Method Using Inductively Coupled Plasma Optical Emission Spectrometry(DB21/T3059-2018); Liaoning Market Supervision Administration: Liaoning, China, 2018.
  33. State Environmental Protection Administration. Technical Specifications Requirements for Monitoring of Surface Water and Waste Water (HJ/T91-2002); State Environmental Protection Administration: Beijing, China, 2002.
  34. State Environmental Protection Administration. Ministry of Environmental Protection Enviromental Quality Standards for Surface Water (GB3838-2002); State Environmental Protection Administration; State Administration of Quality Supervision and Inspection: Beijing, China, 2002.
  35. Wang, J.; Yu, D.; Wang, Y.; Du, X.; Li, G.; Li, B.; Zhao, Y.; Wei, Y.; Xu, S. Source analysis of heavy metal pollution in agricultural soil irrigated with sewage in Wuqing, Tianjin. Sci. Rep. 2021, 11, 17816. [Google Scholar] [CrossRef]
  36. Lu, A.; Wang, J.; Qin, X.; Wang, K.; Han, P.; Zhang, S. Multivariate and geostatistical analyses of the spatial distribution and origin of heavy metals in the agricultural soils in Shunyi, Beijing, China. Sci. Total Environ. 2012, 425, 66–74. [Google Scholar] [CrossRef] [PubMed]
  37. Liu, Z.; Zhu, H.; Cui, X.; Wang, W.; Luan, X.; Chen, L.; Cui, Z.; Zhang, L. Groundwater quality evaluation of the dawu water source area based on water quality index (Wqi): Comparison between delphi method and multivariate statistical analysis method. Water 2021, 13, 1127. [Google Scholar] [CrossRef]
  38. Pan, H.; Lu, X.; Lei, K. A comprehensive analysis of heavy metals in urban road dust of Xi’an, China: Contamination, source apportionment and spatial distribution. Sci. Total Environ. 2017, 609, 1361–1369. [Google Scholar] [CrossRef] [PubMed]
  39. Dai, G.; Wang, B.; Fu, C.; Dong, R.; Huang, J.; Deng, S.; Wang, Y.; Yu, G. Pharmaceuticals and personal care products (PPCPs) in urban and suburban rivers of Beijing, China: Occurrence, source apportionment and potential ecological risk. Environ. Sci. Process. Impacts 2016, 18, 445–455. [Google Scholar] [CrossRef]
  40. Proshad, R.; Kormoker, T.; Abdullah Al, M.; Islam, M.S.; Khadka, S.; Idris, A.M. Receptor model-based source apportionment and ecological risk of metals in sediments of an urban river in Bangladesh. J. Hazard. Mater. 2022, 423, 127030. [Google Scholar] [CrossRef]
  41. Chen, R.; Chen, H.; Song, L.; Yao, Z.; Meng, F.; Teng, Y. Characterization and source apportionment of heavy metals in the sediments of Lake Tai (China) and its surrounding soils. Sci. Total Environ. 2019, 694, 133819. [Google Scholar] [CrossRef]
  42. Li, W.; Wu, J.; Zhou, C.; Nsabimana, A. Groundwater Pollution Source Identification and Apportionment Using PMF and PCA-APCS-MLR Receptor Models in Tongchuan City, China. Arch. Environ. Contam. Toxicol. 2021, 81, 397–413. [Google Scholar] [CrossRef]
  43. Viana, M.; Kuhlbusch, T.A.J.; Querol, X.; Alastuey, A.; Harrison, R.M.; Hopke, P.K.; Winiwarter, W.; Vallius, M.; Szidat, S.; Prévôt, A.S.H.; et al. Source apportionment of particulate matter in Europe: A review of methods and results. J. Aerosol Sci. 2008, 39, 827–849. [Google Scholar] [CrossRef]
  44. Huang, J.; Peng, S.; Mao, X.; Li, F.; Guo, S.; Shi, L.; Shi, Y.; Yu, H.; Zeng, G. ming Source apportionment and spatial and quantitative ecological risk assessment of heavy metals in soils from a typical Chinese agricultural county. Process Saf. Environ. Prot. 2019, 126, 339–347. [Google Scholar] [CrossRef]
  45. Paatero, P.; Tapper, U. Positive matrix factorization: A non-negative factor model with optimal utilization of error estimates of data values. Environmetrics 1994, 5, 111–126. [Google Scholar] [CrossRef]
  46. Paatero, P. A weighted non-negative least squares algorithm for three-way “PARAFAC” factor analysis. Chemom. Intell. Lab. Syst. 1997, 38, 223–242. [Google Scholar] [CrossRef]
  47. U.S. Environmental Protection Agency Office of Research and Development. EPA Positive Matrix Factorization ( PMF ) 5.0 Fundamentals and user guide; U.S. Environmental Protection Agency Office of Research and Development: Washington, DC, USA, 2014.
  48. Yuan, Z.; Yadav, V.; Turner, J.R.; Louie, P.K.K.; Lau, A.K.H. Long-term trends of ambient particulate matter emission source contributions and the accountability of control strategies in Hong Kong over 1998–2008. Atmos. Environ. 2013, 76, 21–31. [Google Scholar] [CrossRef]
  49. Liu, J.; Gao, Z.; Zhang, Y.; Sun, Z.; Sun, T.; Fan, H.; Wu, B.; Li, M.; Qian, L. Hydrochemical evaluation of groundwater quality and human health risk assessment of nitrate in the largest peninsula of China based on high-density sampling: A case study of Weifang. J. Clean. Prod. 2021, 322, 129164. [Google Scholar] [CrossRef]
  50. Omonona, O.V.; Okogbue, C.O. Hydrochemical evolution, geospatial groundwater quality and potential health risks associated with intake of nitrate via drinking water: Case of Gboko agricultural district, central Nigeria. Environ. Earth Sci. 2021, 80, 1–16. [Google Scholar] [CrossRef]
  51. Means, B. Risk-Assessment Guidance for Superfund: Human Health Evaluation Manual: Part A: Interim Report (Final); Environmental Protection Agency: Washington, DC, USA, 1989; Volume 1.
  52. Qing, X.; Yutong, Z.; Shenggao, L. Assessment of heavy metal pollution and human health risk in urban soils of steel industrial city (Anshan), Liaoning, Northeast China. Ecotoxicol. Environ. Saf. 2015, 120, 377–385. [Google Scholar] [CrossRef]
  53. Adimalla, N.; Qian, H. Groundwater quality evaluation using water quality index (WQI) for drinking purposes and human health risk (HHR) assessment in an agricultural region of Nanganur, south India. Ecotoxicol. Environ. Saf. 2019, 176, 153–161. [Google Scholar] [CrossRef]
  54. Zhang, Q.; Xu, P.; Qian, H. Assessment of groundwater quality and human health risk (HHR) evaluation of nitrate in the central-western Guanzhong basin, China. Int. J. Environ. Res. Public Health 2019, 16, 4246. [Google Scholar] [CrossRef] [Green Version]
  55. Kamunda, C.; Mathuthu, M.; Madhuku, M. Health risk assessment of heavy metals in soils from witwatersrand gold mining basin, South Africa. Int. J. Environ. Res. Public Health 2016, 13, 663. [Google Scholar] [CrossRef] [PubMed]
  56. He, Z.; Shentu, J.; Yang, X.; Baligar, V.C.; Zhang, T. Stoffella, & Heavy Metal Contamination of Soils: Sources, Indicators, and Assessment. J. Environ. Indic. 2015, 9, 17–18. [Google Scholar]
  57. Huang, S.S.; Liao, Q.L.; Hua, M.; Wu, X.M.; Bi, K.S.; Yan, C.Y.; Chen, B.; Zhang, X.Y. Survey of heavy metal pollution and assessment of agricultural soil in Yangzhong district, Jiangsu Province, China. Chemosphere 2007, 67, 2148–2155. [Google Scholar] [CrossRef]
  58. Bhuiyan, M.A.H.; Parvez, L.; Islam, M.A.; Dampare, S.B.; Suzuki, S. Heavy metal pollution of coal mine-affected agricultural soils in the northern part of Bangladesh. J. Hazard. Mater. 2010, 173, 384–392. [Google Scholar] [CrossRef] [PubMed]
  59. Luo, L.; Mei, K.; Qu, L.; Zhang, C.; Chen, H.; Wang, S.; Di, D.; Huang, H.; Wang, Z.; Xia, F.; et al. Assessment of the Geographical Detector Method for investigating heavy metal source apportionment in an urban watershed of Eastern China. Sci. Total Environ. 2019, 653, 714–722. [Google Scholar] [CrossRef] [PubMed] [Green Version]
  60. Islam, M.S.; Hossain, M.B.; Matin, A.; Islam Sarker, M.S. Assessment of heavy metal pollution, distribution and source apportionment in the sediment from Feni River estuary, Bangladesh. Chemosphere 2018, 202, 25–32. [Google Scholar] [CrossRef] [PubMed]
Figure 1. The geographical location of the HSRB and land use type.
Water 14 00549 g001
Figure 2. Distribution of sampling points. Note: HLJ, YFC, JT, HY, ZML, XHQ, BSQ, DTNC, XML, TEQ, RZQ, XXQ, LD, MH, and DGH stand for points’ names.
Water 14 00549 g002
Figure 3. Factor profile.
Water 14 00549 g003
Figure 4. Temporal distribution of factor contributions by site.
Water 14 00549 g004
Figure 5. Hazard index (HI) and hazard quotient (HQAs) of arsenic by site.
Water 14 00549 g005
Figure 6. Total cancer risk (TCR) and carcinogenic risk (CR) by site.
Water 14 00549 g006
Figure 7. Source contributions by site.
Water 14 00549 g007
Table 1. Factor values obtained by the ADD calculation formula [49,54].
ParametersInfants Children TeenagersAdults
IR (L/d)11.31.82.8
BW (kg)10305070
AT (d) 3652190438010,950
ED(a)161230
EF (d/a) 365365365365
Table 2. Factor values obtained by HI and TCR calculation formulas [55].
ParametersCrNiCuZnCdAsHgCoPb
RfD [mg/(kg·d)]3 × 10−32 × 10−23.7 × 10−23 × 10−15 × 10−43 × 10−43 × 10−42 × 10−23.6 × 10⁻³
SF [mg/(kg·d)]5.0 × 10−11.7−1-6.11.5--8.5 × 10⁻³
- represents noncarcinogenic element and no reference data.
Table 3. Statistical description of 9 heavy metals in samples.
ParametersCrNiCuZnCdAsHgCoPb
Max. (µg/L)46.1502.95813.27781.4283.8359.5190.5362.9828.570
Min. (µg/L)0.425<MDL<MDL3.323<MDL0.322<MDL0.0621.054
Mean (µg/L)6.1090.2904.70828.1600.3173.2820.0741.0183.523
Median (µg/L)4.372<MDL4.48820.8800.1513.1660.0260.7062.960
SD 17.3220.6132.87618.7670.6021.8430.1110.8812.135
RSD 2 (%)119.86211.6561.0966.65190.0756.16150.0886.5260.60
1 SD is standard deviation; 2 RSD is relative standard deviation.
Table 4. Effects of agriculture and animal husbandry on each index.
EffectIndexRiver BasinHLJYFCJTHYZMLXHQBSQDTNCXMLTEQRZQXXQLDMHDGH
Agriculture
(%)
HMs15.0919.0311.8312.984.809.2416.2318.8729.437.8126.6316.5712.3211.5922.3820.20
Hg26.5829.5024.8841.0110.5327.0527.0340.4411.2321.8138.1556.6028.2719.8640.6932.45
HI15.0919.0311.8312.984.809.2416.2318.8729.437.8126.6316.5712.3211.5922.3820.20
HQAs44.9264.7363.0760.8926.5842.2944.7961.3517.1227.9565.1855.8447.9452.0962.2964.30
TCR21.4234.869.5916.948.7717.3025.2130.1114.8813.9840.8533.1325.5817.4838.1130.36
CRCr0.000.000.000.000.000.000.000.000.000.000.000.000.000.000.000.00
CRNi71.4676.8640.5360.1141.6565.2677.6978.24100.0068.9884.5887.8775.9757.3984.8874.72
CRCd0.000.000.000.000.000.000.000.000.000.000.000.000.000.000.000.00
CRAs44.9264.7363.0760.8926.5842.2944.7961.3517.1227.9565.1855.8447.9452.0962.2964.30
CRPb43.8546.4841.3353.2718.9739.3844.6956.2727.9034.8257.2264.3442.6034.1057.8650.16
Animal
husbandry
(%)
HMs5.511.531.850.782.361.946.072.2267.965.403.792.092.291.843.012.28
Hg33.238.1113.308.4717.7119.4534.6116.3288.7751.6218.5724.4818.0010.8018.7312.52
HI5.511.531.850.782.361.946.072.2267.965.403.792.092.291.843.012.28
HQAs34.1410.8220.497.6427.1818.4834.8615.0482.2640.2119.2814.6818.5517.2217.4315.08
TCR19.176.863.672.5010.568.9023.098.6984.1623.6714.2310.2511.656.8012.558.38
CRCr7.734.020.890.703.563.1111.383.6196.699.029.244.655.582.387.213.71
CRNi0.000.000.000.000.000.000.000.000.000.000.000.000.000.000.000.00
CRCd91.4874.3689.7561.7379.4575.5891.8380.7499.8989.2389.0676.5578.3978.7484.9282.81
CRAs34.1410.8220.497.6427.1818.4834.8615.0482.2640.2119.2814.6818.5517.2217.4315.08
CRPb17.804.157.173.5710.369.1918.577.3771.5926.759.049.038.806.028.646.28
Publisher’s Note: MDPI stays neutral with regard to jurisdictional claims in published maps and institutional affiliations.

