Article

Classification and Assessment Methods for Mountain Channel Habitats in the Chishui River Basin, China

1
Institute of Hydrobiology, Chinese Academy of Sciences, Wuhan 430072, China
2
University of Chinese Academy of Sciences, Beijing 100049, China
*
Author to whom correspondence should be addressed.
Water 2022, 14(4), 515; https://doi.org/10.3390/w14040515
Submission received: 25 January 2022 / Revised: 4 February 2022 / Accepted: 5 February 2022 / Published: 9 February 2022

Abstract

:
Mountain channels have received relatively little study compared to lowland rivers due to their complicated fluvial geomorphology and inconvenient traffic. Classification schemes and habitat assessments in mountain channels should be strengthened to provide a scientific basis for river ecological restoration. Therefore, we tried to simplify the habitat assessment of mountain channels using a suitable habitat classification scheme based on high-resolution satellite imagery. We used China’s Chishui River basin because it is a typical mountain river system. Five parameters (stream order, elevation, slope, sinuosity and river network density) and 120 sites were used for habitat classification. In addition, we recorded 20 metrics in four categories (water environmental status, river morphology, riparian zone and human disturbance). Our results identified a total of 40 representative sampling sections belonging to six habitat types that were useful for habitat assessment across the Chishui River basin. The basin was given a mean comprehensive habitat quality index (CHQI) score of 130.66 ± 24.14 and classified under the status “good.” However, the headwaters, Tongmin River, Tongzi River and Xishui River were disturbed by various human activities. We conclude that the process of developing and simplifying our habitat assessment systems can be regarded as a reference for biomonitoring in other mountain river systems.

1. Introduction

Since the 19th century, ecologists and geographers have recognized fundamental differences between mountain channels and their lowland counterparts [1,2,3]. Compared to lowland rivers, mountain channels have more intense hydrologic changes, more variable gradient and morphology, poorer nutrition, and clearer spatial variation in the ecosystem that is prone to forcing by external influences [4]. In the past, mountain channels have received relatively little study compared to lowland rivers because the technology was not good enough to conduct in-depth studies in these areas [5]. Strengthened classification schemes and habitat assessments for mountain channels would help us better understand and predict their response to both human and natural disturbance [6,7]. Furthermore, classifying and assessing river habitats improves our understanding of riverine ecology.
Geomorphic units are the elementary spatial physical features of the river mosaic at the reach scale that are nested within the overall hydromorphological structure of a river and its catchment [8]. Principles of fluvial geomorphology have guided the development of riverine ecology over the past few decades [9]. One axiom associated with fluvial geomorphology is that what initially appears complex is even more so upon further investigation [6]. River habitats have diverse ecological characteristics due to their different aquatic organisms, physical environment, ecosystem pattern, etc., and to a certain extent they determine the state of the river ecosystem [10].
A suitable classification scheme would help simplify otherwise complex river systems. The effort to classify freshwater ecosystems is not new, and various classification approaches have been developed for lakes, streams and wetlands [11,12,13]. For example, Wolfgang et al. indicated five major classified systems of Amazonian white-water river floodplains [14]; Davenport et al. identified sites of urban rivers that have particular qualities or may require particular types of management [15]. Complementarily, biodiversity and ecosystem integrity are being degraded around the world [16,17]. Over the past decades, freshwater ecosystems have become increasingly threatened by various stressors, such as pollution, land use changes, dam construction and water extraction [18,19,20]. As a result, health assessments of freshwater ecosystems are becoming widespread [21]; one part of this evaluation is a habitat assessment. Since the 1980s, different models [22,23], protocols and frameworks [24,25] have been developed to assess river habitats, especially in Europe, North America and Australia [26,27,28]. These methods, to some extent, help measure the physical habitat characteristics of rivers and evaluate the corresponding characteristics. However, there are no systematic standards for habitat assessment. Especially for mountain channels, complicated fluvial geomorphology and inconvenient traffic limit the collection of data and planning needed to customize management activities for unique ecosystems. Our first priority for doing this is to improve environmental monitoring tools.
The upper Yangtze River supports a diverse aquatic fauna and is extremely rich in endemicity, with at least 286 fish species distributed throughout [29]. However, an increase in anthropogenic activities in the Yangtze River over the past decades has disrupted habitats and led to many species becoming extinct or highly endangered [30,31]. As a typical mountain river system, the Chishui River is the last free-flowing tributary of the upper Yangtze River and provides an ideal model to test river ecological principles, as no dams have been built on its main stream [32,33]. In addition, the Chishui River is an important “National Nature Reserve for Rare and Endemic Fishes of the Upper Yangtze River,” a classification established by the Chinese Government in 2005 [33], and an ecology–conservation hotspot. In recent years, increasing research reports on the Chishui River have been proposed to capture the fish diversity patterns, community biology and conservation biology [32,33]. However, little research has been done on habitat classification and habitat assessment. Here, we attempt to simplify the evaluation steps, which we suggest have been insufficiently studied by ecologists and less used by ecosystem managers; we also make it easier to perform habitat assessments on mountain channels using a suitable habitat classification scheme based on high-resolution satellite imagery.
Our efforts to simplify the habitat assessment by categorizing river systems help us achieve, to some extent, the following objectives: (1) categorize river habitats of the Chishui River basin into reasonable ecoregions, (2) assess the habitat condition of rivers throughout the Chishui River basin, (3) identify the existing factors that hinder ecological health, and (4) provide a reference for those working on habitat assessments in other mountain river systems.

2. Materials and Methods

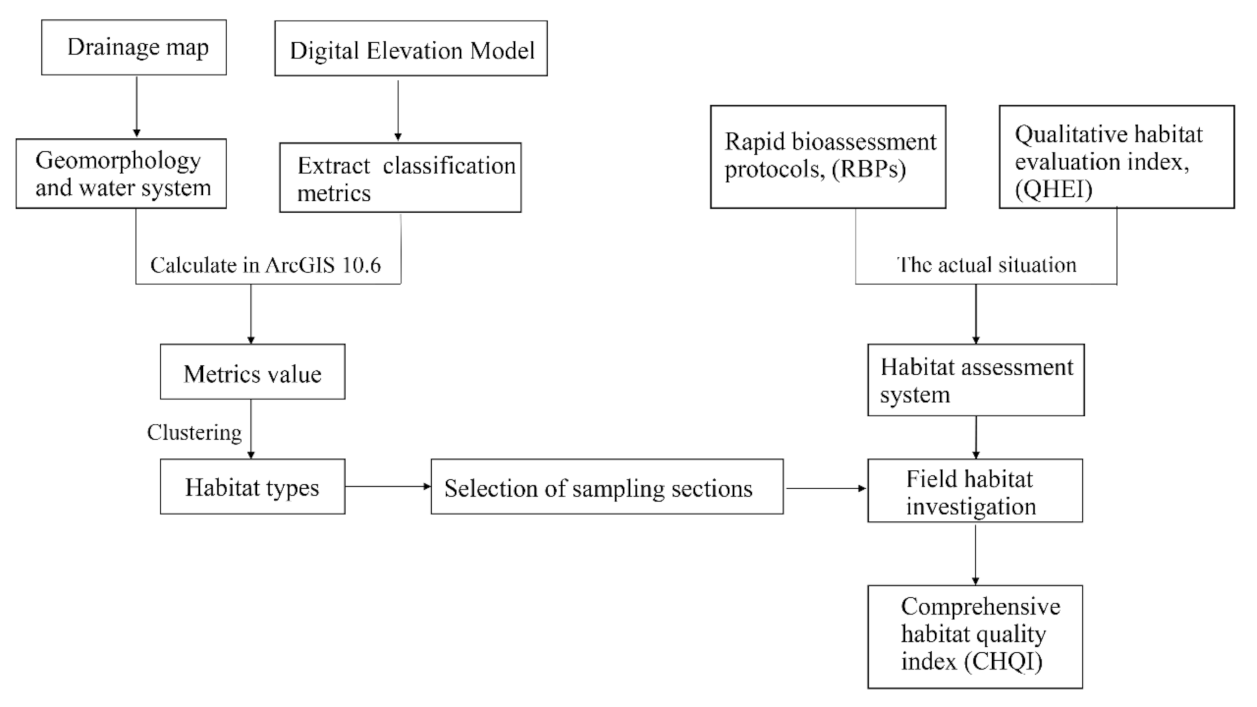
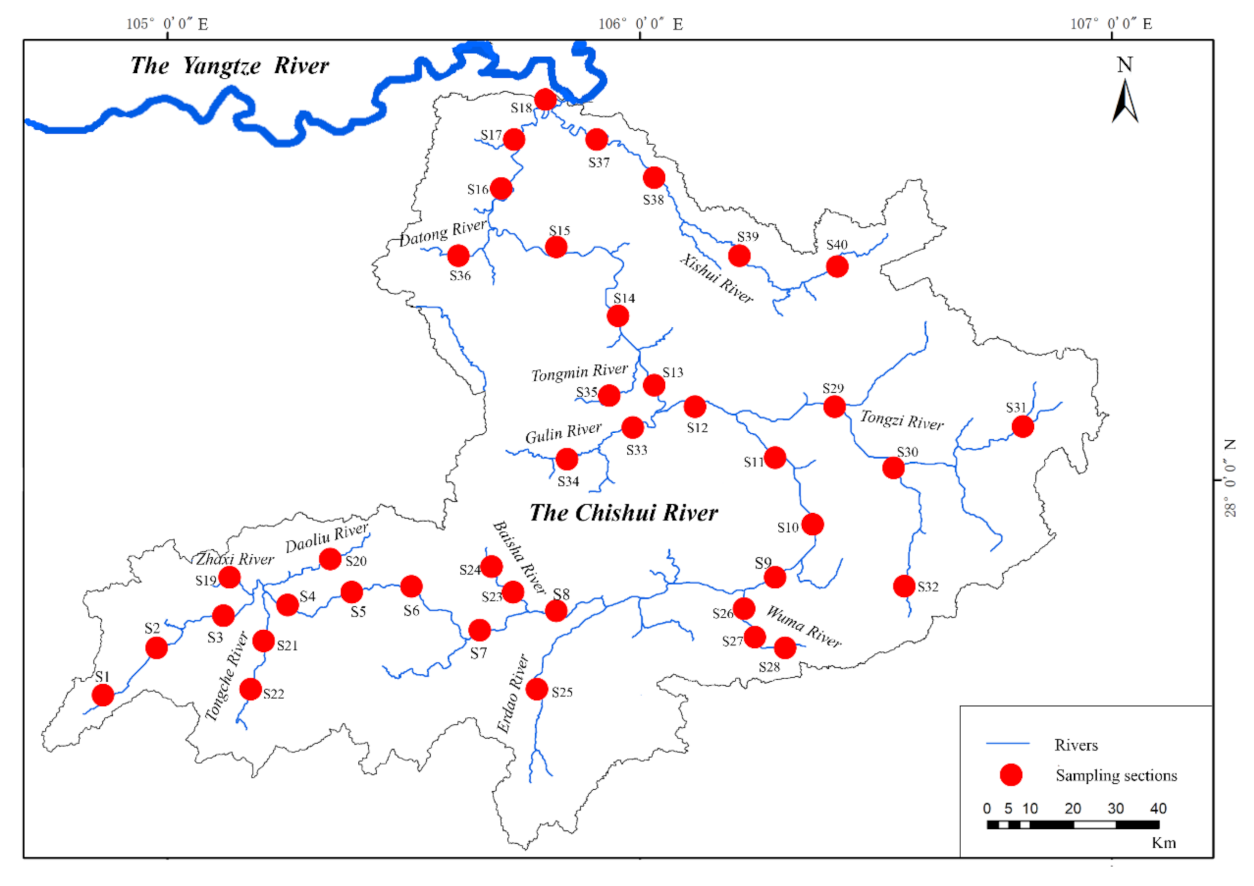
2.1. Study Region and Technical Procedures

The Chishui River basin (27°20′–28°50′ N; 104°45′–106°51′ E) has a drainage area of 20,440 km2 and includes the Chishui River mainstream and its 11 tributaries (in order from upstream to downstream: Zhaxi River, Daoliu River, Tongche River, Baisha River, Erdao River, Wuma River, Tongzi River, Gulin River, Tongmin River, Datong River and Xishui River). The Chishui River originates from the Wumeng Mountains in Yunnan Province and flows through Yunnan, Guizhou and Sichuan Provinces for nearly 436.5 km before meeting the upper Yangtze River in Hejiang County, Sichuan Province, southwest China. These 11 s-order tributaries range from 35 to 150 km long. All of these streams are located in the eastern Yungui Plateau, Sichuan Basin or the transitional area between them. With a subtropical monsoon climate, the annual average rainfall of the Chishui River is about 1000 mm. The Chishui River contains a large amount of laterite soil, which can lead to extensive erosion; thus, it is the origin of the name “Chishui” (i.e., “red river” in Chinese). Karst landforms are mainly distributed in the upper and midstream of the river, and the river’s downstream areas belong to the Sichuan Basin [32,33,34].
For the mountain channels, some scientific methods were needed before field sampling since it was impractical for us to reach all sampling sections. We used habitat classification results to select suitable sampling sections for subsequent habitat assessment. Remote sensing technology was initially used to categorize the river systems; based on these categories, we then selected representative sampling sections from the Chishui River basin that showed a strong capability to distinguish sites of human perturbation. Field habitat surveying and assessment work were then carried out, and the comprehensive habitat quality index (CHQI) was finally calculated. The detailed procedures are shown in Figure 1.

2.2. Habitat Classification

2.2.1. Extraction of Basic Data

As many data sites as possible in the Chishui River basin were initially selected based on Google Earth Pro software and a 1:250,000 high-definition drainage map. About three data sites were collected for each 10 km of riverbank for a total of 120 data points (Figure 2). The 30 m resolution Digital Elevation Model (DEM) was downloaded and cut via Global Mapper software (v. 21.0). With reference to the monograph [35], basic data were used to calculate parameters that, for the habitat classification, were extracted for each data site with ArcGIS software (v.10.6.1) based on 30 m-resolution DEM databases. The specific steps included filling the sink, analysis of flow direction, analysis of flow accumulation, reclassification of flow, river linking, vectorization (extracting water systems) and classification of the stream net. An algorithm for D8 flow direction, spatial analysis and the Strahler stream net classification method were used in the above steps. These basic data provided river information, subbasin boundaries and altitude for parameter calculations.

2.2.2. Parameters Used for the Habitat Classification

Classification parameters that reflect fluvial geomorphology, physical form and hydrological characteristics were selected based on the inherent attributes of classification parameters and the habitat characteristics of mountain channels. With reference to the previous studies [36,37], five parameters were used: stream order, elevation (m), slope (km/km), sinuosity (km/km) and river network density (km/km2). Elevation reflects the topographic conditions, slope and sinuosity show the river’s physical form, and river network density and stream order illustrate the river system’s structure. Datasets with elevation and stream order were directly extracted from ArcGIS 10.6, and the other three parameters were defined as follows:
P   =   E u     E d L v
where P is the slope, Eu is the elevation of river inlet, Ed is the elevation of river outlet and Lv is the basin centerline (the straight length between the inlet and outlet of the river).
S   =   L r L v
where S is the sinuosity, Lr is the river centerline (the actual length between the inlet and outlet of the river) and Lv is the basin centerline (the same as above).
D   =   L A
where D is the river network density, L is the total length of the river network and A is the area of the basin.

2.2.3. River Habitat Classification

To determine the spatial patterns of habitats in the Chishui River basin, data on the above five parameters were used in the following analyses: (1) Analysis of similarity (ANOSIM) was carried out to determine the differences between different site-groups. (2) Similarity of percentage analysis (SIMPER) was used to identify parameters that were principally responsible for similarities within site-groups [32]. (3) Cluster analysis (a group average hierarchical sorting strategy) and nonmetric multidimensional scaling (NMDS) ordination analysis were used to classify the spatial patterns of habitat in the Chishui River basin [38]. All these steps were performed with the PRIMER 5 software package [39].
Habitat types were classified using the clustering methods above and named based on the most significant characteristic parameter based on river hydromorphology and physical habitats. The rivers were divided into headwater, upstream, midstream, downstream, estuary and tributaries based on the location of the data sites; straight rivers and curved rivers based on sinuosity values; steep mountain rivers and flat rivers based on slope; and sparse river networks and dense river networks based on the river network density [37].

2.3. Habitat Evaluation

2.3.1. Metrics Used for the Habitat Assessment Criteria

We selected 20 metrics in four categories for habitat evaluation based on authoritative research [40,41]: water environmental status (pool form, transparency, water smell, flow regime, water color); river morphology (riverbed type, sedimentation characteristics, silt coverage, embeddedness, sinuosity, river harden and canalization); riparian zone (riparian stability, riparian plant width, riparian plant coverage, dominant vegetation); and human disturbance (sewage outlet, solid waste point, dams and channel engineering, cross-river bridge, residential and industrial area). All of these metrics were finally used to establish habitat assessment criteria as shown in Table 1. We then calculated the metric values for each sampling section.

2.3.2. Habitat Sampling

Using the results of habitat classification and depending on sampling operability, we collected data on habitat types and stream morphology, physical habitats and hydrological characteristics at different spaces from the mainstream and 11 tributaries for a total of 40 sampling sections along the Chishui River (mainstream = 18, tributaries = 22) (Figure 3). Field habitat surveys were conducted in March–May 2021.
For each sampling section, three survey units within the visible range (approximately 500–800 m) were randomly selected, and each unit was treated as a sample square (including the left and right banks) 100 m long. Due to the high heterogeneity of the river habitat, multiple sampling tools were adopted during surveys, included cameras, GPS devices, laser rangefinders, telescopes, water harvesters, bottom dip nets and mud harvesters.

2.3.3. Determination of Comprehensive Habitat Quality Index (CHQI)

To quantify the assessment process, we calculated the comprehensive habitat quality index (CHQI) to evaluate how degenerated the river habitat was using the formula below. To avoid any subjectivity in the discrete scoring, all metrics were scored on a continuous scale from 0 to 200 [42,43]. Each metric received a score of 0–10 based on the habitat assessment criteria (Table 1). The scores for each metric were summed to obtain CHQI, which were divided into five grades based on the relevant habitat score standard: (1) CHQI > 150: excellent, (2) 120 < CHQI ≤ 150: good, (3) 90 < CHQI ≤ 120: fair, (4) 60 < CHQI ≤ 90: poor and (5) CHQI ≤ 60: bad [42,43,44].
C H Q I section   =   i n   =   20 G i   three   units 3
where CHQI is the value of the sampling section habitat and Gi denotes the value for each metric. CHQI can be determined as the average of the scores from all three units in each sampling section.

3. Results

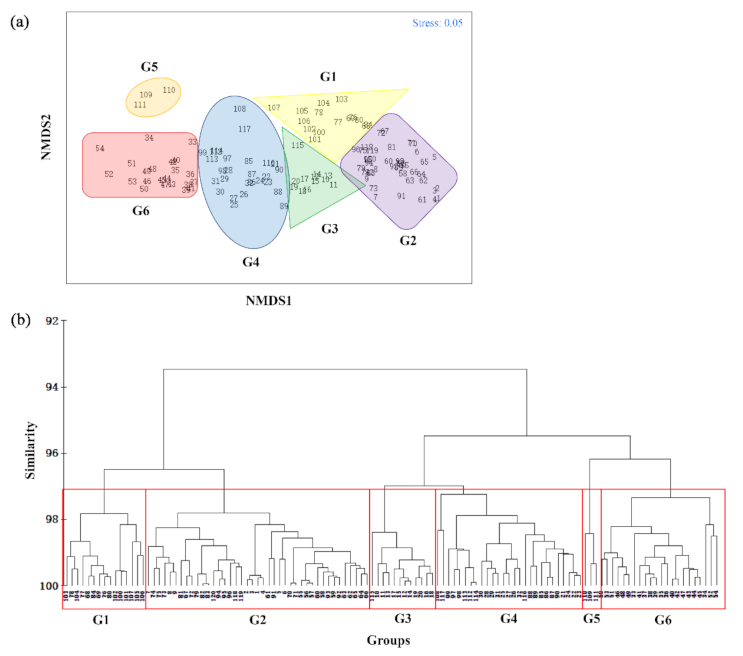
3.1. Spatial Habitat Types

River fragments and subbasins were calculated by spatial analysis in ArcGIS software. A total of 109 river fragments 0.08–59.45 km long were obtained and finally combined into the mainstream and 11 tributaries of the Chishui River in this study. In addition, the Chishui River basin was divided into eight subbasins with areas of 896.59–4732.95 km2 and circumferences of 140.18–427.62 km.
All the 120 data sites were divided into six sub-groups based on the spatial patterns of the river habitats: group 1 (G1): steep tributaries habitat (15 data sites); group 2 (G2): high-altitude headwater habitat (41 data sites); group 3 (G3): upstream dense river net habitat (12 data sites); group 4 (G4): midstream low-curved habitat (27 data sites); group 5 (G5): low-altitude estuary tributaries habitat (3 data sites); and group 6 (G6): downstream flat habitat (22 data sites). These are shown in Figure 4 and Table 2 based on cluster and ordination analyses. ANOSIM (p < 0.05) and the stress value of NMDS was 0.05 (less than 0.2), which further confirmed that the six sub-groups were significantly different [32]. The sub-groups were named based on the following characteristics: group 1 had the highest mean slope value (0.0186) and lowest mean stream order value; data sites in group 2 were characterized by high elevation (996.49 m); group 3 had a high mean river network density value (0.10) whereas group 4 had a low mean river network density value (1.24); groups 5 and 6 were characterized by low elevation and low slope value, and group 5 was located in an estuary of Chishui River (Table 2). The results of SIMPER analysis showed that data sites within each group have high similarity (from 96.37–98.77%). Group 2 and group 6 have the highest average dissimilarity (14.12%) (Table 3).
Our results also showed that the high-altitude headwater habitat (G2) has the highest proportion (34.17%), while the low-altitude estuary tributaries habitat (G5) had the lowest proportion (2.50%), so we created 14 and three sampling sections, respectively, in these habitat types during field surveys for habitat assessment. In addition, five, four, nine and seven sampling sections were adopted in the corresponding habitat types below: steep tributaries habitat (G1), upstream dense river net habitat (G3), midstream low-curved habitat (G4) and downstream flat habitat (G6). A total of 40 representative sampling sections belonging to six habitat types were finally set to simplify habitat assessment across the Chishui River basin (Figure 3, Table 2).

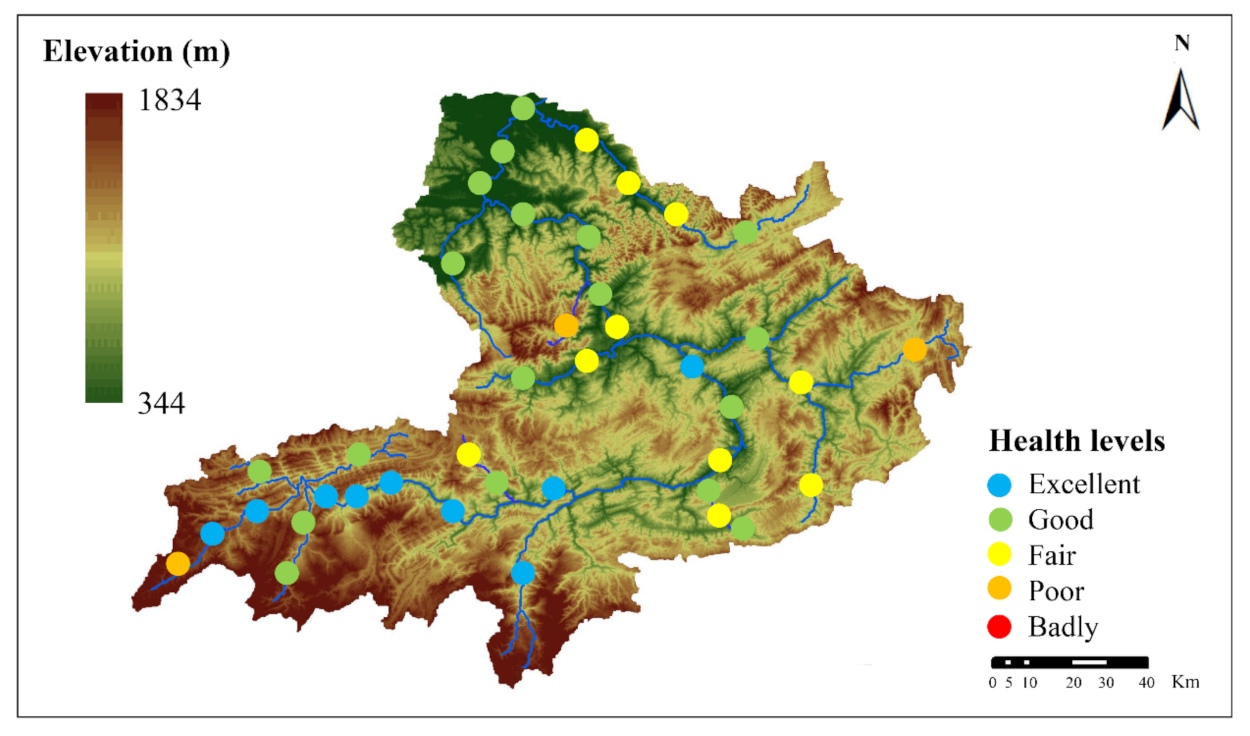
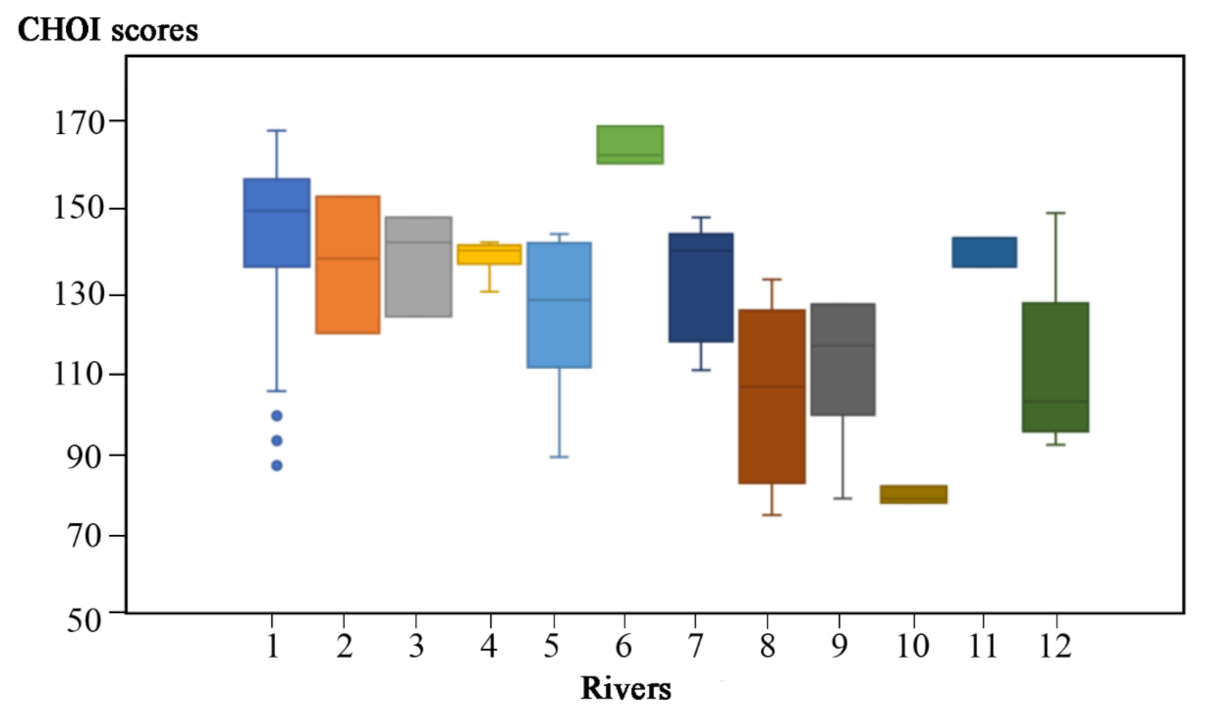
3.2. CHQI and Habitat Health

The final CHQI scores for the 40 sampling sections ranged from 75 to 120 with the mean ± SD of 130.66 ± 24.14. The mean score was between 120 and 150, meaning that the ecological health of the Chishui River basin habitats was classified as good: nine sampling sections were excellent, 18 were good, 10 were fair and three were poor (Figure 5). Among them, a unit of S1 was scored 87 due to poor water quality; units in both S31 and S35 ranged from 75 to 82; and S2–S8, S11 and S25 were classified as having an excellent habitat status with high CHQI scores.
According to the mean ± SD values of CHQI scores, the habitat health conditions for the Chishui River’s mainstream and eleven tributaries were: mainstream: 142.74 ± 18.94, Zhaxi River: 136.00 ± 13.49, Daoliu River: 137.00 ± 10.19, Tongche River: 137.67 ± 3.99, Baisha River: 124.00 ± 18.52, Erdao River: 163.67 ± 3.86, Wuma River: 131.11 ± 13.24, Tongzi River: 105.00 ± 20.16, Gulin River: 111.50 ± 16.88, Tongmin River: 79.67 ± 1.69, Datong River: 139.67 ± 3.29 and Xishui River: 110.33 ± 18.85. All three units of S25 in the Erdao River were classified as excellent and no site was considered poor. S31 of Tongzi River and S35 of Tongmin River had six units that were classified as having poor status, whereas eight units of Xishui River were classified as having fair status, accounting for 66.67% of the total units (Figure 6).

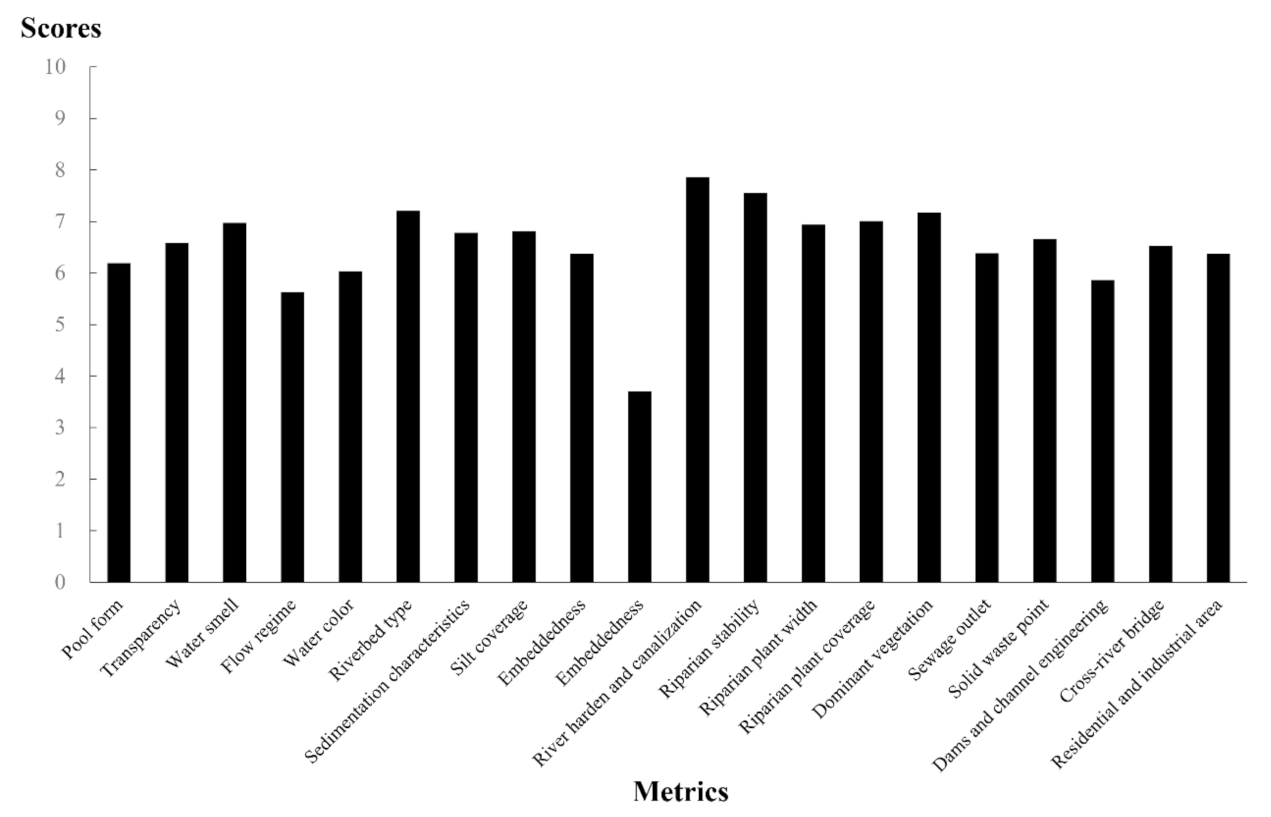
3.3. Traits of the Metrics and Habitat Characteristics

The five parameters used for the habitat classification differed among the headwater, upstream, midstream, downstream and tributaries of the Chishui River [32]. Our results from the 120 data sites showed that the average elevation of headwater (data sites 1–15, above Potou Town), upstream (data sites 16–30, Potou Town to Maotai Town), midstream (data sites 31–42, Maotai Town to Hushi Town), downstream (data sites 43–54, Fuxing Town to Hejiang Town) and tributaries (data sites 55–120) was 1101.6 ± 299.92 m, 509.73 ± 113.02 m, 295.87 ± 46.19 m, 226.56 ± 11.81 m and 652.92 ± 289.18 m, respectively. Among the 11 tributaries, Tongche River had the highest average elevation (1138.33 m), whereas Datong River had the lowest average elevation (302.33 m). The mean sinuosity was 1.36±0.38, ranging from 1.09 to 2.81; sinuosity was highest in Hejiang Town and lowest in Maotai Town. On the whole, tributaries and downstream had higher sinuosity, followed by the midstream, whereas upstream and the headwater had the lowest. The highest slope (0.034) appeared in Jianzhu Town (Baisha River), and the lowest (0.0001) appeared in Changsha Town (Xishui River). In general, the slopes were highest in the headwater, Baisha River, Erdao River and Wuma River, and lowest in the midstream, downstream, Xishui River, Datong River and Tongmin River. The average river network density was 0.083 ± 0.02 (km/km2), between 0.04 and 0.16. Generally, the headwater and upstream had higher densities of river networks, followed by the midstream, downstream, and tributaries. The Chishui River basin consisted of four grades of stream order due to the Strahler algorithm and the natural growth of the river system (Figure 2 and Figure 7).
Our results showed that the 20 metrics in four categories that we chose for the habitat assessment ranged in average scores between 3.70 and 7.86, with river harden and canalization being the greatest and sinuosity being the lowest, of which metrics (riverbed type, river harden and canalization, riparian stability, riparian plant coverage, dominant vegetation) had the higher scores, all greater than 7. However, the average scores of the metrics (flow regime, sinuosity, dams and channel engineering) were lower, all less than 6. In addition, results of these four metric categories showed that the average score of the riparian zone was 7.17, whereas the parallels of water environmental status, river morphology and human disturbance were 6.28, 6.46 and 6.36, respectively. In summary, their higher scores suggested that riparian stability and riparian plant width were the most stable metrics in the Chishui River basin. The results are shown in Figure 8.
We also found spatial differences among the 20 metrics used for the habitat assessment in the headwater, upstream, midstream, downstream and tributaries. The scores of some metrics (pool form, transparency, water smell, flow regime, water color) in the Chishuiyuan Town section (S1) were significantly lower than those of other sampling sections. The scores of some metrics (sewage outlet, residential and industrial area) in Maotai Town (S9) were lower than those of other sampling sections. Among the tributaries, Erdao River had the best habitat health due to its high-scoring metrics, whereas Tongmin River, Tongzi River and Xishui River had the poorest scores due to disturbances from various human activities.

4. Discussion

4.1. Performance of Our Habitat Assessment System

A more refined and convenient habitat assessment system is required to research river hydromorphology and the physical habitats of mountain channels [5]. Principal characteristics of our habitat assessment system are that it (1) simplifies the habitat assessment by using a suitable habitat classification scheme, (2) classifies this basin into six types of habitats based on high-resolution satellite imagery, (3) synthesizes the cumulative metrics of a wide variety of environmental disturbances that match river hydromorphology and physical habitats and (4) provides universal research methods for other mountain river systems. However, there are some potential limitations of this research to be aware of, including (1) dynamic changes in the river habitat could not be reflected due to a lack of historic data and (2) there was no photographic coverage for a small portion of a few habitat areas, such as data sites 21–24.
Mountain channels are a unique ecosystem characterized by complex and varied habitats. A previous study performed qualitative habitat classification on the Chishui River mainstream based on the longitudinal variations in topography, altitude, climate and vegetation; it concluded that the mainstream is divided into four natural regions: headwater, upstream, midstream and downstream [45]. Our study complements Wang et al. by quantitatively identifying the differences in habitat characteristics in the Chishui River basin (the mainstream and 11 tributaries) [45]. First, six habitat sub-groups that our study defined provide a basis for managing and assessing environmental protection activities. We found considerable differences in the habitat characteristic parameters among the six habitat sub-groups. Of the six sub-groups studied, the high-altitude headwater habitat was the most widespread. Table 2 presents the most characteristic and distinctive attributes.
Most of our study area is located in the eastern Yungui Plateau and is characterized by high mountains, deep valleys and scarce vegetative cover. Upstream dense river net habitats are located on the sloping Yungui Plateau, with a predominance of riffles, rocky bottoms, scarce vegetative cover and developed water system. Midstream low-curved habitat mainly lies in the transitional area between the Yungui Plateau and the Sichuan Basin, with a relatively soft slope and moderate vegetative cover. Downstream flat habitat is located on the edge of the Sichuan Basin, with a predominance of sandy substrate, reduced water flow and lush vegetative cover [33,45]. Steep tributary habitats emerge from each tributary, while low-altitude estuary tributary habitats only appear downstream of Xishui River with the narrowest distribution. In many respects the habitat sub-groups were therefore quite distinct from each other. Additionally, the habitat sub-groups defined by this study could also be useful as the criteria for selecting sampling points scientifically, which would simplify subsequent habitat assessments. Based on experience from previous surveys of the Chishui River basin, some sampling sections were found to be difficult to reach and collect data from due to their complicated fluvial geomorphology and inconvenient traffic, e.g., areas that were between data sites 21 (Qingchi Town) and 24 (Maotai Town) (Figure 2) and areas that lay upstream of Tongzi River. All these areas are characterized by steep mountains and long canyons. Therefore, we used remote sensing technology to identify sampling sections that were representative of these areas. Data sites 20 and 25–32, having convenient traffic, were selected to represent data sites 21–24 since all data sites from 21 to 32 belonged to group 4: midstream low-curved habitat (Figure 2 and Figure 4). We thus sampled the sections S8–S11 to reflect the habitat of these areas where we went to actually sample (Figure 3). Similarly, 120 data sites were finally combined into 40 sampling sections to create a scientifically simplified habitat assessment of mountain channels.
Using 20 metrics that reflect the quality of hydrology, channel, riparian and direct human activities, we created a habitat assessment system that is more comprehensive than previous ones [40,41]. The results obtained using these metrics are easy to translate into values that are meaningful to the general public [43]. It is worth mentioning that quantitative metrics based on different factors of interference—such as transparency, silt coverage and sewage outlet—responded noticeably to human disturbance. Unlike the quantitative metrics, several qualitative metrics also appeared in our studies, such as water smell, water color and riverbed type, because they are capture ecological and environmental differences among habitats that other metrics do not [46]. Therefore, we argue that these 20 metrics complement each other well. Additionally, we only sampled in March–May because, in reality, physical habitats are stable since they have a longer cycle time of change, whereas hydrological characteristics are highly dynamic and change seasonally as rainfall varies. Due to rainfall, mountain rivers are divided into wet periods and dry periods, and the Chishui River is a typical rain-source river [47]. Even though changes in natural water levels also alter habitats, we wanted to track how human disturbances, but not natural changes, impact these river habitats. A previous study suggested that, to reflect general river habitat and hydrological characteristics objectively, habitat sampling should be conducted during periods with stable hydrology, such as at the transition of spring and summer (March–May), because flow conditions and hydrological fluctuations were less dynamic then [46].
Similarly, there are a large number mountain channels like the Chishui River in the upper Yangtze River, such as the Han River, the Jinsha River, and the Dadu River [31,32,48]. Characterized by complex and varied river habitats, they are also hard to research since complicated fluvial geomorphology and inconvenient traffic limit the collection of data and the planning needed to customize management activities for unique ecosystems. Therefore, the steps of developing and simplifying our habitat assessment systems presented herein will be helpful for habitat assessments not only in this region, but also in other mountain channels with similar characteristics related to human disturbance.

4.2. Habitat Status of the Chishui River Basin

Unlike most rivers in China, as a recognized ecological river basin, the Chishui River basin was generally classified as having a good ecological status with a mean CHQI score of 130.66 based on our results. Previous research has shown that areas with relatively low human population density and lush forests are generally healthy, whereas sites with a poor status were densely populated with a high degree of clustering and had certain human activities around that seriously impacted them [49]. Similarly, in our study we found that sites with “excellent” and “good” status were all distributed in sparsely populated regions with a good vegetation coverage and little industrial or agricultural activity, such as in S2 (Guozhu Town), S4 (Shuitian Town), S14 (Hushi Town) and S25 (Malu Town). This may be because they were not impacted much by anthropogenic factors [48]. By comparison, sampling sections with “fair” and “poor” status differed primarily in the extent to which they were urbanized and had industrial and agricultural activity, such as in S1 (Chishuiyuan Town), S31 (Guancang Town), S35 (Tongmin Town) and S37 (Changsha Town).
The mainstream of the Chishui River basin had an average CHQI score of 142.74, which means that it is healthy; nevertheless, it is experiencing a variety of problems. Several sampling sections of the mainstream (S1, S9 and S12) had lower CHQI scores (102.33, 109.33 and 118.67, respectively). Although it had good vegetation cover, S1 (Chishiuiyuan Town) had little runoff and was seriously polluted by local domestic sewage. Based on our investigation, river channels with smelly and polluted water, low transparency, hardening and canalization are poor habitat environments. We found that excessive domestic sewage from Chishiuiyuan Town was leaking into the river channel and destroying its ecological balance. Now, the local government has taken measures to remedy this damage; for example, it prohibited domestic sewage from being discharged into the river channel and built sewage treatment plants in proximity to the stream channel. In addition, S9 (Maotai Town) and S12 (Taiping Town) were classified under the “fair” ecological status and shown to suffer from frequent industries. Without management measures, these areas will likely be classified as “poor” in the near future. Maotai Town is well-known around the world for its famous white spirit [33]. In recent years, pollution from wineries and excessive construction activities have enveloped Maotai Town and further damaged its river’s health [33]. Commercial shipping and industrial and mining enterprises of Taiping Town also have an impact on habitat health. According to our survey, damage from frequent water transportation and various mining operations are having serious effects on the region’s waterways.
Of the 11 tributaries of the Chishui River basin, streams with “excellent” and “good” condition accounted for 4.55% and 54.55%, respectively, whereas streams with a “fair” and “poor” status accounted for only 27.27% and 13.63%, respectively, and no streams were rated “bad.” Erdao River and Datong River are the healthiest according to their CHQI scores, mainly because their surrounding areas have lots of forest and little anthropogenic impact from industry and agriculture [49]. Regrettably, Tongmin River, Tongzi River, Xishui River and Gulin River were classified as “fair” or “poor,” with average CHQI scores of 79.67, 105.00, 110.33 and 111.55, respectively. As the largest tributary of the Chishui River, several upstream sampling sections of Tongzi River—such as S30 (Huoshigang Town) and S31 (Guancang Town)—were classified as “poor,” with CHQI scores of 97.33 and 76.67, respectively. Tongzi River is characterized by high dams and large reservoirs, such as Yangjiayuan Dam and Yuanmanguan Dam, the construction of which has led to the fragmentation of habitats that aquatic organisms depend on and the increasing nonrheophilic and pollution-tolerant species [48] Moreover, S30 and S31 suffer from both industrial sewage (coal industries) and domestic sewage. S35 (Tongmin Town) of Tongmin River suffers severely from human interference, construction and industrial activities. Construction activities have recently increased in Tongmin River, which is further degrading its habitats. Similarly, Gulin River is suffering from other human disturbances, in spite of its current marginal good condition. We found that domestic sewage is gradually polluting the channel of Gulin River. In addition, S37 (Changsha Town) and S39 (Shibao Town) are affected by dams and at least 15 hydropower stations have been built on the Xishui River [32]. It was shown that these cascade dams not only block the migration routes of fishes and reduce the heterogeneity of the habitat, but also cause frequent and irregular fluctuations in water level, habitat size and food resources [50]. More seriously, Xishui River below the Gaodong Dam often dries up. Therefore, effective measures need to be implemented immediately to deal with these problems.

5. Conclusions

The development of classifications and assessments for mountain channel habitats is an ongoing issue, and convenient and effective methods are needed. To solve the limitations of complicated fluvial geomorphology and inconvenient traffic in mountain channels, a suitable habitat classification scheme based on high-resolution satellite imagery was used to simplify the habitat evaluation steps. A total of 40 representative sampling sections belonging to six habitat types were used for habitat assessment across the Chishui River basin. Among them, the high-altitude headwater habitat (G2) had the highest proportion (34.17%), whereas the low-altitude estuary tributaries habitat (G5) had the lowest proportion (2.50%). Data sites 20 and 25–32, having convenient traffic, were selected to represent data sites 21–24, which had complicated fluvial geomorphology, since all data from sites 21 to 32 belonged to group 4: midstream low-curved habitat. The basin was given a mean comprehensive habitat quality index (CHQI) score of 130.66 ± 24.14 and classified under the status “good.” However, the headwaters, Tongmin River, Tongzi River and Xishui River were disturbed by various human activities. We believe that the process of developing and simplifying our habitat assessment systems presented herein will be helpful for ecosystem assessment, not only in this region but also in other mountain channels with similar characteristics related to human disturbance.

Author Contributions

J.W., F.Y. and F.L. conceived and designed the investigation; F.Y., F.L., Z.X., C.X., and P.L. performed field work; F.Y., Z.X. and J.W. analyzed the data; M.H. and X.Z. contributed materials and analysis tools; Writing—original draft preparation, F.Y. and J.W.; Writing—review and editing, J.W. and F.Y.; project administration, J.W. and F.L. All authors have read and agreed to the published version of the manuscript.

Funding

This study was supported by grants from the Biodiversity Survey and Assessment Project of the Ministry of Ecology and Environment, China (2019HJ2096001006), the Ministry of Agriculture and Rural Affairs of China (CJDC-2017), the China Three Gorges Corporation (0799574) and Sino BON-Inland Water Fish Diversity Observation Network.

Institutional Review Board Statement

Not applicable.

Informed Consent Statement

Not applicable.

Data Availability Statement

The datasets used and/or analyzed during the current study are available from the corresponding author upon reasonable request.

Acknowledgments

The authors thank constructive advice from Wenjing Li, Zhen Wang and Xiao Qu for improving the manuscript.

Conflicts of Interest

The authors declare that they have no conflict of interest.

References

  1. Surell, A. Étude sur les Torrents des Hautes-Alpes; Carilian-Goeury: Paris, France, 1841. [Google Scholar]
  2. Dana, J.D. On denudation in the Pacific. Am. J. Sci. 1850, 2, 48–62. [Google Scholar]
  3. Shaler, N.S. The Origin and Nature of Soils; U.S. Geological Survey 12th Annual Report. 1891; pp. 213–345. Available online: https://xueshu.baidu.com/usercenter/paper/show?paperid=893ebca413bf00a03b4c0fa65ca4a84e&site=xueshu_se&hitarticle=1 (accessed on 3 February 2022).
  4. Flotemersch, J.E.; North, S.; Blocksom, K.A. Evaluation of an alternate method for sampling benthic macroinvertebrates in low-gradient streams sampled as part of the National Rivers and Streams Assessment. Environ. Monit. Assess. 2014, 186, 949–959. [Google Scholar] [CrossRef] [PubMed] [Green Version]
  5. Montgomery, D.R.; Buffington, J.M. Channel-reach morphology in mountain drainage basins. Geol. Soc. Am. Bull. 1997, 109, 596–611. [Google Scholar] [CrossRef]
  6. Rosgen, D.L. A Classification of Natural Rivers. Catena 1994, 22, 169–199. [Google Scholar] [CrossRef] [Green Version]
  7. Hughes, R.M.; Herlihy, A.T.; Kaufmann, P.R. An Evaluation of Qualitative Indexes of Physical Habitat Applied to Agricultural Streams in Ten U.S. States1. JAWRA J. Am. Water Resour. Assoc. 2010, 46, 792–806. [Google Scholar] [CrossRef]
  8. Belletti, B.; Rinaldi, M.; Bussettini, M.; Comiti, F.; Gurnell, A.; Mao, L.; Nardi, L.; Vezza, P. Characterising physical habitats and fluvial hydromorphology: A new system for the survey and classification of river geomorphic units. Geomorphology 2017, 283, 143–157. [Google Scholar] [CrossRef]
  9. Lee, B.; Leroy, P.N.; Daniel, M.; Thomas, D.; Gordon, R.; George, P.; Michael, P. The Network Dynamics Hypothesis: How Channel Networks Structure Riverine Habitats. BioScience 2004, 54, 413–427. [Google Scholar]
  10. Soranno, P.A.; Spence, C.K.; Webster, K.E.; Bremigan, M.T.; Wagner, T.; Stow, C.A. Using Landscape Limnology to Classify Freshwater Ecosystems for Multi-ecosystem Management and Conservation. BioScience 2010, 60, 440–454. [Google Scholar] [CrossRef] [Green Version]
  11. Brinkhurst, R.O. The Benthos of Lakes; St. Martin’s Press: New York, NY, USA, 1974. [Google Scholar]
  12. Shuter, B.J.; Jones, M.L.; Korver, R.M.; Lester, N.P. A general, life history based model for regional management of fish stocks: The inland lake trout fisheries (Salvelinus namaycush) of Ontario. Can. J. Fish. Aquat. Sci. 1998, 55, 2161–2177. [Google Scholar] [CrossRef]
  13. Euliss, N.H.; LaBaugh, J.W.; Fredrickson, L.H.; Mushet, D.M.; Laubhan, M.K.; Swanson, G.A.; Winter, T.C.; Rosenberry, D.O.; Nelson, R.D. The wetland continuum: A conceptual framework for interpreting biological studies. Wetlands 2004, 24, 448–458. [Google Scholar] [CrossRef]
  14. Wolfgang, J.J.; Maria, T.; Fernandez, P.; Schoengart, J.; Wittmann, F. A classification of major natural habitats of Amazonian white-water river floodplains (va´rzeas). Wetl. Ecol. Manag. 2012, 20, 461–475. [Google Scholar]
  15. Davenport, A.J.; Gurnella, A.M.; Armitage, P.D. Habitat survey and classification of urban rivers. River Res. Appl. River Res. Appl. 2004, 20, 687–704. [Google Scholar] [CrossRef]
  16. Dudgeon, D.; Arthington, A.H.; Gessner, M.O.; Kawabata, Z.; Knowler, D.J.; Leveque, C.; Naiman, R.J.; Prieur Richard, A.H.; Soto, D.; Stiassny, M.L. Freshwater biodiversity: Importance, threats, status and conservation challenges. Biol. Rev. 2010, 81, 163–182. [Google Scholar] [CrossRef]
  17. Corlett, R.T. Tropical rainforests and climate change. Ref. Modul. Earth Syst. Environ. Sci. 2016, 1–5. [Google Scholar]
  18. Ormerod, S.; Dobson, M.; Hildrew, A.; Townsend, C. Multiple stressors in freshwater ecosystems. Freshw. Biol. 2010, 55, 1–4. [Google Scholar] [CrossRef]
  19. Gomes-Silva, G.; Cyubahiro, E.; Wronski, T.; Riesch, R.; Apio, A.; Plath, M. Water pollution affects fish community structure and alters evolutionary trajectories of invasive guppies (Poecilia reticulata). Sci. Total Environ. 2020, 730, 138912. [Google Scholar] [CrossRef] [PubMed]
  20. Ngor, P.B.; McCann, K.S.; Grenouillet, G.; So, N.; McMeans, B.C.; Fraser, E.; Lek, S. Evidence of indiscriminate fishing effects in one of the world’s largest inland fisheries. Sci. Rep. 2018, 8, 1–12. [Google Scholar] [CrossRef] [PubMed] [Green Version]
  21. Ruaro, R.; Gubiani, É.A. A scientometric assessment of 30 years of the Index of Biotic Integrity in aquaticecosystems: Applications and main flaws. Ecol. Indic. 2013, 29, 105–110. [Google Scholar] [CrossRef]
  22. Bovee, K.D. A Guide to Stream Habitat Analysis Using the Instream Flow Incremental Methodology; Instream flow information paper No.12. FWS/OBS-82-26; US Fish and Wildlife Service Biological Services Program: Bailey’s Crossroads, VA, USA, 1982. [Google Scholar]
  23. Hill, J.; Grossman, G.D. An energetic model of microhabitat use for rainbow trout and rosyside dace. Ecology 1993, 74, 685–698. [Google Scholar] [CrossRef]
  24. Maddock, I. The importance of physical habitat assessment for evaluating river health. Freshw. Biol. 1999, 41, 373–391. [Google Scholar] [CrossRef]
  25. Vaughan, I.P. Habitat indices for rivers: Derivation and applications. Aquat. Conserv. 2010, 20, 4–12. [Google Scholar] [CrossRef]
  26. Barbour, M.T. Biological assessment strategies: Applications and limitations. In Whole Effluent Toxicity Testing: An Evaluation of Methods and Prediction of Receiving System Impacts; Grothe, D.R., Dickson, K.L., Reed, D.K., Eds.; SETAC Press: Pensacola, FL, USA, 1996; pp. 245–270. [Google Scholar]
  27. Davies, N.M.; Norris, R.H.; Thoms, M.C. Prediction and assessment of local stream habitat features using large-scale catchment characteristics. Freshw. Biol. 2000, 45, 343–369. [Google Scholar] [CrossRef]
  28. Oliveira, S.V.; Cortes, R.M.V. A biologically relevant habitat condition index for streams in northern Portugal. Aquat. Conserv. 2005, 15, 189–210. [Google Scholar] [CrossRef]
  29. He, Y.F.; Wang, J.W.; Lek, S.; Cao, W.X.; Lek-Ang, S. Structure of endemic fish assemblage in the upper Yangtze River Basin. River Res. Appl. 2011, 27, 59–75. [Google Scholar] [CrossRef]
  30. Lin, P.C.; Liu, F.; Li, M.Z.; Gao, X.; Liu, H.Z. Spatial pattern of fish assemblages along the river-reservoir gradient caused by the Three Gorge Reservoir (TGR). Acta Hydrobiol. Sin. 2018, 42, 1124–1134. [Google Scholar]
  31. Zhang, X.; Gao, X.; Wang, J.W.; Cao, X.W. Extinction risk and conservation priority analysis for 64 endemic fishes in the Upper Yangtze River, China. Environ. Biol. Fishes 2015, 98, 261–272. [Google Scholar] [CrossRef]
  32. Liu, F.; Wang, J.; Zhang, F.B.; Liu, H.Z.; Wang, J.W. Spatial organization of fish assemblages in the Chishui River, the last free-flowing tributary of the upper Yangtze River, China. Ecol. Freshw. Fish 2020, 30, 1–13. [Google Scholar]
  33. Wu, J.; Wang, J.; He, Y.; Cao, W. Fish assemblage structure in the Chishui River, a protected tributary of the Yangtze River. Knowl. Manag. Aquat. Ecosyst. 2011, 400, 170–181. [Google Scholar] [CrossRef] [Green Version]
  34. Jiang, X.M.; Xiong, J.; Xie, Z.C.; Chen, Y.F. Longitudinal patterns of macroinvertebrate functional feeding groups in a Chinese river system: A test for river continuum concept (RCC). Quat. Int. 2011, 244, 289–295. [Google Scholar] [CrossRef]
  35. Tang, G.A.; Yang, X. Experimental Tutorial on Spatial Analysis of Geographic Information System; Science Press: Beijing, China, 2012. [Google Scholar]
  36. Higgins, J.V.; Bryer, M.T.; Khoury, M.L.; Fitzhugh, T.W. A freshwater classification approach for biodiversity conservation planning. Conserv. Biol. 2005, 19, 432–445. [Google Scholar] [CrossRef]
  37. Kong, W.J.; Zhang, Y.; Wang, Y.H. River habitats classification in Taizi River based on spatial data. Res. Environ. Sci. 2013, 26, 487–493. [Google Scholar]
  38. Oksanen, J.; Blanchet, F.G.; Friendly, M.; Kindt, R.; Legendre, P.; McGlinn, D.; Solymos, P. Vegan: Community Ecology Package; R package version 2.5-7. 2020. Available online: https://xueshu.baidu.com/usercenter/paper/show?paperid=1h4c0en0bb6y0ar0052v0ae03k594560 (accessed on 3 February 2022).
  39. Clarke, K.R.; Warwick, R.M. Change in Marine Communities: An Approach to Statistical Analysis and Interpretation; Plymouth Marine Laboratory: Plymouth, UK, 1994; p. 144. [Google Scholar]
  40. Barbour, M.T.; Gerritsen, J.; Snyder, B.D.; Stribling, J.B. Rapid Bioassessment Protocols for Use in Stream and Wadeable Rivers: Periphyton, Benthic Macroinvertebrates and Fish, 2nd ed.; EPA 841-B-99-002; U.S. Environmental Protection Agency, Office of Water: Washington, DC, USA, 1999. [Google Scholar]
  41. Taft, B.; Koncelik, J.P. Methods for Assessing Habitat in Flowing Waters: Using the Qualitative Habitat Evaluation Index (QHEI); OHIO EPA Technical Bulletin EAS.; State of Ohio Environmental Protection Agency, Division of Surface Water: Washington, DC, USA, 2006. [Google Scholar]
  42. Zheng, B.H.; Zhang, Y.; Li, Y.B. Study of indicators and methods for river habitat assessment of Liao River Basin. Acta Sci. Circumstantiae 2007, 27, 928–936. [Google Scholar]
  43. Zhou, X.; Yang, R.H.; Yang, Z.; Zheng, Z.W.; Shi, F.; Chi, S.Y.; Zhu, A.M.; Shao, K.; Yuan, Y.J.; Wan, C.Y. Habitat health assessment of typical tributaries of the Yangtze River. J. Hydroecology 2021, 42, 11. [Google Scholar]
  44. Kwang, G.A.; Seok, S.P.; Shin, J.Y. An evaluation of a river health using the index of biological integrity along with relations to chemical and habitat conditions. Environ. Int. 2002, 28, 411–420. [Google Scholar]
  45. Wang, Z.S.; Jiang, L.G.; Huang, M.J.; Zhang, C.; Yu, X.B. Biodiversity status and its conservation strategy in the Chishui River basin. Recourse Environ. Yangtze Basin 2007, 16, 175–180. [Google Scholar]
  46. Zhang, X. Setting conservation priority to endemic fishes and their habitats during the hydropower development in the Lower Jinsha River. Master’s Thesis Dissertation, Chinese Academy of Sciences, Beijing, China, 2018. [Google Scholar]
  47. Wang, J.; Huang, Z.L.; Li, H.Y.; Jiang, X.M.; Li, Z.F.; Meng, X.L.; Xie, Z.C. Construction of Macroinvertebrate Integrity-Based Health Assessment Framework for the Chishui River. Environ. Monit. China 2018, 34, 69–79. [Google Scholar]
  48. Chen, K.; Jia, Y.; Xiong, X.; Sun, H.; Chen, Y. Integration of taxonomic distinctness indices into the assessment of headwater streams with a high altitude gradient and low species richness along the upper Han River, China. Ecol. Indic. 2020, 112, 106106. [Google Scholar] [CrossRef]
  49. Li, Z.; Zeng, B. Health assessment of important tributaries of Three Georges Reservoir based on the benthic index of biotic integrity. Sci. Rep. 2020, 10, 18743. [Google Scholar] [CrossRef]
  50. Liu, F.; Yang, G.H.; Liu, D.M.; Li, L.; Wang, X.; Zhang, Z.; Liu, H.Z. Current situation and conservation strategies of fish resources in the Xishui River. Freshw. Fish. 2019, 49, 36–43. [Google Scholar]
Figure 1. Technical procedure for habitat assessment in the Chishui River basin.
Water 14 00515 g001
Figure 2. Locations of data sites along the Chishui River basin.
Water 14 00515 g002
Figure 3. Locations of sampling sections along the Chishui River basin.
Water 14 00515 g003
Figure 4. The NMDS ordination (a) and classification (b) plots of the river habitats in the Chishui River basin.
Water 14 00515 g004
Figure 5. Habitat health status of the 40 sampling sections in the Chishui River basin.
Water 14 00515 g005
Figure 6. Box plot showing the CHQI score of each stream (1: mainstream, 2: Zhaxi River, 3: Daoliu River, 4: Tongche River, 5: Baisha River, 6: Erdao River, 7: Wuma River, 8: Tongzi River, 9: Gulin River, 10: Tongmin River, 11: Datong River, 12: Xishui River).
Water 14 00515 g006
Figure 7. Box plots showing the five classification parameters for each stream (1: mainstream, 2: Zhaxi River, 3: Daoliu River, 4: Tongche River, 5: Baisha River, 6: Erdao River, 7: Wuma River, 8: Tongzi River, 9: Gulin River, 10: Tongmin River, 11: Datong River, 12: Xishui River).
Water 14 00515 g007
Figure 8. Scores of the 20 metrics that were used for the habitat assessment.
Water 14 00515 g008
Table 1. Twenty metrics and the habitat assessment system.
Habitat MetricsEnvironmental Grades
ExcellentGoodFairPoor
1 Water environmental status
Pool formBalanced combination of deep and shallow poolsDeep pools are more than 50%Shallow pools are more than 50%Pools are less than 20% or there is no pools
TransparencyClear, transparency > 1 m orRelatively clear, transparency is 0.5–1 mRelatively turbid, transparency is 0.3–0.5 mVery turbid, transparency < 0.3 m
Water smellNo odorHas a slight peculiar smellHas obvious smellPungent smell
Flow regimeAll 4 flow regimes appear (slow-deep, slow-shallow, fast-deep, fast-shallow), slow is <0.3 m/s, and deep is >0.5 mOnly 3 flow regimes appear (lack of fast-shallow flow regimes have lower scores than others)Only 2 flow regimes appear (lack of fast-shallow or slow-shallow have lower scores)Dominated by 1 flow regime (deep-slow have lower score)
Water colorWater color is transparent, no precipitation after standingWater color is basically transparent, and there are some precipitation after standingThe water is darker and more algaeWater color is black or eutrophication
2 River morphology
Riverbed typeDeep pools and shallow poolsFlat riverbedLadder flow or reservoirDry riverbed
Sedimentation characteristics70% of the sediment suitable for aquatic organisms to settle (root plants, or gravels with a diameter of 20–256 mm)40–70% of the sediment suitable for aquatic organisms to settle (newly fallen trees are not suitable for settlement and have lower score)The stable habitat is 20–40%, and the heterogeneity of bottom is low (such as the bedrock > 4000 mm)The stable habitat is only less than 20%, the availability of substrate is low, and it is often severely disturbed or lacked.
Silt coverageSilt substrate is less than 10%Silt substrate is about 10–40%Silt substrate is about 40–60%Silt substrate is more than 60%
Embeddedness0–25% fine-grained sediments (0.06–2.0 mm in diameter) are embedded around pebbles and boulders, and the sediments show spatial diversity25–50% fine-grained sediment are embedded around pebbles and boulders50–75% fine-grained sediment are embedded around pebbles and bouldersMore than 75% of fine-grained sediments are embedded around pebbles and boulders
SinuositySinuosity is higher than 2.0, and the river course is extremely curvedSinuosity is 1.5–2.0, and the river course is curvedSinuosity is 1.2–1.5, the river course is slightly curvedSinuosity is lower than 1.2, and the river course is straight
River harden and canalizationWithout channelization and hardening, river remains in natural conditionHardened river course is less than 40%Hardened river course is 40–80%Hardened river course is more than 80%
3 Riparian zone
Riparian stabilityRiver bank is stable and the erosion area is less than 10%River bank is relatively stable and the erosion area is 10–30%River bank is unstable and the erosion area is less than 30–60%River bank has collapsed and the erosion area is more than 60%
Riparian plant widthRiparian plant width is higher than 18 mRiparian plant width is 12–18 mRiparian plant width is 6–12 mRiparian plant width is less than 6 m
Riparian plant coverage90% of the coastal zone with 50m of vegetation cover and various species70–90% of the coastal zone with 50m of vegetation cover and single species50–70% of the coastal zone with 50m of vegetation cover and partly exposedLess than 50% of the coastal zone with 50m of vegetation cover and most exposed
Dominant vegetationThere are more than 50% arbor forestThere are more than 50% shrubberyThere are more than 50% grasslandThere are more than 50% farmland
4 Human disturbance
Sewage outletThere is no any sewage outletThere is 1 sewage outlet in the river section, which is slightly pollutedThere are 2 sewage outlets in the river section with obvious pollutionThere are more than 3 sewage outlets in the river section
Solid waste pointKeep neat and no garbageThere are scattered garbage fragmentsThere is 1 solid waste point, but not yet extended into the riverThere are more than 2 solid waste points and have spread to the river
dams and channel engineeringThere is no dam or channel engineering, no shipping activitiesThere is 1 dam or channel engineering, and occasional shipping activitiesThere are 2 dams or channel engineering and shipping activities are more frequentThere are 3 dams or channel engineering and some shipping terminals
Cross-river bridgeThere is no bridge across the riverThere is 1 bridge across the riverThere are 2 bridges across the river, and at least one bridge has occasional trafficThere are 3 bridges across the river, and at least one bridge has frequent traffic with loud noise
Residential area and industryThere are only less than 10% residential or industrial areas in the 50 m of coastal zoneThere are 10–30% residential or industrial areas in the 50 m of coastal zoneThere are 30–50% residential or industrial areas in the 50 m of coastal zoneThere are more than 50% residential or industrial areas in the 50 m of coastal zone
Score10         98       7       65       4       32       1       0
Table 2. Five parameters of habitat classification among the six sub-groups.
Habitat TypesNumber of Data SitesProportionAverage Elevation (m)Average Sinuosity (km/km)Average Slope (km/km)Average River Network Density (km/km2)Average Stream Order
Steep tributaries habitat1512.50%484.601.410.01860.0621
High-altitude headwater habitat4134.17%996.491.280.01190.0731.15
Upstream dense river net habitat1210.00%709.671.240.00810.1002.92
Midstream low-curved habitat2722.50%397.261.240.00310.0883.04
Low-altitude estuary tributaries habitat32.50%227.672.160.00200.1642
Downstream flat habitat2218.33%258.641.600.00210.0894
Table 3. Similarity percentages of SIMPER analysis.
GroupsAverage Similarity (%)GroupsAverage Dissimilarity (%)
Group 197.89Groups 1 and 25.39
Group 297.13Groups 1 and 37.16
Group 398.47Groups 1 and 46.99
Group 496.37Groups 1 and 59.69
Group 598.77Groups 1 and 610.74
Group 697.78Groups 2 and 36.09
Groups 2 and 49.82
Groups 2 and 513.48
Groups 2 and 614.12
Groups 3 and 44.92
Groups 3 and 510.75
Groups 3 and 68.3
Groups 4 and 57.79
Groups 4 and 65.14
Groups 5 and 66.36
Publisher’s Note: MDPI stays neutral with regard to jurisdictional claims in published maps and institutional affiliations.

