Article

The Diversity of Phytoplankton in a Combined Rice-Shrimp Farming System in the Coastal Area of the Vietnamese Mekong Delta

by
Nguyen Dinh Giang Nam
1,*,
Nguyen Thanh Giao
2,
Minh N. Nguyen
3,
Nigel K. Downes
4,
Nguyen Vo Chau Ngan
1,
Le Hoang Hai Anh
5 and
Nguyen Hieu Trung
1,5,*
1
Department of Water Resources, Can Tho University, Can Tho City 900000, Vietnam
2
Department of Environmental Management, Can Tho University, Can Tho City 900000, Vietnam
3
Land and Water, Commonwealth Scientific and Industrial Research Organisation (CSIRO), Melbourne, Vic 3168, Australia
4
College of Environment and Natural Resources, Can Tho University, Can Tho City 900000, Vietnam
5
Dragon-Mekong Institute, Can Tho University, Can Tho City 900000, Vietnam
*
Authors to whom correspondence should be addressed.
Water 2022, 14(3), 487; https://doi.org/10.3390/w14030487
Submission received: 30 December 2021 / Revised: 20 January 2022 / Accepted: 1 February 2022 / Published: 7 February 2022
(This article belongs to the Section Biodiversity and Functionality of Aquatic Ecosystems)

Abstract

:
An assessment of varying density, species composition and dynamics of phytoplankton in a combined rice-shrimp culture was carried out in My Xuyen district, Soc Trang province in the Vietnamese Mekong delta. Water was sampled six times at six separate locations within the culture system, on days 1, 20, 34, 57, 68, and day 81 of the rice-shrimp crop cycle. The results showed the abundance of 95 phytoplankton species belonging to five phyla including Cyanophyta, Chlorophyta, Bacillariophyta, Euglenophyta, and Pyrrophyta. The values of Shannon–Wiener index indicated high phytoplankton diversity, while the water quality ranged from medium to good. A Cluster Analysis showed that the phytoplankton density variation can be divided into three distinct periods. The initial phase of crop growth was dominated by Pandorina morum, Pediastrum simplex, Eudorina elegans, Oscillatoria limosa, and Anabaena circinalis. The midstage, reproductive phase of crop growth was dominated by Scenedesnus acuminatus, Pediastrum duplex, Closterinm setaceum, Scenedesnus quadricauda, and Actinastnum hantzschii. Whereas Scenedesnus acuminatus, Scenedesnus quadricauda, Closterinm closterioides, Staurastrum arcuatum, Euglena nhrenbergii, and Phacus lnsmorensis were dominant at the end of crop cycle. The findings provide useful information on phytoplankton assemblages in a typical rice-shrimp culture, which has recently gained popularity as an adaptive livelihood system.

1. Introduction

Aquaculture is the fastest growing food-producing sector in Vietnam. The global demand for aquaculture products continues to grow, as the natural stocks from captured fisheries continue to decline. This is especially true for the Vietnamese Mekong delta (VMD). According to the General Statistics Office of Viet Nam [1], the total aquaculture production was 3513.3 thousand tons, in which a total shrimp production was 628.2 thousand tons in 2015. The aquaculture and shrimp production in Vietnam for the year 2020 was 4633.5 thousand tons and 939.6 thousand tons which was an increase of 31.9% and 49.6% in comparison to the year 2015, respectively [2]. As it is rapidly increasing, aquaculture plays a crucial role in improving the livelihood of people in the coastal provinces of the VMD, such as Ca Mau, Kien Giang, and Soc Trang.
Worldwide, the most popular aquaculture farming systems are extensive shrimp, semi-extensive shrimp, intensive shrimp, semi-intensive, rice-shrimp rotation, rice-fish rotation, and fish-shrimp rotation [3]. Among the rice or shrimp systems, the rice-shrimp rotation is considered as an effective production model for both sustainable uses of land and water resources. This system includes a brackish water shrimp crop in the dry season, and a rice crop in the rainy season. The rice crop is understood to improve the soil and water environment by mineralizing and gradually uptaking organic matter that is left over from the previous shrimp crop. This thereby saves on fertilizer input and investment, reducing pollution and minimizing the risk of shrimp disease.
However, the rice crop is considered to have relatively low economic benefit by the farmers. This has limited the adaptation of the practice. Recently, the raising of giant freshwater prawn (Macrobrachium rosenbergii) in the rice crop (hereafter called ‘combined rice-shrimp system’) has emerged as an innovative way to increase the economic value of the rice crop [4]. The giant freshwater prawn, especially when cultivated within planted rice fields, has become a highly attractive commercially important species adding much greater additional economic value to the rice crop cycle and thus raising the household income of impoverished farmers. Within the latest National Action Plan for the Shrimp Industry, the target for giant freshwater shrimp production was set to over 30,000 tons in the period from 2017–2020, and is planned to increase to a total production of 50,000 tons in 2025 [5]. Actually, the RIA 2 recorded the giant freshwater shrimp production was 24,365 tons in 2019 which lower than the mentioned target of the national action plan [6].
Several previous studies on rice-shrimp models have focused on assessing their economic efficiency, the occurrence of shrimp diseases or water quality [7,8,9]. The environmental benefits of the system, however, have not yet been fully investigated. In particular, the species composition, density, and dynamics of phytoplankton in systems have been overlooked. Phytoplankton is one of the basic biological components of water bodies, providing energy for other higher-order species through the food chain [10]. Phytoplankton is also one of the organisms producing and synthesizing organic substances, creating biological productivity and cleaning the water environment [11]. The main food source of shrimp in the natural environment, phytoplankton is relatively sensitive to changes in the water environment, so the distribution of phytoplankton composition can be used as a proxy to indicate water quality [12,13]. This paper aims to evaluate the diversity, including the composition and abundance of phytoplankton in a combined rice-shrimp system. The findings provide an examination and a better understanding of the environmental benefits of the system, so that it could be accordingly promoted as a sustainable production model to relevant communities.

2. Materials and Methods

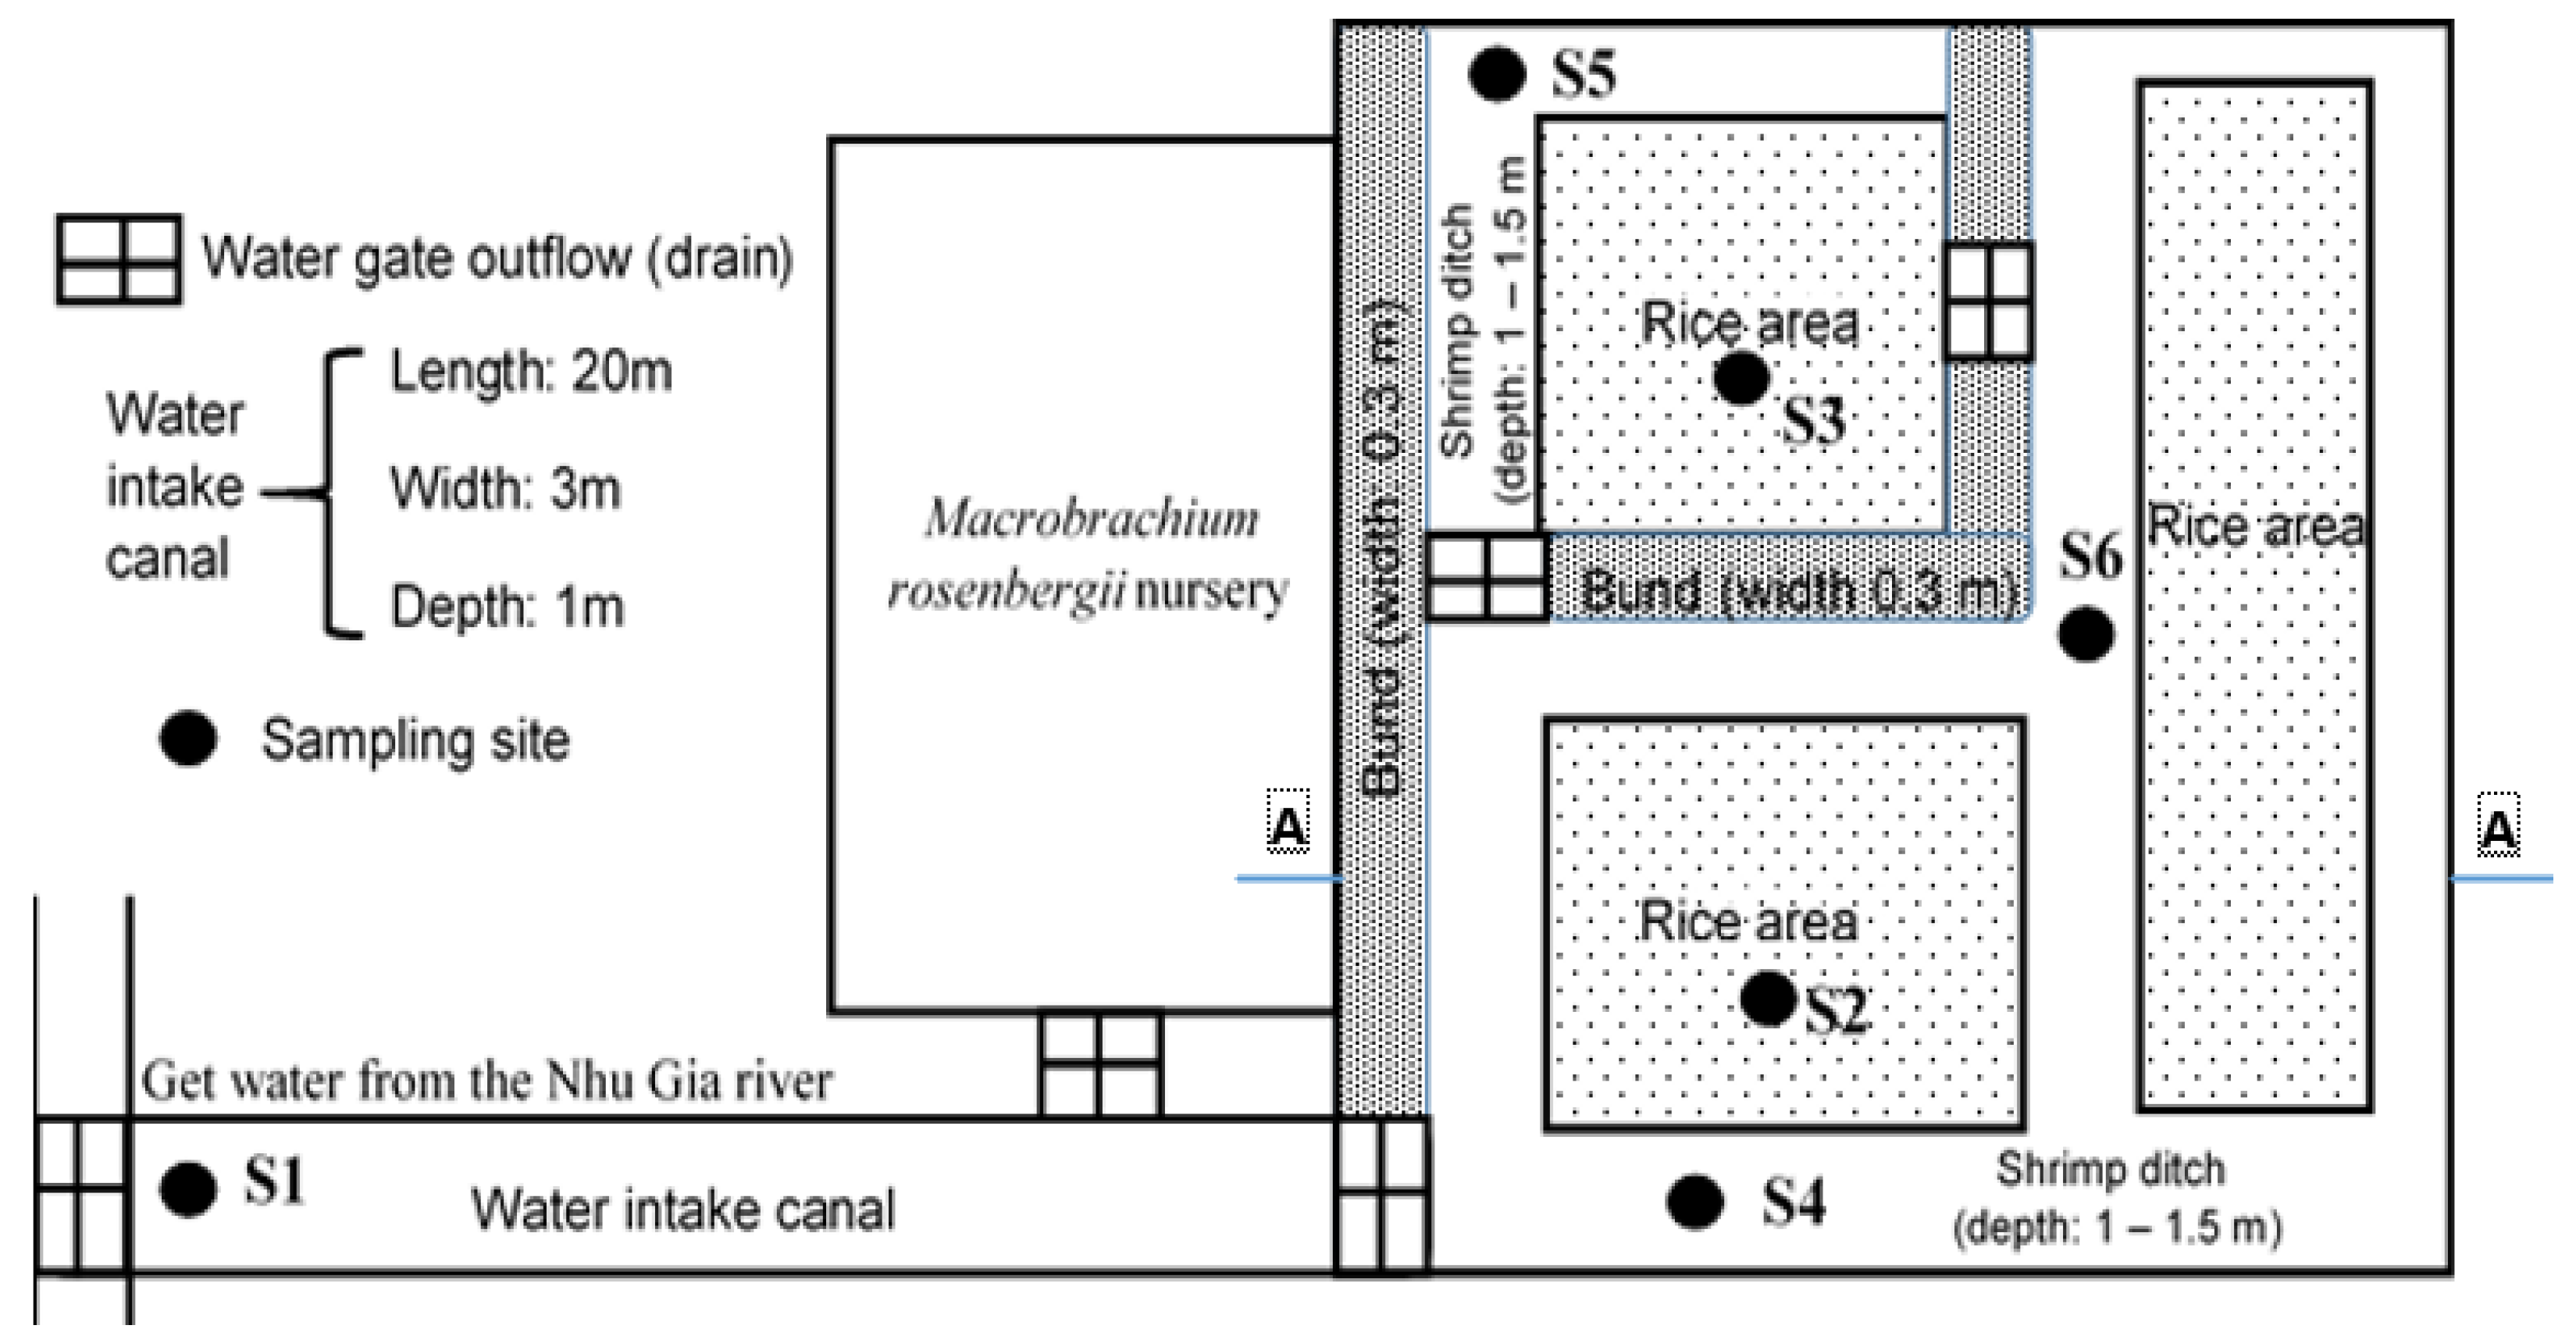
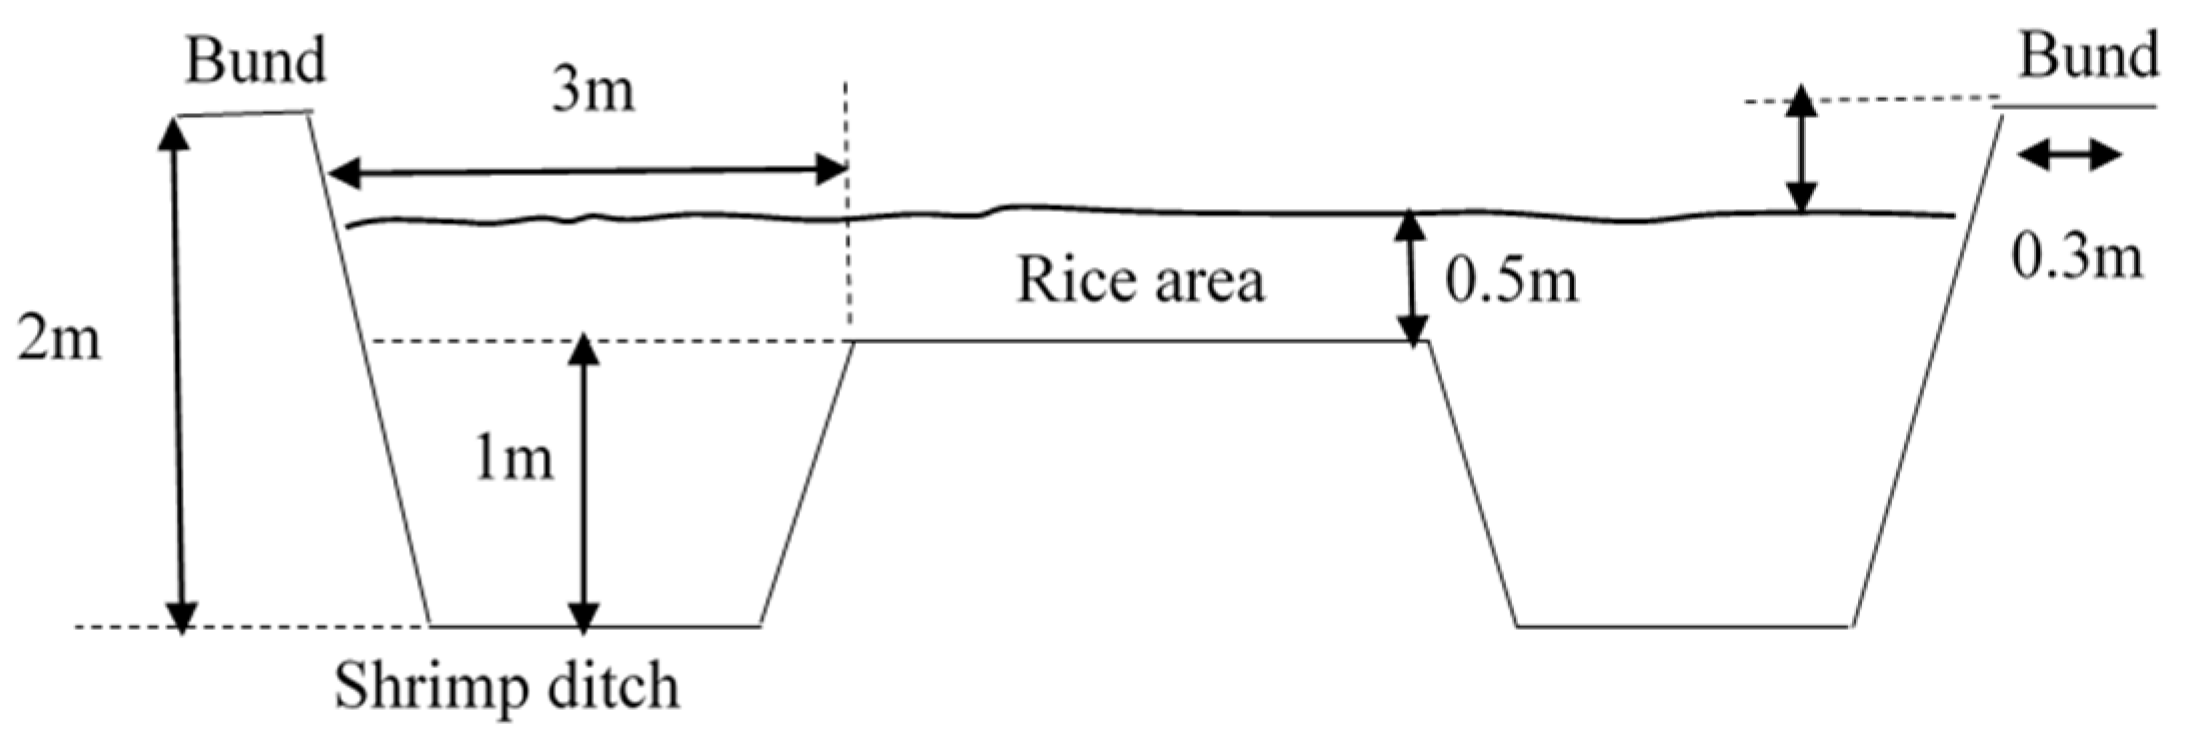
2.1. Description of the Rice-Shrimp System

The study was conducted on a combined rice-shrimp system in Hoa Tu 1 commune, My Xuyen district, Soc Trang province from June 2019 to March 2020. The total area of the studied system was 1 ha, in which 70% was used for rice cultivation and 30% for a shrimp nursery pond. The rice variety cultivated was the locally developed of ST24, while the shrimp species was giant freshwater shrimp (Macrobrachium rosenbergii). The rice was directly wet seeded to the field area at a seed density of 10 kg/1000 m2. Water irrigation was started on the 7th day after seeding, re-irrigated 5–7 cm before fertilizing, always retaining a water level of 30–50 cm during heading and flowering, and openly drained 10 days before harvesting.
The shrimp were stocked in the nursery pond for three months, then released into the rice field at the day 45 after seeding with a density of one shrimp per square meter. Thereafter, the water level in the shrimp ditches was maintained at 1.0–1.5 m. During the crop cycle, organic fertilizer was applied to the rice field three times on day 10, day 25, and day 40 after seeding. Organic fertilizers were applied including Ure (CO(NH2)2) and DAP (Diamoni Phosphate—(NH4)2HPO4). Additional feed was not applied for the shrimp once they were released into the rice field.

2.2. Phytoplankton Sampling and Analysis

Phytoplankton were sampled at six intervals in total. The first sampling was made one day after releasing shrimp into the rice field (1st sampling, taking water from intake canal), and was repeated on day 20 (2nd sampling—after fertilizer application), day 34 (3rd sampling), day 57 (4th sampling), day 68 (5th sampling, following rice harvest, and day 81 (the 6th sampling, before shrimp harvest).
The six sampling locations are indicated in Figure 1 and Figure 2 and are the cross-section of the sampling field. Sampling locations included the water intake canal (S1), and two locations in the in the rice areas (S2 and S3) and three locations in the shrimp ditches surrounding the rice areas (S4, S5, and S6). It is noted that water samples at only four locations (S1, S4, S5, and S6) were collected at the 5th and 6th sampling intervals as the rice had then been harvested.
All the phytoplankton samples were subject to the composition and density of species analysis. For the analysis of species composition, the samples were collected by towing, zigzag moving horizontally at a depth of 0.3–0.5 m for about 1–2 min using a net with a mesh size of 25 µm [14]. The concentrated water samples were transferred to 110 mL vials after each sampling location, labeled, and fixed with formalin 2–4% [14]. The analysis of species composition was performed using a microscope at the magnitude of 10X–40X to identify the species of phytoplankton, using the techniques presented in the handbooks [15,16,17,18], which all describe the identification of phytoplankton in detail to the species level.
For the analysis of phytoplankton density, the samples of phytoplankton were collected by filtering 100 L of water through a net with a mesh size of 25 µm and stored in the same manner as for the analysis of phytoplankton composition. The analysis of species density was performed by counting individuals of phytoplankton in a Sedgewick Rafter counting chamber under a microscope for at least 200–500 specimens (individuals), following the method mentioned by [14,19,20]. The phytoplankton density was then calculated by Equation (1) [21]:
Y = X V c d 1000 N A V t t ,
in which Y is phytoplankton density (individuals L−1); X is the number of individual phytoplankton in the counted cells; Vcd is the concentrated sample volume (mL); N is the number of counted cells; A is the area of counted cells (1 mm2), and Vtt is water volume collected (mL).

2.3. Statistical Analyses and Diversity Indices

The Shannon–Wiener diversity index (H′) was used to assess the diversity of phytoplankton in the rice-shrimp system [22]. The value of H′ index would increase when the number of species in the phytoplankton community increases. The H′ index was calculated by the Equation (2) [21]:
H   =     p i · ln ( p i ) ,
where pi = ni/N; ni is the number of individuals in the sample; N is total number of individuals in the samples.
Using H′ index, water quality is classified into five levels: very bad water quality (H′ < 1), bad (1 ≤ H′ < 2), medium (2 ≤ H′ < 3), good (3 ≤ H′ < 4.5) and excellent (H′ ≥ 4.5) [21].
The Cluster Analysis (CA) was used to classify the temporal distribution of phytoplankton [23,24,25]. The sampling times with similar characteristics in terms of species composition (number of individuals of a species) were grouped into a cluster, whereas those with different characteristics of phytoplankton were grouped into another cluster. The similarity of sampling times in the same group was calculated based on the formula (Dlink/Dmax) × 100. The Similarity Percentage Analysis (SIMPER) was used to determine the dominance and contribution of each species to the diversity of phytoplankton in the combined rice-shrimp system [23]. The data before analysis were transformed by the similarity matrix. Both CA and SIMPER were performed using PRIMER software V5.2.9 [23] for which the input data were the results of the qualitative analysis conducted in the previous section.

3. Results

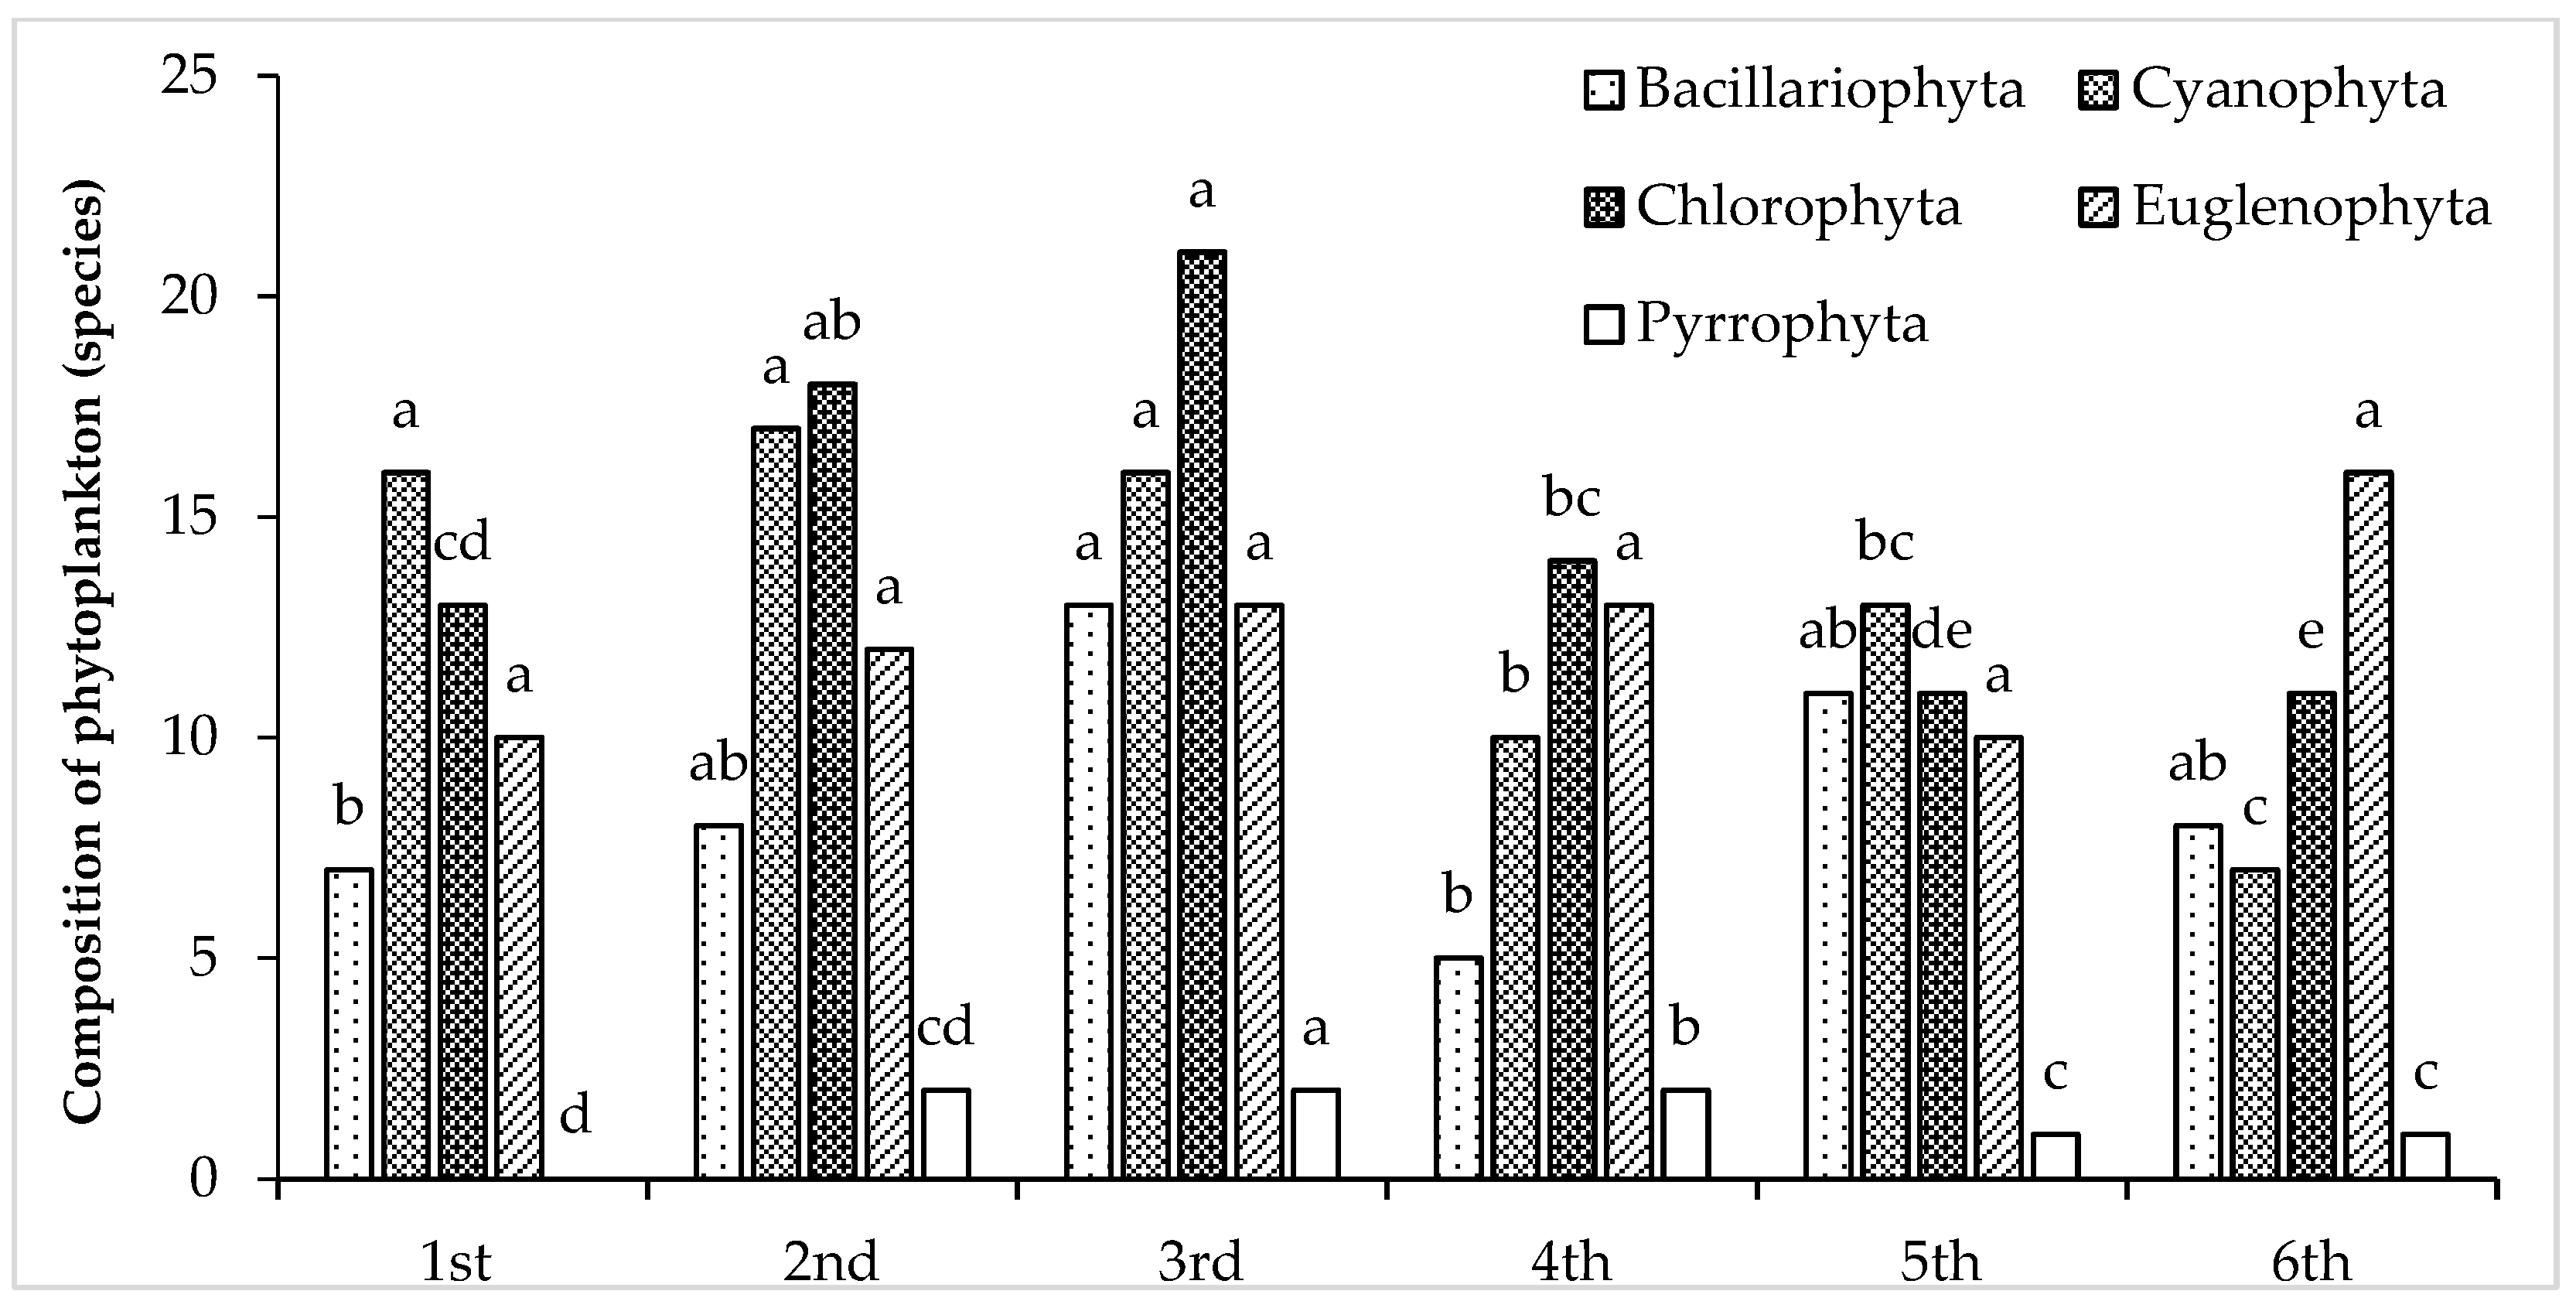
3.1. Composition of Phytoplankton

A total of 95 species of phytoplankton belonging to 5 phyla were identified in the system. Chlorophyta was the most abundant in every analysis with the presence of 29 species, followed by Euglenophyta (23 species), Bacillariophyta (21 species), Cyanophyta (20 species), and Pyrrophyta (2 species).
As shown in Figure 3, there was a significant difference in the total number of species between the sampling dates (p < 0.05), except for Bacillariophyta and Euglenophyta (p ≥ 0.05). The lowest total number of species identified was 43 species at the 6th sampling interval, while the highest number was 65 species recorded in at the 3rd sampling interval. Pyrrophyta was only seen at the majority of locations from the 2nd sampling interval onwards (day 20). This may be an indication of decreasing water quality as this phylum is often indicative of organic water pollution [26].
Table 1 presents the spatial and temporal distribution of the observed phytoplankton phyla in terms of the number of identified species. At the first sampling interval, the number of species of both Cyanophyta and Chlorophyta in the rice area (S2 and S3) tended to be higher than the numbers found within the water sampled from the shrimp ditches (S4 and S5). In contrast, by the time of the 3rd and 4th sampling intervals, the assemblage of both Chlorophyta and Cyanophyta were found in the rice area (S2 and S3), yet still tended to be less than that of shrimp ditches (S4 and S5). This spatial difference could be explained by the growing canopy of the rice plants, resulting in less light penetration, and thus a less favorable condition for phytoplankton growth (especially Chlorophyta), in comparison to the open shrimp ditches [27].

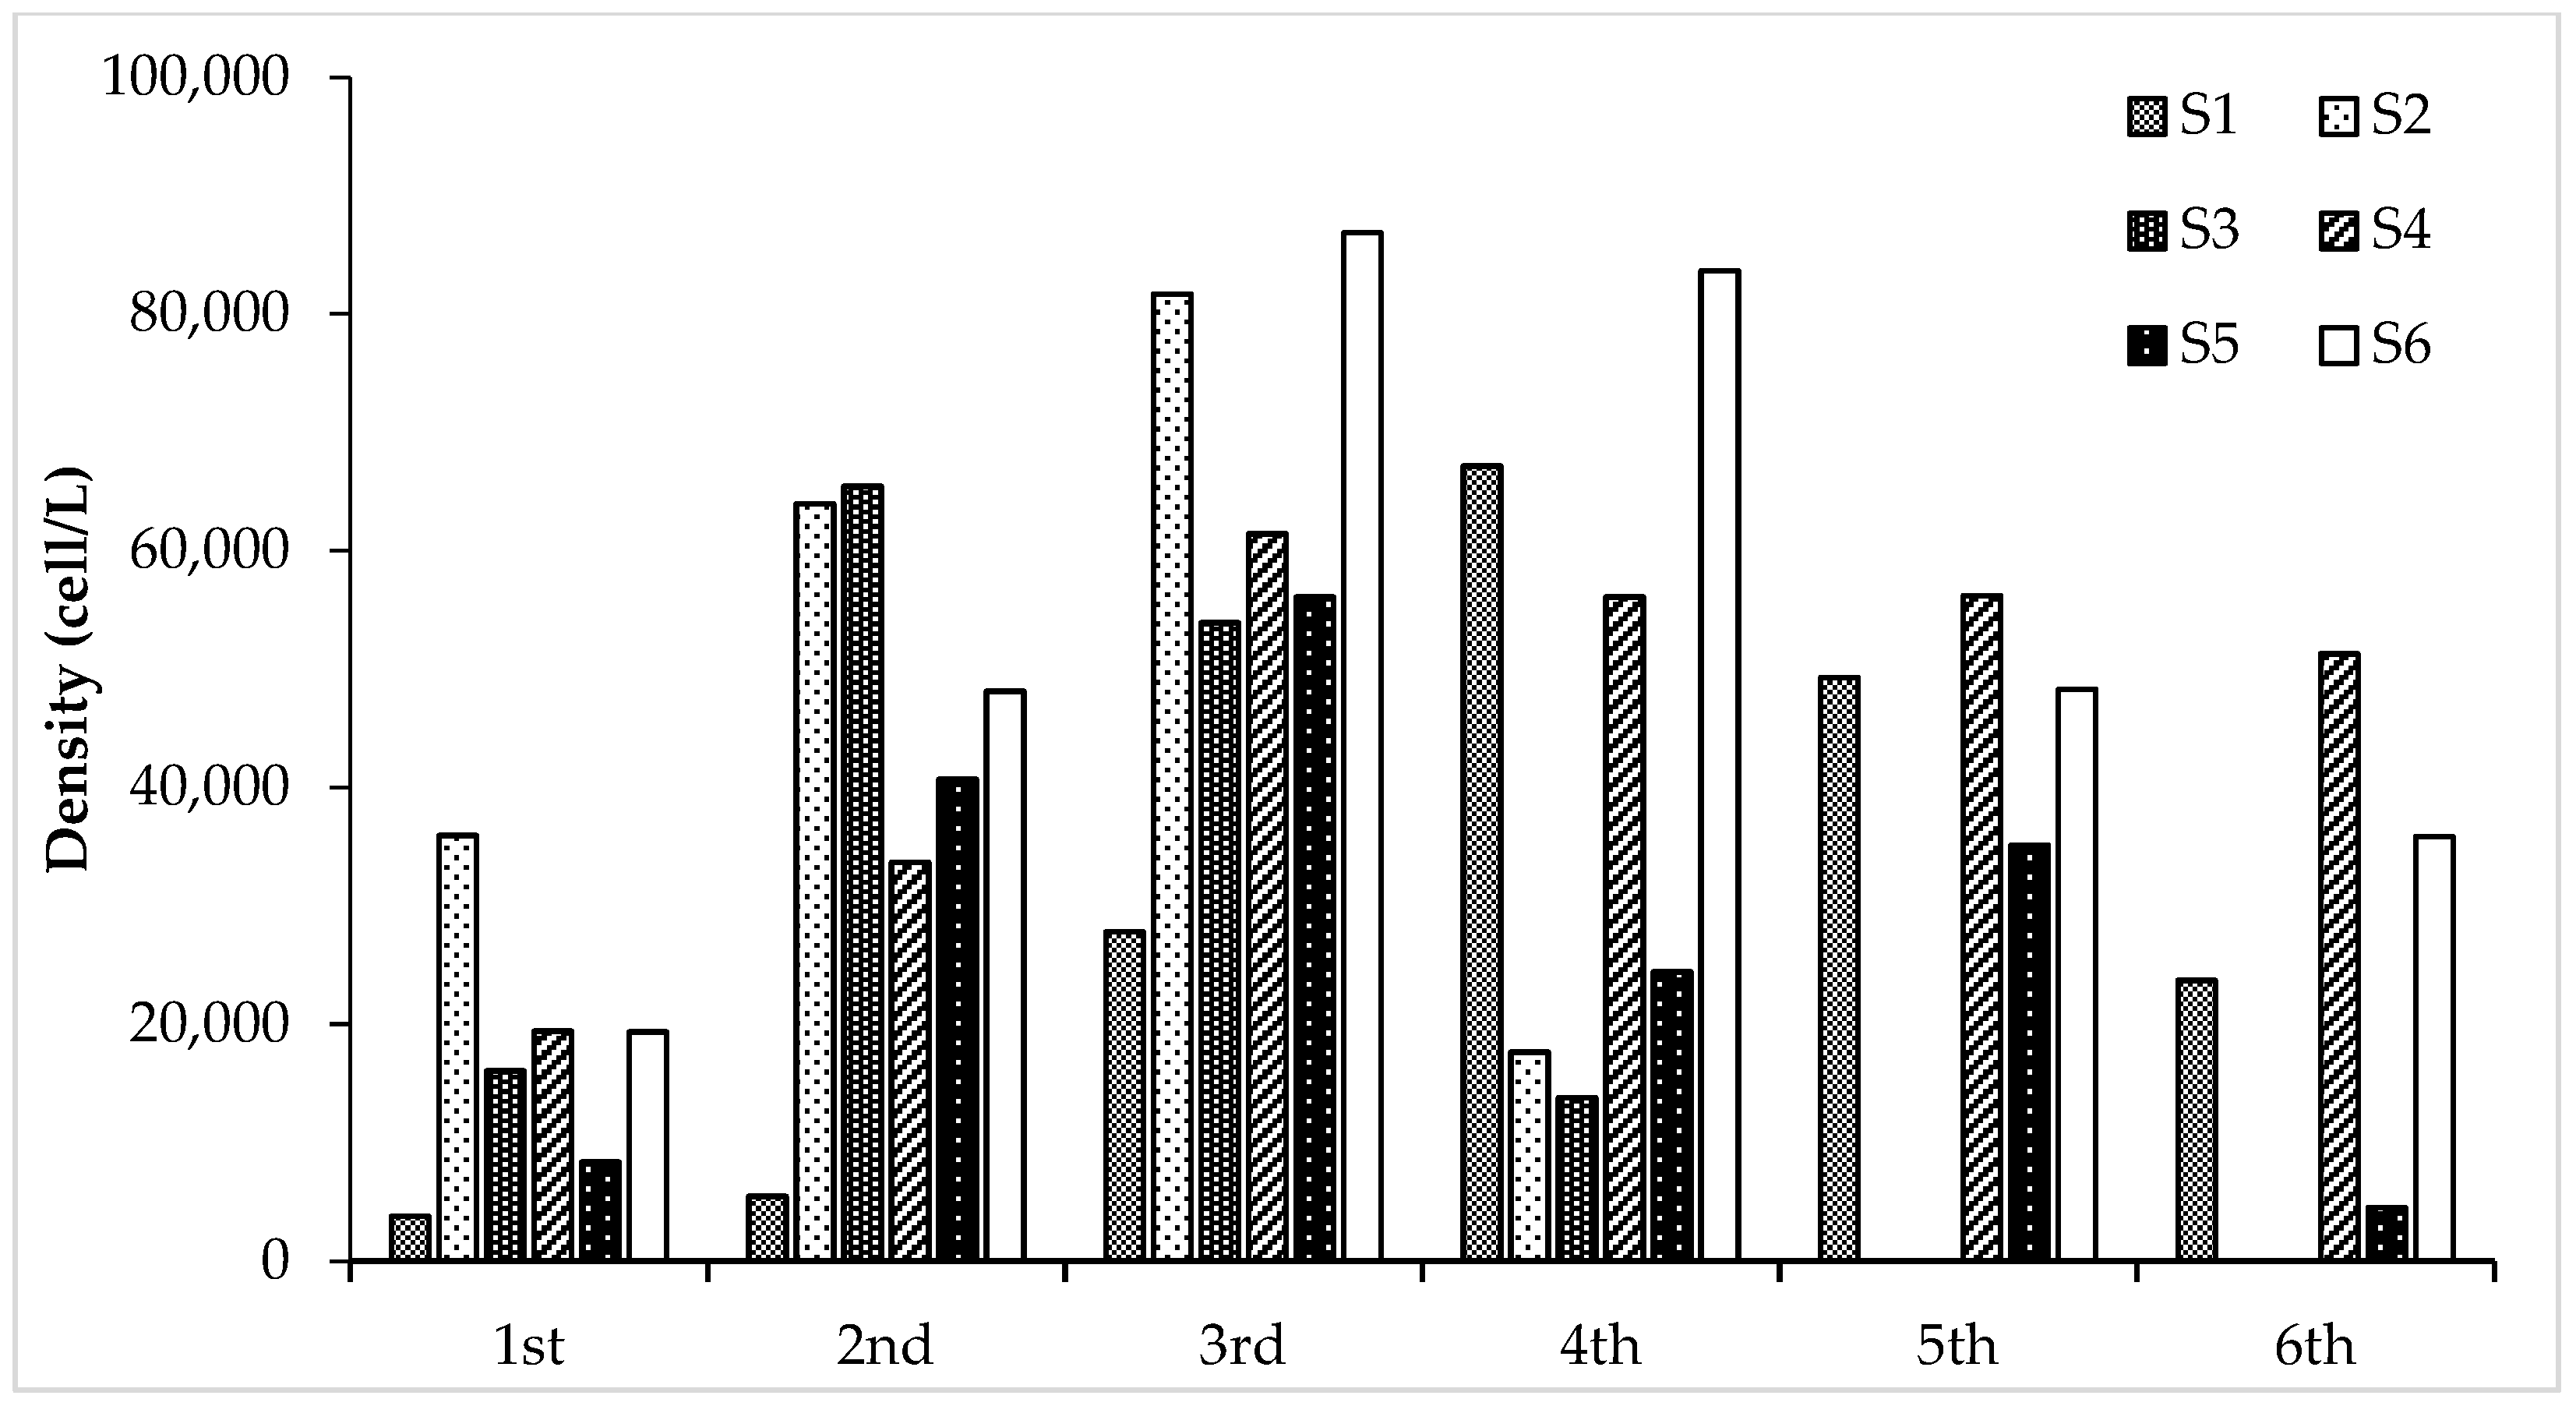
3.2. Density of Phytoplankton

Figure 4 indicates that the density of the majority of phytoplankton at all sampling locations increased from the first sampling interval to the third, but thereafter showed a decreasing trend. Specifically, phytoplankton densities in the first sampling interval to the third were recorded from 3777–86,832 cells per liter and 0–83,628 cells per liter at the 4th to 6th sampling interval. This may have been due to the growth of the shrimp, which have been negatively correlated with the density of phytoplankton [14].
In comparison to the rice field sampling locations, phytoplankton density in the water intake canal (3777–67,155 cells per liter) was typically observed to be lower over the duration of the study. The densities of the phytoplankton measured at sampling sites S2 (63,949–81,664 cells L−1) and S3 (53,924–65,452 cells L−1) were significantly higher than those at sites S4 (33,671–61,429 cells L−1), S5 (40,685–56,092 cells L−1) and S6 (48,127–86,832 cells L−1) at the 2nd and 3rd sampling interval. Conversely, the density of phytoplankton at sites S4, S5, and S6 tended to be higher than those at sites S2 and S3 by the 4th sampling interval onwards. This may be explained by the fact that the rice plants by the 4th sampling interval were relatively well established, adversely affecting the light regime. According to previous study [28], naturally more light, combined with a higher nutrient regime facilitates the growth of algae; this may have resulted in lower relative density of algae at sites S2 and S3.

3.3. Shannon–Wiener Diversity Index (H′)

The diversity of phytoplankton in the rice-shrimp system over the study period is presented in Table 2. In the first sampling, interval at the H′ index was recorded as medium (H′ ≥ 2). The results of ANOVA analysis showed that no significant differences were observed between the water intake canal (S1), shrimp ditches (S4 and S5), and rice area (S2 and S3) (p ≥ 0.05). The similar results between water bodies were probably due to the fact that the shrimp had not yet been released into the system, and as such, the nutrient content may not have been significantly altered. The nutrient content is expected to alternate when shrimp are stocked into the system by waste products and water disturbances [29], affecting the growth of phytoplankton.
The H′ index values at the 2nd sampling interval were higher than those of the first sampling and were classified as medium (S2, S3, and S6) and good (S1, S4, and S5). The use of Urea and DAP fertilizers before this sampling interval appears to have promoted the growth of algae. At the 3rd sampling interval, H′ values ranged from 2.6–3.2, and the water quality was classified from medium to good. Values were relatively similar to the previous sampling interval at all locations, albeit decreasing water quality from the water intake canal to the shrimp ditches, and then to the rice area, was seen in general.
However, by the 4th sampling interval, the gradual reduction of nutrients and water exchange led to an observed reduction in the composition of phytoplankton. As a result, H′ values at the 4th sampling interval are the lowest, ranging from 1.9 to 2.4, and the water quality is classified as bad to medium. For the 5th sampling interval, the highest diversity of phytoplankton is recorded, ranging from 2.9 to 3.3, and the water is recognized as good quality. The growth of phytoplankton, at this time, is considered to be largely due to the accumulation of waste in the shrimp ditches (shrimp feces, dead algae), which was observed during the sampling process. Furthermore, at this time, there was also a high presence (number of species and number of individuals per species) of the species of Euglenophyta phylum, which can tolerate pollutants, but also negativity affects the growth of other species [14,26,30]. Finally, the H′ values at the 6th sampling interval ranged from 2.0 to 2.8 with the water quality classified as medium.

3.4. Identification of Dominant Phytoplankton Species

The CA was applied to analyze the similarity of the phytoplankton composition over sampling intervals (Figure 5).
Two sampling intervals were grouped if their similarity was more than 50%. The 3rd and 4th sampling intervals belonged to Group 1 (mid rice cultivation). Here both species composition and density were high. Group 2 included the 1st and 2nd sampling intervals (initial rice crop vegetative growth phrase), which showed average phytoplankton density and a relatively high species composition. The 5th and 6th sampling intervals were of Group 3 (taken post rice harvest), which showed lowest composition and density of phytoplankton.
Following the cluster analysis, a Similarity Percentage Analysis (SIMPER) was performed to determine the dominant species within each Group. SIMPER results show that the dominant species were dependent on the sampling intervals. The selection of dominant species in the study periods is based on the % contribution of each species; specifically, the species with a contribution greater than or equal to 5% could be selected. It was found that 14 out of 95 species were dominant and appeared regularly throughout the rice-shrimp system over the entire study duration. Among the dominant phytoplankton species were 2 species of Euglenophyta, 10 species of Chlorophyta, and 2 species of Cyanophyta (Table 3).

4. Discussion

4.1. Composition of Phytoplankton

In comparison with the reported results from other rice-shrimp systems in the literature, it noted that species composition varies widely. For examples, previous study reported only 34 species belonging to 4 phyla (Cyanophyta, Chlorophyta, Chrysophyta, and Euglenophyta) in a rice-shrimp system in An Giang province [31], while another study reported that phytoplankton ranged from 196 up to 308 species in a rice-shrimp field in Hau Giang province [32]. Besides that, the composition of phytoplankton tended to be more diverse for natural water bodies (river, canal, lakes) and was dominated by Cyanophyta and Bacillariophyta [33,34,35]. Meanwhile, Chlorophyta and Bacillariohyta were found to be dominant in the combined rice-shrimp systems. The differences in species composition between these studies can be explained by phytoplankton dependence on many different factors including light, temperature, pH, salinity, and nutrient availability in ponds.
Both Anabeana and Oscillatoria genera belonging to Cyanophyta phylum were found in abundance in the rice cultivation areas. This is consistent with previous research which has suggested that these genera are common to paddy field rice areas [36]. They belong to the group of filamentous Cyanophyta algae, which is not nutritionally beneficial, and in some cases, when cultivated with rice, may actually be harmful to shrimp. Additionally, fibrous Cyanophyta species such as Anabaena circinalis, Oscillatoria limosa, Oscillatoria formosa, Nostoc linckia, and Microcystis aeruginosa were frequently found. Number of individuals observed at the first and last sampling intervals for this species grew from 62–382 for Anabaena circinalis, 162–522 for Oscillatoria limosa, 53–429 for Oscillatoria formosa, 17–234 for Nostoc linckia, and 9–111 for Microcystis aeruginosa. This is a significant increase as shrimp productivity can be adversely affected by the occurrence of these species, which have been noted to reduce water quality by secreting slime that affects shrimp respiration and produces algae blooms [32,37,38]. In particular, Microcystis aeruginosa is known to produce toxins such as Microcystin, which adversely affects the nervous, respiratory, and digestive systems, causing death of many aquatic and wild animals.
Moreover, 23 species of Euglenophyta were identified, of which the genera of Euglena and Phacus accounted for about 87% (20 species). The abundant occurrence of these genera in the rice-shrimp system strongly indicates organic water pollution [26]. However, the beneficial presence of Spirulina platenis (24 individuals at the 1st sampling, 6 individuals at the 2nd, 6 individuals at the 3rd, 3 individuals at the 5th, and 3 individuals at the 6th sampling) was also identified. These are known to be good for shrimp health as they contain high levels of protein, vitamins, and are rich in carotenoids, which is often used in food, medicine, and cosmetics [39].

4.2. Density of Phytoplankton

The phytoplankton densities throughout the study fluctuated highly, ranging from 102,877 to 367,751 cells L−1. While the most appropriate algae density for ponds in tropic climates range from 500,000 to 2,000,000 cells per liter [40]. As such, the observed phytoplankton density in this study was lower than the optimum. This may have adversely affected shrimp growth due to natural food availability. Moreover, similar to previous studies [41,42], this study found that Chlorophyta and Euglenophyta were the two phyla seen at highest densities, which is indicative of an organically polluted water environment.

4.3. Shannon–Wiener Diversity Index (H′)

In comparison, Luu et al. studied the composition of phytoplankton in a shrimp-mangrove farming system in Ca Mau province [43]. Similar to the combined rice-shrimp system in this study, phytoplankton was utilized as an important natural food source. The H′ values in the shrimp-mangrove system in their study were found to vary from 2.6 to 4.2, higher than the H′ index results of this study. This difference can be explained by the characteristics of the shrimp-mangrove culture system which allowed water exchange two times per month. This resulted in a richer phytoplankton composition. The difference can be further explained by the differences in the density of shrimp cultured [42], the area of the culture systems [32] and varying light and nutrients regimes [44]. Moreover, previous research found that 17 species of algae can be direct food (the frequency of encountering these species is very low) or indirect food for shrimps [45]. As such, the presence of algae-eating animals can also greatly affect phytoplankton composition. All of these factors interplay to affect the overall composition of species and the number of individuals in each species observed in this study.

4.4. Identification of Dominant Phytoplankton Species

The beginning of the rice crop can be considered as the time when both the rice and the shrimps were still juvenile. At this time, five dominant algae species were observed: Pandorina morum (16.33%), Pediastrum simplex (15.74%), Eudorina elegans (7.53%) (Chlorophyta), Anabaena circinalis, and Oscillatoria limosa (Cyanophyta). Actinastnum hantzschii was measured to a lesser extent (5.64%), yet was the only dominant species that was also present in the mid rice crop period. This is the phase when both the rice and the shrimps mature and develop strongly. At this time, 5 dominant species (all belonging to Chlorophyta), in which Scenedesnus quadricauda and Scenedesnus acuminatus had the highest dominance, accounting for 20.7% and 18.9%, respectively, followed by Pediastrum duplex (17.1%), Closterinm setaceum (12.9%), and Actinastnum hantzschii (10.7%).
Following harvest of the rice, only shrimps remained in the field. The dominant species in this period are similar to that of the previous grouping, with Scenedesnus quadricauda and Scenedesnus acuminatus, belonging to Chlorophyta, and indicative of moderate pollution [46]. Two more species of Euglenophyta were found, namely Euglena ehrenbergii (5%) and Phacus lnsmorensis (7.92%). The appearance of these species is also indicative of decreased water quality.

5. Conclusions

A diverse phytoplankton assemblage was recorded in the studied rice-shrimp system. While Chlorophyta was the most dominant species observed in the system, assemblages showed high temporal variations, and tended to decrease gradually towards the end of the cultivation cycle, indicative of decreasing water quality. The findings provide insights into how phytoplankton develop in a typical rice-shrimp culture system of the VMD. Further studies should focus on using phytoplankton to assess water quality in the shrimp ditches to establish the correlation between phytoplankton and water quality. This in turn can provide further background information for the use of phytoplankton as a proxy for future water quality assessments.

Author Contributions

The experiments were conceived and designed by: N.D.G.N., N.H.T., and M.N.N. The experiments implemented by: L.H.H.A. and N.V.C.N. The experiments were supervised by: N.D.G.N., N.H.T. and M.N.N. The data were analyzed by: N.T.G., L.H.H.A. and N.K.D. The paper was written by: N.T.G., N.D.G.N., N.K.D., N.H.T. and N.V.C.N. All authors have read and agreed to the published version of the manuscript.

Funding

This research was mainly supported by the Commonwealth Scientific and Industrial Research Organisation (CSIRO) Australia, the Research Institute for Climate Change–Can Tho University, Vietnam; and also partly fund supported by E2 and E12–ODA by the Can Tho University Improvement project No. VN14–P6, Can Tho University, Vietnam.

Institutional Review Board Statement

The authors hereby ensures that the work described in the submitted paper has been carried out in accordance with both national and internal university ethical regulations and farming practices which govern the use of animals in experiments in Vietnam.

Informed Consent Statement

Not applicable.

Data Availability Statement

Not applicable.

Acknowledgments

We thank the student group from Water Resources Engineering Bachelor class at Can Tho University for assisting with the experiment activities, and the administration team from the Can Tho University Improvement Project for their administrative support to perform this study.

Conflicts of Interest

The authors declare no conflict of interest. The funders had no role in the design of the study; in the collection, analyses, or interpretation of data; in the writing of the manuscript, or in the decision to publish the results.

References

  1. General Statistics Office of Viet Nam. 2016. Available online: https://www.gso.gov.vn/wp-content/uploads/2019/10/Nien-giam-Thong-ke-2015-1.pdf (accessed on 27 December 2021).
  2. General Statistics Office of Viet Nam. 2021. Available online: https://www.gso.gov.vn/wp-content/uploads/2021/07/Sach-NGTK-2020Ban-quyen.pdf (accessed on 27 December 2021).
  3. New, M. Farming Freshwater Prawns: A Manual for the Culture of the Giant River Prawn (Macrobrachium rosenbergii); FAO Fisheries Technical Paper; FAO: Rome, Italy, 2002; Volume 428, 212p. [Google Scholar]
  4. Tan, L.V.; Thu, T.A.; Long, L.P.; Anh, V.T.V.; Guong, V.T. Some water characteristics of cultivation models on saline soils in Thanh Phu District, Ben Tre Province. J. Agric. Rural. Dev. 2016, 19, 70–78. (In Vietnamese) [Google Scholar]
  5. DoA. National Action Plan for Shrimp Industry Development in Vietnam until 2025; Vietnam Department of Aquaculture: Ha Noi, Vietnam, 2018. (In Vietnamese) [Google Scholar]
  6. RIA2-Research Institute for Aquaculture No. 2. Proposal on Giant Freshwater Shrimp Production and Export Development; Ministry of Agriculture and Rural Development: Ho Chi Minh City, Vietnam, 2019. (In Vietnamese) [Google Scholar]
  7. Hoa, N.M. Characteristics of soil and water in shrimp-rice and shrimp-upland crops systems in saline-affected Acid Sulphate Soils at Hau Giang province in Vietnam. Part I: Characteristics of pond water. Can Tho Univ. J. Sci. 2010, 16, 80–87. (In Vietnamese) [Google Scholar]
  8. Ha, V.V.; Phuong, T.L.; Linh, H.C.; Tuan, T.H. Assessment of technical and economic efficiency of land-based shrimp production in My Xuyen district, Soc Trang province. Can Tho Univ. J. Sci. 2014, 46, 70–79. (In Vietnamese) [Google Scholar]
  9. Huy, N.A.; Hiep, N.H. Efficacy of halophillic bacteria, Burkholderia sp. PL9 and Acinetobacter sp. GH1-1, on the growth and yield of rice cultivar LP5 grown on salt affected soil of rice shrimp farming system in My Xuyen district, Soc Trang province. Can Tho Univ. J. Sci. 2019, 55, 24–30. (In Vietnamese) [Google Scholar]
  10. Li, X.; Yu, H.; Wang, H.; Ma, C. Phytoplankton community structure in relation to environmental factors and ecological assessment of water quality in the upper reaches of the Genhe River in the Greater Hinggan Mountains. Environ. Sci. Pollut. Res. 2019, 26, 17512–17519. [Google Scholar] [CrossRef]
  11. Tuyen, N.V. Biodiversity in Algae in Vietnam’s Inland Waters-Prospects and Challenges; Agriculture Publishing House: Ha Noi, Vietnam, 2003. (In Vietnamese) [Google Scholar]
  12. Spence, D.H.N. Factors controlling the distribution of freshwater macrophytes with particular reference to the lochs of Scotland. J. Ecol. 1967, 55, 147–170. [Google Scholar] [CrossRef]
  13. Seddon, B. Aquatic macrophytes as limnological indicators. Freshw. Biol. 1972, 2, 107–130. [Google Scholar] [CrossRef]
  14. Leigh, C.; Koster, B.S.; Sang, N.V.; Truc, L.V.; Hiep, L.H.; Xoan, V.B.; Tinh, N.T.N.; An, L.T.; Sammut, J.; Burford, M.A. Rice-shrimp ecosystems in the Mekong Delta: Linking water quality, shrimp and their natural food sources. Sci. Total Environ. 2020, 739, 139931. [Google Scholar] [CrossRef] [PubMed]
  15. Tien, D.D.; Hanh, V. Freshwater Algae in Vietnam-Classification of Green Algae; Agricultural Publishing House: Ha Noi, Vietnam, 1997; 503p. (In Vietnamese) [Google Scholar]
  16. Ho, P.H. Algae; Sai Gon Publishing House: Sai Gon City, Vietnam, 1972. (In Vietnamese) [Google Scholar]
  17. Reynolds, C.S. Ecology of Phytoplankton; Cambridge University Press: Cambridge, UK, 2006. [Google Scholar]
  18. Suthers, I.M.; Rissik, D. Plankton: A Guide to Their Ecology and Monitoring for Water Quality; Commonwealth Scientific and Industrial Research Organisation (CSIRO), CSIRO Publishing: Melbourne, Australia, 2009; 272p. [Google Scholar]
  19. Soininen, J.; Korhonen, J.J.; Karhu, J.; Vetterli, A. Disentangling the spatial patterns in community composition of prokaryotic andeukaryotic lake plankton. Limnol. Oceanogr. 2011, 56, 508–520. [Google Scholar] [CrossRef]
  20. Lv, H.; Yang, J.; Liu, L.; Yu, X.; Yu, Z.; Chiang, P. Temperature and nutrients are significant drivers of seasonal shift in phytoplankton community from a drinking water reservoir, subtropical China. Environ. Sci. Pollut. Res. 2014, 21, 5917–5928. [Google Scholar] [CrossRef]
  21. Nguyen, T.G.; Truong, H.D. Interrelation of phytoplankton and water quality at Bung Binh Thien reservoir, An Giang province, Vietnam. Indones. J. Environ. Manag. Sustain. 2020, 4, 110–115. [Google Scholar]
  22. Shannon-Wiener. The Mathematical Theory of Communication; University of Illinois Press: Urbana, IL, USA, 1949. [Google Scholar]
  23. Clarke, K.R.; Warwick, R.M. Changes in Marine Communities: An Approach to Statistical Analyses and Interpretation; Natural Environment Research Council: Plymouth, UK, 1994. [Google Scholar]
  24. Feher, I.C.; Zaharie, M.; Oprean, I. Spatial and seasonal variation of organic pollutants in surface water using multivariate statistical techniques. Water Sci. Technol. 2016, 74, 1726–1735. [Google Scholar] [CrossRef] [PubMed]
  25. Giao, N.T. Evaluating the current water quality monitoring system on Hau River, Mekong delta, Vietnam using multivariate statistical technique. Appl. Environ. Res. 2020, 42, 14–25. [Google Scholar]
  26. Bellinger, E.G.; Sigee, D.C. Freshwater Algae: Identification and Use as Bioindicators; John Wiley & Sons, Ltd.: Hoboken, NJ, USA, 2010; 265p. [Google Scholar]
  27. Ziglio, G.; Siligardi, M.; Flaim, G. Biological Monitoring of Rivers: Applications and Perspectives; John Wiley & Sons Ltd.: Hoboken, NJ, USA, 2016; 472p. [Google Scholar]
  28. Cat, L.V.; Nhung, D.T.H.; Cat, N.N. Aquaculture Water, Water Quality and Solutions to Improve Water Quality; Scientific and Technical Publishing House: Ha Noi, Vietnam, 2006. (In Vietnamese) [Google Scholar]
  29. Dien, L.D.; Sang, N.V.; Faggotter, S.J.; Chen, C.; Huang, J.; Teasdale, P.R.; Sammut, J.; Burford, M.A. Seasonal nutrient cycling in integrated rice-shrimp ponds. Mar. Pollut. Bull. 2019, 149, 110647. [Google Scholar] [CrossRef]
  30. Koekemoer, L.; Vuuren, S.J.; Levanets, A. The influence of land use-impacted tributaries on water quality and phytoplankton in the Mooi River, North West Province, South Africa. Bothalia 2021, 51, 1–22. [Google Scholar] [CrossRef]
  31. Quynh, D.T.T. Survey on the water bio-chemical parameters of shrimp-rice system environment in Phu Thuan commune, Thoai Son district and an Giang province. Sci. Rep. 2009, 36, 34–38. [Google Scholar]
  32. Nga, B.T. Assess the Situation and Build Models to Improve Household Livelihoods in Areas Affected by Saline Intrusion and Climate Change in Hau Giang Province; Scientific Report; Department of Science and Technology of Hau Giang Province: Hau Giang City, Vietnam, 2019; 131p. (In Vietnamese) [Google Scholar]
  33. Le, T.H.; Nguyen, T.L.; Bui, T.H. The relationships between environmental factors and phytoplankton diversity indices in some estuarine ecosystems of Vietnam. VNU J. Sci. Nat. Sci. Technol. 2016, 32, 33–38. [Google Scholar]
  34. Giao, N.T. Evaluating the possible use of phytoplankton and zoobenthos for water quality assessment: A case study at Bung Binh Thien reservoir, An Giang province, Viet Nam. Sci. J. Tra Vinh Univ. 2019, 36, 39–50. [Google Scholar]
  35. Le, T.T.; Phan, D.D.; Huynh, B.D.K.; Le, V.T.; Nguyen, V.T. Phytoplankton diversity and its relation to the physicochemical parameters in main water bodies of Vinh Long province, Vietnam. J. Vietnam. Environ. 2019, 11, 83–90. [Google Scholar] [CrossRef]
  36. Reynolds, C.S. Phytoplankton periodicity: The interactions of form, function and environmental variability. Freshw. Biol. 1984, 14, 111–142. [Google Scholar] [CrossRef]
  37. Hao, N.V. Some Technical Issues of Industrial Tiger Shrimp Farming; Agricultural Publishing: House Ho Chi Minh City, Vietnam, 2002; 210p. (In Vietnamese) [Google Scholar]
  38. Mai, H.T.B. Fluctuations in Species Composition and Number of Floating Plants in Tiger Shrimp Ponds in Khanh Hoa, Aquaculture. Ph.D. Thesis, Nha Trang University, Nha Trang City, Vietnam, 2015. (In Vietnamese). [Google Scholar]
  39. Ut, V.N.; Oanh, D.H. Curriculum on Aquatic Plants and Animals; Can Tho University Publishing House: Can Tho City, Vietnam, 2013; 324p. (In Vietnamese) [Google Scholar]
  40. Thang, N.V. Giant Freshwater Shrimp Farming Techniques; Agricultural Publishing House: Ho Chi Minh City, Vietnam, 1995. (In Vietnamese) [Google Scholar]
  41. Hai, T.N.; Hien, T.T.T.; Tam, D.H.; Toa, V.T.; Phuong, N.T.; Marcy, M.N. Culture of freshwater prawns (Macrobrachium rosenbergii) in rice-fields using hatchery reared postlarvae in Tam Binh district, Vinh Long province. In Proceedings of the 2001 Annual Workshop of JIRCAS Mekong Delta Project, Can Tho University, Can Tho City, Vietnam, 27–29 November 2001. (In Vietnamese). [Google Scholar]
  42. Tuan, N.A.; Long, D.N.; Viet, L.Q. Experimental culture of giant freshwater prawn (Macrobrachium Rosenbergii De Man, 1897) at different stocking densities in earthen ponds. Can Tho Univ. J. Sci. 2004, 1, 95–104. (In Vietnamese) [Google Scholar]
  43. Luu, P.T.; Thai, T.T.; Yen, N.T.M.; Quang, N.X. Phytoplankton community in integrated shrimp-mangrove farming ponds in Ca Mau province. In Proceedings of the The 7th National Science Conference on Ecology and Biological Resources, Hangzhou, China, 19–22 October 2015; pp. 793–900. (In Vietnamese). [Google Scholar]
  44. Boyd, C.E.; Tucker, C.S. Water Quality and Pond Soil Analyses for Aquaculture; Alabama Agricultural Experiment Station, Auburn University: Auburn, AL, USA, 1992; 188p. [Google Scholar]
  45. Mai, H.T.B.; Chau, L.H.B.; Khoa, N.D.T. Composition and cell density of microalgae in the “eco-shrimp” ponds at Nam Can and Ngoc Hien distric, Ca Mau province. J. Aquat. Sci. Technol. 2010, 3, 35–40. [Google Scholar]
  46. Wu, J.T. Phytoplankton as bioindicator for water quality in Taipei. Bot. Bull. Acad. Sinica 1984, 25, 205–214. [Google Scholar]
Figure 1. Overview of the water sampling locations.
Water 14 00487 g001
Figure 2. Cross section A–A of the system.
Water 14 00487 g002
Figure 3. Temporal distribution of phytoplankton in the combined rice-shrimp system over sampling intervals. Note: Different letters a, b, c, d indicates significantly different at a significance level of 5%.
Water 14 00487 g003
Figure 4. Phytoplankton density over the sampling intervals.
Water 14 00487 g004
Figure 5. The similarity of the phytoplankton over the sampling intervals (% similarity).
Water 14 00487 g005
Table 1. The spatial and temporal composition of phytoplankton (number of species).
Sampling IntervalSiteBacillariophytaCyanophytaChlorophytaEuglenophytaPyrrophyta
1stS13101160
S22141050
S3510990
S4212940
S5513970
S64131050
2ndS141512130
S24121472
S351513100
S461416100
S52131470
S66151791
3rdS1131721132
S23131592
S310131592
S45131792
S59121672
S66131872
4thS14913122
S2381081
S3251092
S44101191
S53514101
S641012111
5thS111131191
S2n/an/an/an/an/a
S3n/an/an/an/an/a
S48101091
S557871
S68910111
6thS185981
S2n/an/an/an/an/a
S3n/an/an/an/an/a
S4669121
S553431
S67510171
Table 2. The diversity index H′ in the study area over sampling sites and intervals.
Sampling IntervalS1S2S3S4S5S6Water Quality
1st2.92.62.82.72.92.9Medium
2nd3.32.92.73.13.02.7Medium–Good
3rd3.22.72.62.92.82.7Medium–Good
4th2.02.22.41.92.42.0Bad–Medium
5th3.33.22.93.3Good
6th2.62.82.02.8Medium
Table 3. The dominant species of phytoplankton in each group.
Phyla and SpeciesStart of Crop CycleMid-Crop CycleEnd of Crop Cycle
Av. AbContrib%Av. AbContrib%Av. AbContrib%
Euglenophyta
Euglena nhrenbergii3995
Phacus lnsmorensis7017.92
Chlorophyta
Actinastnum hantzschii147.55.64118910.7
Closterinm closterioides5655.99
Closterinm setaceum368512.9
Eudorina elegans339.57.53
Pandorina morum975.516.33
Pediastrnm duplex206017.1
Pediastrum simplex487.515.74
Scenedesnus acuminatus201618.995014.58
Scenedesnus quadricauda247420.71233.520
Staurastrum arcuatum5516.8
Cyanophyta
Anabaena circinalis37814.75
Oscillatoria limosa2458.21
Note: (–) = not significant.
Publisher’s Note: MDPI stays neutral with regard to jurisdictional claims in published maps and institutional affiliations.

