
Hydrological Effects of Agricultural Water Supplies on Paddy Fields using Surface–Groundwater Integrated Model


Abstract
:1. Introduction
2. Materials and Methods
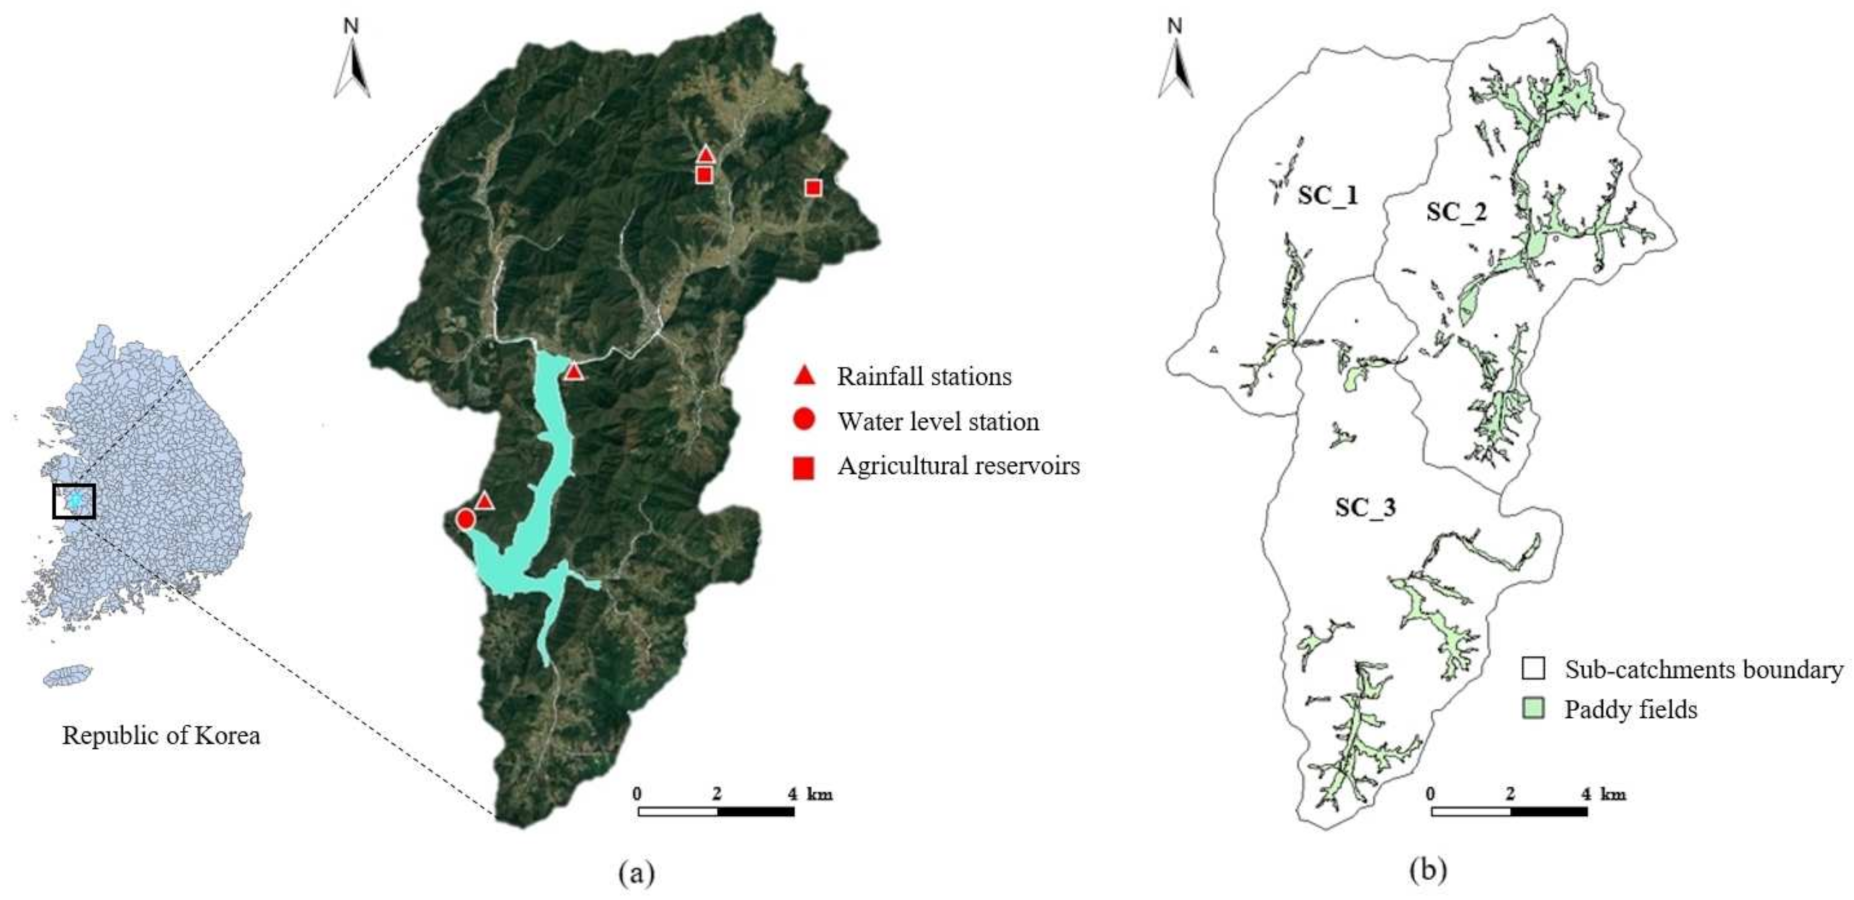
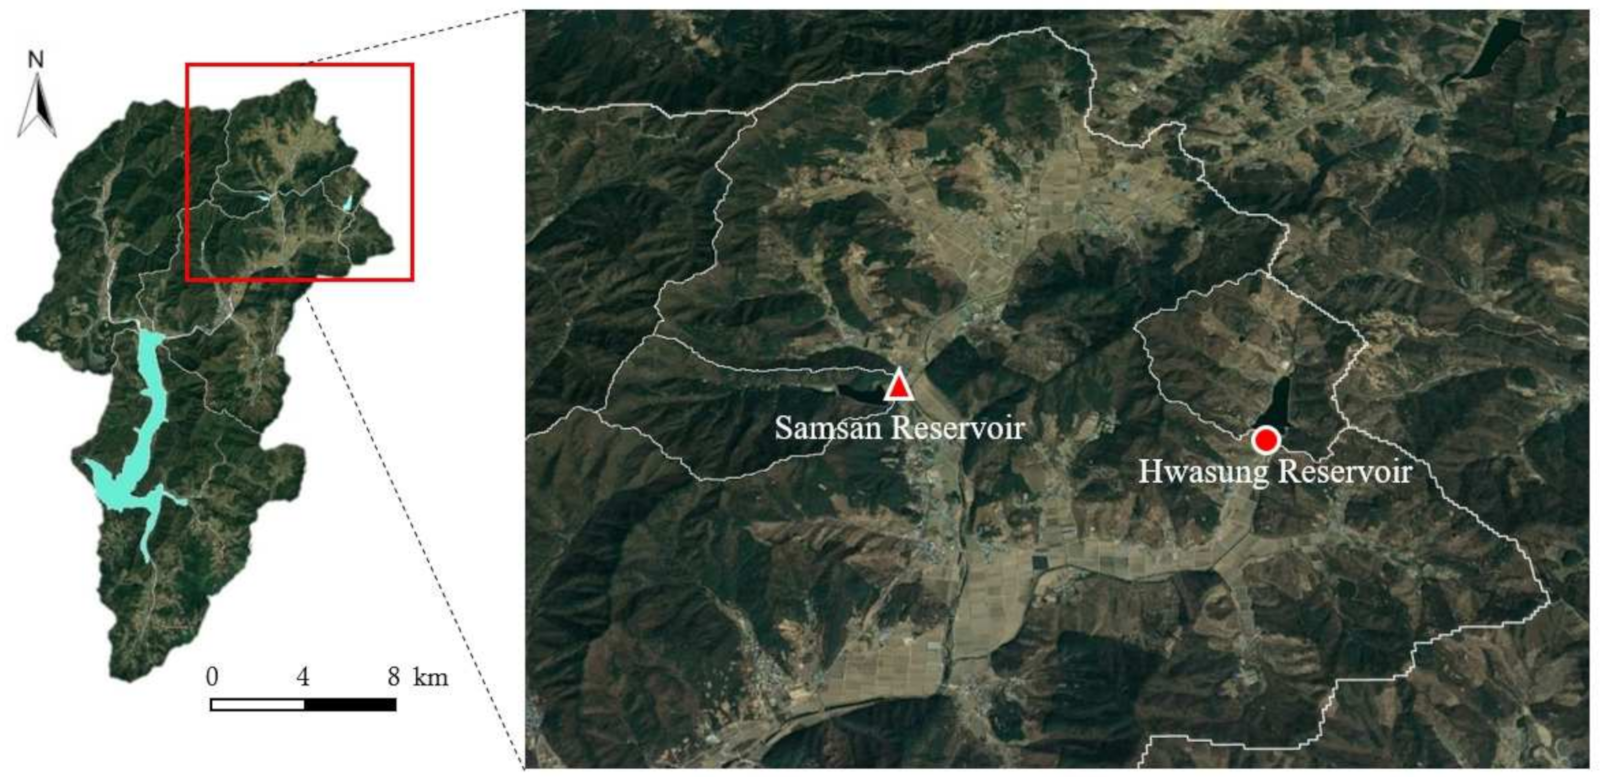
2.1. Study Area Description
2.2. CAT Model
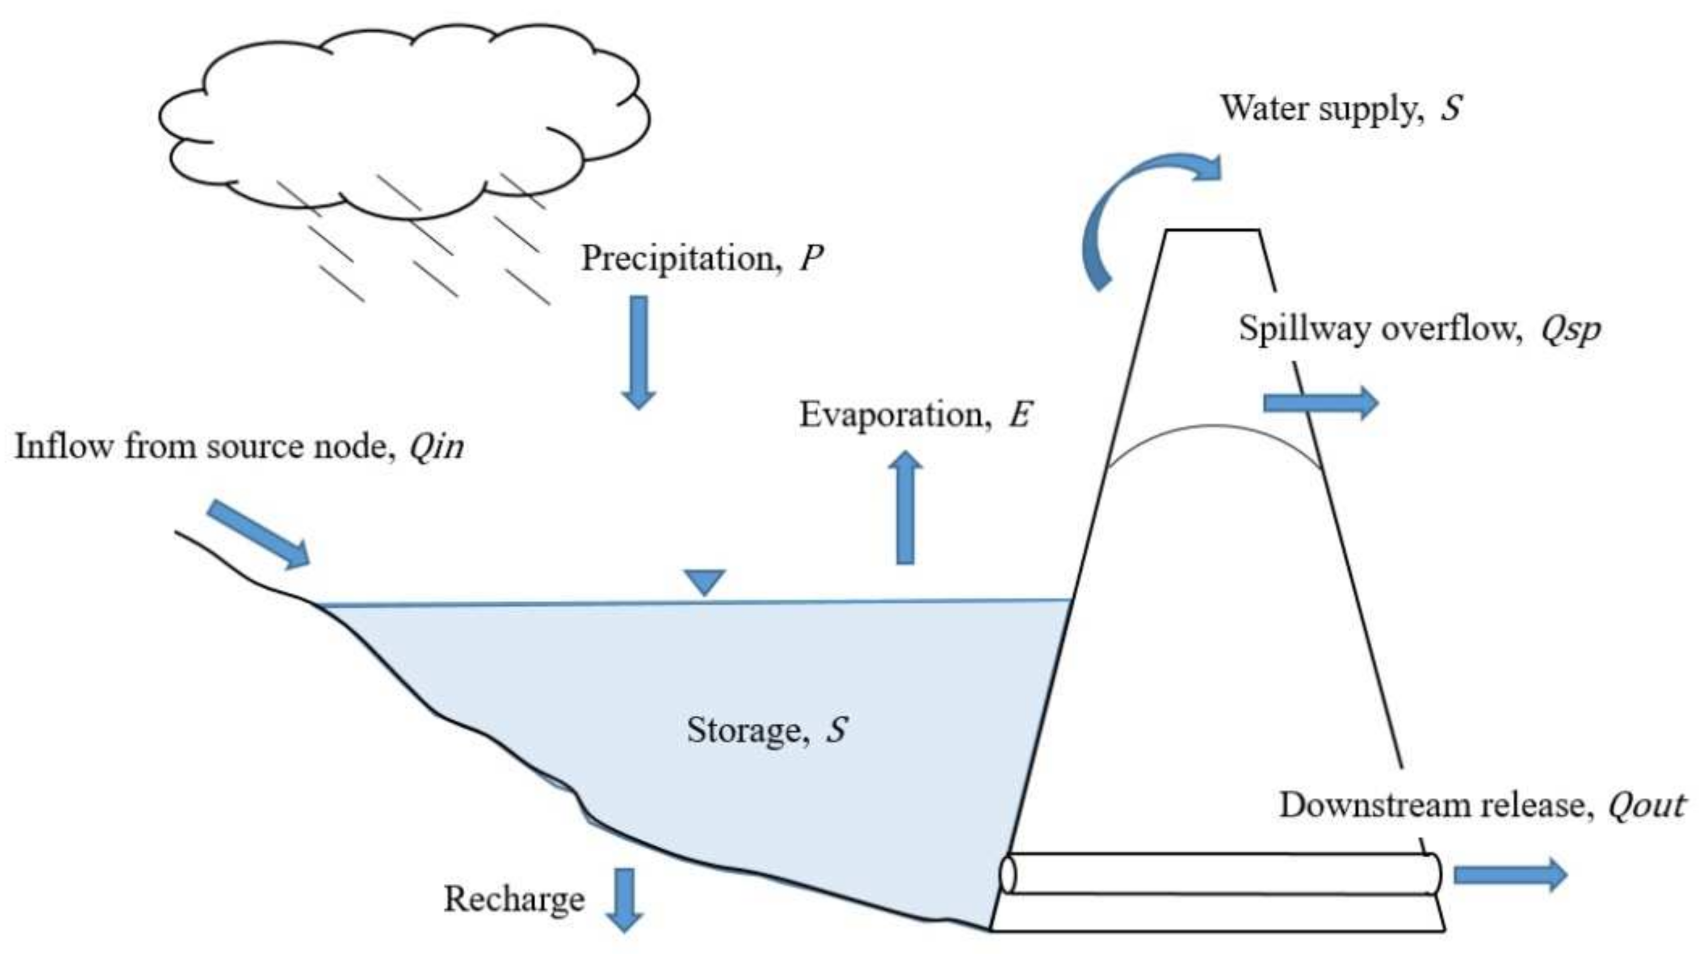
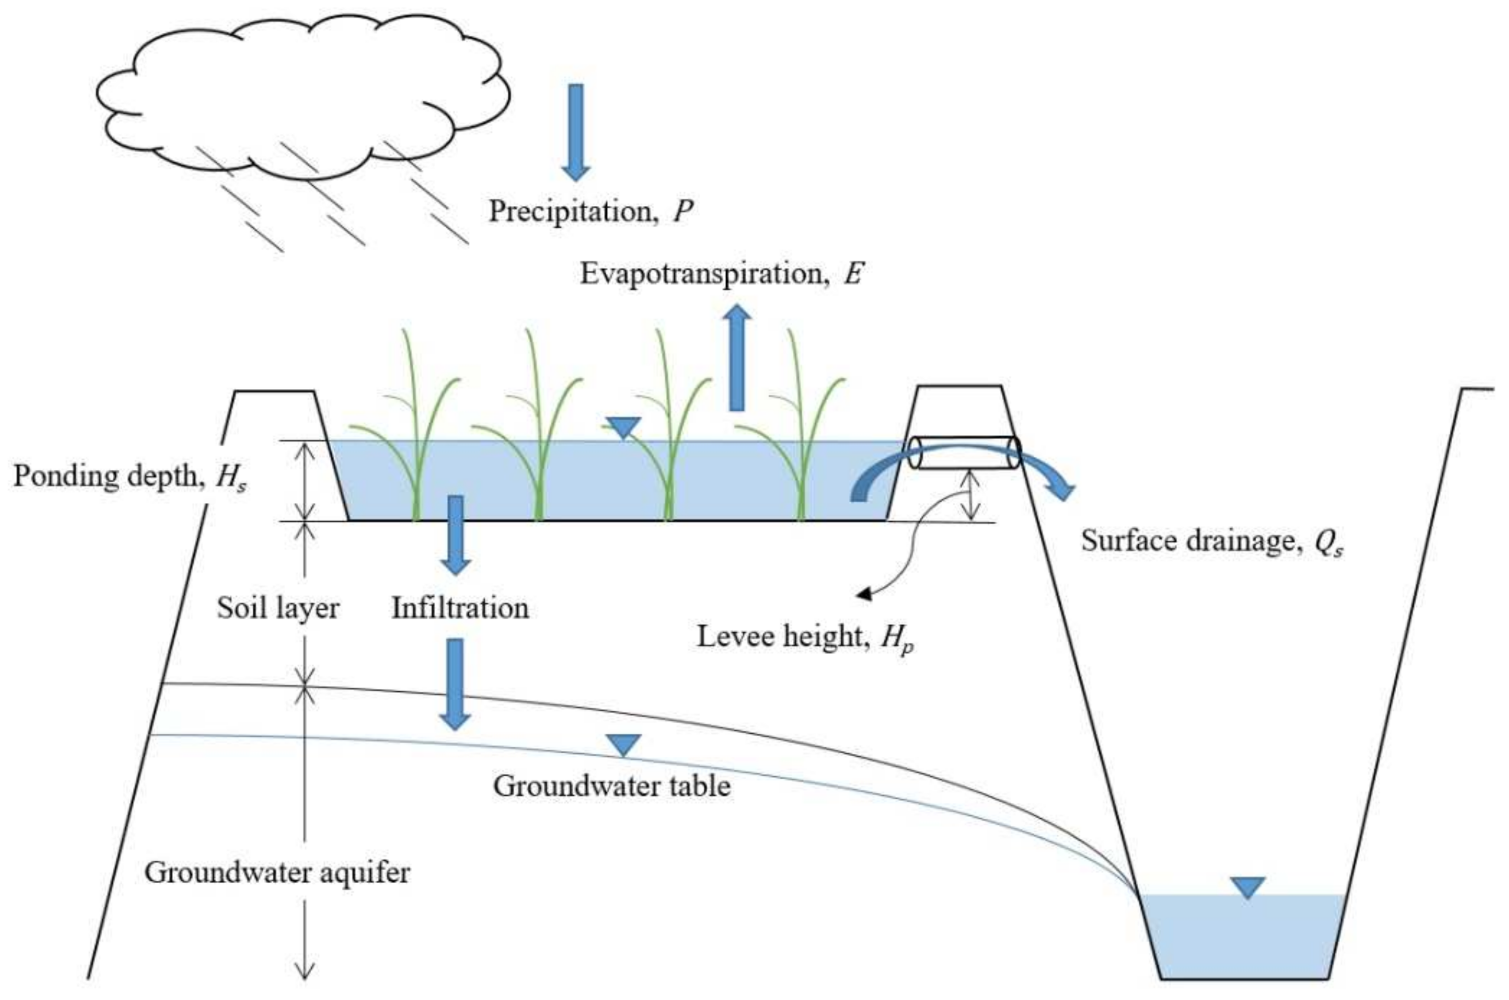
2.3. Water Cycle Processes of Reservoir and Paddy Field in CAT
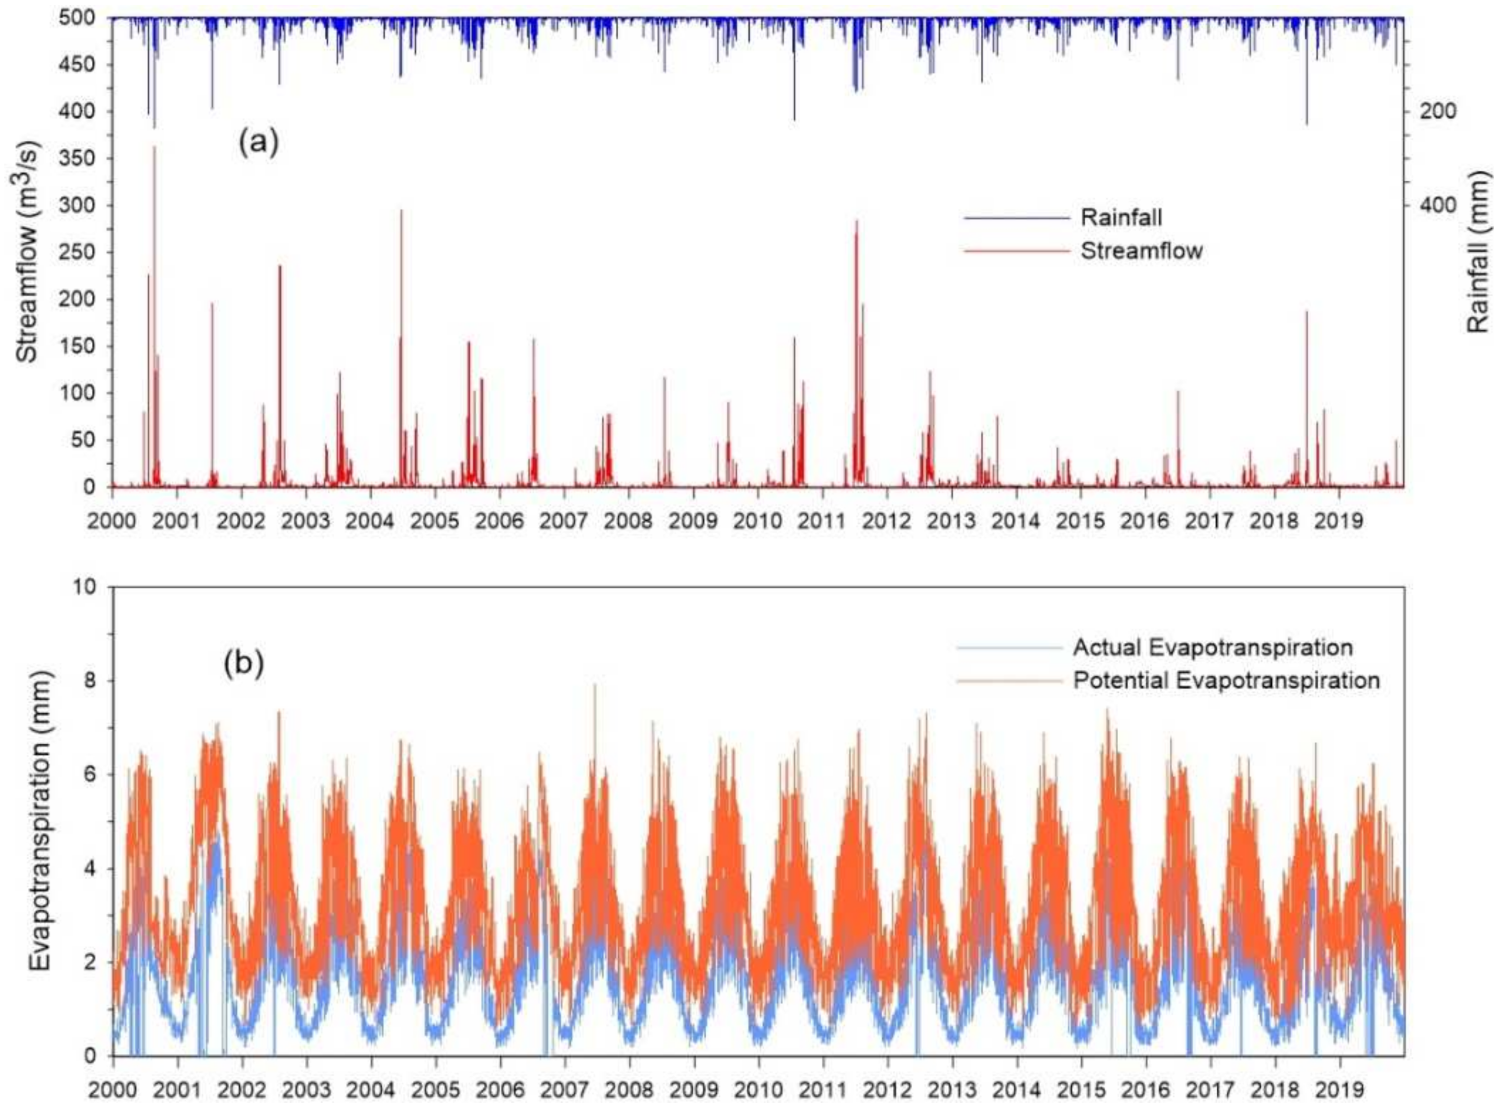
2.4. Data Collection
2.5. Model Performance Indicators
3. Results and Discussions
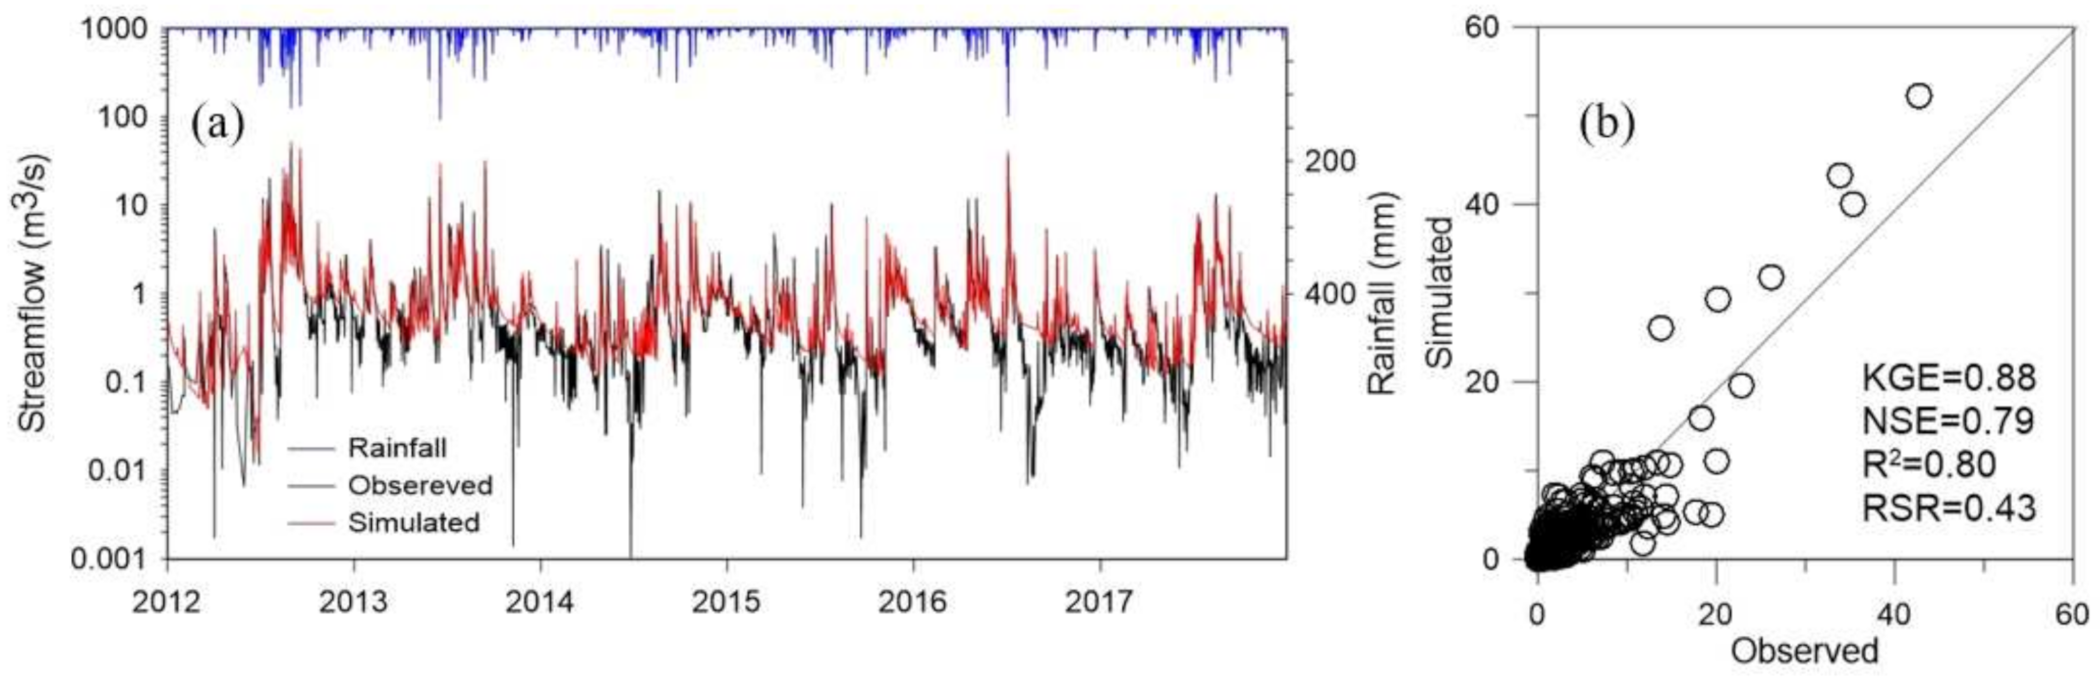
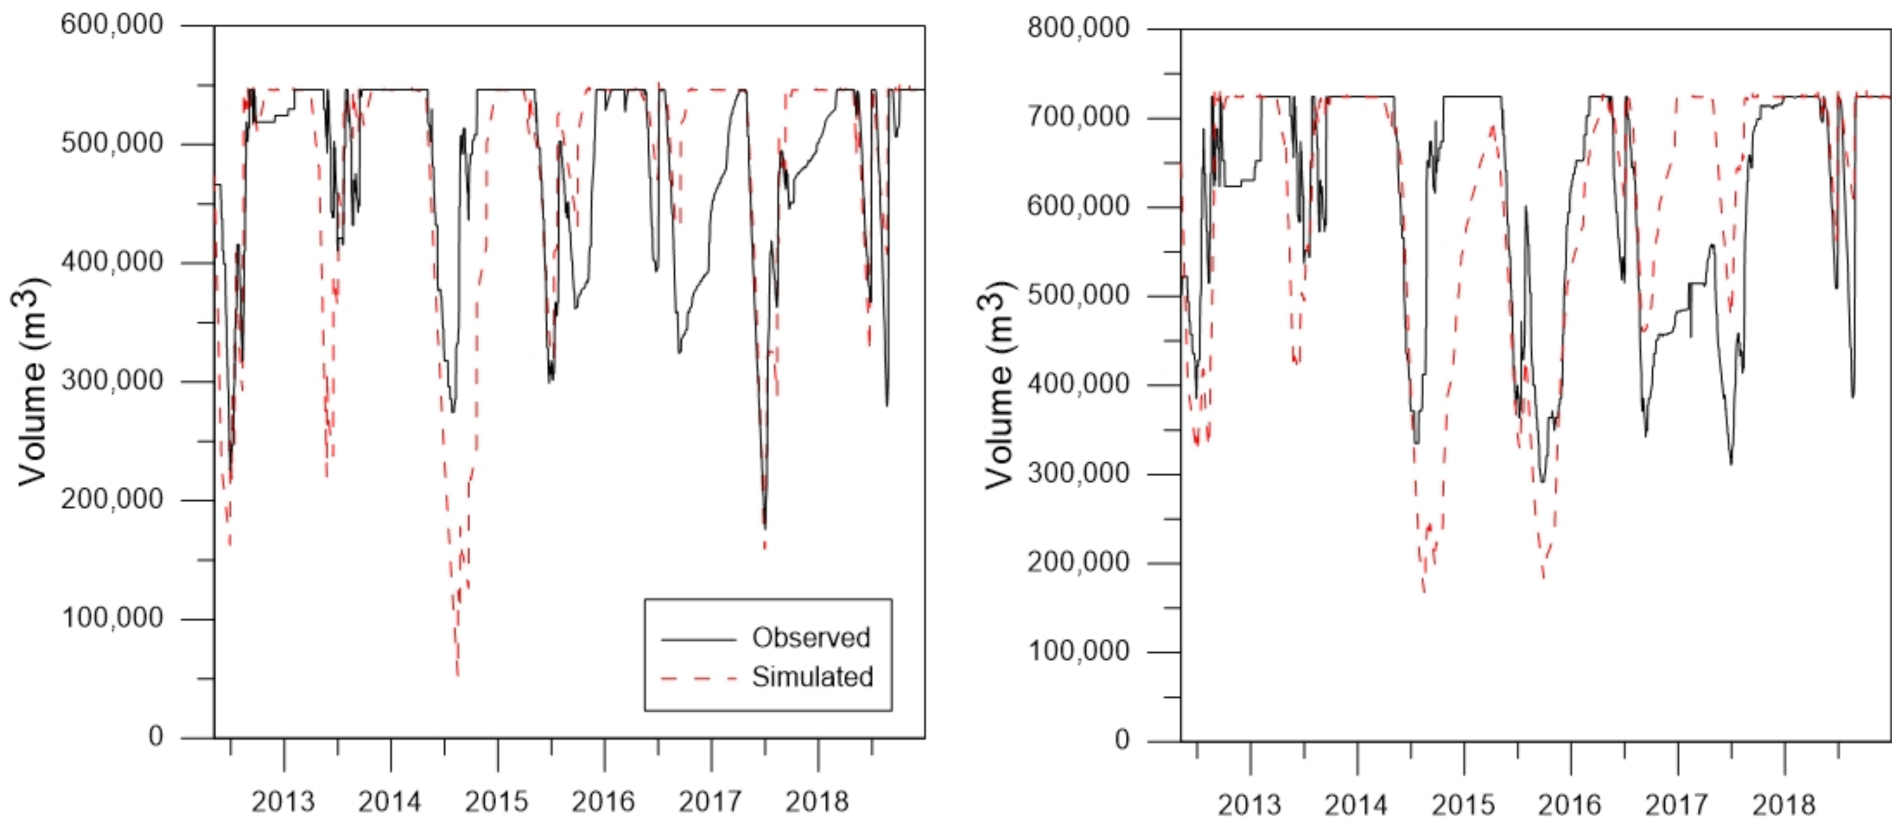
3.1. Model Performance of CAT
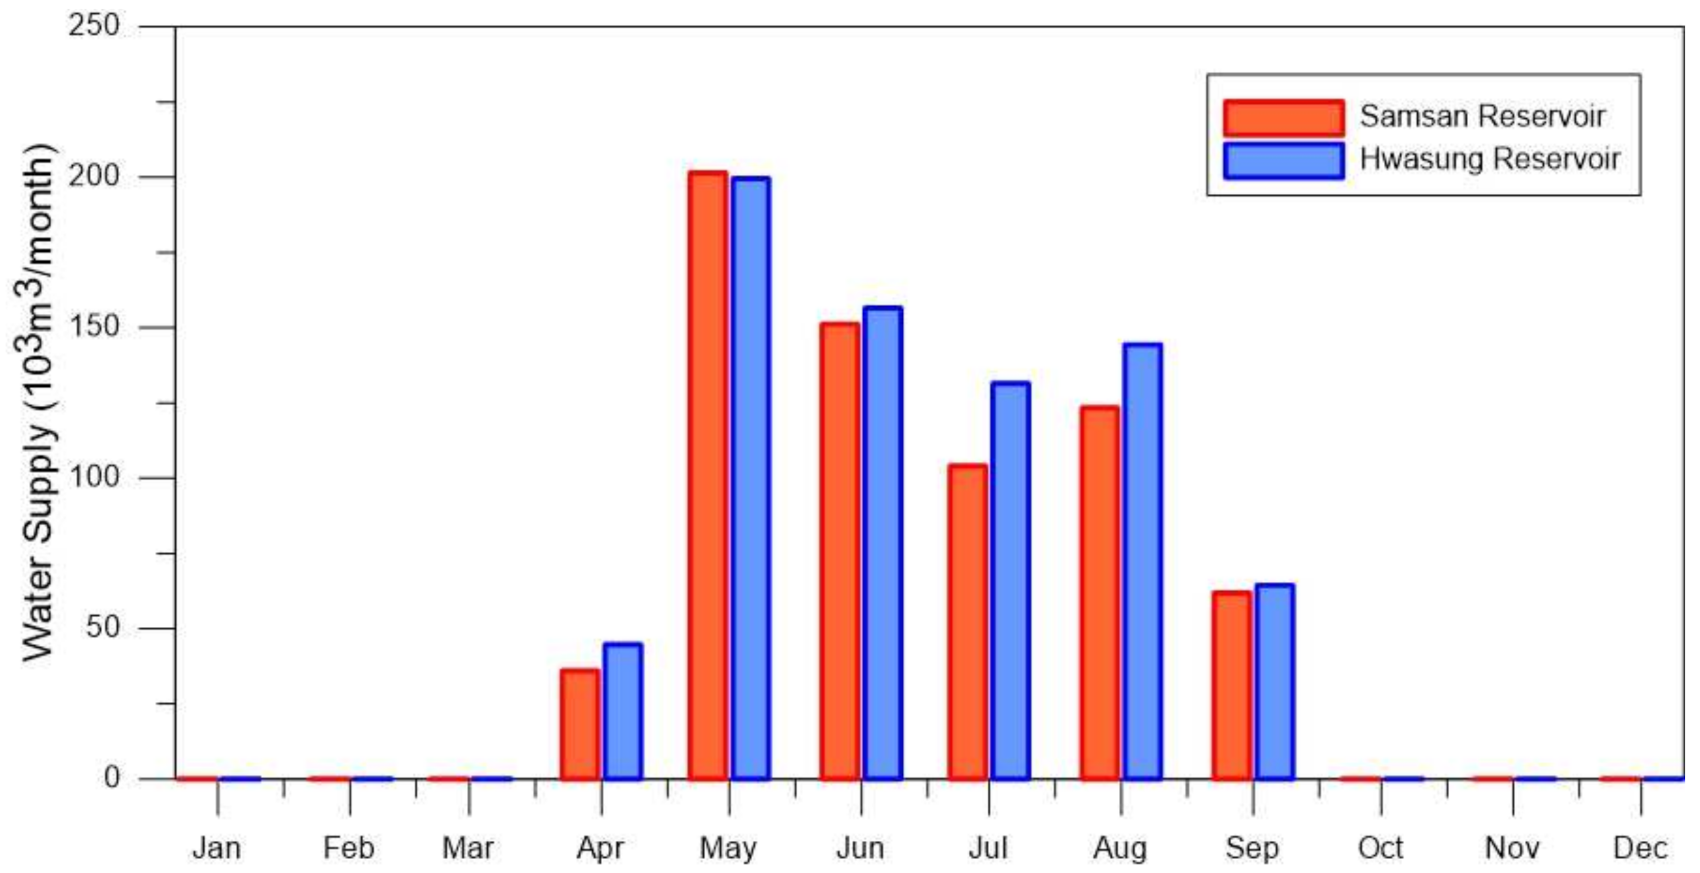
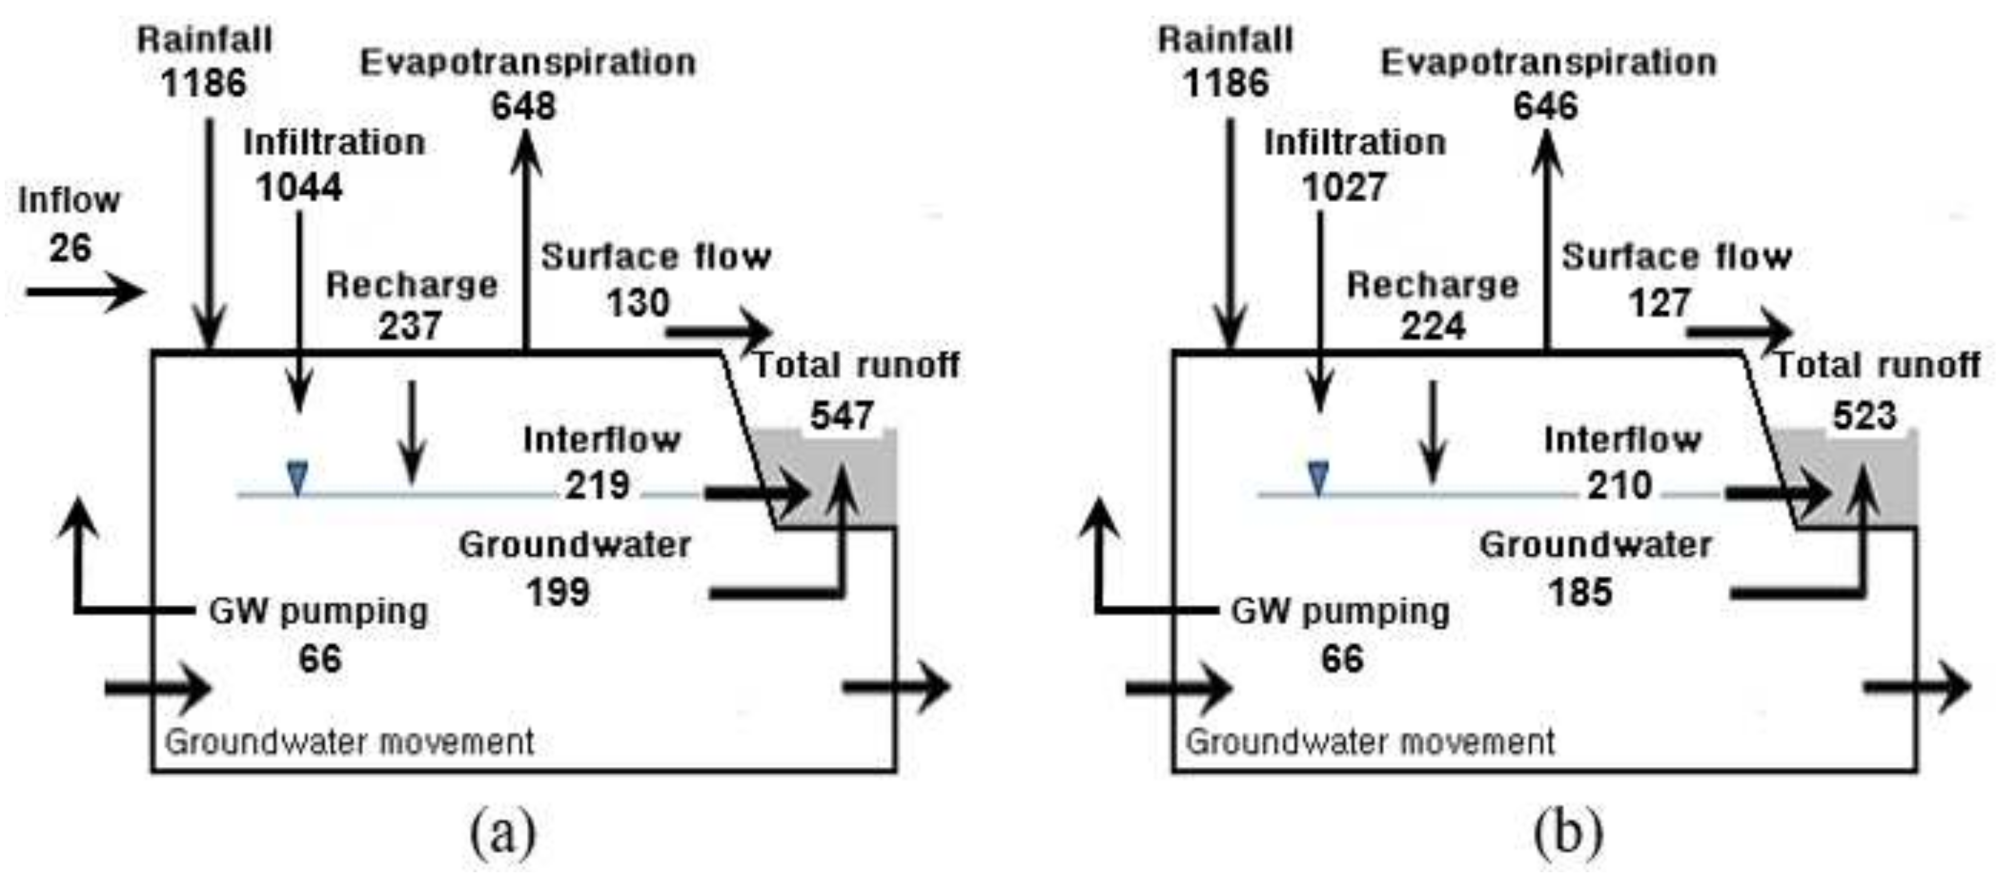
3.2. Water Balance Analysis
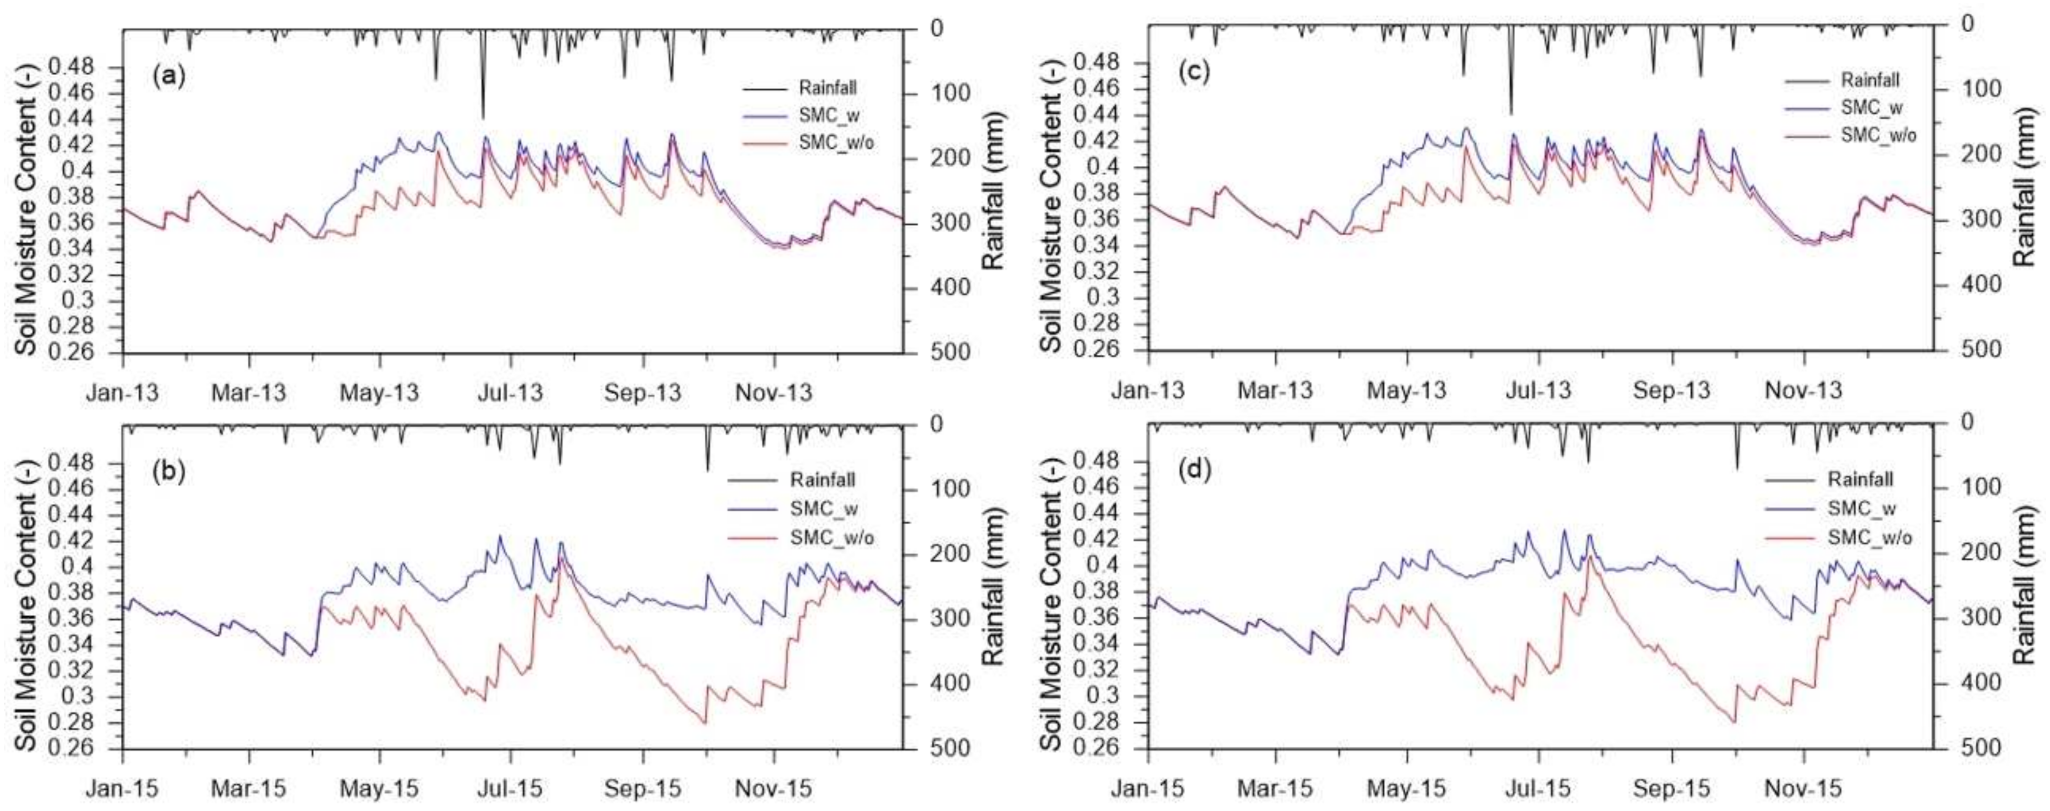
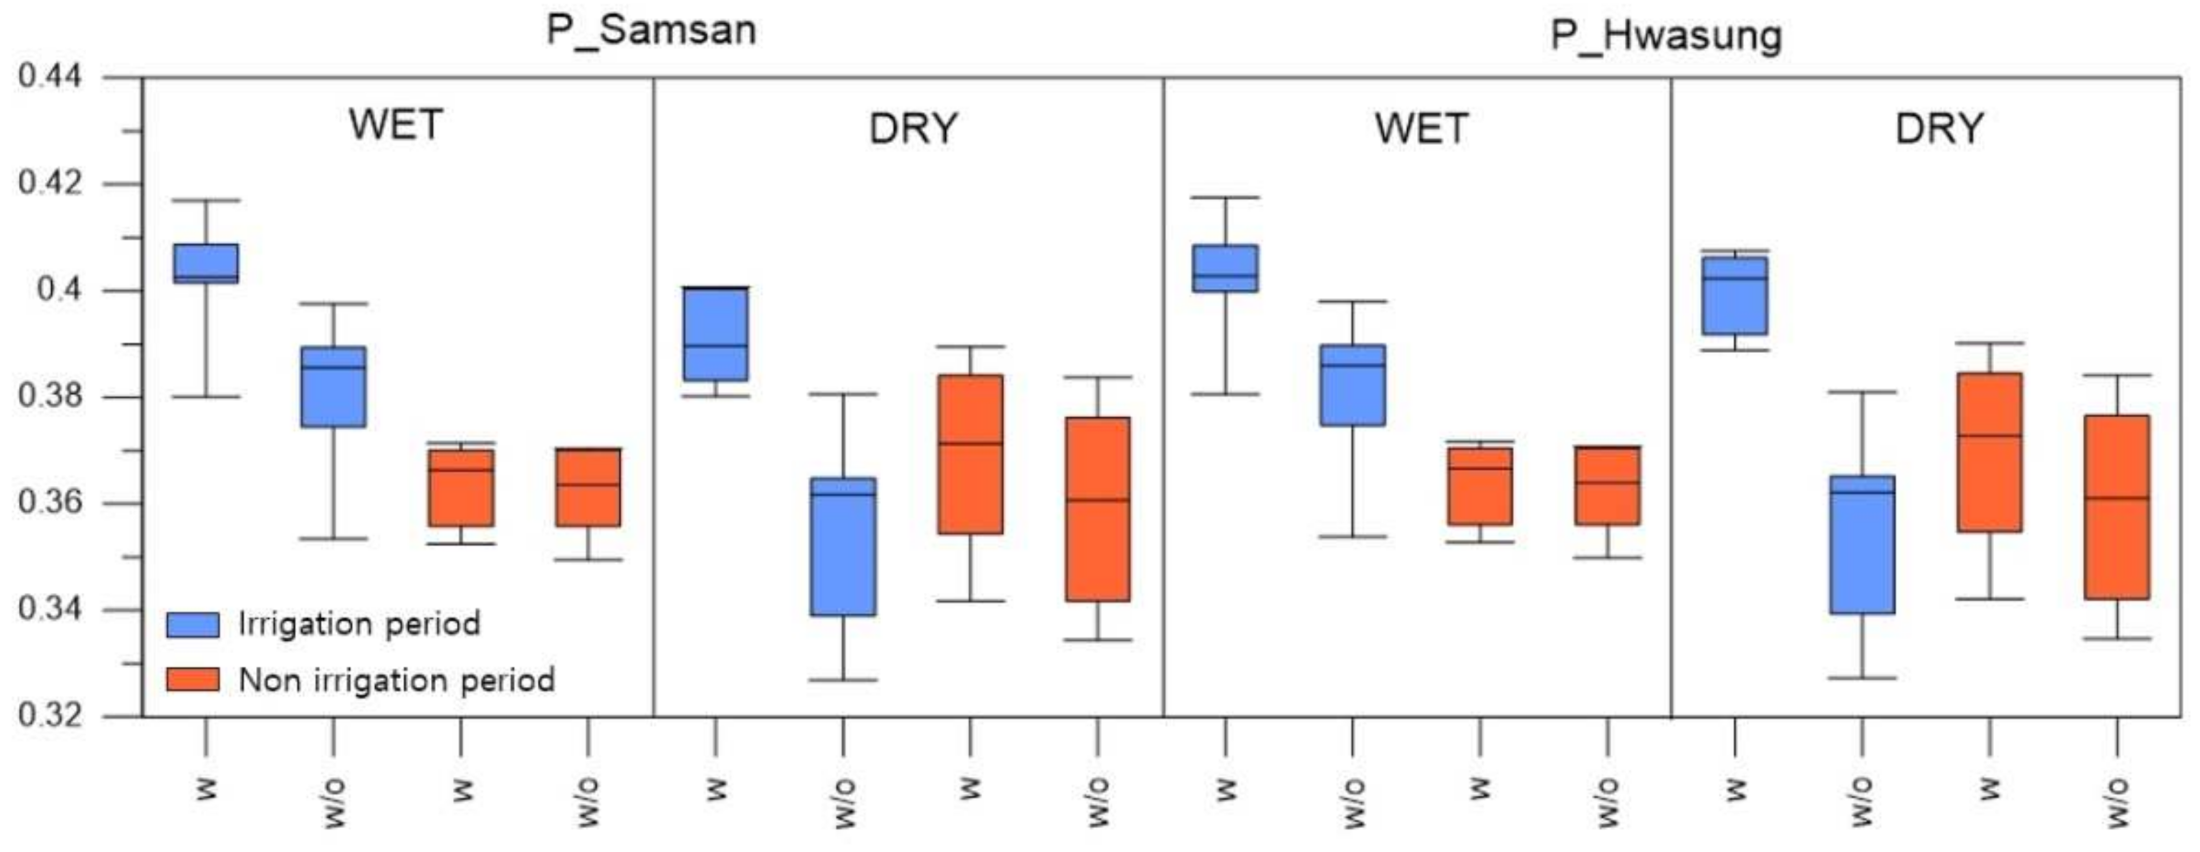
3.3. Soil Moisture Content of Paddy Fields
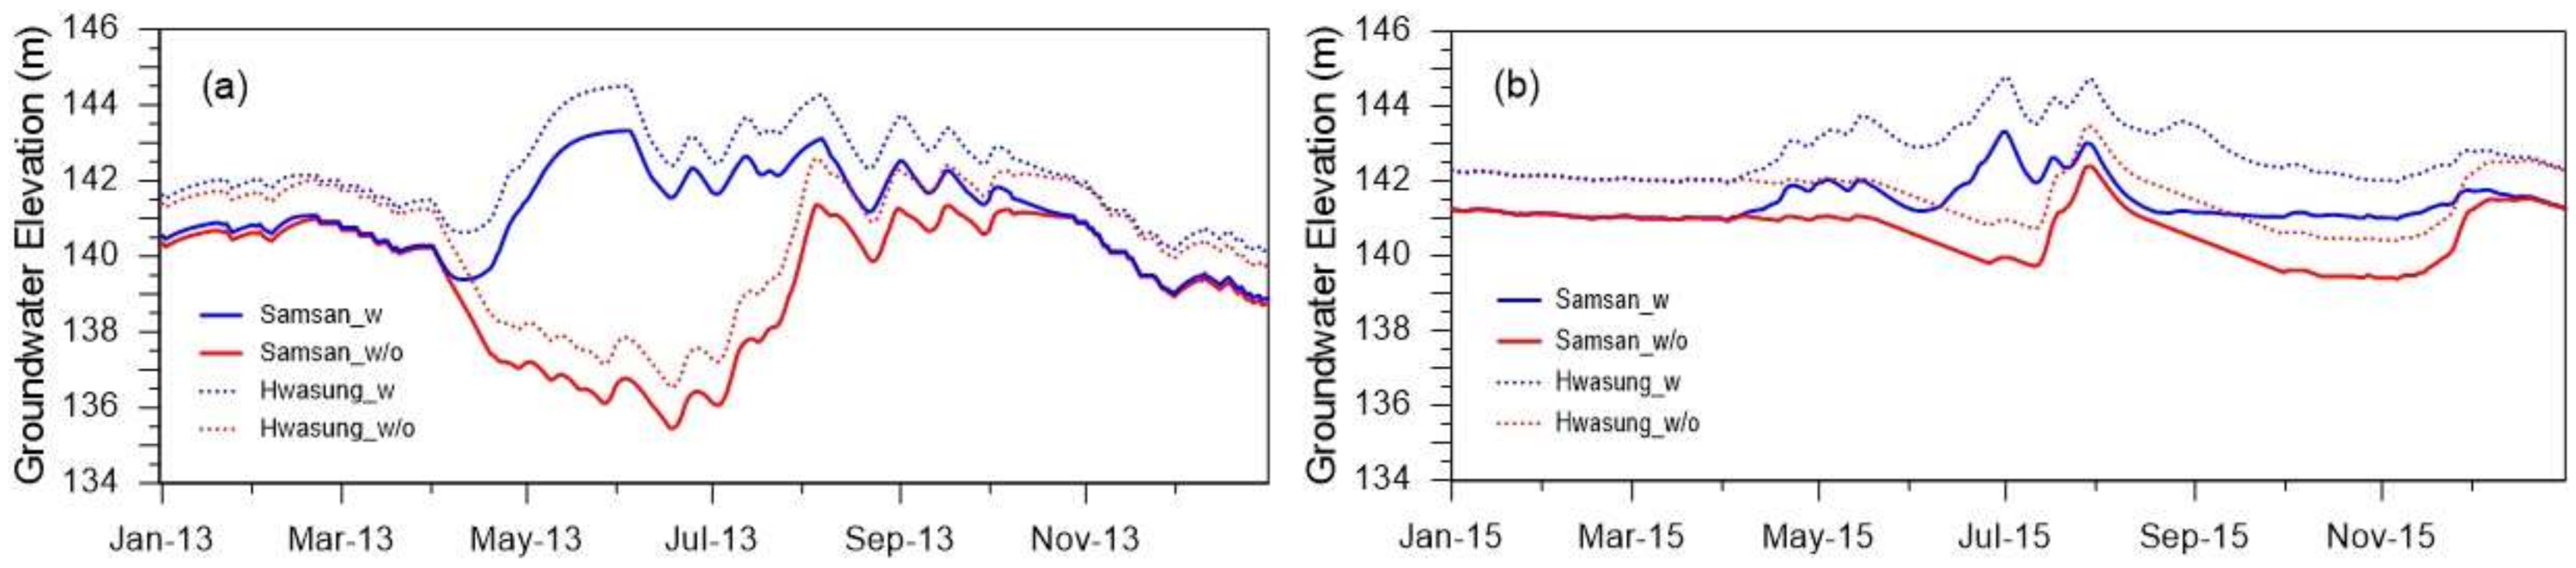
3.4. The Groundwater Elevation in Paddy Fields
4. Conclusions
Author Contributions
Funding
Institutional Review Board Statement
Informed Consent Statement
Data Availability Statement
Conflicts of Interest
References
- Zhang, G.; Xiao, X.; Dong, J.; Xin, F.; Zhang, Y.; Qin, Y.; Doughty, R.B.; Moore, B. Fingerprint of rice paddies in spatial-temporal dynamics of atmospheric methane concentration in monsoon Asia. Nat. Commun. 2020, 11, 554. [Google Scholar] [CrossRef] [PubMed] [Green Version]
- Statistics Korea. Available online: http://kostat.go.kr (accessed on 20 December 2021).
- Kim, S.; Song, J.; Hwang, S.; Kim, H.; Kang, M. Development of agricultural water circulation rate considering agricultural reservoir and irrigation district. J. Korean Soc. Agric. Eng. 2020, 62, 83–95. [Google Scholar] [CrossRef]
- Kim, N.W.; Lee, J.; Chung, I.M.; Lee, M.H. Combined effects of groundwater abstraction and irrigation reservoir on streamflow. J. Korea Water Resour. Assoc. 2013, 46, 719–733. [Google Scholar] [CrossRef] [Green Version]
- Korea Rural Community Corporation. Available online: https://www.ekr.or.kr/homepage/main.krc (accessed on 20 December 2021).
- Hong, J.; Choi, Y.; Yi, J. Parameter optimization of agricultural reservoir long-term runoff model based on historical data. J. Korea Water Resour. Assoc. 2021, 54, 93–104. [Google Scholar] [CrossRef]
- Ministry of Land, Infrastructure and Transport. Available online: http://www.molit.go.kr/english/intro.do (accessed on 20 December 2021).
- Nam, W.; Kwon, H.J.; Choi, K. Reevaluation of design frequency of drought and water supply safety for agricultural reservoirs under changing climate and farming methods in paddy fields. J. Korean. Soc. Agric. Eng. 2018, 60, 121–131. [Google Scholar] [CrossRef]
- Nam, W.H.; Hong, E.M.; Jang, M.W.; Choi, J.Y. Projection of consumptive use and irrigation water for major upland crops using soil moisture model under climate change. J. Korean Soc. Agric. Eng. 2014, 56, 77–87. [Google Scholar] [CrossRef] [Green Version]
- Nam, W.H.; Choi, J.Y.; Jang, M.W.; Hong, E.M. Agricultural drought risk assessment using reservoir drought index. J. Korean Soc. Agric. Eng. 2013, 55, 41–49. [Google Scholar] [CrossRef] [Green Version]
- Kim, J.U.; Lee, J.W.; Kim, S.J. Evaluation of the future agricultural drought severity of South Korea by using reservoir drought index (RDI) and climate change scenarios. J. Korea Water Resour. Assoc. 2019, 52, 381–395. [Google Scholar] [CrossRef]
- Bae, S.J.; Chung, H.W.; Choi, J.Y. Agricultural drought analysis using soil water balance model and geographic information system. J. Korean Soc. Agric. Eng. 1999, 41, 33–43. [Google Scholar]
- Shin, Y.; Lee, T.; Kim, S.; Lee, H.W.; Choi, K.S.; Kim, J.; Lee, G. Development of agricultural drought approach using SMAP soil moisture footprints. J. Korean Soc. Agric. Eng. 2017, 59, 57–70. [Google Scholar] [CrossRef] [Green Version]
- National Drought Information Portal. Available online: https://www.drought.go.kr (accessed on 20 December 2021).
- Lee, D.G.; Song, J.; Ryu, J.H.; Lee, J.; Choi, S.; Kang, M.S. Integrating the mechanisms of agricultural reservoir and paddy cultivation to the HSPF-MASA-CREAMS-PADDY system. J. Korean Soc. Agric. Eng. 2018, 60, 60–68. [Google Scholar] [CrossRef]
- Kim, B.K.; Kim, B.S.; Kwon, H.H. Impact assessment of agricultural reservoir on streamflow simulation using semi-distributed hydrologic model. KSCE J. Civ. Eng. 2008, 29, 11–22. [Google Scholar]
- Lee, J.; Kim, N.W.; Chung, I.; Lee, J.E. Effects of irrigation reservoirs and groundwater withdrawals on streamflow for the Anseongcheon Upper Watershed. KSCE J. Civ. Eng. 2015, 35, 835–844. [Google Scholar] [CrossRef]
- Lee, J.; Noh, J. Evaluating future stream flow by operation of agricultural reservoir group considering the RCP 8.5 climate change scenario. J. Korean Soc. Agric. Eng. 2015, 57, 113–122. [Google Scholar] [CrossRef]
- Cho, Y.; Park, S.; Na, J.; Kim, T.; Lee, J. Hydrological and ecological alteration of river dynamics due to multipurpose dams. J. Wetl. Res. 2019, 21, 16–27. [Google Scholar] [CrossRef]
- Ministry of Environment. Available online: http://me.go.kr (accessed on 20 December 2021).
- Korea Meteorological Administration. Available online: http://hydro.kma.go.kr (accessed on 20 December 2021).
- Korean Soil Information System. Available online: http://soil.rda.go.kr/eng/ (accessed on 20 December 2021).
- Korea Water Resources Corporation. Available online: https://www.water.or.kr (accessed on 20 December 2021).
- Park, S.; Kim, H.; Jang, C. Impact of groundwater abstraction on hydrological responses during extreme drought periods in the Boryeong Dam catchment, Korea. Water 2021, 13, 2132. [Google Scholar] [CrossRef]
- Google Earth. Available online: https://earth.google.com/web/ (accessed on 28 January 2022).
- National Geographic Information Institute. Available online: https://www.ngii.go.kr/eng/main.do (accessed on 20 December 2021).
- Kim, H.J.; Jang, C.H.; Noh, S.J. Development and application of the catchment hydrologic cycle assessment tool considering urbanization (Ⅰ)—Model development-. J. Korea Water Resour. Assoc. 2012, 45, 203–215. [Google Scholar] [CrossRef] [Green Version]
- Jang, C.H.; Kim, H.J.; Kim, J.T. Prediction of reservoir water level using CAT. J. Korean Soc. Agric. Eng. 2012, 54, 27–38. [Google Scholar] [CrossRef] [Green Version]
- Jang, C.H.; Kim, H.J.; Ahn, S.R.; Kim, S.J. Assessment of hydrological changes in a river basin as affected by climate change and water management practices, by using the CAT model. Irrig. Drain. 2016, 65, 26–35. [Google Scholar] [CrossRef]
- Birhanu, D.; Kim, H.J.; Jang, C.H.; Park, S.H. Does the complexity of evapotranspiration and hydrological models enhance robustness? Sustainability 2018, 10, 2837. [Google Scholar] [CrossRef] [Green Version]
- Choi, S.W.; Jang, C.H.; Kim, H.J. Analysis of short-term runoff characteristics of CAT-PEST connected model using different infiltration analysis methods. J. Korea Acad.-Ind. Coop. Soc. 2016, 17, 26–41. [Google Scholar] [CrossRef]
- Lee, S.H.; Cho, H.J. Analysis of water cycle at main streams in Ulsan using CAT model. J. Korea Water Resour. Assoc. 2014, 47, 1–10. [Google Scholar] [CrossRef]
- Miller, J.D.; Kim, H.J.; Kjeldsen, T.R.; Packman, J.; Grebby, S.; Dearden, R. Assessing the impact of urbanization on storm runoff in a peri-catchment using historical change in impervious cover. J. Hydrol. 2014, 515, 59–70. [Google Scholar] [CrossRef] [Green Version]
- Catchment Hydrologic Cycle Assessment Tool User’s Manual (CAT3.2). Available online: http://watercycle.kict.re.kr/ (accessed on 20 December 2021).
- McVicar, T.R.; Roderick, M.L.; Donohue, R.J.; Li, L.T.; Van Niel, T.G.; Thomas, A.; Grieser, J.; Jhajharia, D.; Himri, Y.; Mahowald, N.M.; et al. Global review and synthesis of trends in observed terrestrial near-surface wind speeds: Implications for evaporation. J. Hydrol. 2012, 416-417, 182–205. [Google Scholar] [CrossRef]
- Barella-Ortiz, A.; Polcher, J.; Tuzet, A.; Laval, K. Potential evaporation estimation through an unstressed surface-energy balance and its sensitivity to climate change. Hydrol. Earth Syst. Sci. 2012, 17, 4625–4639. [Google Scholar] [CrossRef] [Green Version]
- Rural Development Administration. Available online: http://www.rda.go.kr (accessed on 20 December 2021).
- Rural Agricultural Water Resource Information System. Available online: https://rawris.ekr.or.kr/main.do (accessed on 20 December 2021).
- Moussa, R.; Chahinian, N. Comparison of different multi-objective calibration criteria using a conceptual rainfall-runoff model of flood events. Hydrol. Earth Syst. Sci. 2009, 13, 519–535. [Google Scholar] [CrossRef] [Green Version]
- Legate, D.R.; McCabe, G.J., Jr. Evaluating the use of “goodness-of-fit” measures in hydrologic and hydroclimatic model validation. Water Resour. Res. 1999, 35, 233–241. [Google Scholar] [CrossRef]
- Moriasi, D.N.; Arnold, J.G.; Van Liew, M.W.; Bingner, R.L.; Harmel, R.D.; Veith, T.L. Model Evaluation guidelines for systematic quantification of accuracy in watershed simulation. ASABE 2007, 50, 885–900. [Google Scholar] [CrossRef]
- Jung, Y.H.; Jung, C.G.; Jung, S.W.; Park, J.Y.; Kim, S.J. Estimation of upstream ungauged watershed streamflow using downstream discharge data. J. Korean Soc. Agric. Eng. 2012, 54, 169–176. [Google Scholar]


| Reservoir | Latitude (DMS) | Longitude (DMS) | Catchment Area (km2) | Maximum Surface Area (m2) | Total Storage Capacity (m3) | Effective Storage Capacity (m3) | Height of Embankment (m) |
|---|---|---|---|---|---|---|---|
| Samsan | 36°20′14′′ | 126°43′10′′ | 1.8 | 52,000 | 546,200 | 543,200 | 25.7 |
| Hwasung | 36°20′07′′ | 126°45′13′′ | 2.05 | 85,800 | 724,400 | 720,900 | 24.7 |
| Node | Description | Node | Description |
|---|---|---|---|
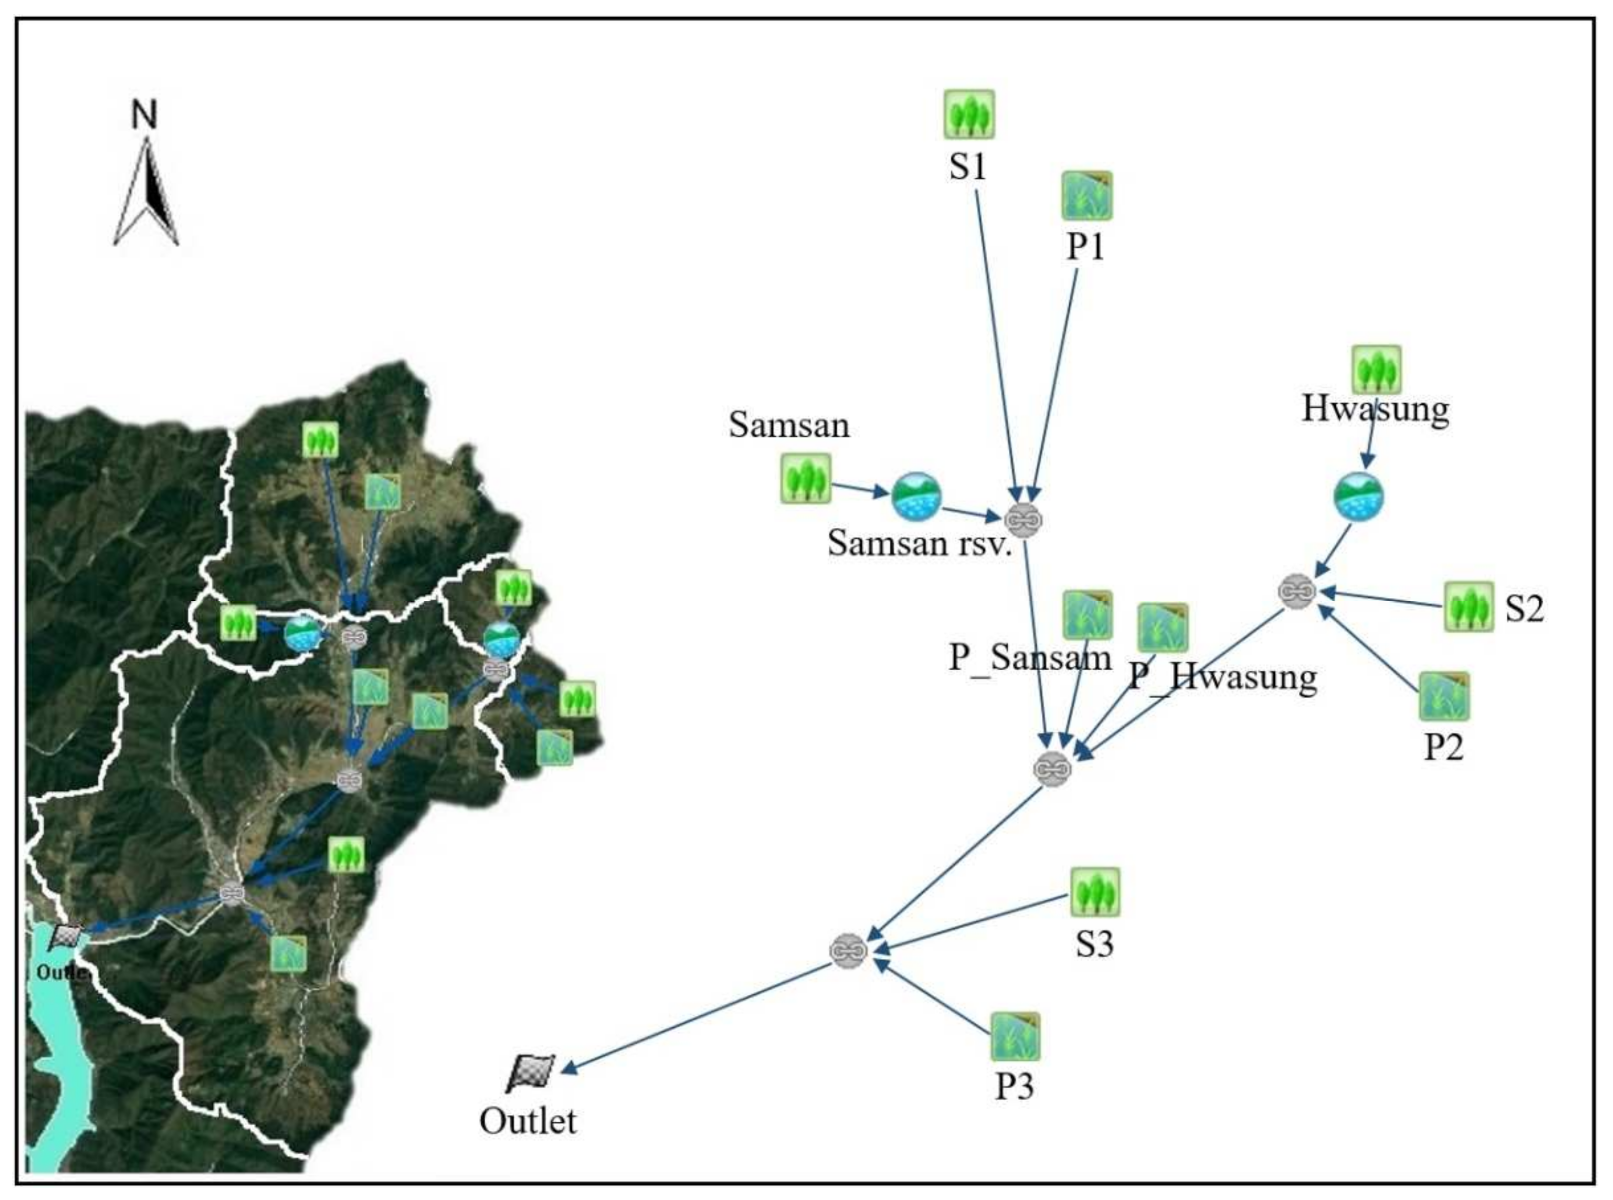
| Samsan | Samsan reservoir catchment | S1 | Upstream catchment of P_Samsan |
| Samsan rsv. | Samsan reservoir | P1 | Paddy field in C1 |
| P_Samsan | Irrigated paddy field by Samsan reservoir | S2 | Upstream catchment of P_Hwasung |
| Hwasung | Hwasung reservoir catchment | P2 | Paddy field in C2 |
| Hwasung_rsv. | Hwasung reservoir | S3 | Downstream catchment |
| P_Hwasung | Irrigated paddy field by Hwasung reservoir | P3 | Paddy field in C3 |
| Sub-Catchments | Samsan | Hwasung | S1 | S2 | S3 |
|---|---|---|---|---|---|
| Area (km2) | 1.8 | 2.05 | 12.25 | 30.70 | 2.21 |
| Slope (%) | 0.354 | 0.282 | 0.281 | 0.277 | 0.302 |
| Impv_a (%) | 1.02 | 2.46 | 5.48 | 7.84 | 3.11 |
| GW_pump (m3/day) | 19.58 | 22.30 | 133.24 | 333.93 | 23.98 |
| Paddy Fields | P_Samsan | P_Hwasung | P1 | P2 | P3 |
| Area (km2) | 0.8 | 0.80 | 2.5 | 0.20 | 3.12 |
| Slope (%) | 0.122 | 0.110 | 0.095 | 0.088 | 0.079 |
| Impv_a (%) | 0.00 | 0.00 | 0.00 | 0.00 | 0.00 |
| GW_pump (m3/day) | 1384.91 | 1388.37 | 4327.84 | 342.77 | 5401.14 |
| (Unit: 103 m3) | |||||
|---|---|---|---|---|---|
| Year | Samsan Rsv. | Hwasung Rsv. | Year | Samsan Rsv. | Hwasung Rsv. |
| 2012 | 944.8 | 953.33 | 2016 | 338.63 | 642.17 |
| 2013 | 814.6 | 822.8 | 2017 | 685.64 | 415.72 |
| 2014 | 782.6 | 899.33 | 2018 | 625.26 | 579.79 |
| 2015 | 553.93 | 873.49 | Avg. | 677.92 | 740.95 |
| (Unit: %) | |||||
|---|---|---|---|---|---|
| Year | Total Runoff | Surface Runoff | Interflow | Baseflow | Recharge |
| 2012 | 3.71 | 3.01 | 2.98 | 5.57 | 3.95 |
| 2013 | 4.35 | 1.84 | 3.81 | 6.39 | 4.95 |
| 2014 | 7.35 | 0.36 | 6.91 | 11.40 | 8.82 |
| 2015 | 5.48 | 0.88 | 5.38 | 7.48 | 6.94 |
| 2016 | 2.96 | 0.61 | 3.20 | 4.27 | 4.13 |
| 2017 | 4.45 | 0.93 | 4.37 | 5.78 | 5.23 |
| Avg. | 4.72 | 1.27 | 4.44 | 6.81 | 5.67 |
| Period | P_Samsan | P_Hwasung | |||||
|---|---|---|---|---|---|---|---|
| w/o | w | Increase (%) | w/o | w | Increase (%) | ||
| WET | Irrig. | 0.381 | 0.402 | 5.25 | 0.381 | 0.402 | 5.14 |
| Non irrig. | 0.362 | 0.364 | 0.44 | 0.362 | 0.364 | 0.43 | |
| DRY | Irrig. | 0.356 | 0.391 | 8.91 | 0.356 | 0.400 | 10.92 |
| Non irrig. | 0.360 | 0.369 | 2.49 | 0.360 | 0.370 | 2.59 | |
| (Unit: m) | ||||
|---|---|---|---|---|
| Month | WET | DRY | ||
| P_Samsan | P_Hwasung | P_Samsan | P_Hwasung | |
| Jan | 0.20 | 0.28 | 0.00 | 0.03 |
| Feb | 0.15 | 0.23 | 0.00 | 0.02 |
| Mar | 0.07 | 0.19 | 0.00 | 0.03 |
| Apr | 1.82 | 2.04 | 0.43 | 0.56 |
| May | 6.11 | 6.24 | 0.83 | 1.41 |
| Jun | 6.09 | 5.92 | 1.77 | 2.39 |
| Jul | 4.44 | 4.19 | 1.74 | 2.31 |
| Aug | 1.42 | 1.48 | 0.40 | 1.43 |
| Sep | 0.94 | 1.04 | 1.08 | 1.74 |
| Oct | 0.25 | 0.29 | 1.59 | 1.71 |
| Nov | 0.04 | 0.14 | 1.41 | 1.44 |
| Dec | 0.12 | 0.34 | 0.13 | 0.17 |
| Avg. | 1.81 | 1.87 | 0.78 | 1.11 |
Publisher’s Note: MDPI stays neutral with regard to jurisdictional claims in published maps and institutional affiliations. |
© 2022 by the authors. Licensee MDPI, Basel, Switzerland. This article is an open access article distributed under the terms and conditions of the Creative Commons Attribution (CC BY) license (https://creativecommons.org/licenses/by/4.0/).
Share and Cite
Park, S.; Kim, H.; Jang, C.; Kim, D. Hydrological Effects of Agricultural Water Supplies on Paddy Fields using Surface–Groundwater Integrated Model. Water 2022, 14, 460. https://doi.org/10.3390/w14030460
Park S, Kim H, Jang C, Kim D. Hydrological Effects of Agricultural Water Supplies on Paddy Fields using Surface–Groundwater Integrated Model. Water. 2022; 14(3):460. https://doi.org/10.3390/w14030460
Chicago/Turabian StylePark, Sanghyun, Hyeonjun Kim, Choelhee Jang, and Deokhwan Kim. 2022. "Hydrological Effects of Agricultural Water Supplies on Paddy Fields using Surface–Groundwater Integrated Model" Water 14, no. 3: 460. https://doi.org/10.3390/w14030460
APA StylePark, S., Kim, H., Jang, C., & Kim, D. (2022). Hydrological Effects of Agricultural Water Supplies on Paddy Fields using Surface–Groundwater Integrated Model. Water, 14(3), 460. https://doi.org/10.3390/w14030460