Abstract
Industrial activities have raised widespread concerns about groundwater pollution and human health. Shanghai’s industrial land has been polluting the groundwater for more than 30 years; however, it is not clear whether it poses a risk to human health. This study explores the health risk degree in different groups of groundwater in old industrial areas in Shanghai, China. We selected eight heavy metal elements (As, Cd, Cr, Ni, Hg, Pb, Cu, and Zn) as the research objects and analyzed the characteristics of concentrations and spatial distribution using single factor index and geostatistical analytical methods. Results indicated that the average concentrations of As and Hg were higher than the environmental standards. Meanwhile, As, Ni, Hg and Pb in groundwater were notable anthropogenic inputs. Compared with irrigation cropland, the pollution of Ni, Pb and As in industrial land was obviously more serious. In addition, the health risk assessment results indicated the priority control pollutants of non-carcinogenic risk and carcinogenic risk are As and Cr, respectively. Our results showed that human activities have deeply increased heavy metal concentrations in groundwater, which in turn poses risks to human health. These findings provide scientific support for urban managers to reduce residents’ drinking water risks.
1. Introduction
The rapid development of urbanization in Shanghai caused an increase in heavy metal emissions and then polluted groundwater [1]. However, industrial waste was the main pollution factor among the multiple pollution sources [2]. As this has not been properly treated before discharge, the result is an increasing pollution risk in groundwater [3,4,5]. Long-term industrial production has led to high concentrations of toxic substances in groundwater [6]. Due to the mobility of groundwater, harmful substances also presented risks to the ecosystem of the surrounding land [7,8]. To reduce the risk of heavy metals, it is very essential to identify priority pollutants and priority control areas.
The heavy metal pollution of groundwater was a prominent environmental problem due to the fast spread of contaminants in the subsurface caused by industrial activities and land use management [9,10,11]. Many studies related to industrial area pollution have been undertaken in China. For example, Xiao et al. [12] and Chen et al. [13] investigated the content of heavy metals in industrial land. Results showed that the content of heavy metals was much higher than environmental standards, which posed severe negative effects to the local land security. While the harms of industrial pollution to the environment were obtained in China, the impact of land-use covers on health risks was not considered. Additionally, some foreign researchers have reached similar conclusions. Antoniadis et al. [14] studied the impact of pollution on corn in Greek industrial areas. Rachel et al. [15] studied the impact of the mining area on soil microorganisms. However, most of the previous studies have focused on pollution status evaluation, and few studies have considered the influence of industrial activities on human health through groundwater. The degree of environmental pollution was different under different land use types [16,17]. Therefore, to more definitively determine the impact of Shanghai’s industrial activities on groundwater, we used irrigation cropland and industrial land for comparative analysis.
Health risk assessment usually uses the risk model recommended by the United States Environmental Protection Agency (US EPA) to analyze the harm level to human health caused by external factors [18,19,20], but this ignores the spatial distribution characteristics of health risk. On the other hand, spatial interpolation is an effective method for determining high-risk areas [21,22,23,24]. However, research on the application of this combined method remains relatively limited, with no research available on the application of this combined method to groundwater in Shanghai. Therefore, combining these two methods can better investigate the relationship between the spatial characteristics of heavy metals and health risks.
Factories in the Putuo industrial area involved heavy metals in the production process, and these have gradually built up since 1980. It is located in the upper reaches of the Huangpu River, which was one of the drinking water sources in Shanghai, and has close hydraulic connections. According to China’s groundwater environmental quality standards and drinking water safety requirements, we found that As, Cr, Cd, Ni, Hg, Pb, Cu, and Zn posed a great risk to the drinking water of Shanghai residents. Long-term industrial activities may lead to serious heavy metal pollution in groundwater [25,26]. Bi et al. [27] studied the health risks of Pb in industrial soils. Zhao et al. [28] Studied the health risk of Cd in the atmosphere of Shanghai. However, in Shanghai, research on heavy metals in groundwater is still relatively limited, and there is no research on the risk of heavy metals in groundwater to human health. Therefore, to increase the public’s understanding of groundwater risk in Shanghai, we selected an industrial area in Putuo as a case study.
The main objectives of our study were: (i) explore the concentrations and spatial distributions of eight heavy metals (As, Cr, Cd, Ni, Hg, Pb, Cu, and Zn) in the groundwater of Putuo industrial areas, (ii) compare the severity of heavy metal pollution under the two land types (industrial land and irrigation cropland), (iii) identify and quantify priority control pollutants and priority control areas based on health risk assessment. The results of this study can provide a scientific basis for groundwater risk management and control in industrial areas and provide theoretical support for rational land planning.
2. Materials and Methods
2.1. Study Area
The study area is located in the Putuo District, Shanghai, China, which is on the West Bank of the Pacific Ocean at the confluence of the Yangtze River and Huangpu River. The phreatic water level in Shanghai fluctuates within the range of 0.3–1.5 m [29]. The Putuo District is 55.53 km2, the Gross Domestic Product (GDP) in 2020 was CNY 112.95 billion, and the industrial output was CNY 10.93 billion [30]. The sampling area covers approximately 4 km2 (121°21′1″—121°23′44″ E, 31°15′57″—31°17′27″ N), and the soil is mainly clay loam and light loam. The land types are mainly industrial land and irrigation land that was used for crops. The surrounding boundary is the main road. According to 2010 census data, the total population in the study area was approximately 83.5 thousand, with children accounting for 7.7% and adults accounting for 92.3%. After 30 years of industrial development, the government intends to carry out ecological transformation and convert industrial land into parkland and residential land. The specific location is shown in Figure 1.
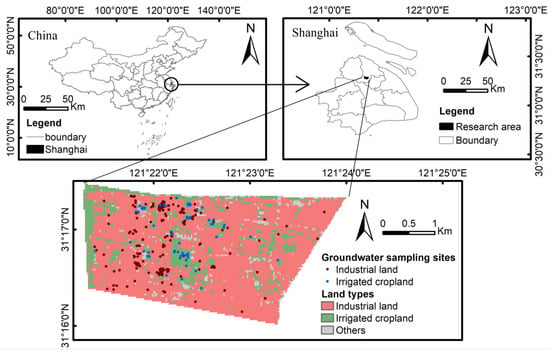
Figure 1.
Sketch map of the study site.
2.2. Sample Collection and Chemical Analysis
In this study, groundwater samples were collected in 2015. The sampling point is located in the study area. In this study, the location of groundwater sampling was determined by combining land use and hydrogeological data. A total of 125 groundwater sampling points were arranged, with a depth of 1–1.5 m, which belonged to phreatic water. During sample collection, the longitude and latitude of the sampling points were recorded by a Global Positioning System (GPS). The distribution of sampling points is shown in Figure 1. The samples were collected by an instantaneous method. The collected water samples were placed in an incubator for cold storage and transported in the dark. They were delivered to the laboratory on the same day, put in a refrigerator, and stored at 4 °C. The water samples were filtered through a vacuum filtration unit (0.45 μm, Advantech MFS Inc., Dublin, CA, USA) within 7 days, and the concentrations of eight heavy metal elements (As, Cr, Cd, Ni, Hg, Pb, Cu, and Zn) were detected using Inductively Coupled Plasma Mass Spectrometry (ICPMA-7900, Thermo Fisher, Waltham, MA, USA).
2.3. Risk Assessment Method
To comprehensively evaluate the environmental pollution in the study area, this study combines the single factor index, Nemerow index (NI) and health risk assessment model to determine the risk degree of heavy metals.
2.3.1. Single Factor Index
The single factor index method is a basic method [31] for evaluating a single pollutant in the environment. We compared irrigation and industrial land to illustrate the seriousness of industrial activities to environmental pollution. The results reflect the pollution degree of a single factor to the environment and can be used as basic data for multi-factor comprehensive evaluation. The formula is as follows:
Pi: single factor index of element i;
Ci: measured concentration of element i, mg·L−1;
Csi: environmental quality standard of element i; mg·L−1.
2.3.2. Nemerow Index (NI)
Since the single factor index cannot reflect the overall environmental quality, it is necessary to conduct a comprehensive quality evaluation at the same time. The Nemerow index is a comprehensive evaluation index based on single factor index, so it can reflect the overall environmental quality situation [32]. It considers the average and maximum of the single factor index, highlights the role of severe pollution factors, and can evaluate the pollution level more accurately. The formula is as follows:
NI: Nemerow index;
Pavg: average of single factor index;
Pmax: maximum of single factor index.
The evaluation criteria of the single factor index and Nemerow index are shown in Table 1.

Table 1.
Evaluation standard of single factor index and NI.
2.3.3. Health Risk Assessment
In order to determine the degree of risk to human health of eight heavy metals (As, Cd, Cr, Ni, Hg, Pb, Cu and Zn) in the study area, we adopted the health risk assessment model recommended by the United States Environmental Protection Agency (USEPA, Washington, DC, USA). The non-carcinogenic risks and carcinogenic risks of adults and children were evaluated separately. To carry out the health risk assessment, the exposure needed to be calculated firstly, which is the basis for quantitative risk analysis of toxic and harmful substances to human health [33].
Toxic and hazardous substances in the environment include carcinogens and non-carcinogens, so exposure risk assessment can also be divided into non-carcinogenic risk assessment and carcinogenic risk assessment. The eight metal elements can be divided into two categories, including the carcinogenic metal elements As, Cd, and Cr, and non-carcinogenic metal elements Ni, Hg, Pb, Cu, and Zn. However, when calculating non-carcinogenic risk, it is also necessary to consider the effects of carcinogenic metal elements.
Daily intake
There are two main risk exposure routes for heavy metals in groundwater, namely drinking water intake and skin contact. Average daily exposure is calculated according to the following formula [34]:
Since exposure characteristics of heavy metals of Chinese residents are significantly different from other countries such as the United States, the exposure parameter values have been revised by combining USEPA’s “Exposure Parameters Manual” [35] and China’s national conditions and regional characteristics [36] to determine the exposure parameters, as shown in Table 2.

Table 2.
Parameters of groundwater health risk assessment model.
Non-Carcinogenic Risk
Non-carcinogenic risks are judged by calculating the hazard quotient (HQ) and hazard index (HI). The greater the HQ and HI values, the higher the risk. The formula is as follows:
ADD: daily intake via a certain route, mg/(kg·d);
RfD: non-carcinogenic reference dose produced via a certain exposure route, mg/(kg·d);
HQ: hazard quotient;
HI: hazard index caused by different intake routes.
Carcinogenic Risk (CR)
Carcinogenic risk refers to the risk that an individual may cause cancer during his lifetime when exposed to potentially carcinogenic pollutants. To evaluate the overall carcinogenic risk of multiple chemical substances, add the carcinogenic risk values of each chemical substance to obtain the total carcinogenic risk (TCR) [37]. The formula is as follows:
ADD: daily intake via a certain route, mg/(kg·d);
SF: carcinogenic intensity coefficient, (kg·d)/mg;
CR: carcinogenic risk via a certain exposure route;
TCR: total carcinogenic risk via different intake routes.
The evaluation criteria [38] of non-carcinogenic risk and carcinogenic risk are shown in Table 3.

Table 3.
Evaluation criteria of non-carcinogenic risk and carcinogenic risk.
According to the EPA [39], the reference dose (RfD), skin permeability constant (PC), and carcinogenic intensity factor (SF) of the eight heavy metals in groundwater under the two exposure routes of drinking and skin contact are shown in Table 4.

Table 4.
Groundwater parameter values of PC, SF, and RFD.
2.4. Data Analyzing and Statistics
All statistical analyses were processed in Excel 2016 (Microsoft, Albuquerque, NM, USA). Inverse distance weight (IDW) interpolation is suitable for situations with a large number of sampling sites and even distribution [40]. Therefore, we employed IDW for spatial visualization using ArcGIS 10.7 (ESRI, Redlands, CA, USA). Monte Carlo simulation (MSC) can assess uncertainty by means of probability distribution functions [41]. We simulated 10,000 times with MSC to identify risk probability using Crystal Ball v11.0 (Oracle, Santa Clara, CA, USA).
3. Results and Discussion
3.1. Descriptive Statistics
Table 5 shows the concentration characteristics of pH and eight heavy metals in groundwater. pH varied from 4.1 to 12.3, and 86.4% of the samples met the groundwater environmental quality standards (6.5–8.5). The average value of pH was 7.9, which indicated the groundwater environment was alkalescent. The average concentrations of Cd, Cr, Ni, Pb, Cu and Zn were 0.022 ± 0.002, 0.127 ± 0.01, 0.591 ± 0.04, 0.002 ± 0.01, 0.013 ± 0.06 and 0.035 ± 0.16 mg L−1, respectively. These concentrations were lower than the environment standard (0.005 mg L−1 for Cd, 0.05 mg L−1 for Cr, 0.02 mg L−1 for Ni, 0.01 mg L−1 for Pb, 1.0 mg L−1 for Cu, 1.0 mg L−1 for Zn). The average concentrations of As and Hg were 0.014 ± 0.03 and 0.003 ± 0.03 mg L−1, respectively, which was about 14 times and 3 times higher than their environment standard (0.01 mg L−1 for As, 0.001 mg L−1 for Hg). The coefficients of variation (C.V) of eight heavy metals varied from 1.64 for Cr to 11.60 for Hg, and decreased in the following order: Hg > Cd > Pb > Zn > Cu > Ni >As > Cr. In summary, the results indicated that the average concentrations of As and Hg were 14 and 3 times the environmental standard, respectively, and the C.V of eight elements exceeded 1.5.

Table 5.
Statistical results of heavy metal concentrations.
Our findings that high pollution of As and Hg confirm the high harm of industrial development to groundwater. Our data are consistent with Karunanidhi et al. [42], who found industrial land pollution far exceeded non-industrial land. According to Stoeva et al. [43], C.V > 0.5 belonged to high variability. Therefore, all eight elements belonged to high variation. The results indicated that eight elements in industrial groundwater had been disturbed by external factors.
3.2. Spatial Distribution Pattern of Heavy Metals
Based on the results of pollution degree, we chose four elements with serious pollution as the analysis object. We found that the distribution characteristics had obvious regional differences (Figure 2). The severe contamination level of As and Pb was located in the northwest. The severe contamination level of Ni was located in the south. The pollution distribution of Hg and NI was similar, and the severe contamination levels were in the northwest and central part. In summary, the high pollution areas of different heavy metals were relatively concentrated, mainly distributed in the northwest, south, and central region.
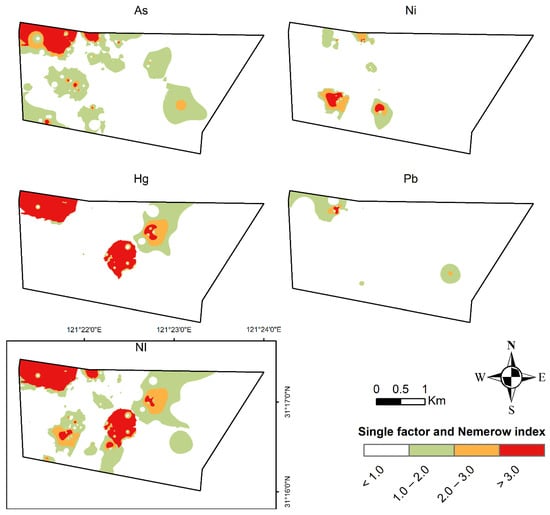
Figure 2.
Classification map of heavy metal pollution by using single factor index and Nemerow index. (Elements without contamination were not displayed).
We inferred that the pollution in the northwest was related to traffic emissions. Because the location was close to the main road, Pb was the characteristic pollutant of automobile exhaust pollution [44]. The pollutants emitted by automobile exhaust entered into the soil through atmospheric sedimentation, then entered into groundwater through infiltration through water flow, such as rain. These might be the reasons why As, Hg, and Pb exceeded the environment standard in the northwest. Compared with the land cover (Figure 1), we found that polluted areas in the south had a high overlap with irrigated cropland. Therefore, Ni pollution in the south might be caused by agricultural irrigation. This finding is consistent with Kharazi (2021), who have found that the concentration of Ni was higher in agricultural areas than non-agricultural land [45]. The land type of Hg pollution in the central region was mainly industrial land. Hg was one of the raw materials of the factory near this area. Therefore, we inferred that Hg pollution in the central region might come from industrial emissions. In accordance with the present results, previous studies have demonstrated that industrial emissions were one of the main causes of Hg pollution [46]. The environmental protection measures of the factories established in the early stage were not strict. Early industrial planning rarely considered environmental protection. The wastewater discharge system and treatment system in this industrial area were not very good. In addition, the terrain of this area was relatively flat and the water body could not flow out quickly, resulting in Hg pollution in the middle area.
3.3. Effects of Land-Use Covers on Groundwater Heavy Metals
Figure 3 illustrates the range of metal single factor index for two land covers. It is obvious that different land types led to great variations in the metal single factor index among groundwater. The index of As, Cd, Cr, Ni, Pb, and Zn under industrial land was higher than under irrigated cropland. However, the index of Hg and Cu under industrial land had a lower level than under irrigated cropland. Compared to the evaluation standard (Table 1), the average of Ni, As and Hg were above the safety limit under irrigated cropland. The contamination level of these metals belonged to slight, moderate and severe, respectively. In addition, the Cd, Ni, Pb, Hg, and As exceeded the safety limit under industrial land. Cd, Ni, and Pb belonged to slight contamination under industrial land, and also, Hg and As belonged to moderate contamination and severe contamination, respectively. It should be noted that the index of Hg and Cd was above the safety limit, but pollution points were few. In summary, irrigation cropland should focus on Ni and As, and likewise, industrial land should focus on Ni, Pb, and As.
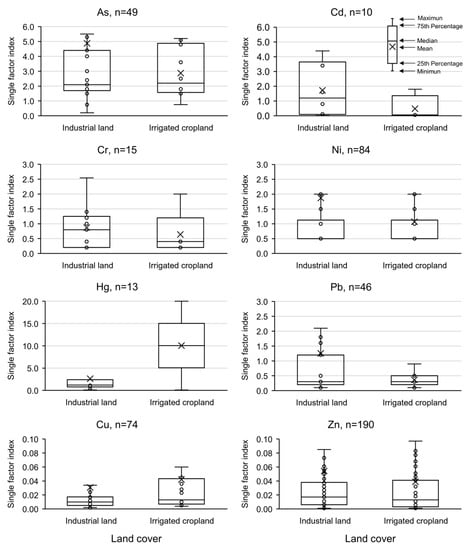
Figure 3.
The single factor index box-plot of heavy metals in two land types (industrial land and irrigated cropland), n represents the number of sampling points that exceeded the detection line.
Both industrial land and irrigation cropland had Ni and As pollution, but industrial land was more serious. A possible explanation for this might be that the amount of Ni and As used in industrial raw materials was greater than in agriculture. Our data are consistent with Tang [47], who reported industrial As and Ni concentration was higher than agriculture. Hg might come from battery and electronic industries emissions [48]. As could harm the respiratory system [49], and Ni and Hg could cause brain damage [50]. Therefore, before industrial land was converted into residential land or parkland, systematic health risk assessment was necessary.
3.4. Health Risk Assessment
3.4.1. Priority Control Pollutants
Figure 4 shows different elements’ contribution to total health risk. We found that As and Hg had the highest non-carcinogenic risk in the two groups, which accounted for 0.77 and 0.14, respectively. In addition, Cr had the highest carcinogenic risk, which accounted for 0.93 and 0.92 of the total risk in adults and children, respectively. In summary, non-carcinogenic risks should focus on As, and carcinogenic risks should focus on Cr.
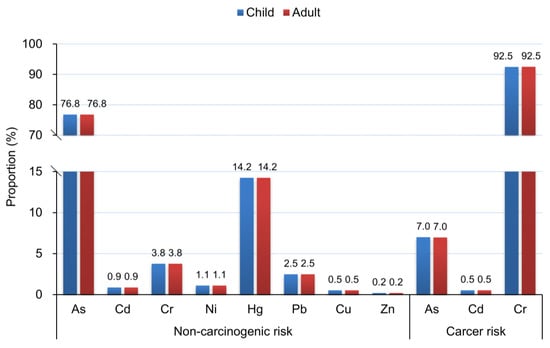
Figure 4.
Proportion of non-carcinogenic and carcinogenic risks.
Our findings that As accounted for the highest non-carcinogenic risks might be due to high As pollution (Figure 3). This finding is consistent with that of Li (2021), who found high levels of As could cause health risks [51]. It should be noted that Cr had fewer contaminated points (Figure 3), but it contributed to the main carcinogenic risk. This might be because Cr had high biological toxicity. Naseri found that lower concentration could cause health risks [52]. Therefore, if the local government could control As and Cr emissions effectively, health risks could reduce significantly.
3.4.2. Main Contamination Pathways
Figure 5 shows risk proportion under two exposure routes (drinking water and dermal exposure). We found that drinking risks were dramatically higher than dermal exposure. The proportion of drinking in non-carcinogenic risk for adults and children was 99.46% and 99.01%, respectively. The proportion of carcinogenic risk was 99.35% and 98.79%, respectively. Consequently, the result showed that drinking water was the major mode of risk exposure.
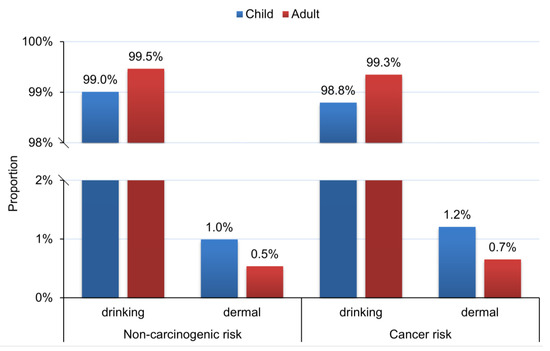
Figure 5.
Risk proportion of different risk pathways.
This result is consistent with that of Ravindra who also found that drinking was the riskiest route [53]. As the study area is located upstream of drinking water sources in Shanghai, it should be paid great attention by the government.
3.4.3. Priority Control Areas
Carcinogenic Risk
Figure 6 shows the spatial distribution difference of health risk by using inverse distance weighted interpolation. We found that significant carcinogenic risks (>10−4) occurred in the whole study area. The highest risk areas were in the northwest and middle area. On the whole, it showed regional distribution characteristics. We found that the carcinogenic risk of Cr for children and adults was higher than As and Cd. Similarly, the distribution characteristics of TCR were similar to Cr. Therefore, this result demonstrated that Cr was the major carcinogenic risk element. Adults had a higher carcinogenic risk than children. Table 6 shows the proportion of the area of each carcinogenic risk level. As accounted for 9% and 99.9% for children and adults with significant cancer risk (>10−4), respectively. Cr accounted for 100% for both children and adults with significant cancer risk (>10−4). Similarly, TCR was the same as Cr. These results indicated that the whole study area had significant carcinogenic risk. In summary, Cr is the major carcinogen element found in the high-risk area located in the northwest and middle area, and adults had a higher risk than children.
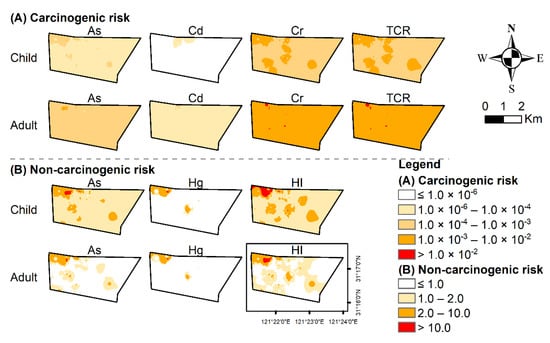
Figure 6.
Health risk distribution of heavy metals in groundwater. (A) carcinogenic risk (B) non-carcinogenic risk.

Table 6.
Area proportion of carcinogenic risk.
The findings that Cr was the major carcinogen element might be due to the wider use in industrial activities. Our findings were consistent with the results reported by Cao et al. [54]. They conducted health risks on the soils near the typical petrochemical industry in agricultural areas and found that Cr and As were priority metals for risk control. However, our finding that adults had a higher risk than children is contrary to previous studies. Belkhiri et al. found that children were more sensitive than adults to carcinogenic risk [55]. A possible explanation for this might be that we chose a longer exposure time for adults in the model parameters. This is because the land type of our study area will change from industrial land to parkland and residential land. Due to the significant carcinogenic risk in the whole area, appropriate management should be carried out before conversion to residential land to reduce the risk of cancer.
Non-Carcinogenic Risk
Based on the contribution of each element to the total risk (Figure 4), we chose As and Hg that had the highest non-carcinogenic risk as the study objects. Figure 6 illustrated that the non-carcinogenic risk of As for children was significantly higher than adults, and high-risk areas were distributed in the northwest and east. The high-risk areas of Hg were mainly concentrated in the northwest and middle, but the difference between adults and children was not obvious. The distribution of HI was similar to As. It indicated that As was the major non-carcinogenic risk element. It was notable that children had a higher non-carcinogenic risk than adults. Table 7 shows the area proportion of different non-carcinogenic risks. The significant non-carcinogenic risk areas of Hg were 7.5% and 6.3% for children and adults, respectively. However, the significant non-carcinogenic risk areas of As were 99.9% and 26.0% for children and adults, respectively. The significant non-carcinogenic risk area of HI was 99.98% and 47.7% for children and adults, respectively. The results show that children had larger areas than adults at significant non-cancer risk. In summary, As had the highest non-carcinogenic risk and presented a pattern of clustering distribution, and additionally, children were more sensitive.

Table 7.
Area proportion of non-carcinogenic risk.
The high-value area of non-carcinogenic risk was mainly distributed in the northwest, which is similar to the distribution of carcinogenic risk. This suggests that they might have common pollution sources. Abu also found a similar result [56]. Our results that children were more sensitive than adults might be that children’s various physiological organs were not fully developed and their resistance and immunity were poor, so they had low tolerance to toxic pollutants [57]. This is confirmed by the fact that children had a higher significant non-carcinogenic risk area than adults. This is consistent with previous research [58]. Therefore, children should be given special attention.
3.4.4. Cumulative Risk
Using Monte-Carlo simulation, we calculated the risk probability of two groups (child and adult) exposed to groundwater in the industrial area (Figure 7). We found that the probability of As and Hg exceeding the non-carcinogenic risk threshold (>1) was 84.4% and 83.2% for the child, respectively. The probability of As and Hg exceeding the non-carcinogenic risk threshold (>1) was 76.5% and 73.3% for adults, respectively. The possibility of non-carcinogenic risk of the other six elements was almost zero to adults and children. The risk probabilities of the hazard index for children and adults were also high, 91.2% and 86.8%, respectively. The probability of carcinogenic risk decreases in the following order: Cr > As > Cd. The probability that the total cancer risk of children and adults exceeded the risk threshold (10−4) was 96.5% and 98.6%, respectively. It should be noted that the probability of non-carcinogenic risk for children was higher than that of adults, but the probability of carcinogenic risk was lower than adults.
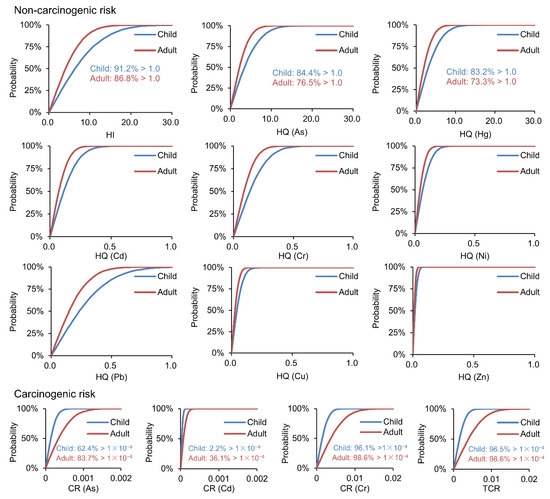
Figure 7.
Cumulative probability of non-carcinogenic and carcinogenic risks.
Non-carcinogenic probability for children was higher than adults, and drinking was the main way to affect health risks (Figure 5). Hence, we suggested that the government should pay more attention to the impact of drinking water on children’s non-carcinogenic risk. Adults had a higher carcinogenic risk possibility, so we recommend controlling the exposure time of adults to reduce the risk of cancer.
The main advantage of this research was to determine the risk hotspots distribution visually. However, our research has two main limitations. The first is that the quoted parameters were a combination of common international coefficients and previous studies, which may not be completely consistent with the reality; the second was that the study area is upstream of the drinking water source, but the actual residential drinking water was treated by the water plant, so the concentration of heavy metals may be lower than the concentration of samples, which overestimated the risk of heavy metal exposure. Although our research scope was limited to specific cases, the results suggest that the health risks in industrial areas were much higher than in agricultural land. This should arouse our sufficient attention to industrial pollution. Additional studies are needed to determine the relationship between industrial structure and health risk to reasonably plan economic development.
4. Conclusions
According to the statistical results, the mean concentrations of Cd, Cr, Ni, Pb, Cu and Zn were lower than the environmental standard, whereas those of As and Hg were about 14 and 3 times higher than the environmental standard. In two groups, As accounted for more than 75% of the non-carcinogenic risk, and Cr accounted for more than 90% of the carcinogenic risk, indicating that As was the priority control pollutant in non-carcinogenic risks, and Cr was the priority control pollutant in carcinogenic risks. The spatial distribution of health in groundwater exhibited a high risk in the northwest, indicating that the northwest belonged to the priority control area. Due to the upper reaches of drinking water sources in Shanghai, the pollution degree of groundwater in the study area is very important to the health of inhabitants. The concealment and refractory rationality of groundwater pollution mean that the remediation of the groundwater environment is a long-term process. Based on the above research results, to protect human health, some measures are necessary: (i) strengthen source control and reduce industrial wastewater discharge, (ii) As and Cr should be used as priority pollutants, especially for drinking exposure, (iii) high-risk areas should be regarded as priority areas, especially the northwest side, (iv) from the perspective of land planning, high-risk areas should be planned as non-residential land, (v) strengthen the health examination of surrounding residents to find diseases related to groundwater pollution in a timely manner. Our conclusions will benefit the government in reducing waste emissions and rationally planning land.
Author Contributions
Conceptualization, C.-Z.Y. and X.-R.W.; methodology, C.-Z.Y.; software, C.-Z.Y.; validation, C.-Z.Y. and X.-R.W.; formal analysis, C.-Z.Y.; investigation, C.-Z.Y.; resources, C.-Z.Y.; data curation, C.-Z.Y.; writing—original draft preparation, C.-Z.Y.; writing—review and editing, X.-R.W.; visualization, C.-Z.Y.; supervision, X.-R.W.; project administration, C.-Z.Y.; funding acquisition, X.-R.W. All authors have read and agreed to the published version of the manuscript.
Funding
This work was supported by the National Key Research and Development Program of China (grant numbers 2016YFC0502705) and the Key Program of the National Social Science Foundation of China (grant numbers 14ZDB140).
Institutional Review Board Statement
Not applicable.
Informed Consent Statement
Not applicable.
Data Availability Statement
The data presented in this study are available on request from the corresponding author.
Conflicts of Interest
The authors declare no conflict of interest.
References
- Han, D.; Currell, M.J. Review of drivers and threats to coastal groundwater quality in China. Sci. Total Environ. 2022, 806, 150913. [Google Scholar] [CrossRef]
- Vitali, M.; Castellani, F.; Fragassi, G.; Mascitelli, A.; Manzoli, L. Environmental status of an Italian site highly polluted by illegal dumping of industrial wastes: The situation 15 years after the judicial intervention. Sci. Total Environ. 2020, 762, 144100. [Google Scholar] [CrossRef] [PubMed]
- Liang, B.; Han, G.; Liu, M.; Li, X.; Yang, K. Spatial and Temporal Variation of Dissolved Heavy Metals in the Mun River, Northeast Thailand. Water 2019, 11, 380. [Google Scholar] [CrossRef]
- Li, Z.; Ma, Z.; Kuijp, T.J.D.; Yuan, Z.; Huang, L. A review of soil heavy metal pollution from mines in China: Pollution and health risk assessment. Sci. Total Environ. 2014, 468, 843–853. [Google Scholar] [CrossRef] [PubMed]
- Gowd, S.S.; Kotaiah, B. Groundwater pollution by Cystine manufacturing industrial effluent around the factory. Environ. Geol. 2000, 39, 679–682. [Google Scholar] [CrossRef]
- Kakar, Y.P.; Bhatnagar, N.C. Ground Water Pollution Due to Industrial Effluents in Ludhiana, India. Stud. Environ. Sci. 1981, 17, 265–272. [Google Scholar]
- Volvoikar, S.P.; Nayak, G.N. Evaluation of impact of industrial effluents on intertidal sediments of a creek. Int. J. Environ. Sci. Technol. IJEST 2013, 10, 941–954. [Google Scholar] [CrossRef][Green Version]
- Nouri, J.; Mahvi, A.H.; Jahed, G.R.; Babaei, A.A. Regional distribution pattern of groundwater heavy metals resulting from agricultural activities. Environ. Geol. 2008, 55, 1337–1343. [Google Scholar] [CrossRef]
- Medici, G.; West, L.J. Groundwater flow velocities in karst aquifers; importance of spatial observation scale and hydraulic testing for contaminant transport prediction. Environ. Sci. Pollut. Res. 2021, 28, 1–14. [Google Scholar] [CrossRef]
- Medici, G.; Baják, P.; West, L.J.; Chapman, P.J.; Banwart, S.A. DOC and nitrate fluxes from farmland; impact on a dolostone aquifer KCZ. J. Hydrol. 2021, 595, 125658. [Google Scholar] [CrossRef]
- Duan, X.; Zhang, G.; Rong, L.; Fang, H.; He, D.; Feng, D. Spatial distribution and environmental factors of catchment-scale soil heavy metal contamination in the dry-hot valley of Upper Red River in southwestern China. Catena 2015, 135, 59–69. [Google Scholar] [CrossRef]
- Xiao, X.; Zhang, J.; Wang, H.; Han, X.; Luan, H. Distribution and health risk assessment of potentially toxic elements in soils around coal industrial areas: A global meta-analysis. Sci. Total Environ. 2019, 713, 135292. [Google Scholar] [CrossRef] [PubMed]
- Chen, X.; Li, F.; Du, H.; Liu, X.; Zhang, J. Fuzzy health risk assessment and integrated management of toxic elements exposure through soil-vegetables-farmer pathway near urban industrial complexes. Sci. Total Environ. 2020, 764, 142817. [Google Scholar] [CrossRef] [PubMed]
- Antoniadis, V.; Golia, E.E.; Liu, Y.T.; Wang, S.L.; Shaheen, S.M.; Rinklebe, J. Soil and maize contamination by trace elements and associated health risk assessment in the industrial area of Volos, Greece. Environ. Int. 2019, 124, 79–88. [Google Scholar] [CrossRef]
- Beattie, R.E.; Henke, W.; Campa, M.F.; Hazen, T.C.; McAliley, L.R.; Campbell, J.H. Variation in microbial community structure correlates with heavy-metal contamination in soils decades after mining ceased. Soil Biol. Biochem. 2018, 126, 57–63. [Google Scholar] [CrossRef]
- Subhani, M.; Mustafa, I.; Alamdar, A.; Katsoyiannis, I.A.; Ali, N.; Huang, Q.; Peng, S.; Shen, H.; Eqani, S.A.M.A.S. Arsenic levels from different land-use settings in Pakistan: Bio-accumulation and estimation of potential human health risk via dust exposure. Ecotoxicol. Environ. Saf. 2015, 115, 187–194. [Google Scholar] [CrossRef]
- Huang, L.; Rad, S.; Xu, L.; Gui, L.; Chen, Z. Heavy Metals Distribution, Sources, and Ecological Risk Assessment in Huixian Wetland, South China. Water 2020, 12, 431. [Google Scholar] [CrossRef]
- Shahab, A.; Zhang, H.; Ullah, H.; Rashid, A.; Xiao, H. Pollution characteristics and toxicity of potentially toxic elements in road dust of a tourist city, Guilin, China: Ecological and health risk assessment. Environ. Pollut. 2020, 266, 115419. [Google Scholar] [CrossRef]
- Oves, M.; Khan, M.S.; Zaidi, A.; Ahmad, E. Soil contamination, nutritive value, and human health risk assessment of heavy metals: An overview. Toxic. Heavy Met. Legumes Bioremediation 2012, 1–27. [Google Scholar]
- Li, Y.; Bi, Y.; Mi, W.; Sx, D.; Li, J.A. Land-use change caused by anthropogenic activities increase fluoride and arsenic pollution in groundwater and human health risk. J. Hazard. Mater. 2021, 406, 124337. [Google Scholar] [CrossRef]
- Poggio, L.; Vrscaj, B. A GIS-based human health risk assessment for urban green space planning—An example from Grugliasco (Italy). Sci. Total Environ. 2009, 407, 5961–5970. [Google Scholar] [CrossRef] [PubMed]
- Ijumulana, J.; Ligate, F.; Bhattacharya, P.; Fm, B.; Cz, E. Spatial analysis and GIS mapping of regional hotspots and potential health risk of fluoride concentrations in groundwater of northern Tanzania. Sci. Total Environ. 2020, 735, 139584. [Google Scholar] [CrossRef] [PubMed]
- Morra, P.; Bagli, S.; Spadoni, G. The analysis of human health risk with a detailed procedure operating in a GIS environment. Environ. Int. 2006, 32, 444–454. [Google Scholar] [CrossRef] [PubMed]
- Apollaro, C.; Di Curzio, D.; Fuoco, I.; Buccianti, A.; Dinelli, E.; Vespasiano, G.; Castrignanò, A.; Rusi, S.; Barca, D.; Figoli, A.; et al. A multivariate non-parametric approach for estimating probability of exceeding the local natural background level of arsenic in the aquifers of Calabria region (Southern Italy). Sci. Total Environ. 2022, 806, 150345. [Google Scholar] [CrossRef]
- Ravindra, K.; Mor, S. Distribution and health risk assessment of arsenic and selected heavy metals in Groundwater of Chandigarh, India. Environ. Pollut. 2019, 250, 820–830. [Google Scholar] [CrossRef]
- Nouri, J.; Mahvi, A.H.; Babaei, A.A.; Jahed, G.R.; Ahmadpour, E. Investigation of heavy metals in groundwater. Pak. J. Biol. Sci. 2006, 9, 377–384. [Google Scholar] [CrossRef]
- Bi, C.; Zhou, Y.; Chen, Z.; Jia, J.; Bao, X. Heavy metals and lead isotopes in soils, road dust and leafy vegetables and health risks via vegetable consumption in the industrial areas of Shanghai, China. Sci. Total Environ. 2018, 619, 1349–1357. [Google Scholar] [CrossRef]
- Zhao, X.; Li, Z.; Tao, Y.; Wang, D.; Huang, J.; Qiao, F.; Lei, L.; Xing, Q. Distribution characteristics, source appointment, and health risk assessment of Cd exposure via household dust in six cities of China. Build. Environ. 2020, 172, 106728. [Google Scholar] [CrossRef]
- Xie, Z.F.; Shen, S.L.; Arulrajah, A.; Sh, E. Environmentally sustainable groundwater control during dewatering with barriers: A case study in Shanghai. Undergr. Space 2021, 6, 12–23. [Google Scholar] [CrossRef]
- People’s Government of Putuo District, Shanghai. Available online: http://www.shpt.gov.cn/shpt/upload/202104/0419_090624_861.pdf (accessed on 18 November 2021).
- Krzysztof, L.; Wiechula, D.; Korns, I. Metal contamination of farming soils affected by industry. Environ. Int. 2003, 30, 159–165. [Google Scholar]
- Li, X.; Feng, L. Spatial distribution of hazardous elements in urban topsoils surrounding Xi’an industrial areas, (NW, China): Controlling factors and contamination assessments. J. Hazard. Mater. 2010, 174, 662–669. [Google Scholar] [CrossRef] [PubMed]
- Environmental Protection Agency. Office of Emergency and Remedial Response. Risk Assessment Guidance for Superfund (RAGS) Part A. Saúde Pública 1989, 804, 636–640. [Google Scholar]
- Cheng, Z.; Chen, L.; Li, H.; Lin, J.; Yang, Z.; Yang, Y.; Xu, X.; Xian, J.; Shao, J.; Zhu, Z. Characteristics and health risk assessment of heavy metals exposure via household dust from urban area in Chengdu, China. Sci. Total Environ. 2017, 619, 621–629. [Google Scholar] [CrossRef]
- EPA ABD. Risk Assessment Guidance for Superfund. In Volume I: Human Health Evaluation Manual (Part E, Supplemental Guidance for Dermal Risk Assessment). EPA/540/R/99, 2004. United States Environmental Protection Agency. Available online: https://www.epa.gov/sites/default/files/2015-11/documents/OSWERdirective9285.6-03.pdf (accessed on 18 November 2021).
- Chinese Ministry of Environment. Protection Exposure Factors Handbook of Chinese Population; China Environmental Science Press: Beijing, China, 2013.
- Cao, S.; Duan, X.; Zhao, X.; Wang, B.; Ma, J.; Fan, D.; Sun, C.; He, B.; Wei, F.; Jiang, G. Health risk assessment of various metal(loid)s via multiple exposure pathways on children living near a typical lead-acid battery plant, China. Environ. Pollut. 2015, 200, 16–23. [Google Scholar] [CrossRef] [PubMed]
- Li, S.; Zhang, R. Risk assessment and seasonal variations of dissolved trace elements and heavy metals in the Upper Han River, China. J. Hazard. Mater. 2010, 181, 1051–1058. [Google Scholar] [CrossRef] [PubMed]
- Means, B. Risk-Assessment Guidance for Superfund. Volume 1. Human Health Evaluation Manual. Part A. Interim Report (Final) (No. PB-90-155581/XAB; EPA-540/1-89/002); Environmental Protection Agency: Washington, DC, USA, 1989; Office of Solid Waste and Emergency Response. [Google Scholar]
- Qian, D.; Yong, W.; Zhuang, D. Comparison of the common spatial interpolation methods used to analyze potentially toxic elements surrounding mining regions. J. Environ. Manag. 2018, 212, 23–31. [Google Scholar]
- Chen, G.; Wang, X.; Wang, R.; Liu, G. Health risk assessment of potentially harmful elements in subsidence water bodies using a Monte Carlo approach: An example from the Huainan coal mining area, China. Ecotoxicol. Environ. Saf. 2019, 171, 737–745. [Google Scholar] [CrossRef]
- Karunanidhi, D.; Aravinthasamy, P.; Subramani, T.; Kumar, D.; Venkatesan, G. Chromium contamination in groundwater and Sobol sensitivity model based human health risk evaluation from leather tanning industrial region of South India. Environ. Res. 2021, 199, 111238. [Google Scholar] [CrossRef]
- Stoeva, N.; Berova, M.; Zlatev, Z. Effect of arsenic on some physiological parameters in bean plants. Biol. Plant. 2005, 49, 293–296. [Google Scholar] [CrossRef]
- Huang, G.; Zhang, M.; Liu, C.; Li, L.; Chen, Z. Heavy metal(loid)s and organic contaminants in groundwater in the Pearl River Delta that has undergone three decades of urbanization and industrialization: Distributions, sources, and driving forces. Sci. Total Environ. 2018, 635, 913–925. [Google Scholar] [CrossRef]
- Kharazi, A.; Leili, M.; Khazaei, M.; Alikhani, M.Y.; Shokoohi, R. Human health risk assessment of heavy metals in agricultural soil and food crops in Hamadan, Iran. J. Food Compos. Anal. 2021, 100, 103890. [Google Scholar] [CrossRef]
- Bhutiani, R.; Kulkarni, D.B.; Khanna, D.R.; Gautam, A. Geochemical distribution and environmental risk assessment of heavy metals in groundwater of an industrial area and its surroundings, Haridwar, India. Energy Ecol. Environ. 2017, 2, 155–167. [Google Scholar] [CrossRef]
- Tang, X.; Shen, C.; Chen, L.; Xiao, X.; Wu, J.; Khan, M.I.; Dou, C. and Chen, Y. Inorganic and organic pollution in agricultural soil from an emerging e-waste recycling town in Taizhou area, China. J. Soils Sediments 2010, 10, 895–906. [Google Scholar] [CrossRef]
- Ren, S.; Song, C.; Ye, S.; Cheng, C.; Gao, P. The spatiotemporal variation in heavy metals in China’s farmland soil over the past 20 years: A meta-analysis. Sci. Total Environ. 2022, 806, 150322. [Google Scholar] [CrossRef] [PubMed]
- Abeer, N.; Khan, S.A.; Muhammad, S.; Rasool, A.; Ahmad, I. Health risk assessment and provenance of arsenic and heavy metal in drinking water in Islamabad, Pakistan. Environ. Technol. Innov. 2020, 20, 101171. [Google Scholar] [CrossRef]
- Nag, R.; O’Rourke, S.M.; Cummins, E. Risk factors and assessment strategies for the evaluation of human or environmental risk from metal(loid)s—A focus on Ireland. Sci. Total Environ. 2021, 802, 149839. [Google Scholar] [CrossRef]
- Li, Y.; Ji, L.; Mi, W.; Xie, S.; Bi, Y. Health risks from groundwater arsenic on residents in northern China coal-rich region. Sci. Total Environ. 2021, 773, 145003. [Google Scholar] [CrossRef]
- Naseri, K.; Salmani, F.; Zeinali, M.; Zeinali, T. Health risk assessment of Cd, Cr, Cu, Ni and Pb in the muscle, liver and gizzard of hen’s marketed in East of Iran. Toxicol. Rep. 2021, 8, 53–59. [Google Scholar] [CrossRef]
- Ravindra, K.; Thind, P.S.; Mor, S.; Singh, T.; Mor, S. Evaluation of groundwater contamination in Chandigarh: Source identification and health risk assessment. Environ. Pollut. 2019, 255, 113062. [Google Scholar] [CrossRef]
- Cao, L.; Lin, C.; Gao, Y.; Sun, C.; Zhang, Z. Health risk assessment of trace elements exposure through the soil-plant (maize)-human contamination pathway near a petrochemical industry complex, Northeast China. Environ. Pollut. 2020, 263, 114414. [Google Scholar] [CrossRef]
- Belkhiri, L.; Mouni, L.; Narany, T.S.; Tiri, A. Evaluation of potential health risk of heavy metals in groundwater using the integration of indicator kriging and multivariate statistical methods. Groundw. Sustain. Dev. 2017, 4, 12–22. [Google Scholar] [CrossRef]
- Islam, A.R.M.T.; Bodrud-Doza, M.; Rahman, M.S.; Amin, S.B.; Chu, R.; Al Mamun, H. Sources of trace elements identification in drinking water of Rangpur district, Bangladesh and their potential health risk following multivariate techniques and Monte-Carlo simulation. Groundw. Sustain. Dev. 2019, 9, 100275. [Google Scholar]
- Xu, Z.; Li, J.; Pan, Y.; Chai, X. Human health risk assessment of heavy metals in a replaced urban industrial area of Qingdao, China. Environ. Monit. Assess. 2016, 188, 229. [Google Scholar] [CrossRef] [PubMed]
- Sharma, S.; Nagpal, A.K.; Kaur, I. Appraisal of heavy metal contents in groundwater and associated health hazards posed to human population of Ropar wetland, Punjab, India and its environs. Chemosphere 2019, 227, 179–190. [Google Scholar] [CrossRef]
Publisher’s Note: MDPI stays neutral with regard to jurisdictional claims in published maps and institutional affiliations. |
© 2022 by the authors. Licensee MDPI, Basel, Switzerland. This article is an open access article distributed under the terms and conditions of the Creative Commons Attribution (CC BY) license (https://creativecommons.org/licenses/by/4.0/).