Abstract
Temperature is an extremely important environmental condition in the application of microbial denitrification for nitrate removal from groundwater. Understanding the nitrate removal efficiency of groundwater and the diversity, composition, and structure of microbial communities under different temperature conditions is of great significance for effective mitigation of groundwater nitrate pollution. This study investigated the effects of temperature on denitrification at 15 °C, 25 °C, 40 °C, and 45 °C. Moreover, the characteristics of microbial community structure and diversity were analyzed by combining high-throughput sequencing and polymerase chain reaction methods in order to fully clarify the denitrification efficiency under different temperature conditions. According to laboratory batch experiments and the findings of previous research, glucose was set as the carbon source and changes in “three nitrogen” indicators of the four temperature systems were mainly tested to clarify the effectiveness of nitrate removal. The maximum removal rates of nitrate nitrogen at 15 °C, 25 °C, 40 °C, and 45 °C were 44.05%, 87.03%, 99.26%, and 92.79%, respectively. Therefore, the most efficient nitrate removal can be achieved at 40℃. The Chao abundance indexes in the denitrification systems at 15 °C, 25 °C, 40 °C, and 45 °C were 1873, 352, 466, and 640, respectively. Therefore, the highest species richness was observed at 15 °C, but there were only a few dominant bacteria species. The composition of the bacterial community and the most dominant phylum varied at different temperatures. Among them, Gammaproteobacteria in Proteobacteria phylum plays an important role in the degradation of nitrate nitrogen. The relative abundance of Gammaproteobacteria at 15 °C, 25 °C, 40 °C, and 45 °C were 25.32%, 66.56%, 72.83%, and 3.47%. Tolumonas belongs to Gammaproteobacteria. The relative abundance of Tolumonas at 15 °C, 25 °C, 40 °C, and 45 °C were 9.41%, 65.47%, 62.49%, and 0.03%, respectively. The results of this study show that different temperature conditions affect the diversity, composition, and structure of the microbial community, thereby affecting the efficiency of denitrification for nitrate removal from groundwater.
1. Introduction
Groundwater resources are vital to human beings. In recent years, however, groundwater has been seriously polluted by nitrates, which pose serious threats to human health. Nitrate in groundwater is easily converted into nitrite in the human body, and its toxicity is far greater than that of nitrate. Nitrite oxidizes Fe2+ of hemoglobin to Fe3+ and forms methemoglobin that does not have the ability to transport oxygen, leading to methemoglobinemia. Moreover, long-term human consumption of groundwater with excessive nitrates can cause various diseases and even cancer [1,2,3]. Therefore, effective mitigation of groundwater nitrate pollution is an important issue requiring immediate attention. At present, three main types of methods are generally applied to remove nitrate from groundwater, namely physical, chemical, and biological methods. However, physical and chemical methods have the disadvantage of secondary pollution. Therefore, microbial denitrification is more favorable for nitrate degradation.
There are many factors that are vital to the denitrification, such as oxygen utilization, organic carbon supply, and temperature [4,5,6,7]. In particular, temperature is an important environmental factor affecting the growth and reproduction of microorganisms, thereby affecting the process of denitrification. Temperature also affects the activity of enzymes, and the catalytic effect of enzymes is greatly affected by temperature and increases with increasing temperature. However, the activity of enzymes is inhibited when the optimum temperature is exceeded. Lina Feng et al. [8] found that temperature affects the growth state of microorganisms such as Ulva prolifera and that the structure of enzymes is destroyed and their activity inhibited at excessively high temperatures. Saleema Saleh-Lakha et al. [9] found that temperature does not inhibit the transcription of denitrification genes but has different effects on the expression of denitrification genes, and temperature has a significant effect on enzyme activity. Temperature is also the most important factor affecting the growth and reproduction of microorganisms [10,11]. Studies have found that Paracoccus fluorescens and Pseudomonas fluorescens can be used as denitrifying bacteria to remove NO3−-N from groundwater, and the denitrification rate is the highest at 15 °C, while the accumulation of nitrite is low [12]. Runhua Liao et al. [13] studied the use of expanded granular sludge beds for denitrification and found that the minimum and maximum temperatures for effective denitrification are 15 °C and 35 °C, respectively, and that temperature affects changes in microbial community structure and diversity. In aerobic biological treatment of wastewater, temperature is also critical to the succession of microbial communities [14].
On the whole, temperature is an important factor determining nitrogen removal [15]. Under relatively stable groundwater ambient temperature, it is difficult to observe the temperature dependence of denitrification rate. Saunders and Kalff [16] and Grischek et al. [17] observed this dependence in the sediments of lakes and rivers, respectively. Saunders and Kalff [16] observed that the denitrification rate increases by 10 times with every 5 °C increase.
Denitrification usually takes place between 2 °C and 50 °C or even higher, within which bacteria have adapted to a certain special environment, but it is the most effective between 25 °C and 35 °C [18]. However, investigations on the effects of temperature on denitrification are mostly concentrated in soil studies [19,20,21]. Moreover, only a few studies have investigated denitrification at 15 °C or lower [22]. Therefore, in order to study the effect of temperature on denitrification, this study explored denitrification at 15 °C, 25 °C, 40 °C, and 45 °C and analyzed the microbial community structure and diversity during denitrification using high-throughput sequencing at the four temperatures. The findings can provide technical support and realistic theoretical basis for the nitrate removal from groundwater.
2. Materials and Methods
2.1. Samples
A vegetable planting area in Qingdao, Shandong Province, was taken as the study area (120.31963° E, 36.71565° N). For the experiments, groundwater samples were collected. Before sampling, polyethylene bottles were washed twice with deionized water and then washed twice with on-site water samples. Next, water samples were collected and repacked, sealed with parafilm, transported to the laboratory at 4 °C, and then treated for culture.
The sludge rich in denitrifying bacteria in the aeration tank of a sewage treatment plant (120.21454° E, 35.94553° N) was collected as bacterial inoculum. The collected sludge was stored in polyethylene bottles and transported to the laboratory for treatment within 24 h under normal temperature.
2.2. Concentration and Cultivation of Sludge
A preconfigured synthetic nutrient solution was used as the carbon source to enrich and select denitrifying bacteria under anaerobic conditions. The nutrient solution consisted of deionized water, KNO3 (0.37 g/L), C6H12O6 (0.1562 g/L), CH3OH (320 µL/L), and KH2PO4 (0.044 g/L).
The sludge sample was allowed to remain undisturbed and the supernatant was extracted. Precipitated sludge was collected and stored in a conical flask with a capacity of 1 L. In each flask, 700 mL sludge and 350 mL synthetic nutrient solution were added. Subsequently, high-purity nitrogen was blown into the flasks for 5 min and they were sealed with plastic wrap and parafilm to maintain an anaerobic environment. The sludge was cultured at 25 °C for 8 days. The nutrient solution was replaced every 48 h, and the above aeration and sealing operations were repeated.
The sludge after enrichment and culture was precipitated for 24 h, the supernatant was removed, and the precipitated part in each conical flask was evenly mixed as inoculated bacteria.
2.3. Experimental Design
To study the effect of temperature on denitrification, four culture temperatures were designed in this study, namely 15 °C, 25 °C, 40 °C, and 45 °C. The sludge after enrichment culture was artificially added as denitrifying bacteria. The nutrient solution with analytical pure glucose as the only carbon source was used to stimulate bacterial growth at a concentration of 2 g/L and cultured under anaerobic conditions. Each time, 160 mL of water sample was added to the carbon source and placed in a 200 mL serum bottle. The enriched cultured sludge (24 mL) was inoculated in water. High-purity nitrogen was blown on the enriched cultured sludge for 4.8 min, and the bottle cap was sealed with parafilm to create anaerobic conditions.
Serum bottles containing water samples were incubated at four set temperatures. Water samples were collected every 24 h to determine various indicators. The control consists of three parallel samples.
2.4. Index Measurement and Biological Sample Collection
The main indexes considered in this experiment were nitrate nitrogen (NO3−-N), nitrite nitrogen (NO2−-N), ammonia nitrogen (NH4+-N), pH, oxidation-reduction potential (ORP), and dissolved oxygen (DO). pH, ORP, and DO were directly measured using a portable water quality monitor (HACH HQ40d, USA) from the extracted supernatant of cultured water samples. The supernatant of the cultured water sample was filtered through a 0.45 μm polyethersulfone (PES) filter membrane. The concentrations of nitrate nitrogen (NO3−-N), nitrite nitrogen (NO2−-N), and ammonia nitrogen (NH4+-N) in the filtered water sample were measured via ultraviolet spectrophotometry, N-(1-naphthyl)-ethylenediamine spectrophotometry, and Nessler’s reagent spectrophotometry, respectively, using an ultraviolet spectrophotometer (UV-2802, UNIC, Shanghai, China). All test methods were carried out according to national standard methods [23].
After filtering the water sample on day 1, 12 biofiltration membranes were collected and transferred to a 10 mL sterile centrifuge tube immediately. Subsequently, the PES membranes were sent to Majorbio Bio-Pharm Technology Co., Ltd. (Shanghai, China) on Drikold for DNA extraction, PCR amplification, and high-throughput sequencing.
2.5. DNA Extraction and PCR Amplification
The primers tested in this study were 16sRNA to investigate the overall bacterial level. According to the manufacturer’s instructions, the PES membranes in the sterile centrifuge tube were stored at −80 °C until DNA extraction. The FastDNA spin kit for soil (Bio101 Inc., Melbourne, Australia) was used to extract microbial DNA from the PES membrane samples. The NanoDrop2000 UV-vis spectrophotometer (ThermoScientific, Wilmington, NC, USA) was used to detect the concentration and purity of DNA. The quality of the extracted DNA was checked by 1% agarose gel electrophoresis. The V3-V4 hypervariable regions of the bacterial 16S rRNA gene were amplified by specific primers with barcode. Among them, the upstream primer is 338F (5′-ACTCCTACGGGAGGCAGCAG-3′) and the downstream primer is 806R (5′-GGACTACHVGGGTWTCTAAT-3′).
The PCR amplification parameters are set as follows: pre-denaturation 95 °C, 3 min; 27 cycles (30 s at 95 °C), and a final extension for 10 min at 72 °C. The experiments of PCR were performed in triplicate with 20 μL mixtures containing 4 μL 5 × FastPfu Buffer, 2 μL 2.5 mM dNTPs, 0.8 μL each primer (5 μM), 0.4 μL FastPfu Polymerase, and 10 ng template DNA.
2.6. Illumina MiSeq Sequencing and Data Processing
PCR products were recovered by 2% agarose gel, further purified by the AxyPrep DNA Gel Extraction Kit (Axygen Biosciences, Union City, CA, USA), eluted by Tris-HCl, and detected by 2% agarose electrophoresis. The preliminary quantitative results were obtained from the QuantiFluorTM-ST blue fluorescence quantitative system (Promega, Madison, WI, USA). Subsequently, the Illumina MiSeq PE300 platform (Majorbio Bio-Pharm Technology Co., Ltd., Shanghai, China) was used for pairing and sequencing.
The original sequence obtained by sequencing was controlled and spliced in the fastp and FLASH software. At the same time, the quality of reads and the effect of merge were filtered by quality control, the effective sequence was obtained according to primer sequences and the barcode at the beginning and end of the sequence, and the direction of the sequence was corrected. In this manner, optimized data were acquired.
Using UPARSE software, all optimized sequences were clustered by operational taxon (operational taxonomic units, OTU) at 97% similarity level, and single sequence and chimera were removed in the process. All the optimized sequences were classified and annotated by the RDP classifier software and compared against the SILVA database, with the threshold set at 70%.
Based on OTU data, the Alpha diversity index (including Richness, Diversity, Evenness and Coverage index) was calculated. With the help of Origin software (version 3.4.1), the histograms of bacterial community composition at different taxonomy levels were plotted.
3. Results and Discussion
3.1. NO3−-N, NO2−-N, NH4+-N and Groundwater Environmental Indicators
Figure 1 presents a graph of concentration changes in NO3−-N versus time at different temperatures. The figure shows distinct differences in the degradation efficiency of NO3−-N at different temperatures. Among them, the most effective nitrate nitrogen degradation was observed at 40 °C. After 24 h of the experiment, the NO3−-N concentration reduced from the initial 300.7 mg/L to 3.42 mg/L, accounting for a removal rate of 99.26%. The removal rates of NO3−-N in the denitrification systems at 45 °C, 25 °C, and 15 °C were 92.79%, 87.03%, and 44.05%, respectively. Therefore, temperature affects the removal of NO3−-N in groundwater. This is because denitrifying bacteria are affected by temperature during the denitrification process, which indirectly affects the removal of NO3−-N. Previous studies [24] have shown that the activity of denitrifying bacteria weakens under low temperature conditions, and there is an optimum temperature for denitrification. In this study, the optimum temperature is 40 °C, at which the removal rate of NO3−-N in groundwater is the highest.
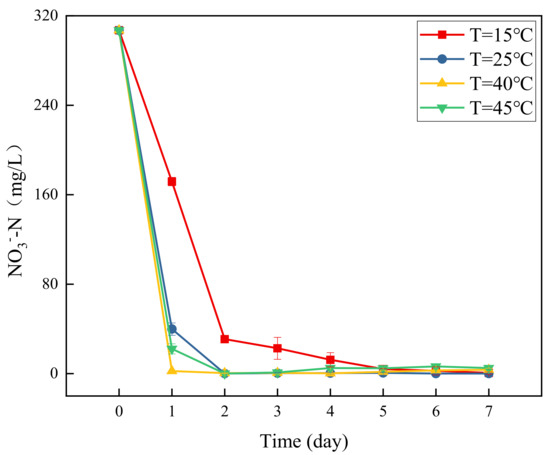
Figure 1.
Changes in NO3−-N concentration over time at different temperatures.
Nitrite accumulation not only poses serious threats to human health but also has a toxic effect on denitrifying bacteria, inhibiting the denitrification process. Figure 2 presents a graph of changes in NO2−-N concentration with time at different temperatures. At 40 °C, the concentration of NO2−-N in the system is basically maintained at approximately 0 mg/L, without the accumulation of nitrite nitrogen. On the contrary, at 15 °C, 30 °C, and 45 °C, NO2−-N concentration showed a trend of initial increase and subsequent decline, and it prominently accumulated at the beginning of the test. As the test progressed, the NO2−-N concentration showed a sharp decline, and it dropped below 1 mg/L by the third day. The accumulation of nitrite nitrogen can be attributed to various causes, such as temperature, pH value, carbon source type, and carbon to nitrogen ratio [5,25,26]. Studies have shown that the presence of nitrate nitrogen inhibits the degradation of nitrite nitrogen [27]. Combined with the graph of changes in NO3−-N concentration (Figure 1), the removal efficiency of nitrate nitrogen appears to be the highest at 40 °C, which is in line with the conclusion that there is no accumulation of nitrite nitrogen.
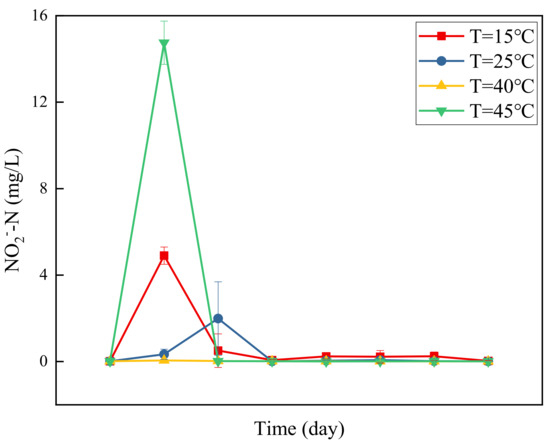
Figure 2.
Changes in NO2−-N concentration over time at different temperatures.
Figure 3 presents a graph of concentration changes in NH4+-N versus time at different temperatures. It can be seen that NH4+-N accumulated to varying degrees at the four temperatures. The accumulation of NH4+-N reached the maximum at 15 °C on the 7th day, which was 3.92 mg/L. At 25 °C, the accumulation of NH4+-N reached the maximum on the 4th day, which was 4 mg/L. Then it decreased with a small amount of accumulation on the 7th day. At 40 °C, the accumulation of NH4+-N reached the maximum on the first day, which was 2.935 mg/L. After that it decreased with a small amount of accumulation on the 7th day. At 45 °C, the accumulation of NH4+-N was lower than that at the other three temperatures, reaching a maximum on the 3rd day, which was 2.636 mg/L. After that it decreased with a small amount of accumulation on the 7th day. The accumulation of NH4+-N could be mainly attributed to the dissimilation and reduction of nitrate to ammonia (DNRA) [28]. DNRA is an anaerobic reduction reaction, through which nitrate can be converted to ammonium under denitrification conditions [29,30]. Some studies have shown that the decomposition and fermentation of proteins in carbon sources will also lead to the accumulation of ammonia under denitrifying conditions [31]. The nature of NH4+-N is unstable, and NH4+-N decreased during the experiment, which may be caused by ammonia oxidation. Ammonia oxidizing bacteria can coexist with anaerobic heterotrophic bacteria and oxidize NH4+-N [32].
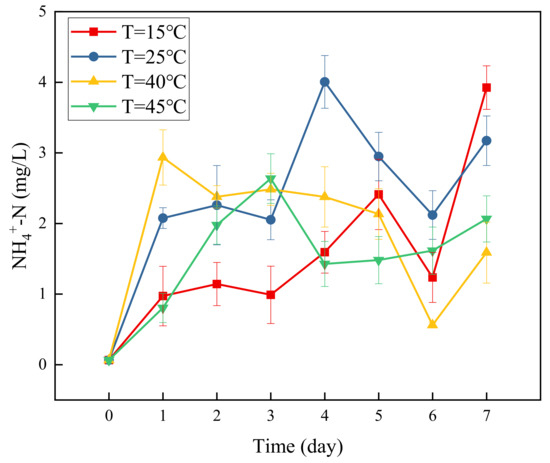
Figure 3.
Changes in NH4+-N concentration over time at different temperatures.
Figure 4 presents a graph of changes in pH over time at different temperatures. Under the 4 temperature conditions, pH showed basically the same change trends of initial decline followed by a slow increase. At 15 °C, pH decreased slowly, and dropped to the minimum value of 5.62 on the third day, after which it slowly increased, and the water sample remained in a weakly acidic state. At 40 °C, the pH changed rapidly and dropped to the minimum value of 6.02 on the first day of the experiment, after which it slowly increased, and the water sample remained in a weakly acidic state. At 25 °C and 45 °C, the pH changes were basically the same, and dropped to the minimum of 5.47 and 5.29, respectively, on the first day, and then gradually increased as the experiment progressed, and the water sample remained in a weakly acidic environment. At the beginning of the experiment, the water samples at the four temperatures changed rapidly from the original weak alkaline state to weak acidic state. This may be attributable to the selection of glucose as the carbon source, which needs to be converted into volatile organic compounds such as pyruvate to before it can be used by denitrifying bacteria [33]. The biochemical reaction is strong and produces organic acids. As the experiment progressed in the later period, the denitrification effect gradually became stronger, producing certain alkaline substances [34], and the pH value of the water sample increased slowly. Nevertheless, with the abundant carbon source, the water samples remained weakly acidic.
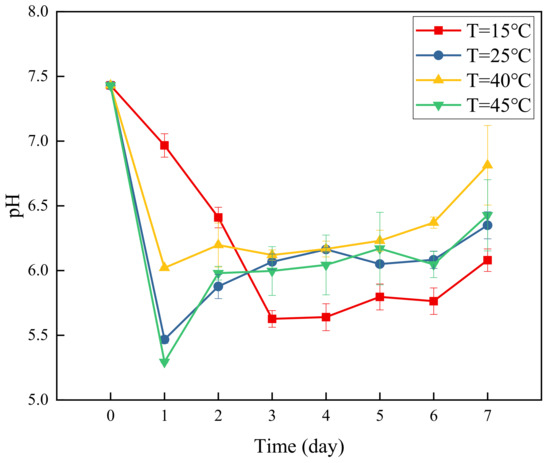
Figure 4.
Changes in pH over time at different temperatures.
Figure 5 presents a graph of ORP over time at different temperatures. During the experiment, ORP was negative under the 4 temperature conditions, and the water samples were in a reductive environment. At 15 °C, ORP dropped to −357.77 mV on the 3rd day, after which it increased slowly with the progress of the experiment and tended to stabilize. At 25 °C, ORP showed a rapid decrease and increase in the first 2 days. It dropped to a minimum of −551.17 mV on the first day and increased to −213.8 mV on the second day; with the progress of the experiment, ORP gradually decreased and tended to stabilize.
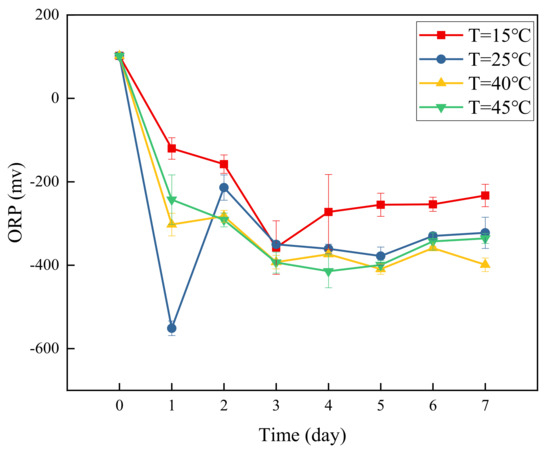
Figure 5.
Changes in ORP over time at different temperatures.
At 40 °C and 45 °C, the change trends of ORP were basically the same, gradually decreasing and then stabilizing with time. At 40 °C, ORP dropped to the minimum of −409.43 mV on the 5th day, and at 45 °C, ORP dropped to a minimum of −414.6 mV on the 4th day.
ORP can be used to characterize the relative degree of media oxidation and reduction. A positive ORP indicates that a solution shows a certain oxidizabiity, while a negative ORP indicates that the solution shows reducibility. At the four temperatures, ORP dropped rapidly from positive to negative on the first day of the experiment, indicating a reducing environment. As the experiment progressed, ORP remained negative, showing that the solution remained in a reducing environment, which is conducive to the progress of denitrification.
Figure 6 shows a graph of changes in DO concentration with time at different temperatures. As shown, the denitrification system was in an anaerobic environment at the beginning of the test. As the reaction progressed, DO was consumed by the denitrification, and its concentration became lower than 0.5 mg/L. According to a previous study, DO concentrations below 1mg/L are more conducive to the growth, reproduction, and accumulation of denitrifying bacteria [18]. Considering the change chart of the system’s NO3−-N concentration (Figure 1), NO3−-N concentration continuously declined until the end of the test. At approximately 0 mg/L, it provides favorable conditions for denitrifying bacteria to remove nitrate nitrogen in groundwater.
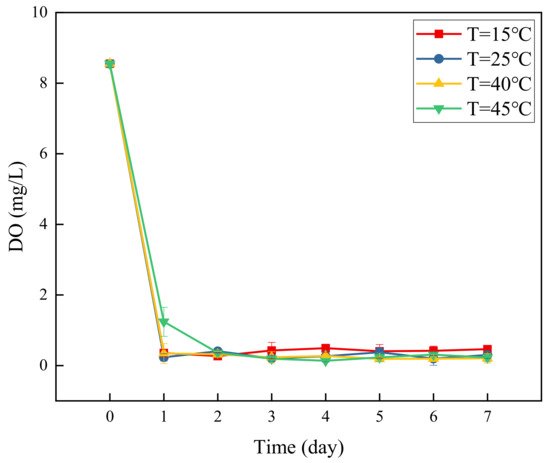
Figure 6.
DO content over time at different glucose concentrations.
3.2. Bacterial Community Diversity
In this study, twelve microbial samples were selected to characterize the bacterial community in the process of denitrification. As shown in Table 1, 577,731 high quality sequence reads of twelve samples were acquired through quality control, and they ranged from 36,726 to 59,309 in every sample. Furthermore, the average length is 420 bp. We obtained 243,028,740 bp bases in all, which ranged from 15,531,332 to 24,574,404. The sequence reads were clustered into 2055 OTUs, which were based on 97% sequence similarity. At the same time, according to the test results, the clusters corresponded to 44 phyla, 118 classes, 267 orders, 426 families, 716 genera, and 1202 species.

Table 1.
Results of sequencing statistics and alpha diversity analysis of bacterial communities during denitrification.
Alpha diversity analysis including Chao, evenness, Shannon, and coverage, which can reflect the diversity and richness of microbial communities, are shown in Table 1. The Chao index of T15, T25, T40, and T45 was 1873, 352, 466, and 640, respectively. Compared with the suitable temperature of groundwater (T15), the Chao index decreased to 81.2%, 75.1%, and 65.8% in T25, T40, and T45, respectively. These indicate lower species richness in the T25, T40, and T45 systems and the richness of the bacterial community showed an upward trend during denitrification in the three systems. The Shannon index was 5.64, 1.56, 2.09, and 2.52 for T15, T25, T40, and T45, respectively (Table 1). It reflects the diversity level of microbial communities. The trend of the Shannon index is similar to that of the Chao index, and it indicated that T15 exhibits the highest species diversity. The evenness index reflects species uniformity of microbial communities. In this study, the evenness index was 0.76, 0.32, 0.37, and 0.44 for T15, T25, T40, and T45, respectively. This indicated that the change in bacterial diversity and evenness was not distinct and the species uniformity was moderate.
3.3. Bacterial Community Composition
Figure 7 shows the composition of the bacterial community at the phylum level, after the same inoculum was cultured at the selected temperature for only 24 h. The most dominant phylum varied with different temperatures. In the total bacterial community at 15 °C the most dominant phylum was Proteobacteria, whose relative abundance was 31.89%. This was followed by Chloroflexi, Actinobacteriota, Bacteroidota, Patescibacteria, Acidobacteriota, and Firmicutes, whose relative abundances were 16.13%, 14.68%, 11.92%, 5.84%, 4.94%, and 4.21%, respectively. The bacterial community compositions at 25 °C and 40 °C were similar. In the total bacterial community, at 25 °C and 40 °C the most dominant phylum was also Proteobacteria, whose relative abundances were 66.59% and 72.86%. This was followed by Firmicutes, which accounted for 31.77% and 25.62%, respectively. At 45 °C, the most dominant phylum was Firmicutes in the total bacterial community, whose relative abundance was 95.45%, followed by Proteobacteria, which accounted for 3.5%. The percentages of all other phyla were <1%. The results showed that Proteobacteria was the most dominant phylum at 15 °C, 25 °C, and 40 °C. Firmicutes was the most dominant phylum at 45 °C. The bacterial community composition and the most dominant phylum changed with different culture temperatures. Some studies [35,36] have shown that Proteobacteria occupied a large proportion in activated sludge, which is suitable for nitrogen removal. According to changes in the water quality index, Proteobacteria could promote denitrification differently at different temperatures. The relative abundance of Proteobacteria increased with increasing temperature in the range of 15–40 °C. Furthermore, the greater the relative abundance of Proteobacteria, the better the denitrification effect.
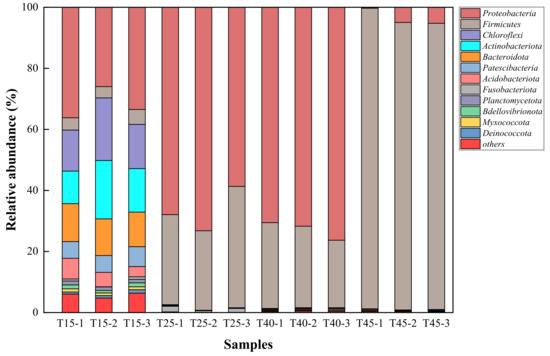
Figure 7.
Relative abundance of dominant bacterial phyla in four temperatures Phyla with a relative abundance of <1% are listed as “others.” T15, T25, T40, and T45 are shortened names for samples that were cultured at 15 °C, 25 °C, 30 °C and 45 °C, respectively. T15-1, T15-2, and T15-3 are three parallel samples, and three parallel samples were prepared for each temperature.
As shown in Figure 8, we studied the differences at the class and genus levels after the same inoculum was cultured at the selected temperature for only 24 h for further detailed analysis of the bacterial community composition.

Figure 8.
Relative abundance of dominant bacterial (a) class and (b) genus in the four temperatures. Classes with a relative abundance of <1% are listed as “others.” Genera with a relative abundance of <2% are listed as “others.” T15, T25, T40, and T45 are shortened names for samples cultured at 15 °C, 25 °C, 30 °C, and 45 °C, respectively. T15-1, T15-2, and T15-3 are three parallel samples, and three parallel samples were prepared for each temperature.
Figure 8a shows that at the class level, the dominance and the relative abundance of bacterial communities vary with temperature. Proteobacteria as the most abundant was subdivided into two classes at 15 °C, 25 °C, and 40 °C, identified as Gammaproteobacteria, followed by Alphaproteobacteria. The relative abundance of Gammaproteobacteria was the highest at 40 °C, the second highest was at 25 °C, and the smallest at 15 °C, which were 72.83%, 66.56%, and 25.32%, respectively. The relative abundance of Alphaproteobacteria at 15 °C, 25 °C, and 40 °C were 6.56%, 0.03%, and 0.02% At 45 °C, the most abundant Firmicutes was subdivided into two classes, identified as Bacilli, followed by Clostridia. The relative abundance of Bacilli was the highest, which was 71.95%. This was followed by Clostridia and Gammaproteobacteria, which account for 23.45% and 3.47%. Gammaproteobacteria was the most dominant class at 15 °C, 25 °C, and 40 °C. Bacilli was the most dominant class at 45 °C. Related studies have shown that Alphaproteobacteria and Gammaproteobacteria in Proteobacteria phylum contain a large number of denitrifying bacterias [37]. The Gammaproteobacteria can effectively degrade nitrate nitrogen [38] (Dou 2011). In this study, the environment of 40 °C is more favorable for the growth of Gammaproteobacteria. Combined with the change of nitrate nitrogen content, the denitrification efficiency is the highest at 40 °C.
As shown in Figure 8b, the most dominant at 15 °C was Tolumonas at the genus level, whose relative abundance was 9.41%. Followed by Microtrichales, Caldilineaceae, Saccharimonadales, JG30-KF-CM45, Saprospiraceae, and Dechloromonas, with relative abundances of 6.19%, 5.42%, 3.71%, 3.67%, 3.36%, and 3.07%, respectively. With the increase of temperature, the advantages of Tolumonas at 25 °C and 40 °C were more significant, whose relative abundances were 65.47% and 62.49%. Similarly, the relative abundances of Clostridium_sensu_stricto_1 also increased, which were 31.56% and 12.59% at 25 °C and 40 °C, respectively. At the genus level, the most dominant genus at 45 °C was Bacillus, whose relative abundance was 30.76%. This was followed by Enterococcus, Streptococcus, Clostridium_sensu_stricto_5, Clostridium_sensu_stricto_3, Anoxybacillus, Clostridium_sensu_stricto_1, and Brevibacillus, with relative abundances of 18.21%, 11.00%, 9.94%, 4.91%, 4.54%, 3.69%, and 3.01%, respectively. Tolumonas was the most dominant genus at 15 °C, 25 °C, and 40 °C. Bacillus was the most dominant genus at 45 °C. Tolumonas belongs to Gammaproteobacteria and Proteobacteria phylum, which plays an important role in nitrogen removal [39]. These results indicated that excessively high or low temperatures could change the composition of the microbial community. On the whole, temperature has a significant effect on denitrification. The environment of 40 °C is more favorable for denitrification.
4. Conclusions
This study investigated the influence of different temperature conditions on the removal rate of nitrate in groundwater and the change of microbial community through laboratory experiments. The results show that the removal of nitrate in groundwater is related to temperature. Four temperature conditions were explored (15 °C, 25 °C, 40 °C, and 45 °C), and the nitrate removal efficiency was found to be the highest at 40 °C, reaching a removal rate of 99.26%, which is higher than those at 15 °C, 25 °C, and 45 °C by 55.62%, 12.32%, and 6.52%, respectively. At the same time, the results of bacterial community sequencing and α diversity analysis showed that the diversity of the microbial community was richer in the 15 °C system. Nevertheless, the diversity of the microbial community in the 25 °C, 40 °C, and 45 °C systems increased with the progress of the experiments. This shows that the composition of bacterial community varies with temperature, and the dominant strain for denitrification was Proteobacteria, the relative abundance of which increased with increasing temperature in the range of 15–40 °C. The results show that the suitable temperature for Proteobacteria is 40 °C, which can promote denitrification better. In summary, the optimal temperature conditions for nitrate removal from groundwater via microbial denitrification and the characteristics of bacterial communities in different temperature systems could be determined in this study. The results can provide appropriate theoretical guidance for controlling groundwater nitrate pollution.
Author Contributions
Conceptualization, W.Q. and Z.G.; methodology, W.Q., L.X. and Z.G.; software, Y.Z.; validation, W.Q., L.S. and Z.G.; formal analysis, L.X.; investigation, R.L., M.L., Y.Z., L.X. and Z.G.; resources, Y.F.; data curation, Q.Z.; writing—original draft preparation, W.Q., R.L. and M.L.; writing—review and editing, W.Q., L.S., R.L. and M.L.; visualization, Y.Z.; supervision, Z.G. and L.X.; project administration, W.Q. and L.S.; funding acquisition, W.Q. and L.S. All authors have read and agreed to the published version of the manuscript.
Funding
This research was funded by the Scientific Research Fund of Qingdao Geo-Engineering Surveying Institute, grant number No.2019-QDDZYKY01.
Data Availability Statement
No data availability statement.
Acknowledgments
This research was supported by the Scientific Research Fund of Qingdao Geo-Engineering Surveying Institute (No.2019-QDDZYKY01). Sincere gratitude is expressed to the reviewers for their many helpful and constructive comments.
Conflicts of Interest
The authors declare no conflict of interest.
References
- Ogilvie, B.G.; Rutter, M.; Nedwell, D.B. Selection by temperature of nitrate-reducing bacteria from estuarine sediments: Species composition and competition for nitrate. FEMS Microbiol. Ecol. 1997, 23, 11–22. [Google Scholar] [CrossRef]
- Ratkowsky, D.A.; Olley, J.; Mcmeekin, T.A.; Ball, A. Relationship between temperature and growth rate of bacterial cultures. J. Bacyeriology 1982, 149, 1–5. [Google Scholar] [CrossRef] [PubMed] [Green Version]
- Saunders, D.L.; Kalff, J. Denitrification rates in the sediments of Lake Memphremagog, Canada–USA. Water Res. 2001, 35, 1897–1904. [Google Scholar] [CrossRef]
- Dodla, S.K.; Wang, J.J.; DeLaune, R.D.; Cook, R.L. Denitrification potential and its relation to organic carbon quality in three coastal wetland soils. Sci. Total Environ. 2008, 407, 471–480. [Google Scholar] [CrossRef]
- Dou, N.S.; Wang, L. Bacteria diversity in a biostyr biological aerated filter of municipal wastewater by 16S rDNA. Acta Sci. Circumstantiae 2011, 31, 2117–2124. [Google Scholar]
- Eaton, A.D.; Clesceri, L.S.; Greenberg, A.E.; Franson, M.A.H. Standard Methods for the Examination of Water and Waste Water. J. Public Health 1966, 56, 387–388. [Google Scholar]
- Fewtrell, L. Drinking-water nitrate, methemoglobinemia, and global burden of disease: A discussion. Environ. Health Perspect. 2004, 112, 1371–1374. [Google Scholar] [CrossRef] [Green Version]
- Ge, S.; Peng, Y.; Wang, S.; Lu, C.; Cao, X.; Zhu, Y. Nitrite accumulation under constant temperature in anoxic denitrification process: The effects of carbon sources and COD/NO(3)-N. Bioresour. Technol. 2013, 114, 137–143. [Google Scholar] [CrossRef]
- Hien, T.T.; Park, H.; Jo, H.Y.; Yun, S.; Minh, N.T. Influence of different substrates in wetland soils on denitrification. Water Air Soil Pollut. 2010, 215, 549–560. [Google Scholar] [CrossRef]
- Nguyen, H.T.T.; Le, V.Q.; Hansen, A.A.; Nielsen, J.L.; Nielsen, P.H. High diversity and abundance of putative polyphosphate-accumulating Tetrasphaera-related bacteria in activated sludge systems. FEMS Microbiol. Ecol. 2011, 76, 256–267. [Google Scholar] [CrossRef] [Green Version]
- Hoover, N.L.; Bhandari, A.; Soupir, M.L.; Moorman, T.B. Woodchip Denitrification Bioreactors: Impact of Temperature and Hydraulic Retention Time on Nitrate Removal. J. Environ. Qual. 2016, 45, 803–812. [Google Scholar] [CrossRef] [PubMed] [Green Version]
- Hunter, W.J. Accumulation of nitrite in denitrifying barriers when phosphate is limiting. J. Contam. Hydrol. 2003, 66, 79–91. [Google Scholar] [CrossRef]
- Ibarbalz, F.M.; Figuerola, E.L.; Erijman, L. Industrial activated sludge exhibit unique bacterial community composition at high taxonomic ranks. Water Res. 2013, 47, 3854–3864. [Google Scholar] [CrossRef]
- Jang, J.; Anderson, E.L.; Venterea, R.T.; Sadowsky, M.J.; Rosen, C.J.; Feyereisen, G.W.; Ishii, S. Denitrifying Bacteria Active in Woodchip Bioreactors at Low-Temperature Conditions. Front. Microbiol. 2019, 10, 635. [Google Scholar] [CrossRef] [PubMed]
- Lai, T.V.; Ryder, M.H.; Rathjen, J.R.; Bolan, N.S.; Croxford, A.E.; Denton, M.D. Dissimilatory nitrate reduction to ammonium increased with rising temperature. Biol. Fertil. Soils 2021, 57, 363–372. [Google Scholar] [CrossRef]
- Lee, H.W.; Park, Y.K.; Choi, E.S.; Lee, J.W. Bacterial community and biological nitrate removal: Comparisons of autotrophic and heterotrophic reactors for denitrification with raw sewage. J. Microbiol. Biotechnol. 2008, 18, 1826–1835. [Google Scholar] [CrossRef]
- Liao, R.; Miao, Y.; Li, J.; Li, Y.; Wang, Z.; Du, J.; Li, Y.; Li, A.; Shen, H. Temperature dependence of denitrification microbial communities and functional genes in an expanded granular sludge bed reactor treating nitrate-rich wastewater. RSC Adv. 2018, 8, 42087–42094. [Google Scholar] [CrossRef] [Green Version]
- Feng, L.; Shi, X.; Chen, Y.; Tang, H.; Wang, L. Effects of Temperature on the Nitrate Reductase Activity and Growth of Ulva prolifera. Phycol. Soc. Am. 2021, 57, 955–966. [Google Scholar] [CrossRef]
- Liu, M.; Xia, L.; Liu, R.; Gao, Z.; Han, C.; Feng, J.; Wang, J.; Qu, W.; Xing, T. Degradation of High-Concentration Nitrate Nitrogen in Groundwater: A Laboratory Study. J. Chem. 2021, 2021, 4797946. [Google Scholar] [CrossRef]
- Liu, R.; Xia, L.; Liu, M.; Gao, Z.; Feng, J.; You, H.; Qu, W.; Xing, T.; Wang, J.; Zhao, Y. Influence of the carbon source concentration on the nitrate removal rate in groundwater. Environ. Technol. 2021, volume, 1–35. [Google Scholar] [CrossRef]
- Liu, Z.; Chen, Y.; Jiang, Y. A preliminary study on removing nitrate in groundwater by using rice wine for the rural drinking water. Ground Water 2015, 37, 44–47. [Google Scholar]
- Lohumi, N.; Gosain, S.; Jain, A.; Gupta, V.K.; Verma, K.K. Determination of nitrate in environmental water samples by conversion into nitrophenols and solid phase extraction−spectrophotometry, liquid chromatography or gas chromatography–mass spectrometry. Anal. Chim. Acta 2004, 505, 231–237. [Google Scholar] [CrossRef]
- Moussavi, G.; Jafari, S.J.; Yaghmaeian, K. Enhanced biological denitrification in the cyclic rotating bed reactor with catechol as carbon source. Bioresour. Technol. 2015, 189, 266–272. [Google Scholar] [CrossRef]
- Patterson, B.M.; Grassi, M.E.; Davis, G.B.; Robertson, B.S.; McKinley, A.J. Use of polymer mats in series for sequential reactive barrier remediation of ammoniumcontaminated groundwater laboratory column evaluation. Environ. Sci. Technol. 2002, 36, 3439–3445. [Google Scholar] [CrossRef]
- Rivett, M.O.; Buss, S.R.; Morgan, P.; Smith, J.W.; Bemment, C.D. Nitrate attenuation in groundwater: A review of biogeochemical controlling processes. Water Res. 2008, 42, 4215–4232. [Google Scholar] [CrossRef]
- Robinson-Lora, M.A.; Brennan, R.A. The use of crab-shell chitin for biological denitrification: Batch and column tests. Bioresour. Technol. 2009, 100, 534–541. [Google Scholar] [CrossRef]
- Rocher, V.; Laverman, A.M.; Gasperi, J.; Azimi, S.; Guerin, S.; Mottelet, S.; Villieres, T.; Pauss, A. Nitrite accumulation during denitrification depends on the carbon quality and quantity in wastewater treatment with biofilters. Environ. Sci. Pollut. Res. 2015, 22, 10179–10188. [Google Scholar] [CrossRef]
- Saad, O.A.L.O.; Conrad, R. Adaptation to Temperature of Nitric Oxide-Producing Nitrate-Reducing Bacterial Populations in Soil. Syst. Appl. Microbiol. 1993, 16, 120–125. [Google Scholar] [CrossRef]
- Saleh-Lakha, S.; Shannon, K.E.; Henderson, S.L.; Goyer, C.; Trevors, J.T.; Zebarth, B.J.; Burton, D.L. Effect of pH and temperature on denitrification gene expression and activity in Pseudomonas mandelii. Appl. Environ. Microbiol. 2009, 75, 3903–3911. [Google Scholar] [CrossRef] [Green Version]
- Philips, S.; Laanbroek, H.J.; Verstraete, W. Origin, causes and effects of increased nitrite concentrations in aquatic environments. Rev. Environ. Sci. Biotechnol. 2002, 1, 115–141. [Google Scholar] [CrossRef]
- Stres, B.; Danevcic, T.; Pal, L.; Fuka, M.M.; Resman, L.; Leskovec, S.; Hacin, J.; Stopar, D.; Mahne, I.; Mandic-Mulec, I. Influence of temperature and soil water content on bacterial, archaeal and denitrifying microbial communities in drained fen grassland soil microcosms. FEMS Microbiol. Ecol. 2008, 66, 110–122. [Google Scholar] [CrossRef] [Green Version]
- Grischek, T.; Hiscock, K.M.; Metschies, T.; Dennis, P.F.; Nestler, W. Factors affecting denitrification during infiltration of river water into a sand and gravel aquifer in Saxony, Germany. Water Res. 1998, 32, 450–460. [Google Scholar] [CrossRef]
- LaPara, T.M.; Nakatsu, C.H.; Pantea, L.M.; Alleman, J.E. Aerobic biological treatment of a pharmaceutical wastewater: Effect of temperature on COD removal and bacterial community development. Water Res. 2001, 35, 4417–4425. [Google Scholar] [CrossRef]
- Vackova, L.; Srb, M.; Stloukal, R.; Wanner, J. Comparison of denitrification at low temperature using encapsulated Paracoccus denitrificans, Pseudomonas fluorescens and mixed culture. Bioresour. Technol. 2011, 102, 4661–4666. [Google Scholar] [CrossRef]
- Warren, E.; Bekins, B.A. Relating subsurface temperature changes to microbial activity at a crude oil-contaminated site. J. Contam. Hydrol. 2015, 182, 183–193. [Google Scholar] [CrossRef]
- Xu, X.; Xue, Y.; Wang, D.; Wang, G.; Yang, F. The development of a reverse anammox sequencing partial nitrification process for simultaneous nitrogen and COD removal from wastewater. Bioresour. Technol. 2014, 155, 427–431. [Google Scholar] [CrossRef]
- Yao, S.; Ni, J.; Ma, T.; Li, C. Heterotrophic nitrification and aerobic denitrification at low temperature by a newly isolated bacterium, Acinetobacter sp. HA2. Bioresour. Technol. 2013, 139, 80–86. [Google Scholar] [CrossRef]
- Zhang, J.; Feng, C.; Hong, S.; Hao, H.; Yang, Y. Behavior of solid carbon sources for biological denitrification in groundwater remediation. Water Sci. Technol. 2012, 65, 1696–1704. [Google Scholar] [CrossRef]
- Zhang, T.; Shao, M.; Ye, L. 454 pyrosequencing reveals bacterial diversity of activated sludge from 14 sewage treatment plants. ISME J. 2012, 6, 1137–1147. [Google Scholar] [CrossRef]
Publisher’s Note: MDPI stays neutral with regard to jurisdictional claims in published maps and institutional affiliations. |
© 2022 by the authors. Licensee MDPI, Basel, Switzerland. This article is an open access article distributed under the terms and conditions of the Creative Commons Attribution (CC BY) license (https://creativecommons.org/licenses/by/4.0/).