
Dynamic Measurement of Water Use Level Based on SBM-DEA Model and Its Matching Characteristics with Economic and Social Development: A Case Study of the Yellow River Basin, China


 ,
,
Abstract
:1. Introduction
2. Methodology
2.1. SBM-DEA Model
2.2. Window-DEA Model
2.3. Malmquist Index Model
2.4. Spatial Matching Degree Calculation Method Based on Series Distance
3. Case Study
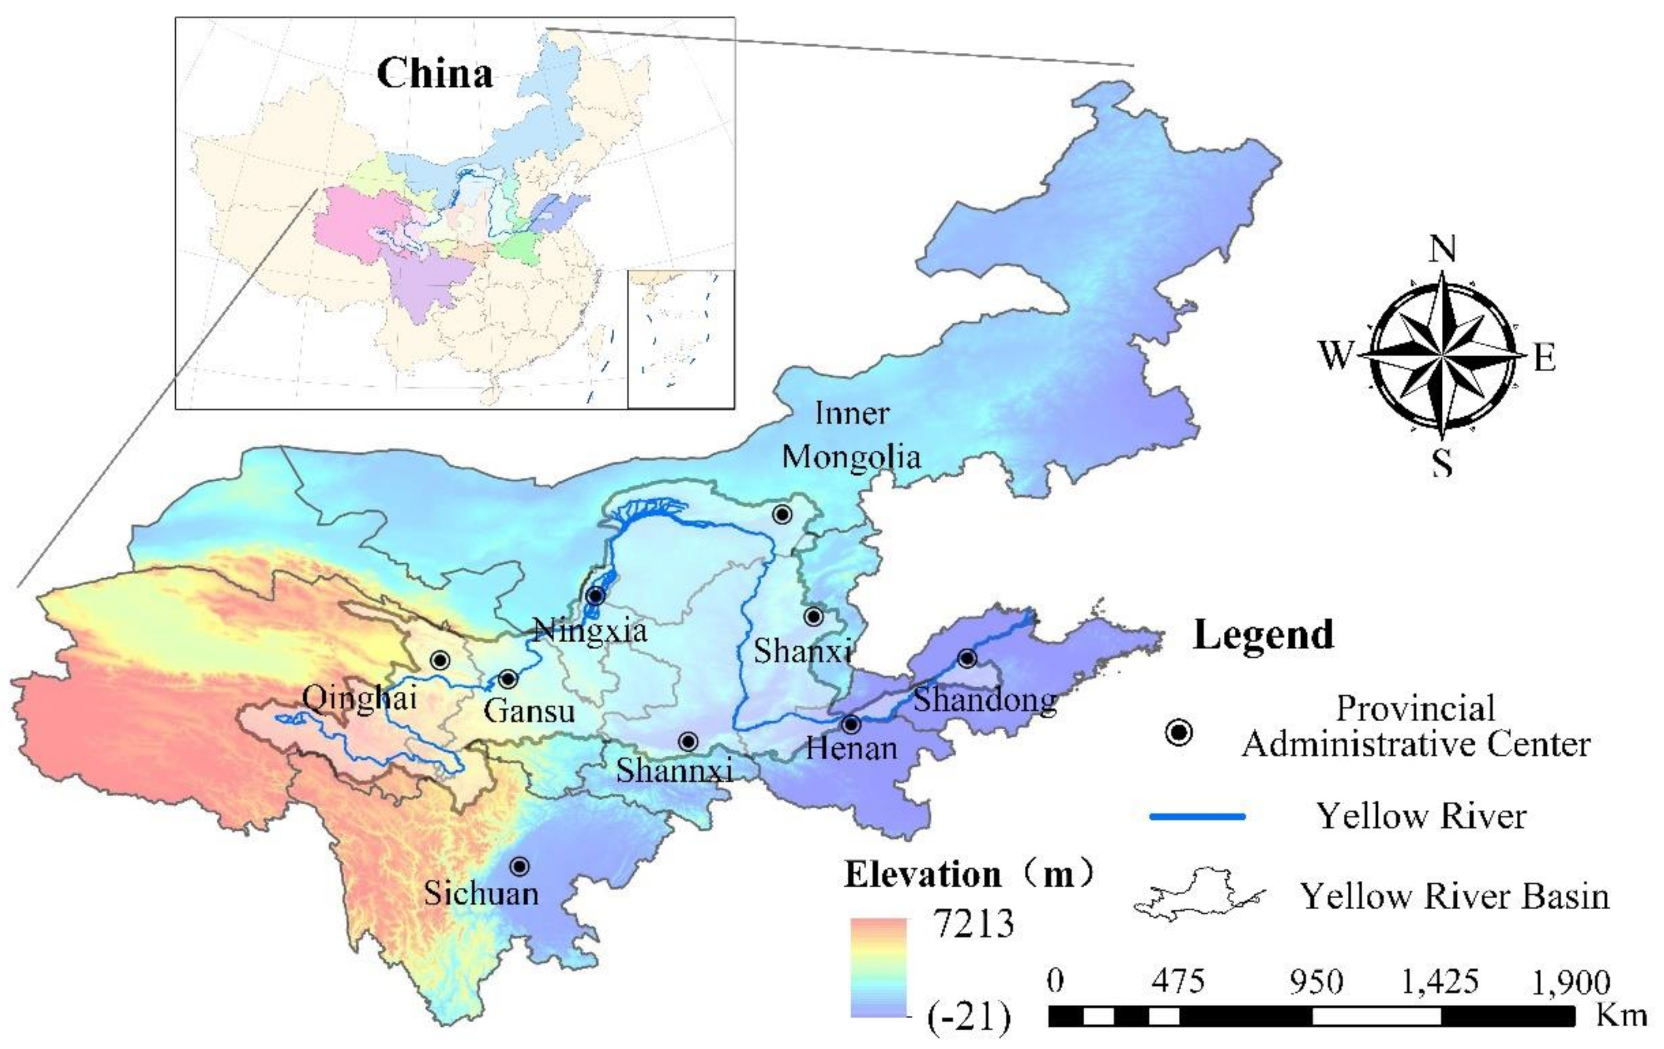
3.1. Study Area
3.2. Indicator Description and Data Sources
4. Results
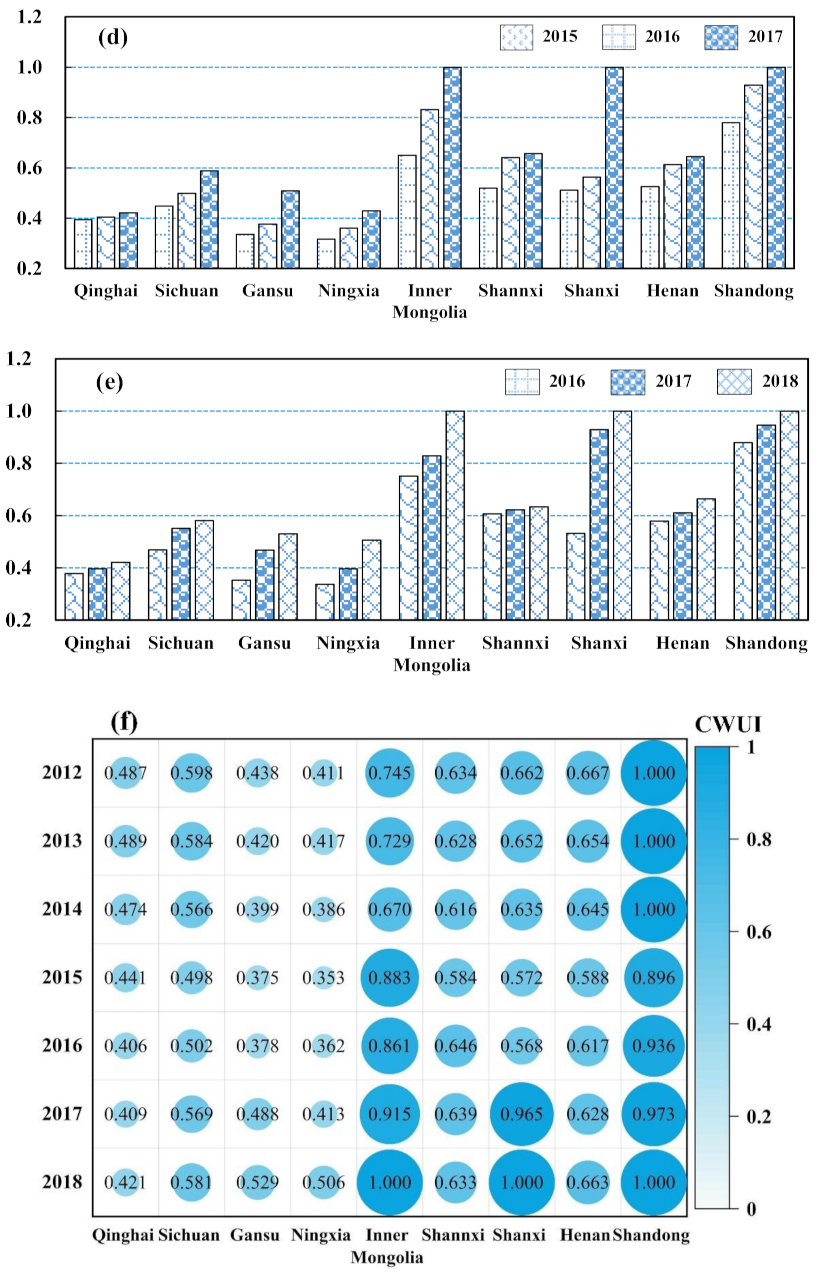
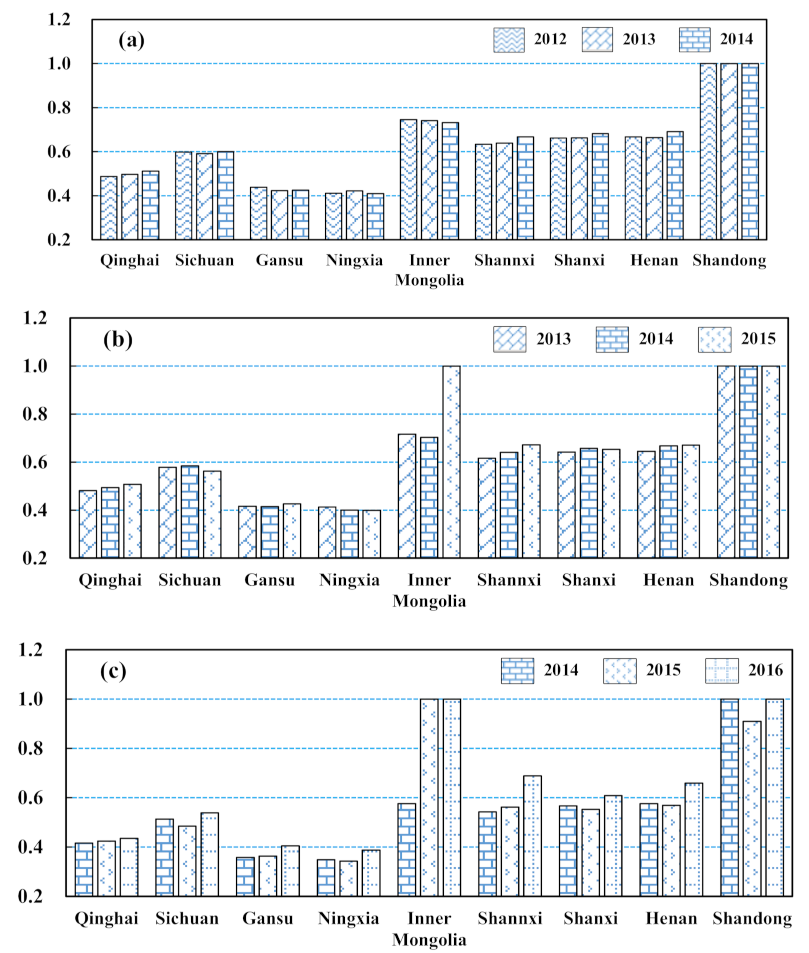
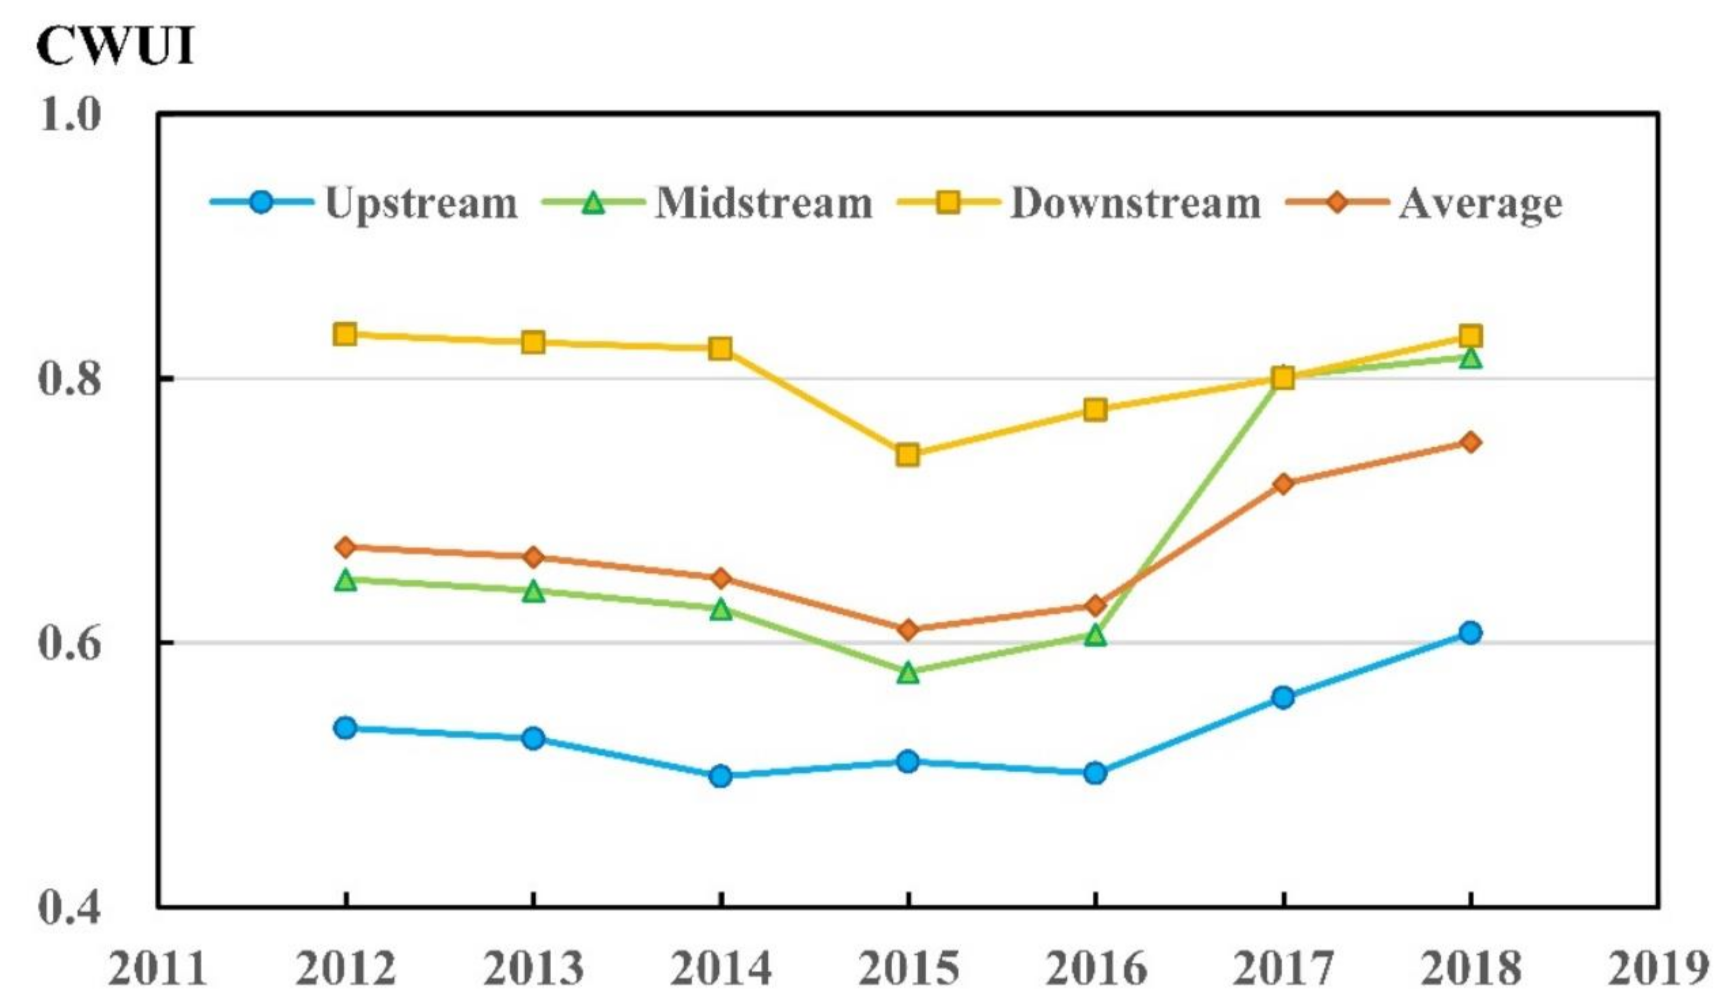
4.1. Spatial–Temporal Evolution Characteristics of Water Use Level
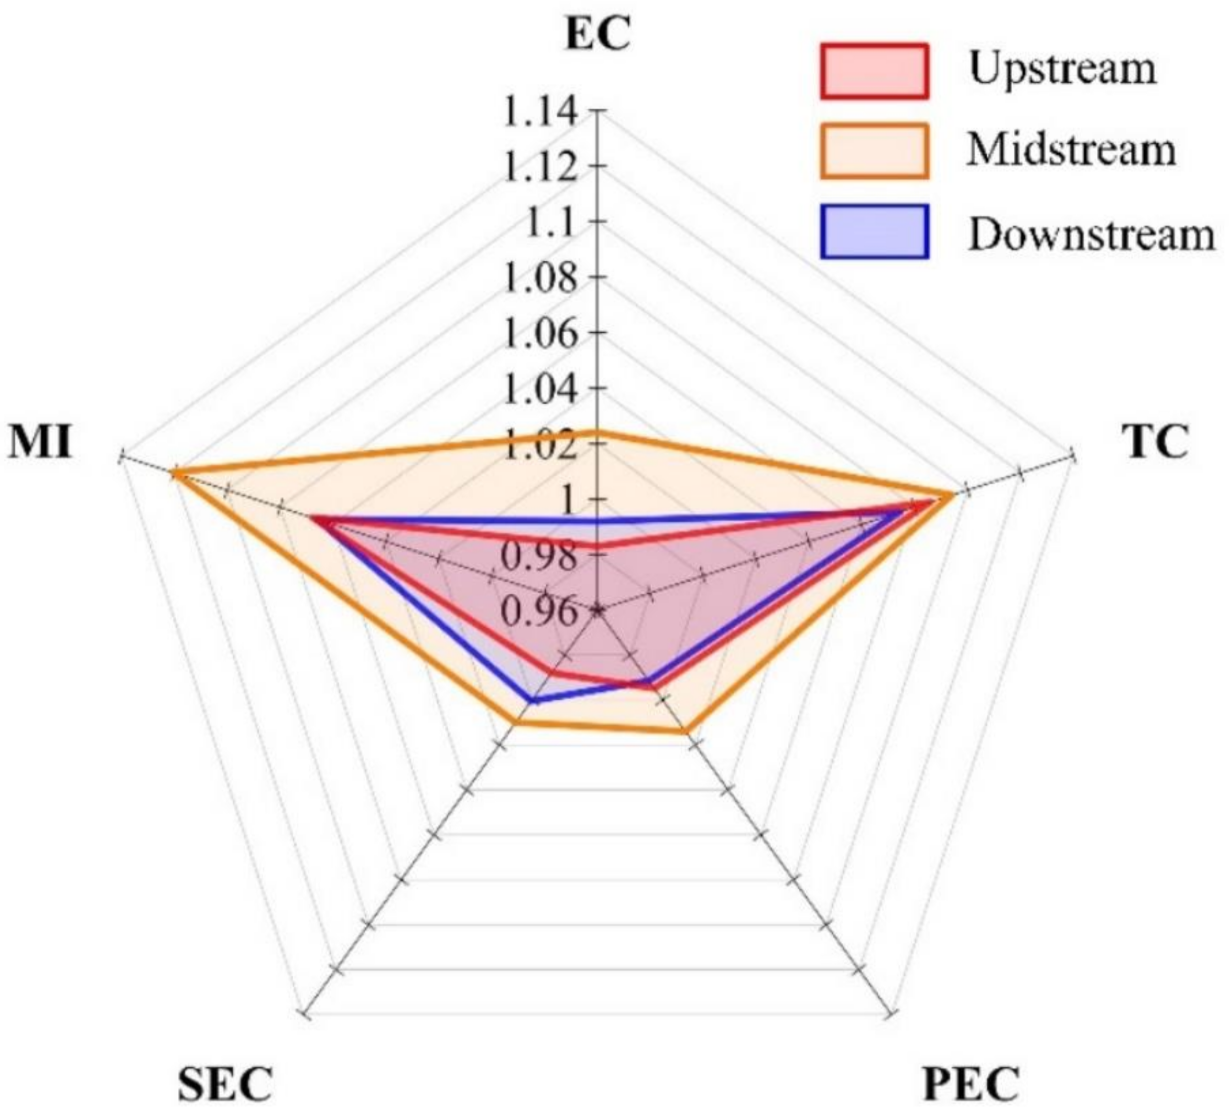
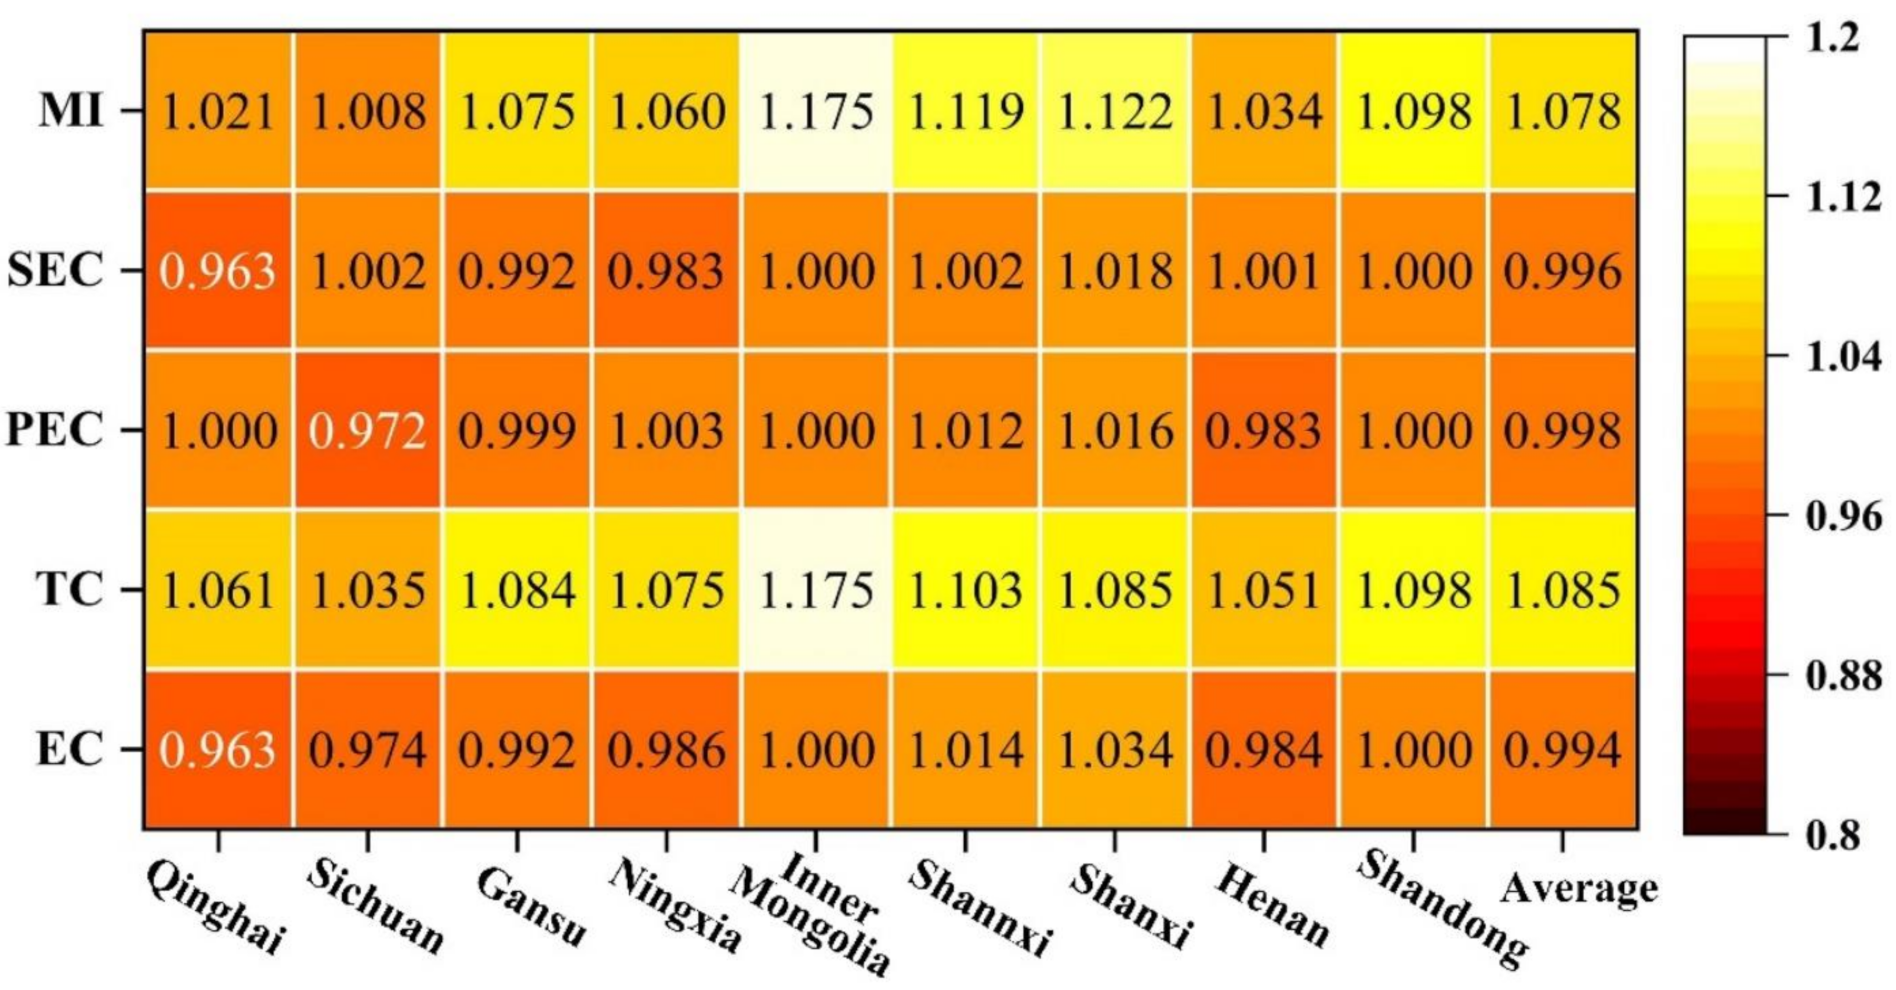
4.2. TFP Analysis of Water Based on Malmquist Index Model
4.3. Matching Relationship between CWUI and E-SDL
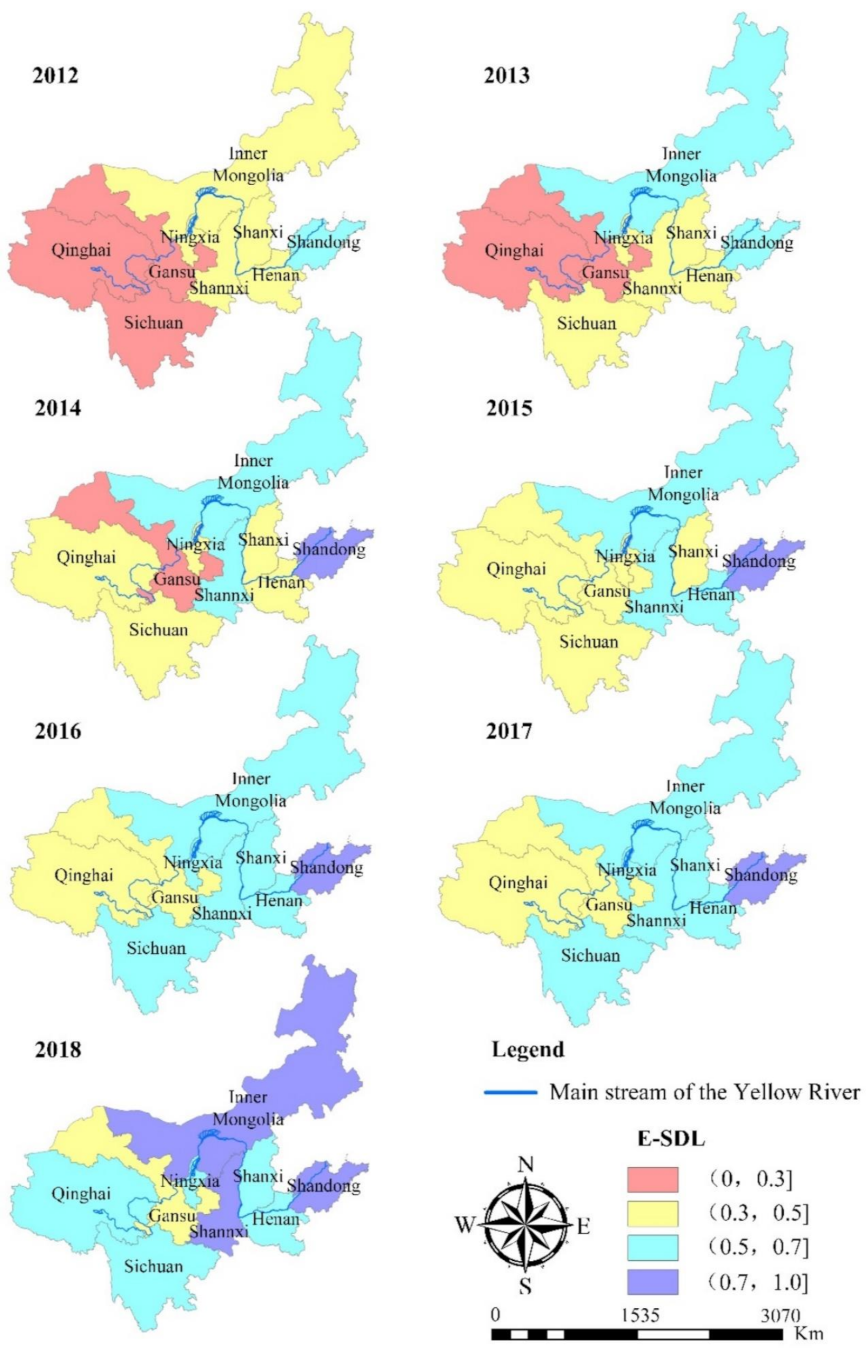
4.3.1. Analysis of the Relative Level of Economic-Social Development
4.3.2. Analysis of Matching Degree between CWUI and E-SDL
5. Conclusions
- (1)
- The nine provinces showed an overall increasing trend in water use level during 2012–2018, with the midstream and downstream provinces having higher overall water use levels than the upstream provinces. The water use level of Shandong Province was at the production frontier of the nine provinces for a long time, and the gap between the water use levels of different provinces is gradually expanding. The upstream and midstream provinces of the Yellow River Basin should optimize the water resources utilization pattern, combine the advanced experience of water resources utilization in Shandong Province, and explore the effective ways to improve the level of regional water resources utilization according to local conditions. Efforts should be made to narrow the gap between water use level and that of downstream provinces.
- (2)
- Technological progress TC is the dominant factor driving the TFP of water in the nine provinces, and integrated technical efficiency change EC overall constrains the TFP of water. Insufficient SEC and PEC are the main reasons for the productivity level gap between upstream and downstream provinces and midstream provinces. The relevant departments of water resources management in the Yellow River Basin should strengthen the implementation of the most stringent water resources management system. While ensuring technological progress, relevant departments should strengthen the level of water resources management, promote the adjustment of its industrial structure in areas lagging behind in water utilization, and force the improvement of comprehensive technical efficiency of regional water resources utilization.
- (3)
- There are significant regional differences in the match between the level of economic and social development and the level of water utilization in the nine provinces, with Gansu, Sichuan, Henan, Qinghai, and Shandong having a better match, but with different match types. Among them, Gansu and Qinghai belong to the “low-low” matching type, which needs to improve both the level of water utilization and the level of economic and social development. The matching degree of CWUI and E-SDL in Ningxia and Shanxi is poor, and there is no dynamic synergy between the improvement of economic and social development level and the improvement of water use level. The harmonious relationship between resource utilization and economic and social development is an important foundation for regional sustainability. Moreover, the nine provinces in the Yellow River Basin should explore new paths for high-quality development based on a harmonious balance between the two.
Author Contributions
Funding
Data Availability Statement
Acknowledgments
Conflicts of Interest
References
- Nordstrom, D.K. Worldwide occurrences of arsenic in ground water. Science 2002, 296, 2143–2145. [Google Scholar] [CrossRef]
- Zuo, Q.; Diao, Y.; Hao, L.; Han, C. Comprehensive evaluation of the human-water harmony relationship in countries along the “belt and road”. Water Resour. Manag. 2020, 34, 4019–4035. [Google Scholar] [CrossRef]
- Pereira, L.S.; Cordery, I.; Iacovides, I. Improved indicators of water use performance and productivity for sustainable water conservation and saving. Agric. Water Manag. 2012, 108, 39–51. [Google Scholar] [CrossRef]
- Pizzi, S.; Caputo, A.; Corvino, A.; Venturelli, A. Management research and the UN sustainable development goals (SDGs): A bibliometric investigation and systematic review. J. Clean Prod. 2020, 276, 124033. [Google Scholar] [CrossRef]
- Queiroz, V.C.; de Carvalho, R.C.; Heller, L. New approaches to monitor inequalities in access to water and sanitation: The SDGs in Latin America and the Caribbean. Water 2020, 12, 931. [Google Scholar] [CrossRef] [Green Version]
- Hellegers, P.; van Halsema, G. SDG indicator 6.4. 1 “change in water use efficiency over time”: Methodological flaws and suggestions for improvement. Sci. Total Environ. 2021, 801, 149431. [Google Scholar] [CrossRef] [PubMed]
- Keesstra, S.; Mol, G.; De Leeuw, J.; Okx, J.; De Cleen, M.; Visser, S. Soil-related sustainable development goals: Four concepts to make land degradation neutrality and restoration work. Land 2018, 7, 133. [Google Scholar] [CrossRef] [Green Version]
- Zuo, Q.; Li, X.; Hao, L.; Hao, M. Spatiotemporal Evolution of Land-Use and Ecosystem Services Valuation in the Belt and Road Initiative. Sustainability 2020, 12, 6583. [Google Scholar] [CrossRef]
- Zakari, A.; Khan, I.; Tan, D.; Alvarado, R.; Dagar, V. Energy efficiency and sustainable development goals (SDGs). Energy 2022, 239, 122365. [Google Scholar] [CrossRef]
- Piao, S.; Ciais, P.; Huang, Y.; Shen, Z.; Peng, S.; Li, J.; Zhou, L.; Liu, H.; Ma, Y.; Ding, Y. The impacts of climate change on water resources and agriculture in China. Nature 2010, 467, 43–51. [Google Scholar] [CrossRef] [PubMed]
- Yu, Y.; Yang, X.; Li, K. Effects of the terms and characteristics of cadres on environmental pollution: Evidence from 230 cities in China. J. Environ. Manag. 2019, 232, 179–187. [Google Scholar] [CrossRef] [PubMed]
- Luo, Z.; Shao, Q.; Zuo, Q.; Cui, Y. Impact of land use and urbanization on river water quality and ecology in a dam dominated basin. J. Hydrol. 2020, 584, 124655. [Google Scholar] [CrossRef]
- Zuo, Q.; Jin, R.; Ma, J.; Cui, G. China pursues a strict water resources management system. Environ. Earth Sci. 2014, 72, 2219–2222. [Google Scholar] [CrossRef]
- Jiang, L.; Zuo, Q.; Ma, J.; Zhang, Z. Evaluation and prediction of the level of high-quality development: A case study of the Yellow River Basin, China. Ecol. Indic. 2021, 129, 107994. [Google Scholar] [CrossRef]
- Xi, J. Speech at the symposium on ecological protection and high-quality development of the Yellow River Basin. China Water Resour. 2019, 20, 1–3. [Google Scholar]
- Katerji, N.; Mastrorilli, M.; Rana, G. Water use efficiency of crops cultivated in the Mediterranean region: Review and analysis. Eur. J. Agron. 2008, 28, 493–507. [Google Scholar] [CrossRef]
- Ullah, H.; Santiago-Arenas, R.; Ferdous, Z.; Attia, A.; Datta, A. Improving water use efficiency, nitrogen use efficiency, and radiation use efficiency in field crops under drought stress: A review. Adv. Agron. 2019, 156, 109–157. [Google Scholar]
- Koech, R.; Langat, P. Improving irrigation water use efficiency: A review of advances, challenges and opportunities in the Australian context. Water 2018, 10, 1771. [Google Scholar] [CrossRef] [Green Version]
- Aller, D.; Rathke, S.; Laird, D.; Cruse, R.; Hatfield, J. Impacts of fresh and aged biochars on plant available water and water use efficiency. Geoderma 2017, 307, 114–121. [Google Scholar] [CrossRef]
- Khayyam, S.; Mashal, M.; Aliniaeifard, S.; Varavipour, M. Determination of water use efficiency and water-nitrogen production function for Radish crop. Water Irrig. Manag. 2021, 11, 315–324. [Google Scholar]
- Li, H.; Zhao, F.; Li, C.; Yi, Y.; Bu, J.; Wang, X.; Liu, Q.; Shu, A. An improved ecological footprint method for water resources utilization assessment in the cities. Water 2020, 12, 503. [Google Scholar] [CrossRef] [Green Version]
- Wang, G.; Xiao, C.; Qi, Z.; Meng, F.; Liang, X. Development tendency analysis for the water resource carrying capacity based on system dynamics model and the improved fuzzy comprehensive evaluation method in the Changchun city, China. Ecol. Indic. 2021, 122, 107232. [Google Scholar] [CrossRef]
- Wang, S.; Zhou, L.; Wang, H.; Li, X. Water use efficiency and its influencing factors in China: Based on the Data Envelopment Analysis (DEA)—Tobit Model. Water 2018, 10, 832. [Google Scholar] [CrossRef] [Green Version]
- Wang, F.; Yu, C.; Xiong, L.; Chang, Y. How can agricultural water use efficiency be promoted in China? A spatial-temporal analysis. Resour. Conserv. Recycl. 2019, 145, 411–418. [Google Scholar] [CrossRef]
- Zhang, W.; Du, X.; Huang, A.; Yin, H. Analysis and comprehensive evaluation of water use efficiency in China. Water 2019, 11, 2620. [Google Scholar] [CrossRef] [Green Version]
- Ibrahim, M.D.; Ferreira, D.C.; Daneshvar, S.; Marques, R.C. Transnational resource generativity: Efficiency analysis and target setting of water, energy, land, and food nexus for OECD countries. Sci. Total Environ. 2019, 697, 134017. [Google Scholar] [CrossRef] [PubMed]
- Deng, G.; Li, L.; Song, Y. Provincial water use efficiency measurement and factor analysis in China: Based on SBM-DEA model. Ecol. Indic. 2016, 69, 12–18. [Google Scholar] [CrossRef]
- Lu, W.; Liu, W.; Hou, M.; Deng, Y.; Deng, Y.; Zhou, B.; Zhao, K. Spatial–Temporal Evolution Characteristics and Influencing Factors of Agricultural Water Use Efficiency in Northwest China—Based on a Super-DEA Model and a Spatial Panel Econometric Model. Water 2021, 13, 632. [Google Scholar] [CrossRef]
- Yang, W.; Li, L. Analysis of total factor efficiency of water resource and energy in China: A study based on DEA-SBM model. Sustainability 2017, 9, 1316. [Google Scholar] [CrossRef] [Green Version]
- Yang, G.-l.; Yang, D.-G. Investigating industrial water-use efficiency in mainland China: An improved SBM-DEA model. J. Environ. Manag. 2020, 270, 110859. [Google Scholar]
- Yang, G.-l.; Yang, D.-G. Industrial water-use efficiency in China: Regional heterogeneity and incentives identification. J. Clean Prod. 2020, 258, 120828. [Google Scholar]
- Sun, B.; Yang, X.; Zhang, Y.; Chen, X. Evaluation of water use efficiency of 31 provinces and municipalities in China using multi-level entropy weight method synthesized indexes and data envelopment analysis. Sustainability 2019, 11, 4556. [Google Scholar] [CrossRef] [Green Version]
- Geng, Q.; Ren, Q.; Nolan, R.H.; Wu, P.; Yu, Q. Assessing China’s agricultural water use efficiency in a green-blue water perspective: A study based on data envelopment analysis. Ecol. Indic. 2019, 96, 329–335. [Google Scholar] [CrossRef]
- Hu, Z.; Yan, S.; Yao, L.; Moudi, M. Efficiency evaluation with feedback for regional water use and wastewater treatment. J. Hydrol. 2018, 562, 703–711. [Google Scholar] [CrossRef]
- Zhou, X.; Luo, R.; Yao, L.; Cao, S.; Wang, S.; Lev, B. Assessing integrated water use and wastewater treatment systems in China: A mixed network structure two-stage SBM DEA model. J. Clean Prod. 2018, 185, 533–546. [Google Scholar] [CrossRef]
- Bai, M.; Zhou, S.; Zhao, M.; Yu, J. Water use efficiency improvement against a backdrop of expanding city agglomeration in developing countries—A case study on industrial and agricultural water use in the Bohai Bay Region of China. Water 2017, 9, 89. [Google Scholar] [CrossRef] [Green Version]
- Mohsin, M.; Abbas, Q.; Zhang, J.; Ikram, M.; Iqbal, N. Integrated effect of energy consumption, economic development, and population growth on CO 2 based environmental degradation: A case of transport sector. Environ. Sci. Pollut. Res. 2019, 26, 32824–32835. [Google Scholar] [CrossRef] [PubMed]
- Sarkodie, S.A.; Strezov, V. Effect of foreign direct investments, economic development and energy consumption on greenhouse gas emissions in developing countries. Sci. Total Environ. 2019, 646, 862–871. [Google Scholar] [CrossRef]
- Raza, S.A.; Shah, N.; Sharif, A. Time frequency relationship between energy consumption, economic growth and environmental degradation in the United States: Evidence from transportation sector. Energy 2019, 173, 706–720. [Google Scholar] [CrossRef]
- Lu, Z.-N.; Chen, H.; Hao, Y.; Wang, J.; Song, X.; Mok, T.M. The dynamic relationship between environmental pollution, economic development and public health: Evidence from China. J. Clean Prod. 2017, 166, 134–147. [Google Scholar] [CrossRef]
- Shu, C.; Xie, H.; Jiang, J.; Chen, Q. Is urban land development driven by economic development or fiscal revenue stimuli in China? Land Use Policy 2018, 77, 107–115. [Google Scholar] [CrossRef]
- Cheng, X.; Chen, L.; Sun, R.; Kong, P. Land use changes and socio-economic development strongly deteriorate river ecosystem health in one of the largest basins in China. Sci. Total Environ. 2018, 616, 376–385. [Google Scholar] [CrossRef]
- Zhongming, Z.; Wangqiang, Z.; Wei, L. UN World Water Development Report 2021 ‘Valuing Water’; UNESCO: Paris, France, 2021. [Google Scholar]
- Sun, Y.; Liu, N.; Shang, J.; Zhang, J. Sustainable utilization of water resources in China: A system dynamics model. J. Clean Prod. 2017, 142, 613–625. [Google Scholar] [CrossRef]
- Huang, Y.; Huang, X.; Xie, M.; Cheng, W.; Shu, Q. A study on the effects of regional differences on agricultural water resource utilization efficiency using super-efficiency SBM model. Sci. Rep. 2021, 11, 9953. [Google Scholar] [CrossRef]
- Tone, K. A slacks-based measure of efficiency in data envelopment analysis. Eur. J. Oper. Res. 2001, 130, 498–509. [Google Scholar] [CrossRef] [Green Version]
- Charnes, A.; Clark, C.T.; Cooper, W.W.; Golany, B. A Developmental Study of Data Envelopment Analysis in Measuring the Efficiency of Maintenance Units in the US Air Forces; Center for Cybernetic Studies, University of Texas: Austin, TX, USA, 1983. [Google Scholar]
- Caves, D.W.; Christensen, L.R.; Diewert, W.E. Multilateral comparisons of output, input, and productivity using superlative index numbers. Econ. J. 1982, 92, 73–86. [Google Scholar] [CrossRef]
- Färe, R.; Grosskopf, S.; Norris, M.; Zhang, Z. Productivity growth, technical progress, and efficiency change in industrialized countries. Am. Econ. Rev. 1994, 84, 66–83. [Google Scholar]
- Zuo, Q.; Zhao, H.; Ma, J.; Zhang, C. Calculation method and application of matching degree between water resources utilization and economic and social development. Adv. Sci. Technol. Water Resour. 2014, 34, 1–6. [Google Scholar]
- Zuo, Q.; Hao, M.; Zhang, Z.; Jiang, L. Assessment of the happy river index as an integrated index of river health and human well-being: A case study of the Yellow River, China. Water 2020, 12, 3064. [Google Scholar] [CrossRef]
- Qiu, M.; Yang, Z.; Zuo, Q.; Wu, Q.; Jiang, L.; Zhang, Z.; Zhang, J. Evaluation on the relevance of regional urbanization and ecological security in the nine provinces along the Yellow River, China. Ecol. Indic. 2021, 132, 108346. [Google Scholar] [CrossRef]
- Asmild, M.; Paradi, J.C.; Aggarwall, V.; Schaffnit, C. Combining DEA window analysis with the Malmquist index approach in a study of the Canadian banking industry. J. Product. Anal. 2004, 21, 67–89. [Google Scholar] [CrossRef]
- Halkos, G.E.; Tzeremes, N.G. Exploring the existence of Kuznets curve in countries’ environmental efficiency using DEA window analysis. Ecol. Econ. 2009, 68, 2168–2176. [Google Scholar] [CrossRef]
- DEA-SOLVER PRO, Research Software, Version 13.1.; SAITECH: Tokyo, Japan. Available online: http://www.saitech-inc.com/Products/Prod-DSP.asp(accessed on 15 June 2021).
- DEAP, Research Software, Version 2.1.; Université Laval: Quebec City, Canada. Available online: https://pypi.org/project/deap/(accessed on 17 June 2021).
- Chen, Y.; Zhu, M.; Lu, J.; Zhou, Q.; Ma, W. Evaluation of ecological city and analysis of obstacle factors under the background of high-quality development: Taking cities in the Yellow River Basin as examples. Ecol. Indic. 2020, 118, 106771. [Google Scholar] [CrossRef]
- Wang, S.Y.; Chen, W.M.; Wang, R.; Zhao, T. Study on the coordinated development of urbanization and water resources utilization efficiency in China. Water Supply 2021, 22, 749–765. [Google Scholar] [CrossRef]


| Type | Indicators | Necessity |
|---|---|---|
| Input indicators | Total water consumption | Reflect natural resource input [27,30,31,34] |
| Investment in fixed assets a | Reflect social capital input [27,29,30,31,34] | |
| Number of employees | Reflect human capital input [27,29,30,31] | |
| Ammonia nitrogen emissions in wastewater | Reflect environmental load-bearing input [30,34] | |
| Output indicators | GDP b | Reflect economic benefit output [27,29,30,31,34] |
| Dimensions | Indicators | Characteristic a | Unit | Weight b |
|---|---|---|---|---|
| Economic development | GDP per capita | + | Yuan RMB | 0.235 |
| Proportion of R&D expenditure in GDP | + | % | 0.078 | |
| Proportion of added value of tertiary industry in GDP | + | % | 0.078 | |
| Proportion of urban population | + | % | 0.098 | |
| Social harmony | Income ratio between urban and rural residents | − | − | 0.039 |
| Coverage of basic old-age insurance | + | % | 0.119 | |
| Disposable income per resident | + | Yuan RMB | 0.119 | |
| Proportion of residents’ entertainment consumption expenditure | + | % | 0.039 | |
| Ecological friendliness | Energy consumption per 10,000 Yuan RMB of GDP | − | t/10,000 RMB | 0.078 |
| Afforestation coverage rate of built-up area | + | % | 0.039 | |
| Arable land area index | + | % | 0.039 | |
| Surface water compliance rate | + | % | 0.039 |
| Regions | Qinghai | Sichuan | Gansu | Ningxia | Inner Mongolia | Shannxi | Shanxi | Henan | Shandong |
|---|---|---|---|---|---|---|---|---|---|
| Average | 0.447 | 0.557 | 0.433 | 0.407 | 0.829 | 0.626 | 0.722 | 0.637 | 0.972 |
| Rank | 7 | 6 | 8 | 9 | 2 | 5 | 3 | 4 | 1 |
| Years | EC | TC | PEC | SEC | MI |
|---|---|---|---|---|---|
| 2013 | 0.984 | 0.983 | 0.983 | 1.001 | 0.967 |
| 2014 | 0.978 | 1.004 | 0.991 | 0.988 | 0.982 |
| 2015 | 0.985 | 1.010 | 0.975 | 1.011 | 0.995 |
| 2016 | 1.004 | 1.248 | 1.029 | 0.976 | 1.253 |
| 2017 | 1.034 | 1.160 | 1.027 | 1.008 | 1.200 |
| 2018 | 0.979 | 1.129 | 0.988 | 0.991 | 1.106 |
| Average a | 0.994 | 1.085 | 0.998 | 0.996 | 1.078 |
| Regions | 2012 | 2015 | 2018 | ||||||
|---|---|---|---|---|---|---|---|---|---|
| CWUI | E-SDL | MD | CWUI | E-SDL | MD | CWUI | E-SDL | MD | |
| Qinghai | 0.487 | 0.225 | 0.875 | 0.441 | 0.373 | 0.972 | 0.421 | 0.550 | 0.710 |
| Sichuan | 0.598 | 0.287 | 0.871 | 0.498 | 0.456 | 0.958 | 0.581 | 0.673 | 0.757 |
| Gansu | 0.438 | 0.202 | 0.885 | 0.375 | 0.347 | 0.960 | 0.529 | 0.499 | 0.990 |
| Ningxia | 0.411 | 0.322 | 0.761 | 0.353 | 0.430 | 0.746 | 0.506 | 0.619 | 0.729 |
| Inner Mongolia | 0.745 | 0.461 | 0.889 | 0.883 | 0.600 | 0.635 | 1.000 | 0.718 | 0.602 |
| Shannxi | 0.634 | 0.430 | 0.808 | 0.584 | 0.576 | 0.864 | 0.633 | 0.750 | 0.705 |
| Shanxi | 0.662 | 0.325 | 0.879 | 0.572 | 0.484 | 0.965 | 1.000 | 0.580 | 0.346 |
| Henan | 0.667 | 0.331 | 0.888 | 0.588 | 0.500 | 0.969 | 0.663 | 0.665 | 0.916 |
| Shandong | 1.000 | 0.585 | 0.939 | 0.896 | 0.779 | 0.988 | 1.000 | 0.858 | 0.860 |
| Upstream | 0.536 | 0.299 | 0.987 | 0.510 | 0.441 | 0.963 | 0.608 | 0.612 | 0.703 |
| Midstream | 0.648 | 0.377 | 0.924 | 0.578 | 0.530 | 0.899 | 0.816 | 0.665 | 0.658 |
| Downstream | 0.833 | 0.458 | 0.936 | 0.742 | 0.640 | 0.936 | 0.832 | 0.761 | 0.954 |
Publisher’s Note: MDPI stays neutral with regard to jurisdictional claims in published maps and institutional affiliations. |
© 2022 by the authors. Licensee MDPI, Basel, Switzerland. This article is an open access article distributed under the terms and conditions of the Creative Commons Attribution (CC BY) license (https://creativecommons.org/licenses/by/4.0/).
Share and Cite
Zhang, Z.; Zuo, Q.; Jiang, L.; Ma, J.; Zhao, W.; Cao, H. Dynamic Measurement of Water Use Level Based on SBM-DEA Model and Its Matching Characteristics with Economic and Social Development: A Case Study of the Yellow River Basin, China. Water 2022, 14, 399. https://doi.org/10.3390/w14030399
Zhang Z, Zuo Q, Jiang L, Ma J, Zhao W, Cao H. Dynamic Measurement of Water Use Level Based on SBM-DEA Model and Its Matching Characteristics with Economic and Social Development: A Case Study of the Yellow River Basin, China. Water. 2022; 14(3):399. https://doi.org/10.3390/w14030399
Chicago/Turabian StyleZhang, Zhizhuo, Qiting Zuo, Long Jiang, Junxia Ma, Weiling Zhao, and Hongbin Cao. 2022. "Dynamic Measurement of Water Use Level Based on SBM-DEA Model and Its Matching Characteristics with Economic and Social Development: A Case Study of the Yellow River Basin, China" Water 14, no. 3: 399. https://doi.org/10.3390/w14030399
APA StyleZhang, Z., Zuo, Q., Jiang, L., Ma, J., Zhao, W., & Cao, H. (2022). Dynamic Measurement of Water Use Level Based on SBM-DEA Model and Its Matching Characteristics with Economic and Social Development: A Case Study of the Yellow River Basin, China. Water, 14(3), 399. https://doi.org/10.3390/w14030399