

Surface Water Mapping from SAR Images Using Optimal Threshold Selection Method and Reference Water Mask

Abstract

1. Introduction
- Assess the method performance, namely, the similarity between the SAR and reference masks;
- Select polarization and speckle filtering parameters to ensure maximum similarity between SAR and reference masks;
- Compare the results of the proposed method with the results obtained by the classical Otsu method;
- Learn how to construct SAR masks on days when it is not possible to generate a reference mask from optical data due to cloudiness.
2. Materials and Methods
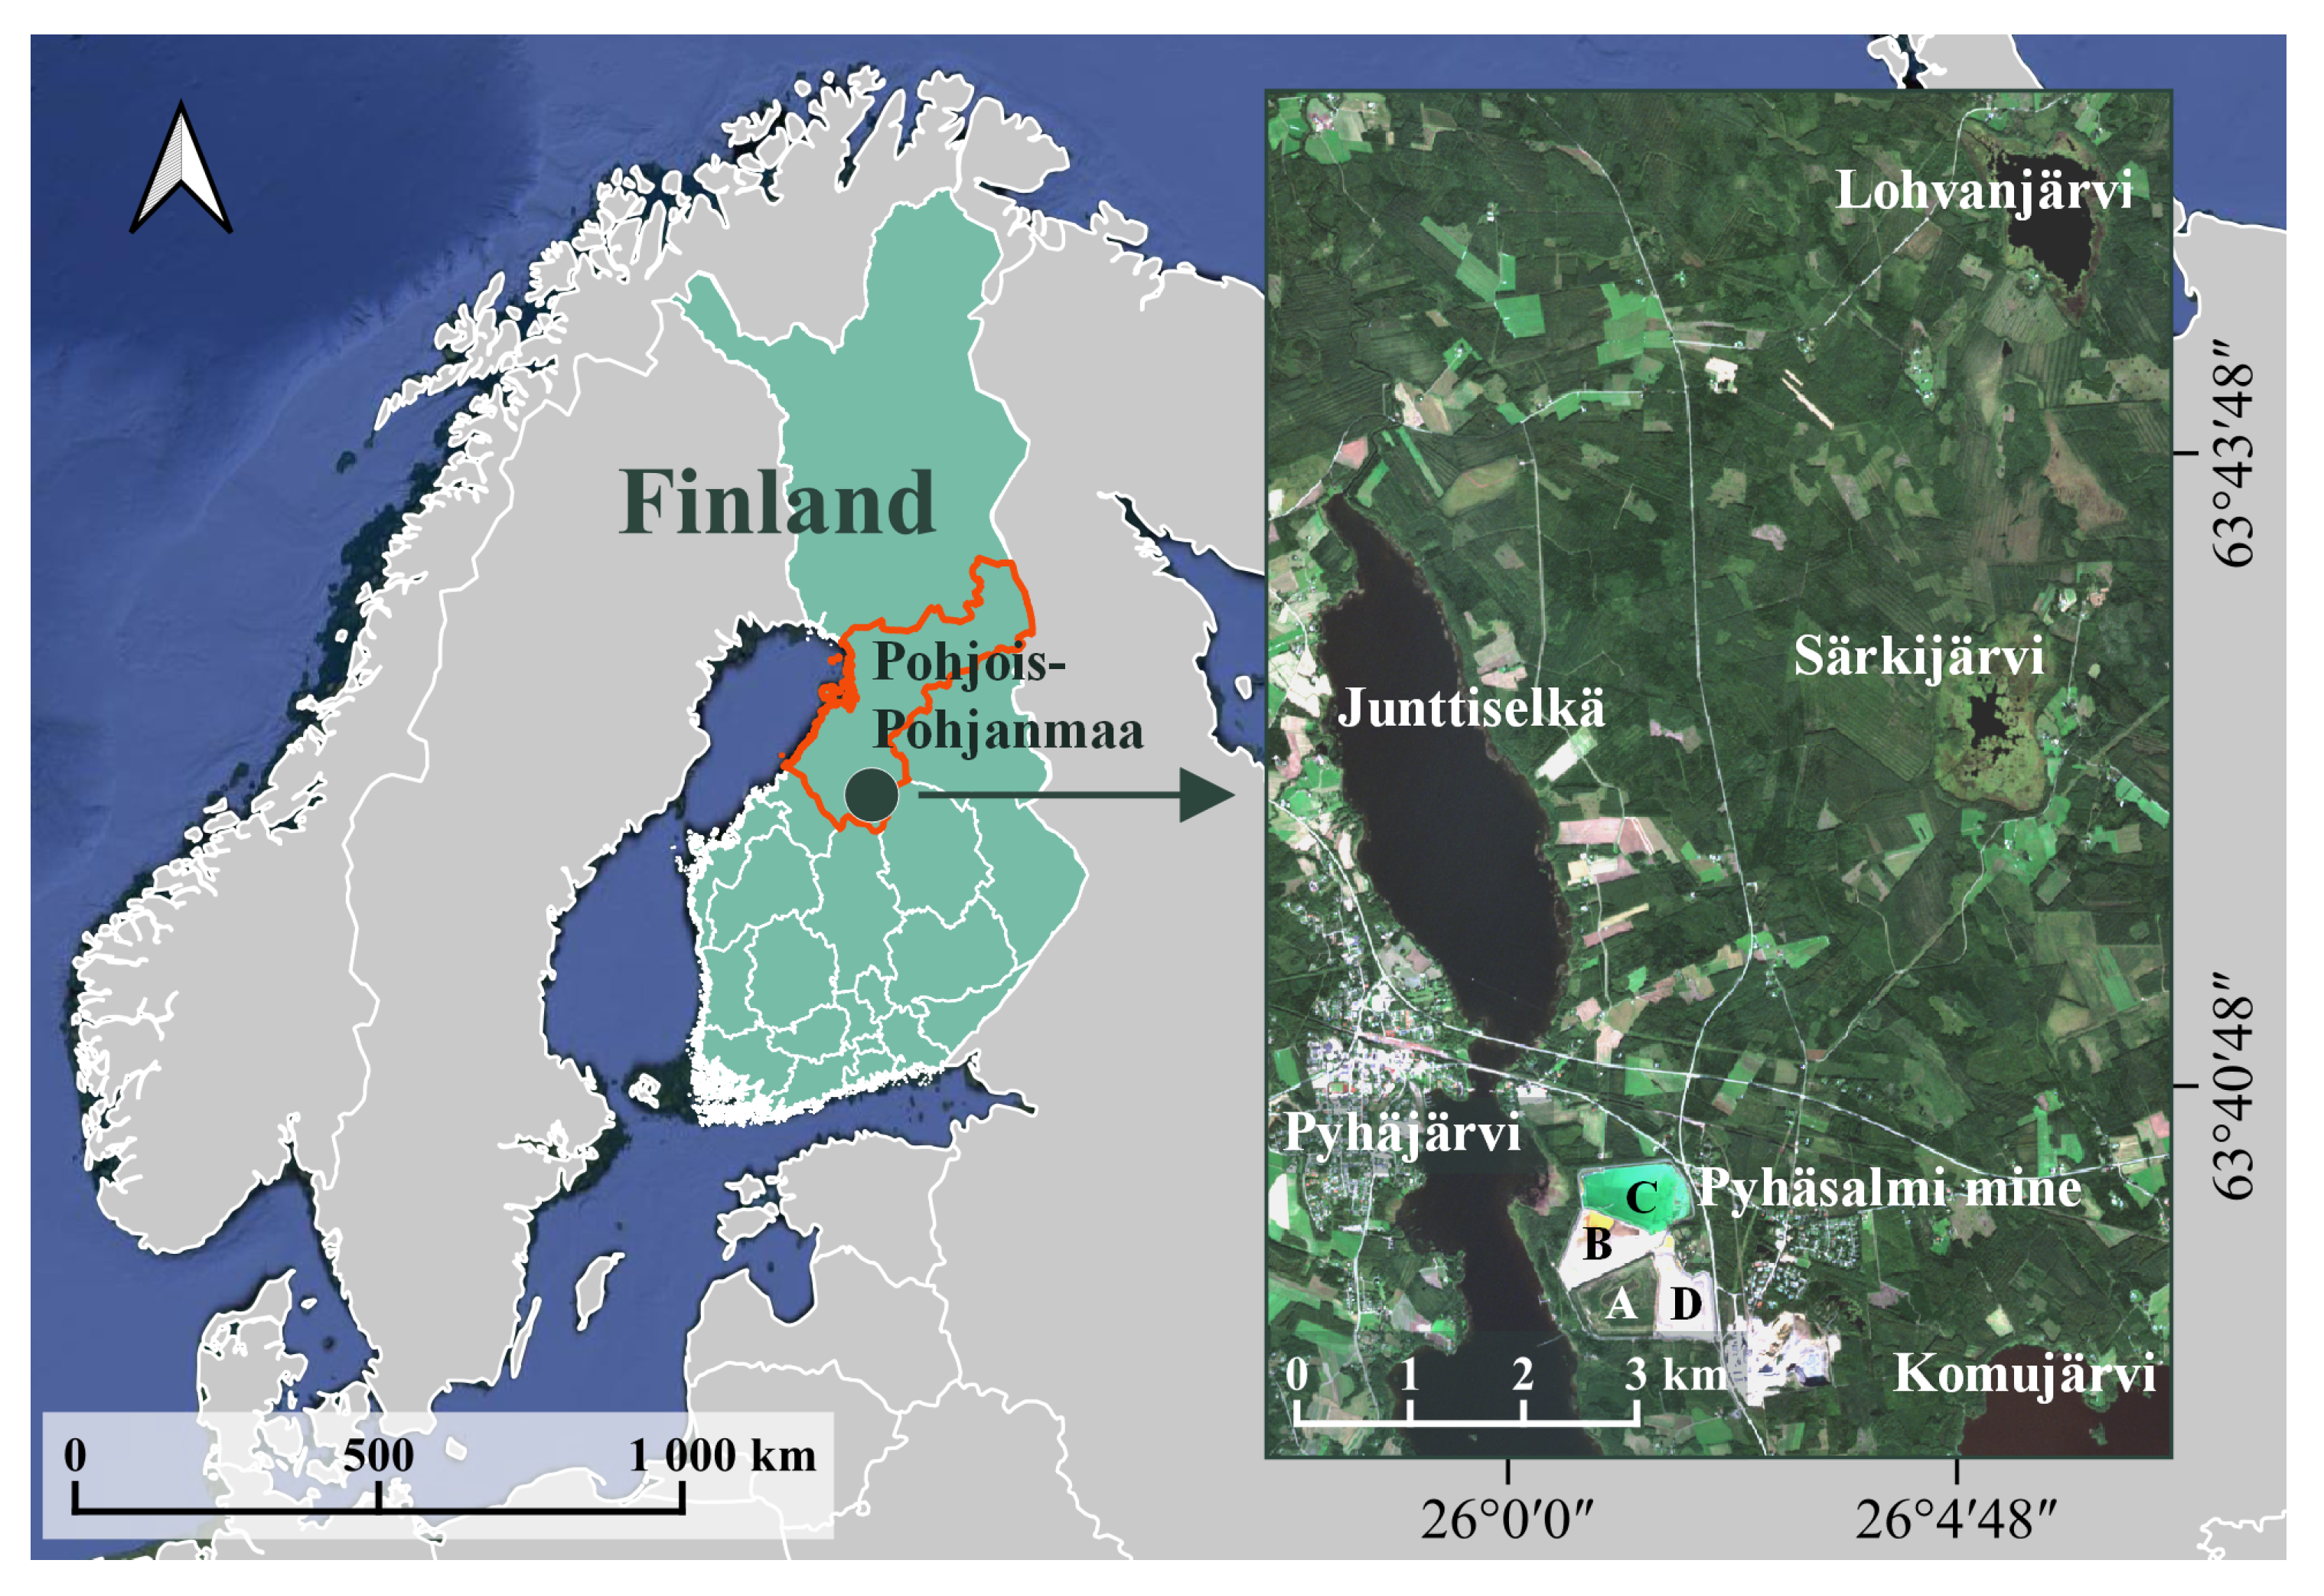
2.1. Study Area
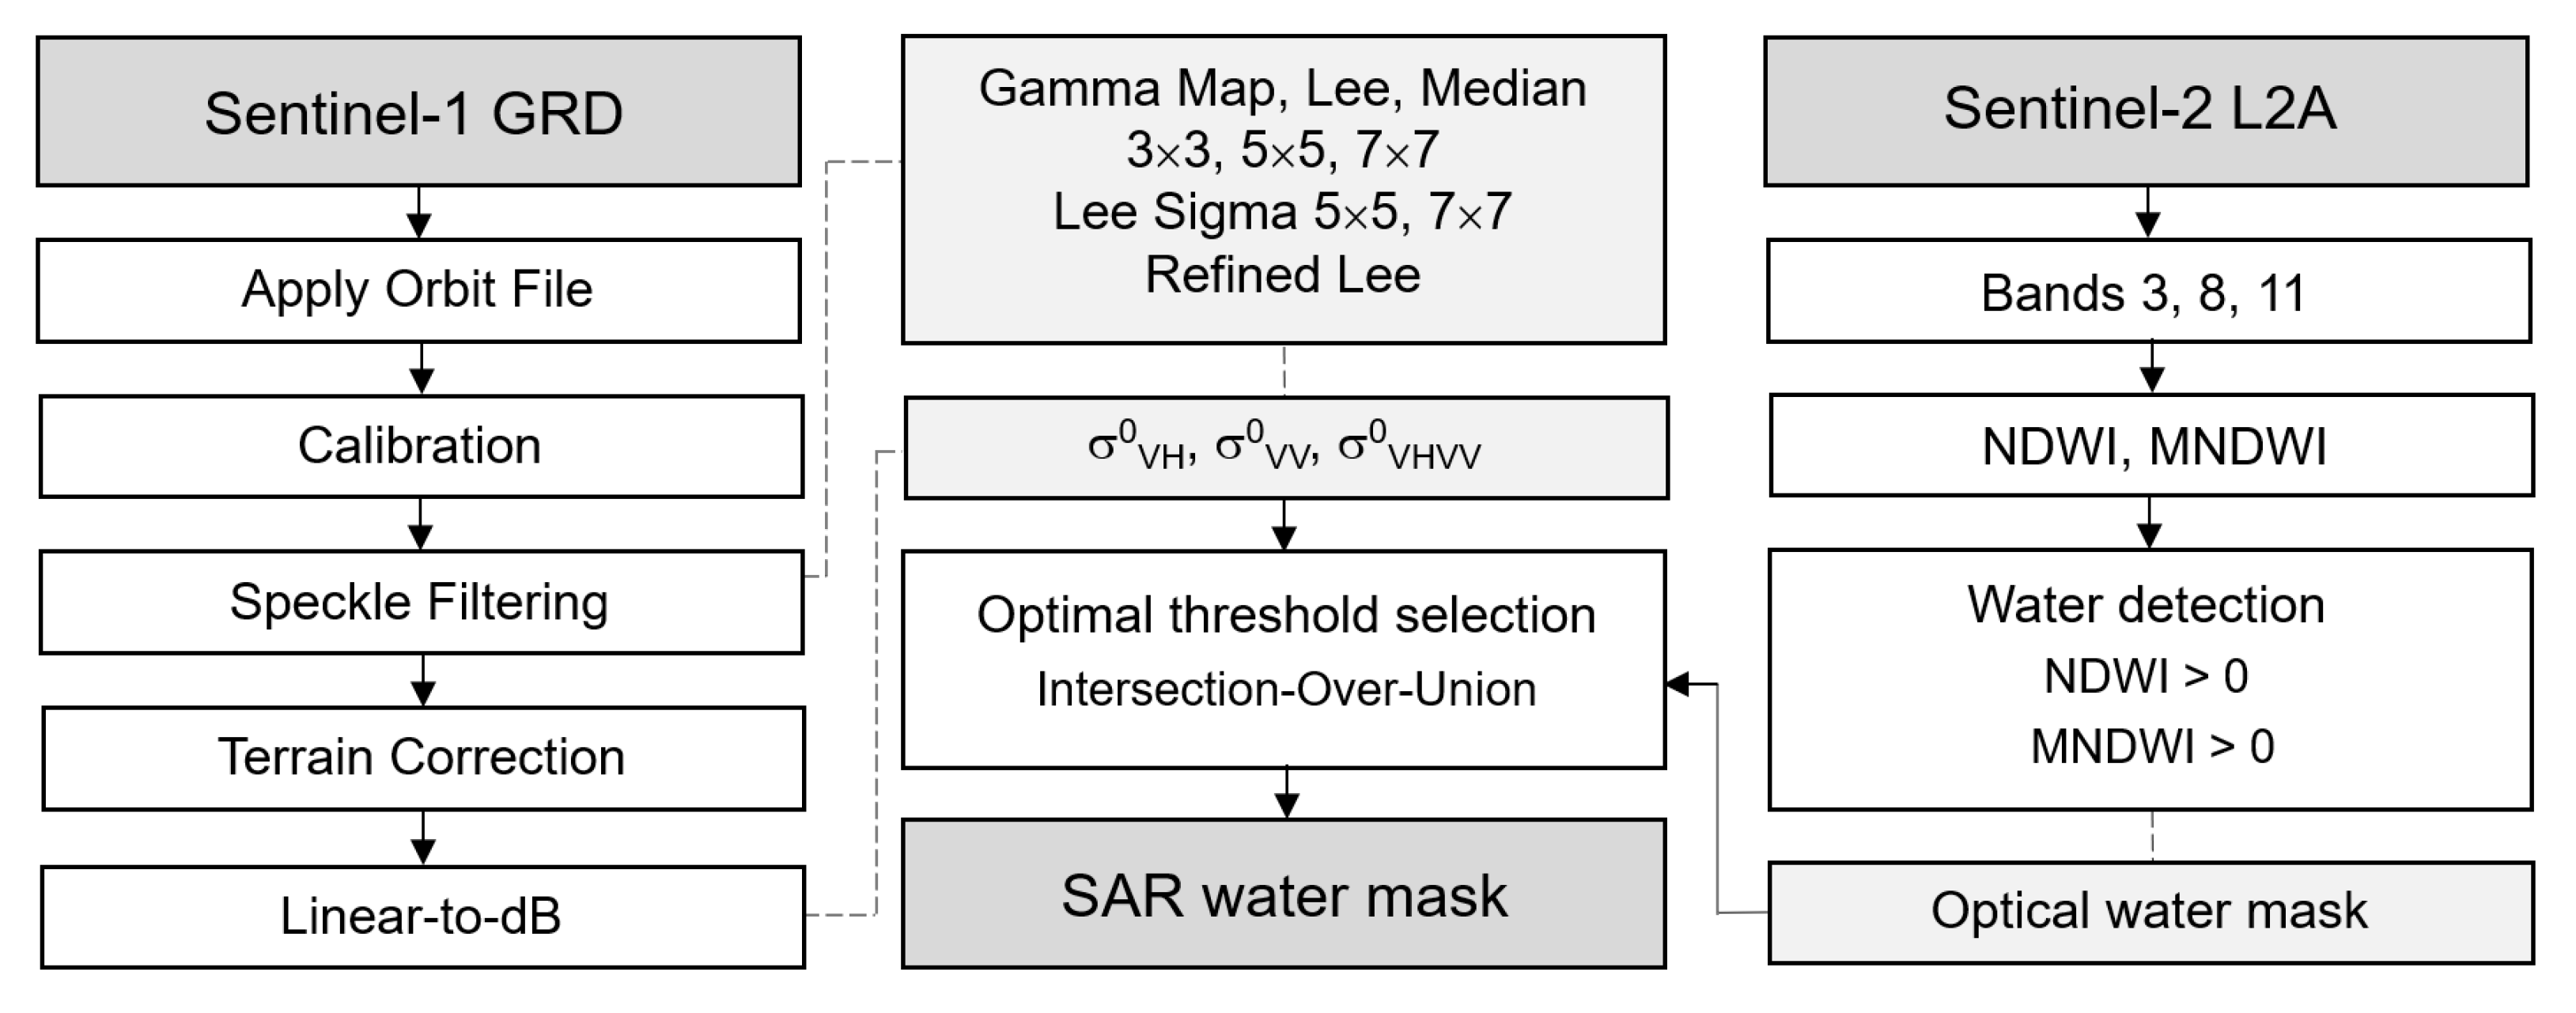
2.2. Satellite Data
- Apply orbit file—applying a satellite position and velocity parameters.
- Calibration— backscatter coefficient calculation.
- Speckle filtering—speckle noise filtering.
- Terrain correction—elimination of distortions due to oblique image geometry using a digital elevation model (Copernicus 30 m Global DEM).
- Linear-to-dB—converting to decibels (dB).
2.3. Water Body Detection Methods
2.3.1. Optical Sensors
2.3.2. SAR: Basic Method
- 1.
- Generating a backscattering coefficient histogram from SAR data in one of the polarizations.
- 2.
- Determining a threshold value ()—the minimum on the histogram that separates two modes.
- 3.
- Construction of a binary mask: .
- 1.
- Removing outliers. The values below the quantile or above the quantile were replaced by the corresponding quantile ( in the paper).
- 2.
- Constructing the distribution density function (kernel density estimation with Gaussian kernel).
- 3.
- Computing a local minimum of the distribution density.
- 4.
- Checking if the minimum is reached at one of the histogram edges. If not, the desired threshold value is found.
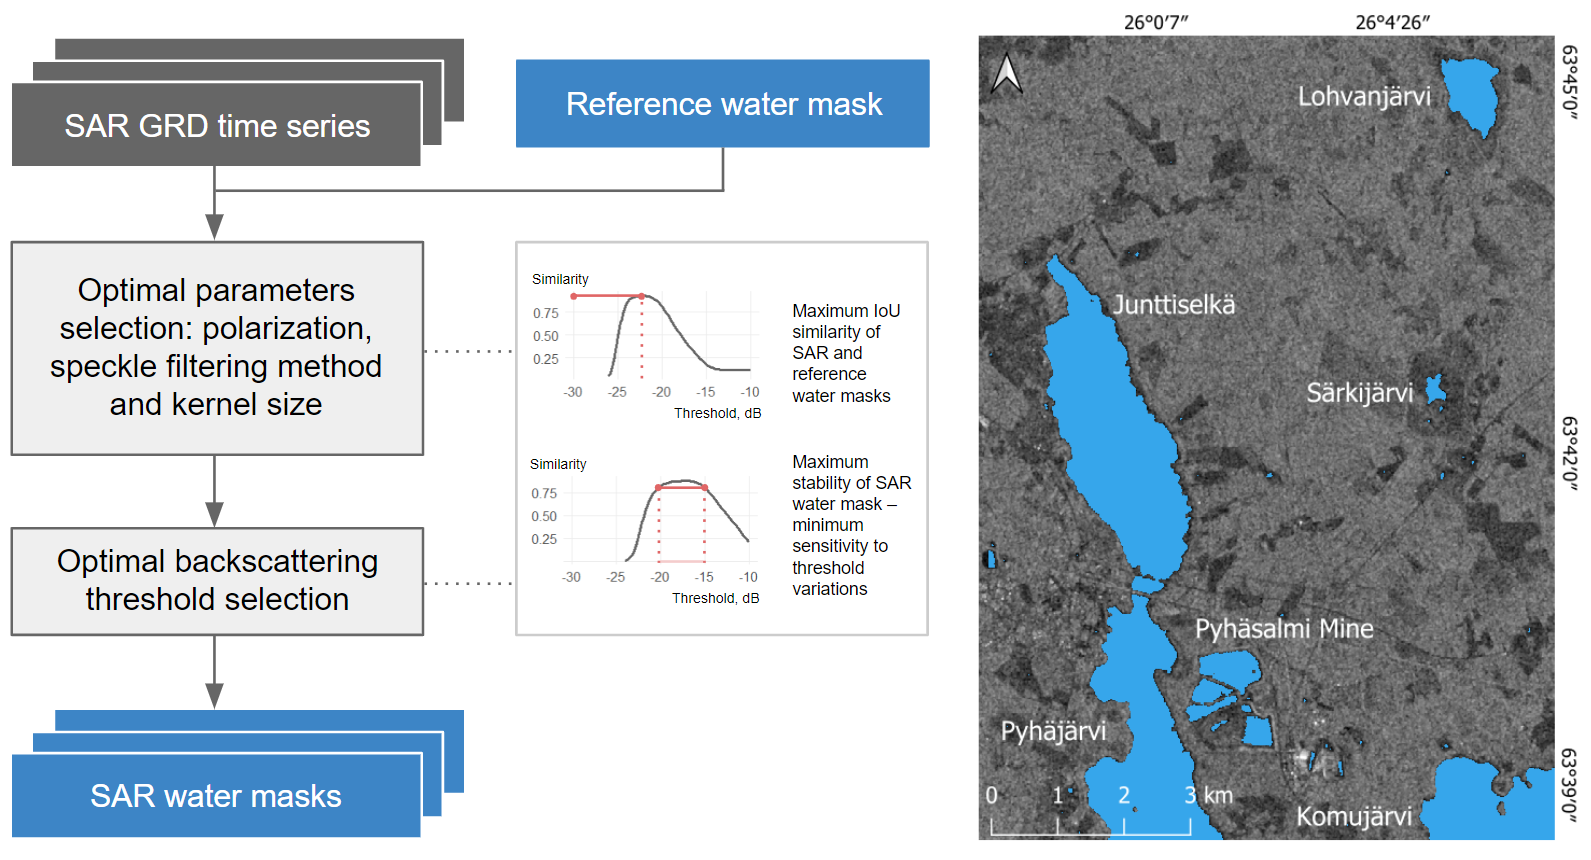
2.3.3. SAR: Proposed Method
2.4. Similarity Measures
- True positive (TP)— pixels are correctly identified as positive (“water”);
- False positive (FP)— pixels are wrongly identified as positive (“water”);
- False negative (FN)— pixels are wrongly identified as negative (“land”).
3. Results
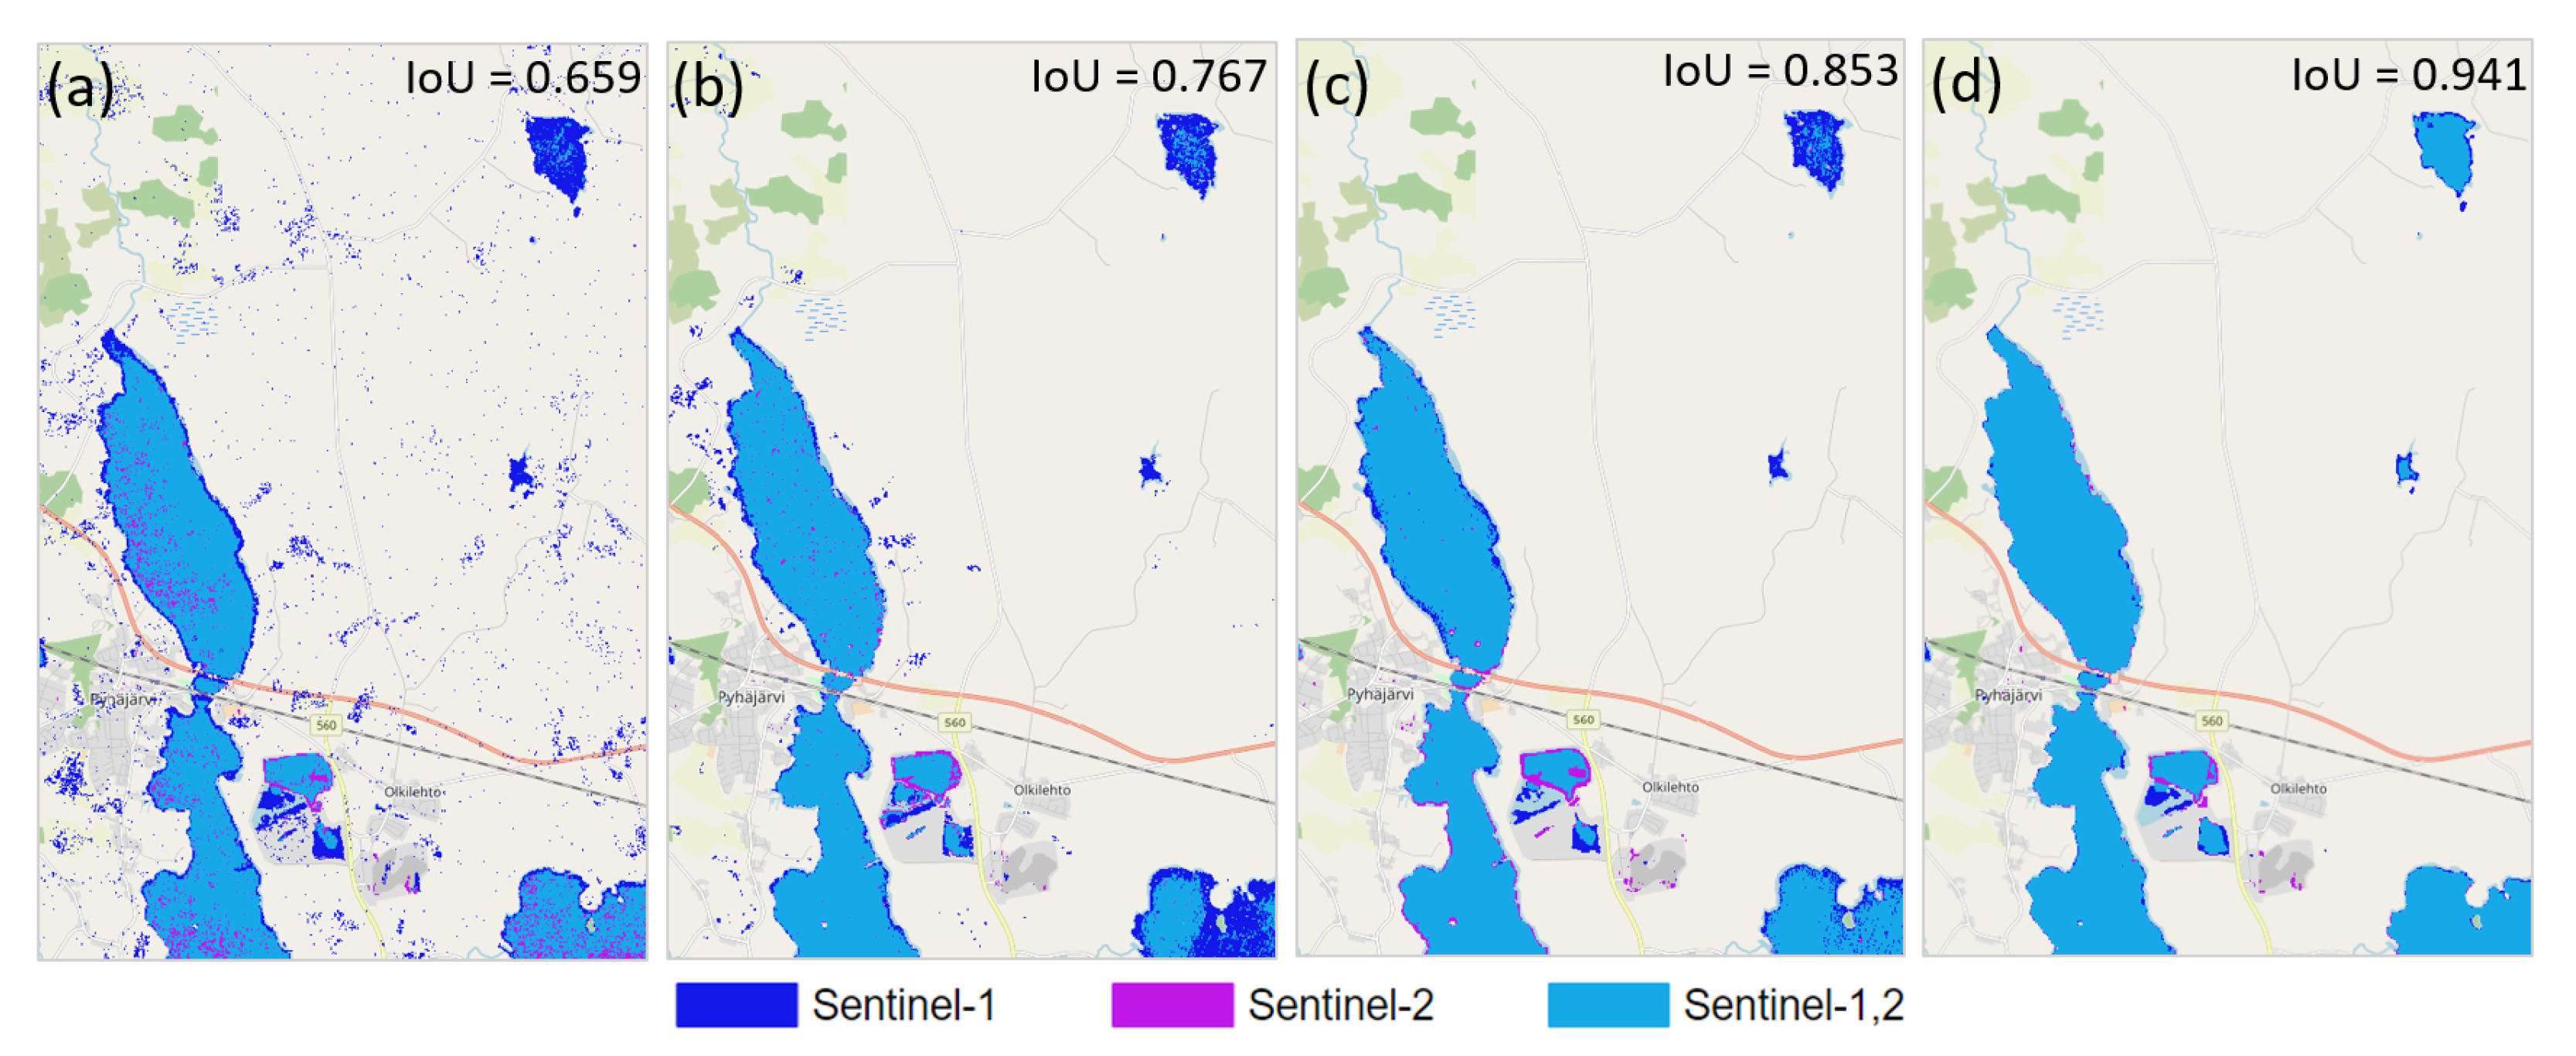
3.1. IoU-Similarity and SAR Mask Quality
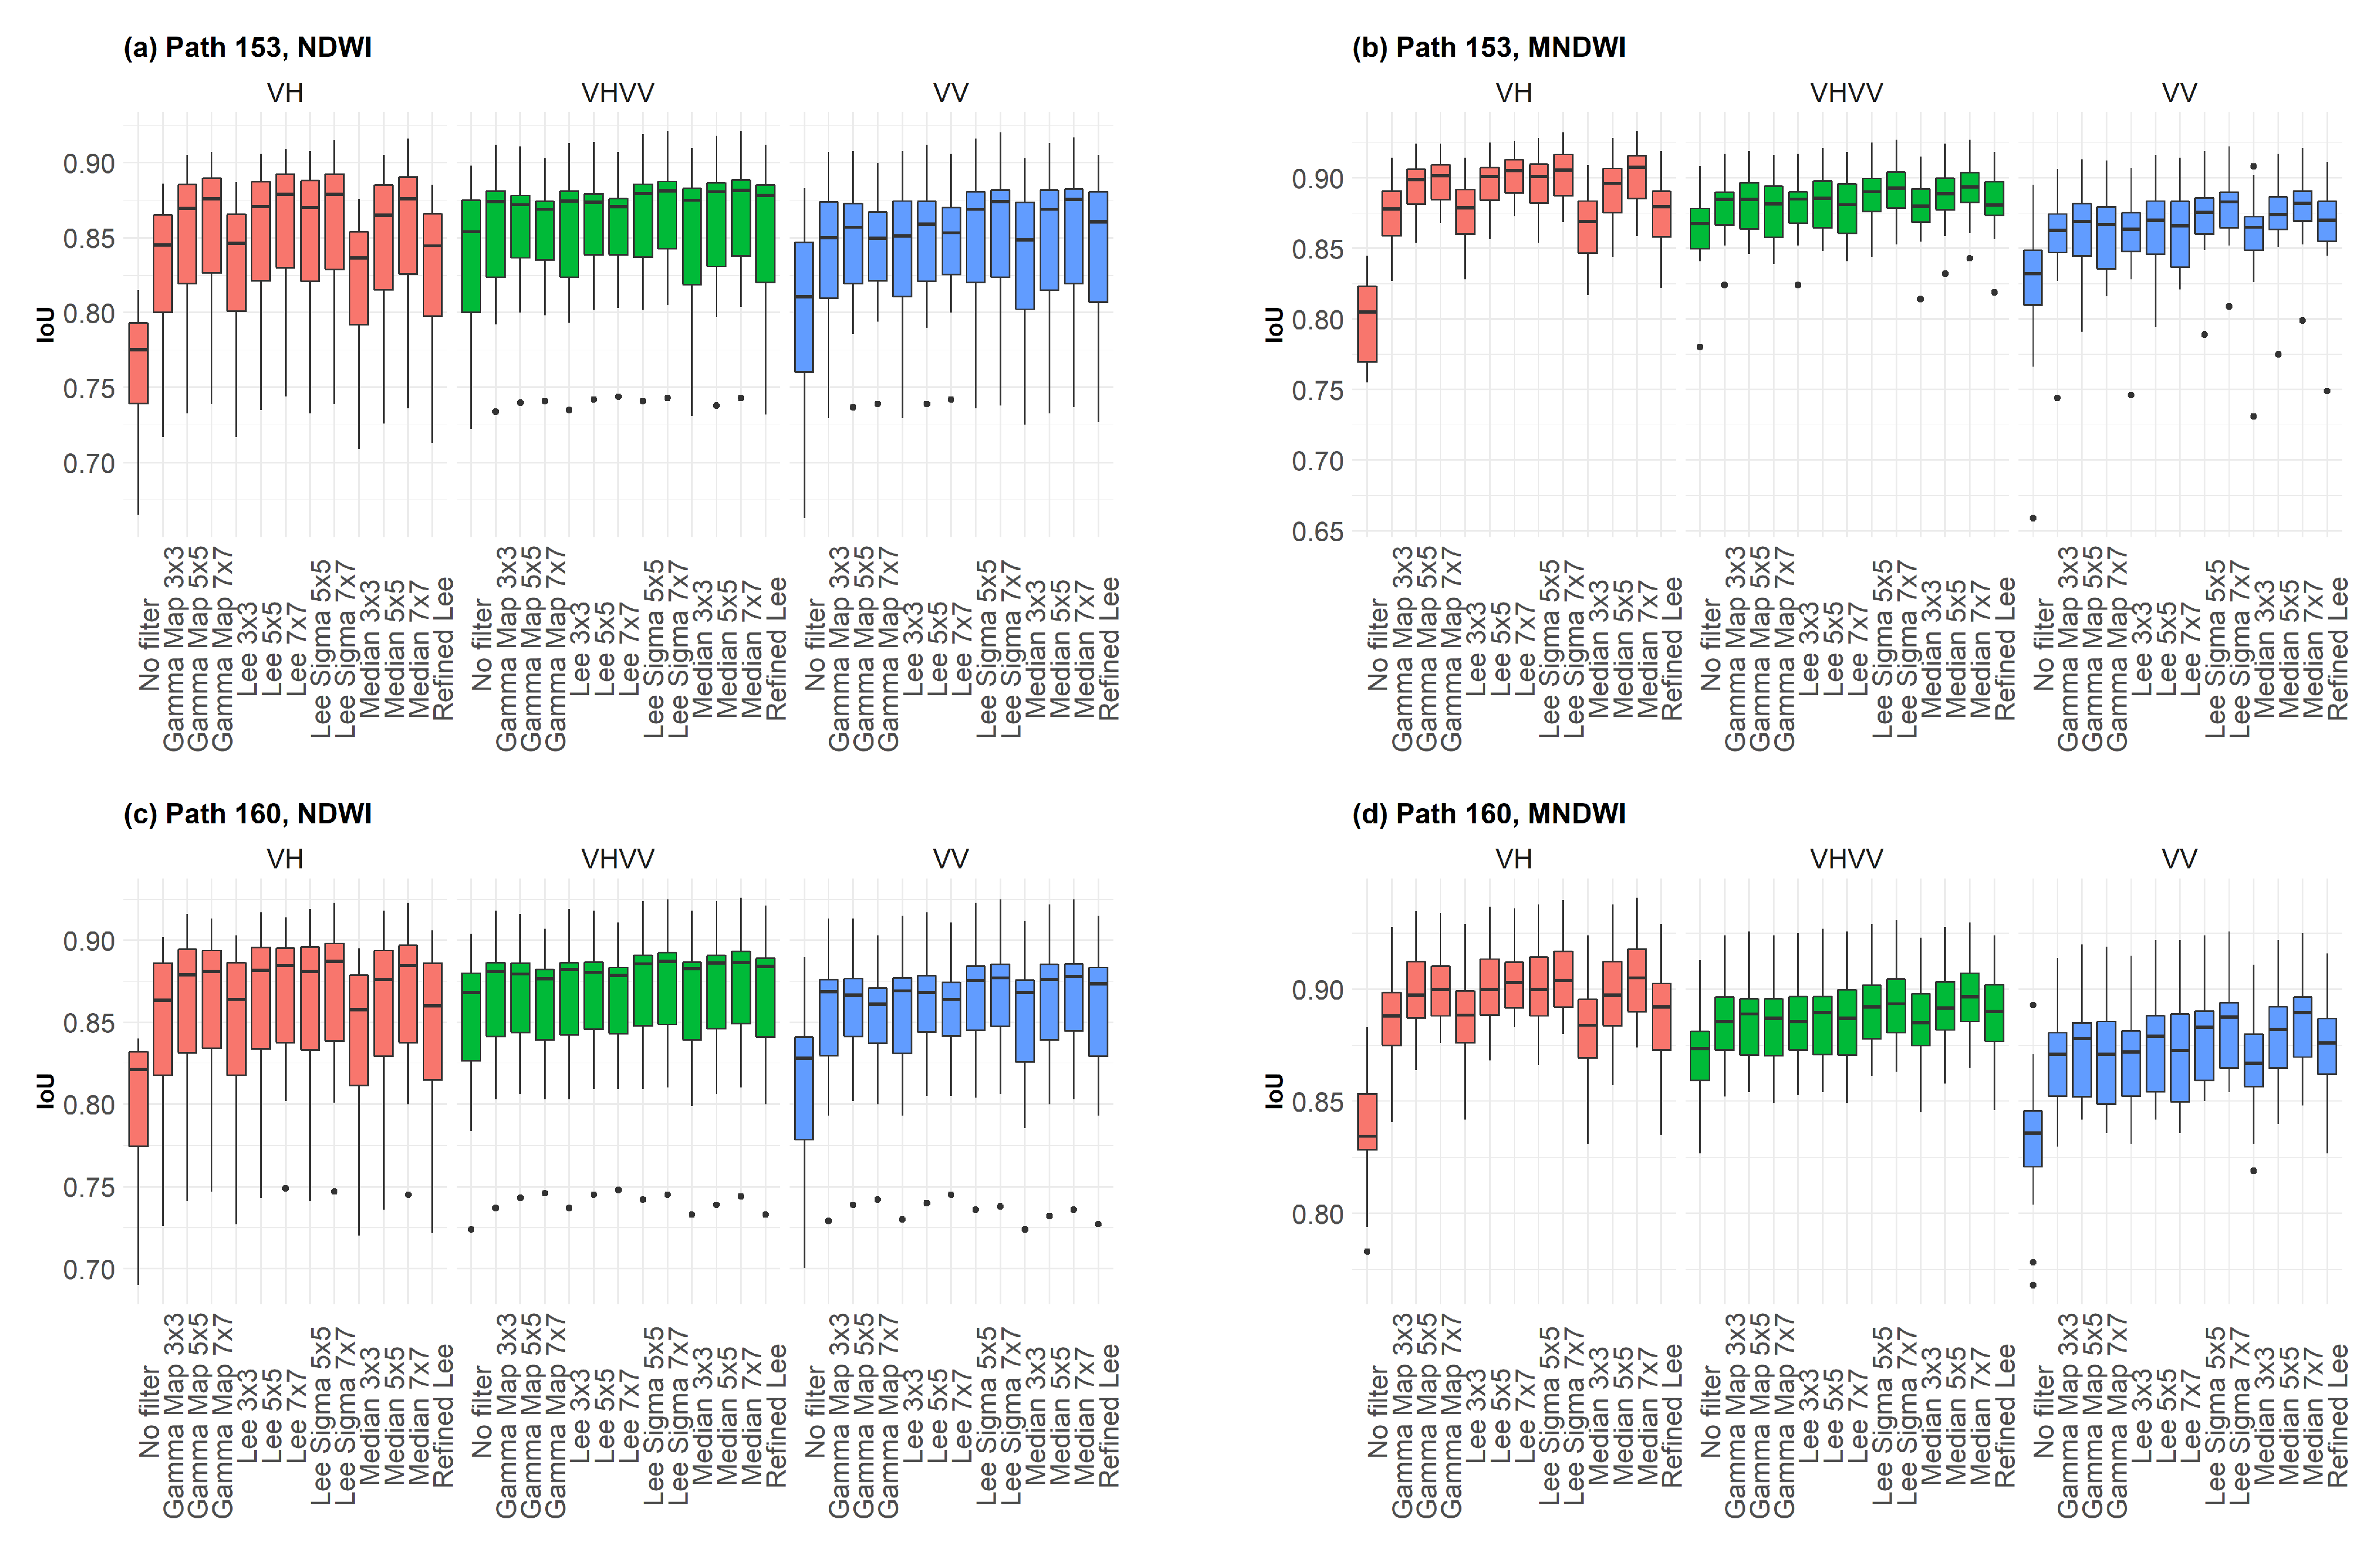
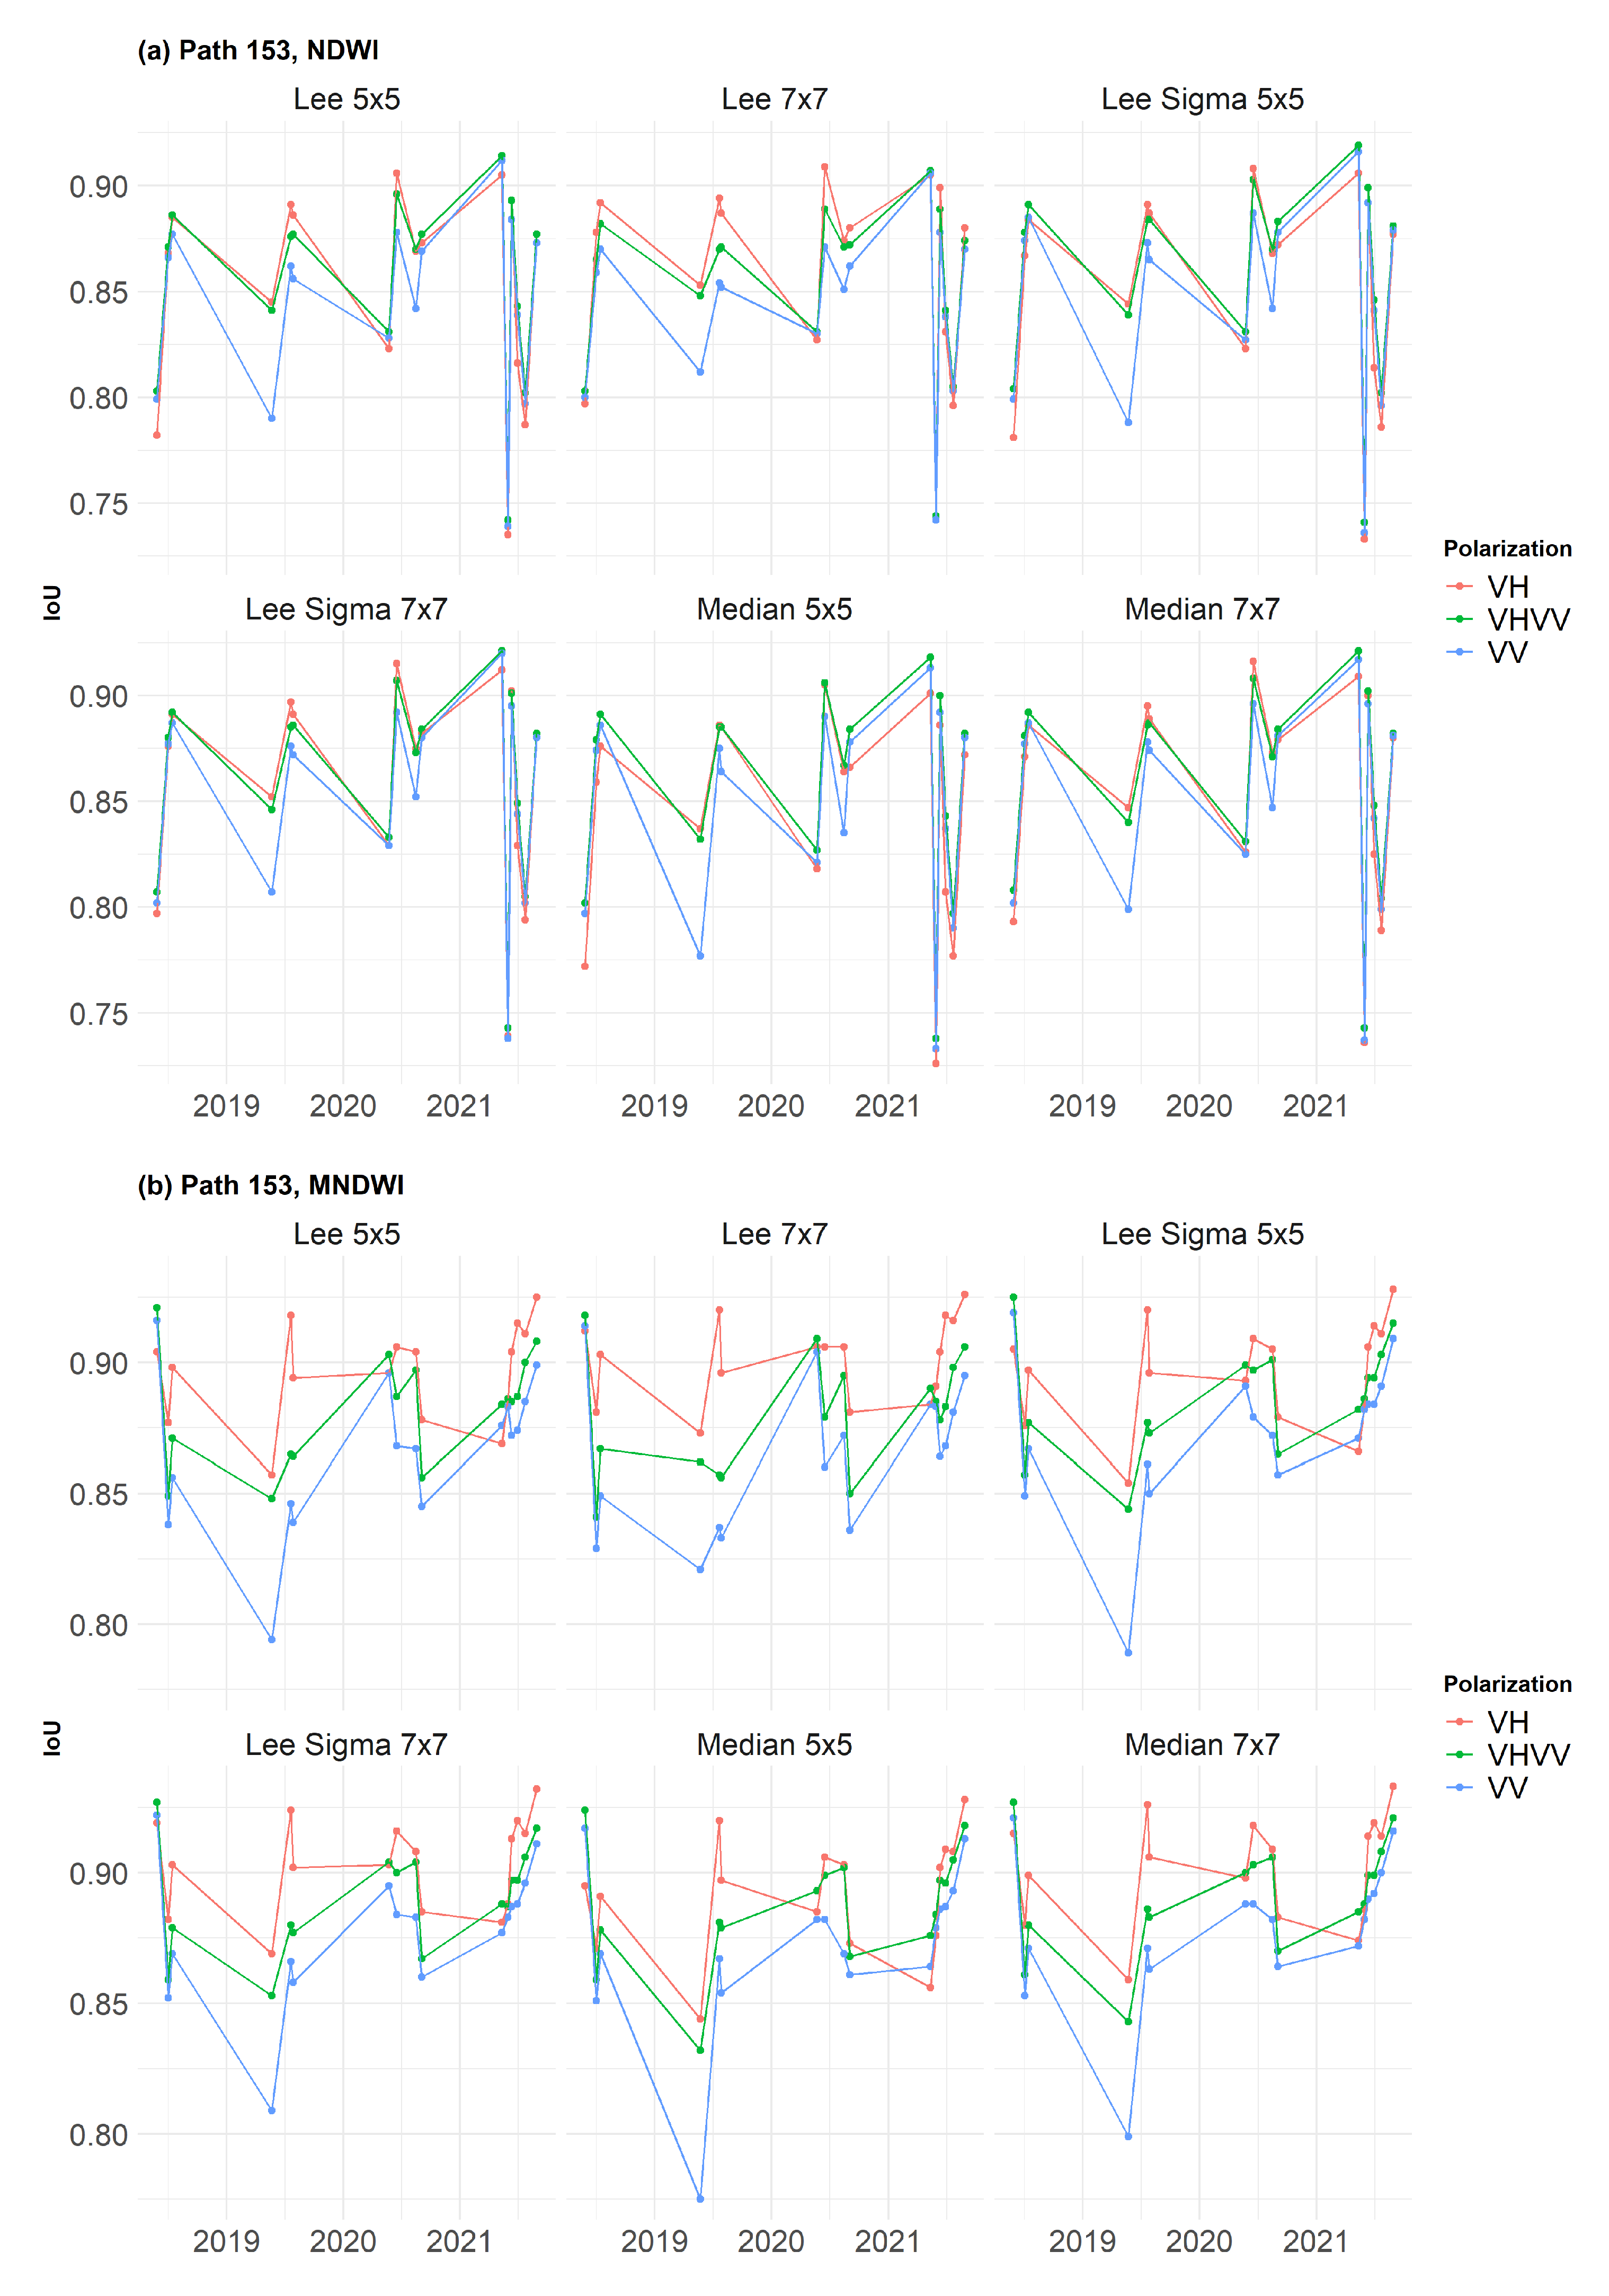
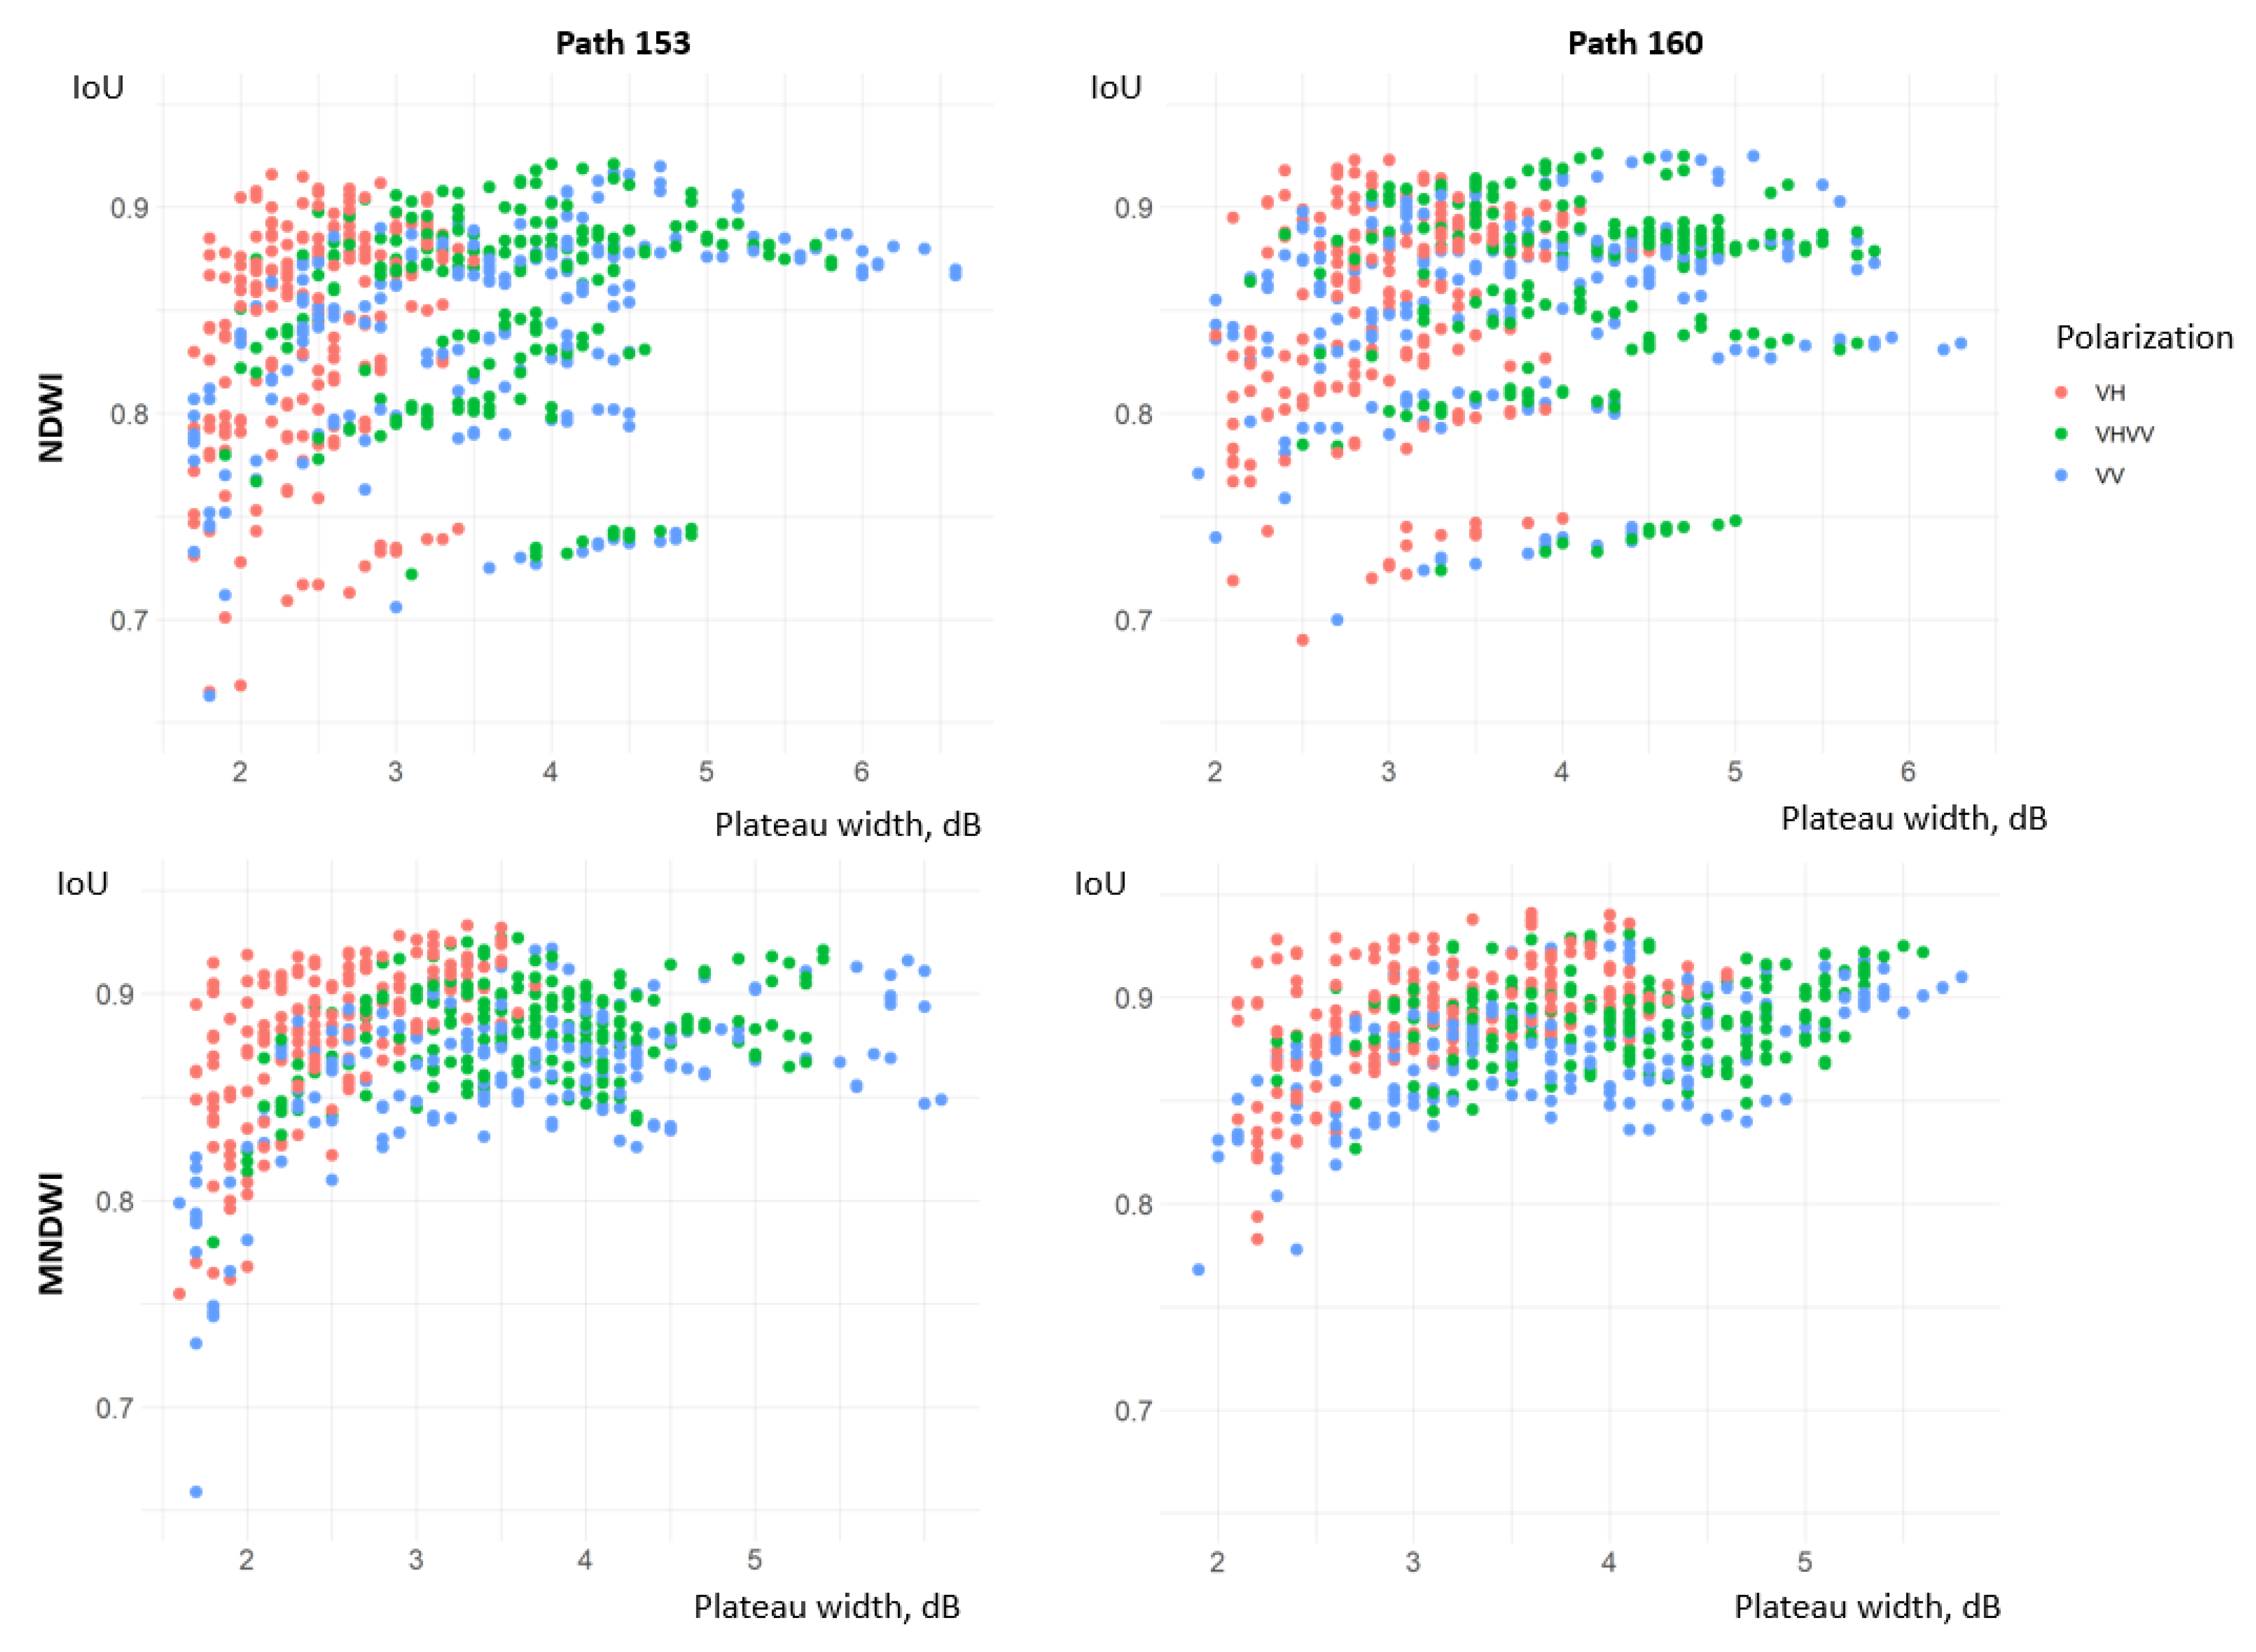
3.2. Selection of Polarization and Speckle Filtering Parameters
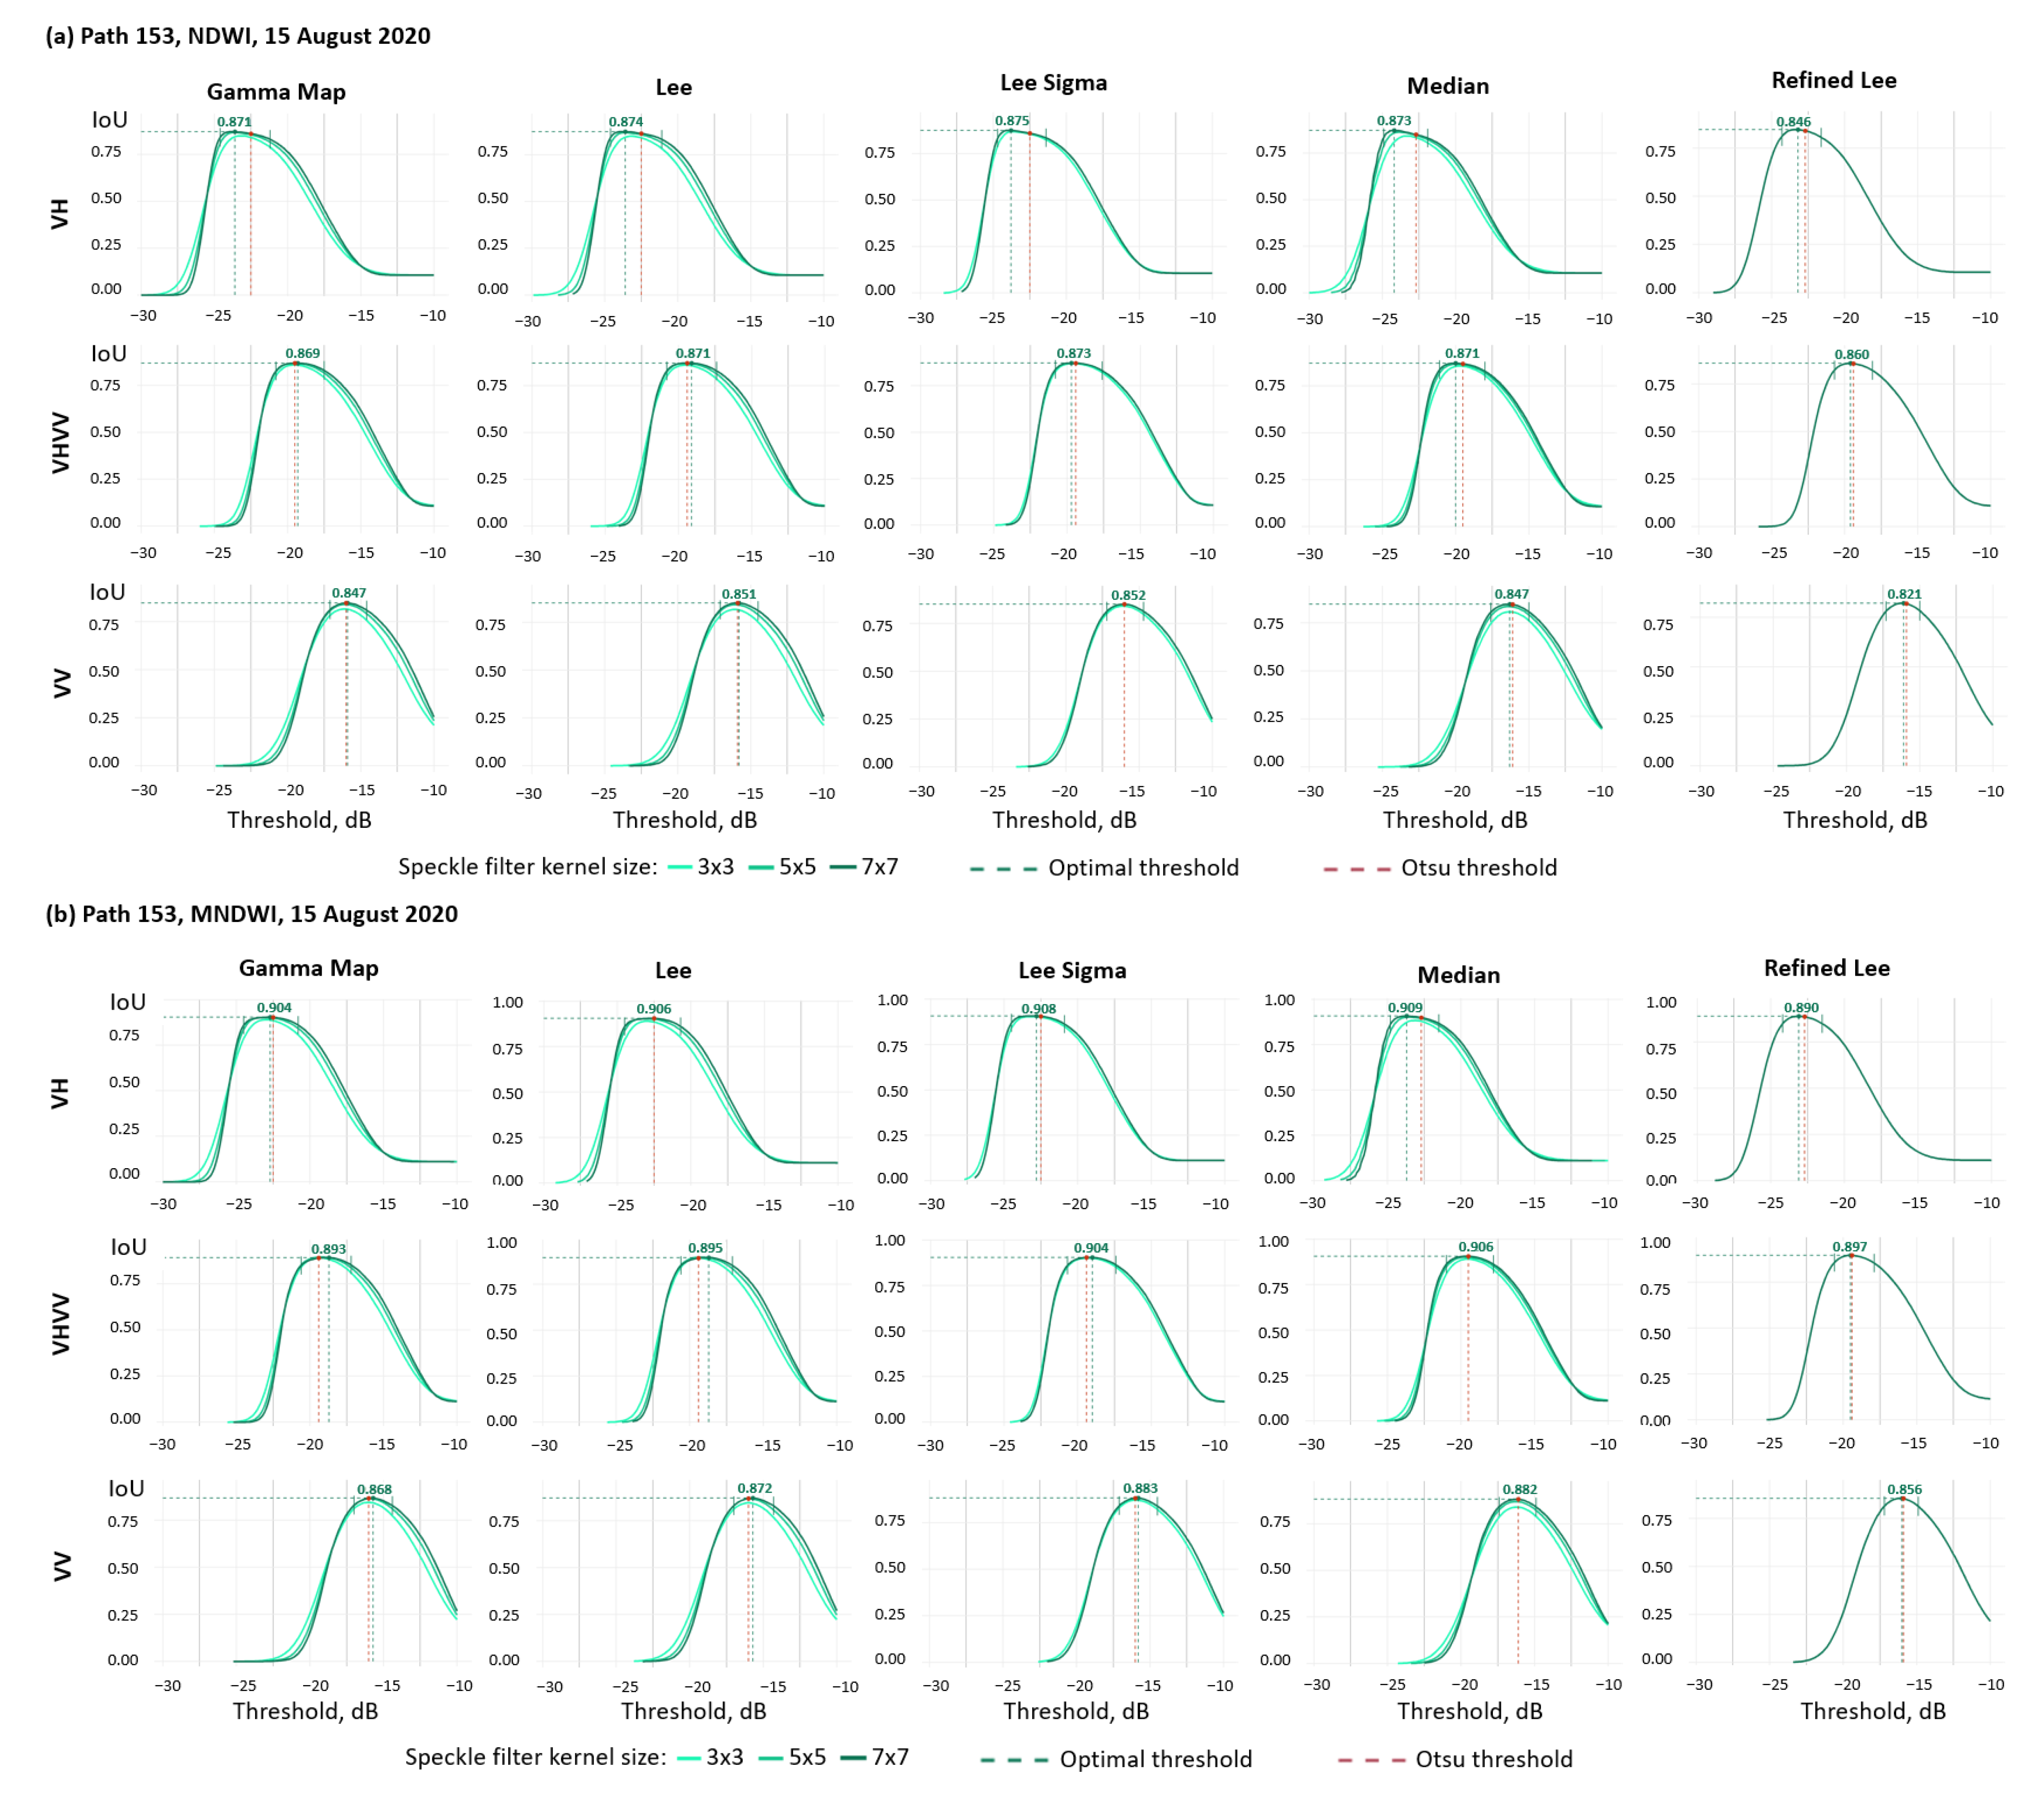
3.2.1. Maximum Mask Similarity
3.2.2. Sensitivity Analysis
- —Gamma Map, Lee, Lee Sigma, Median filters with a kernel size of 7 × 7;
- , —Gamma Map, Lee, Lee Sigma, Median filters with kernel sizes 5 × 5 and 7 × 7.
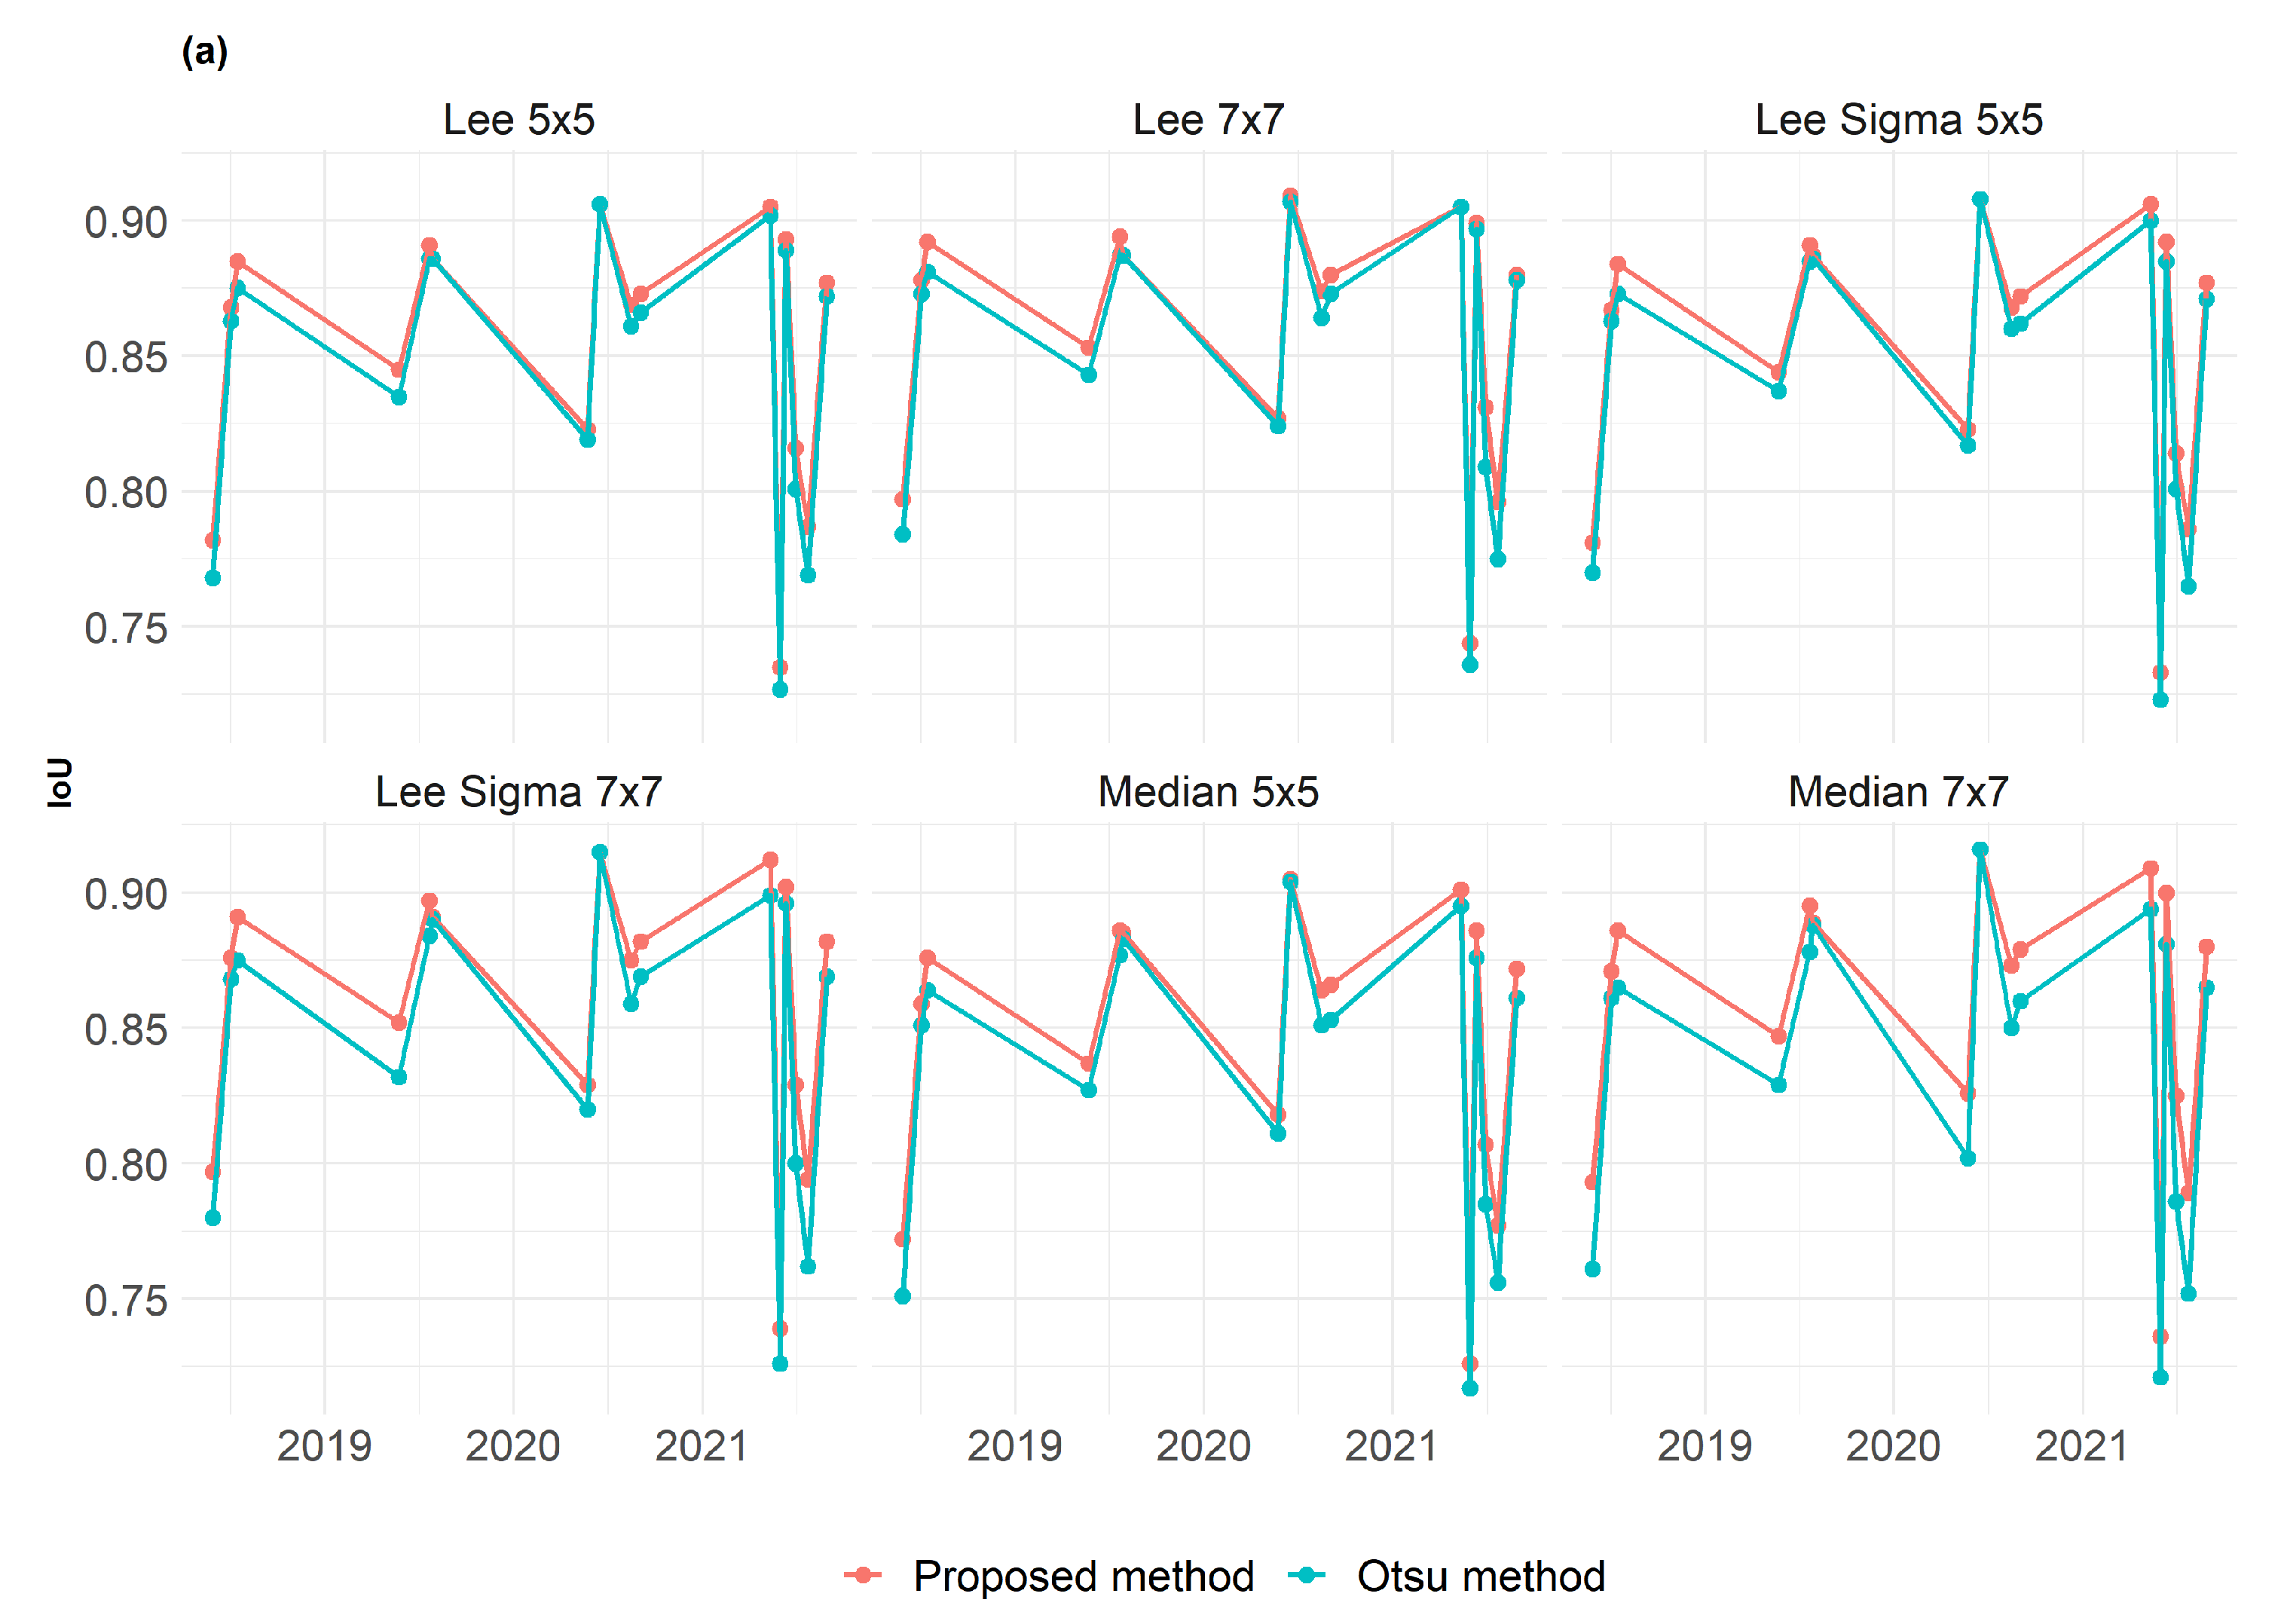
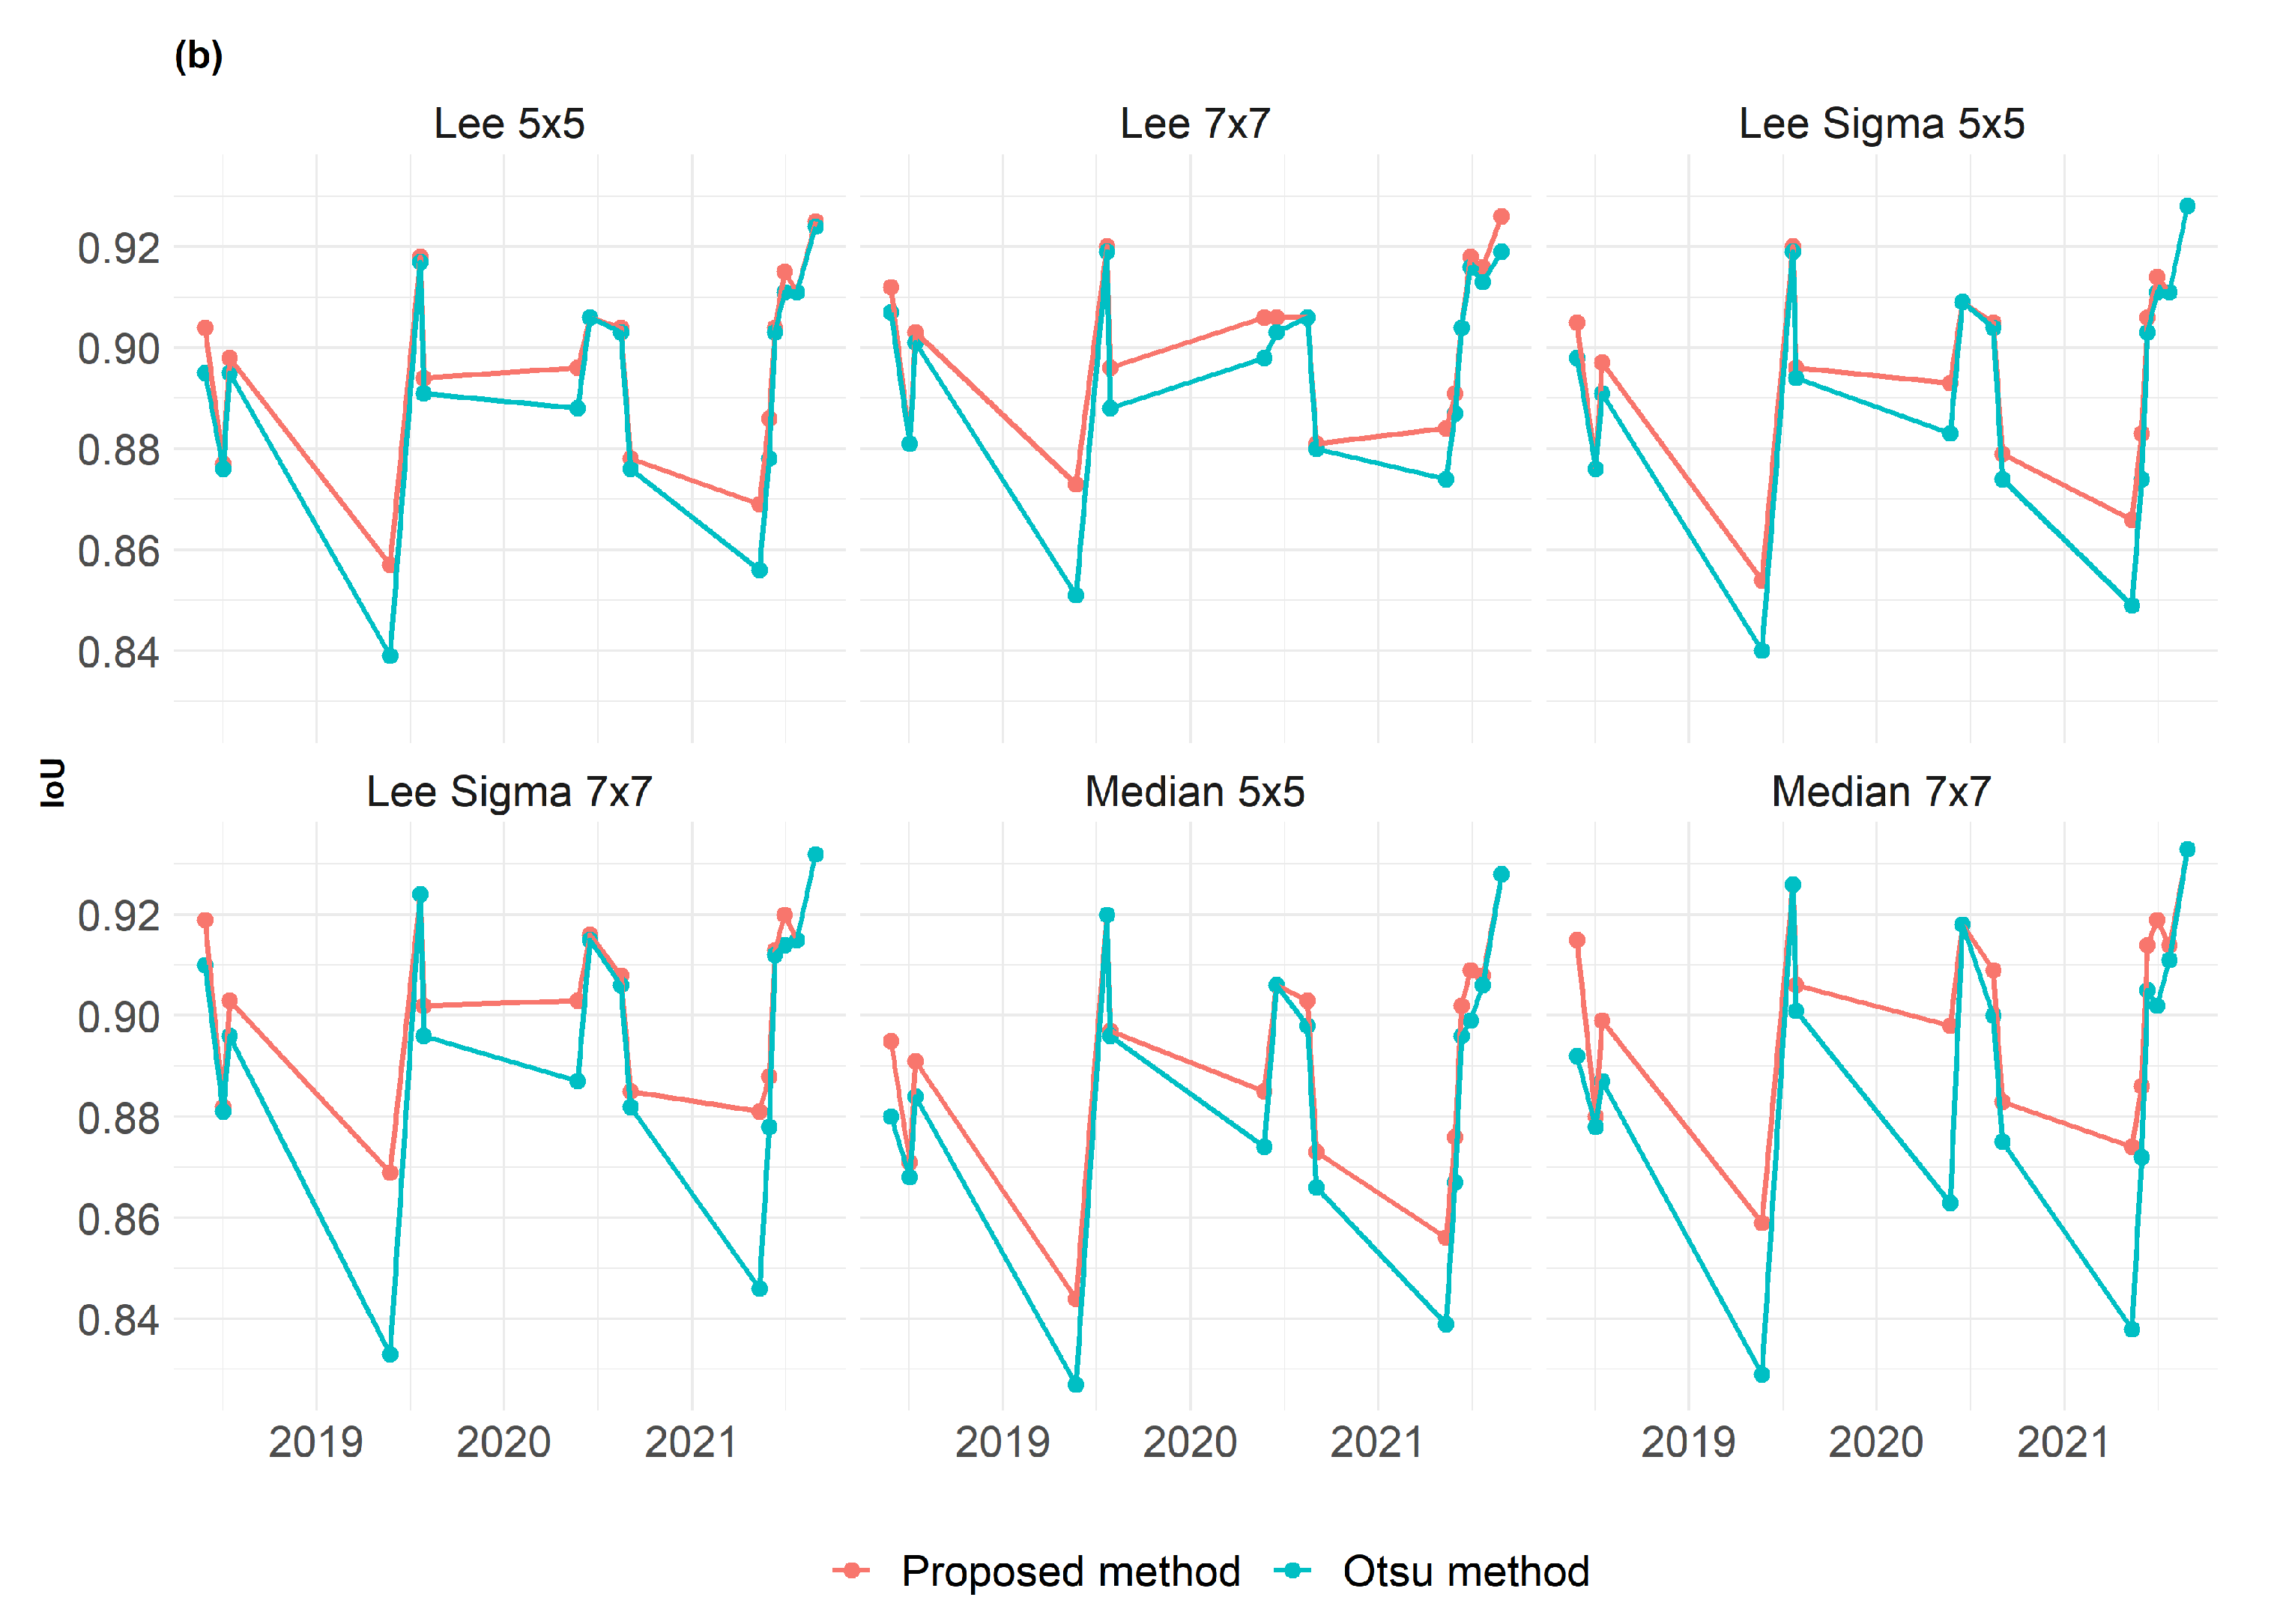
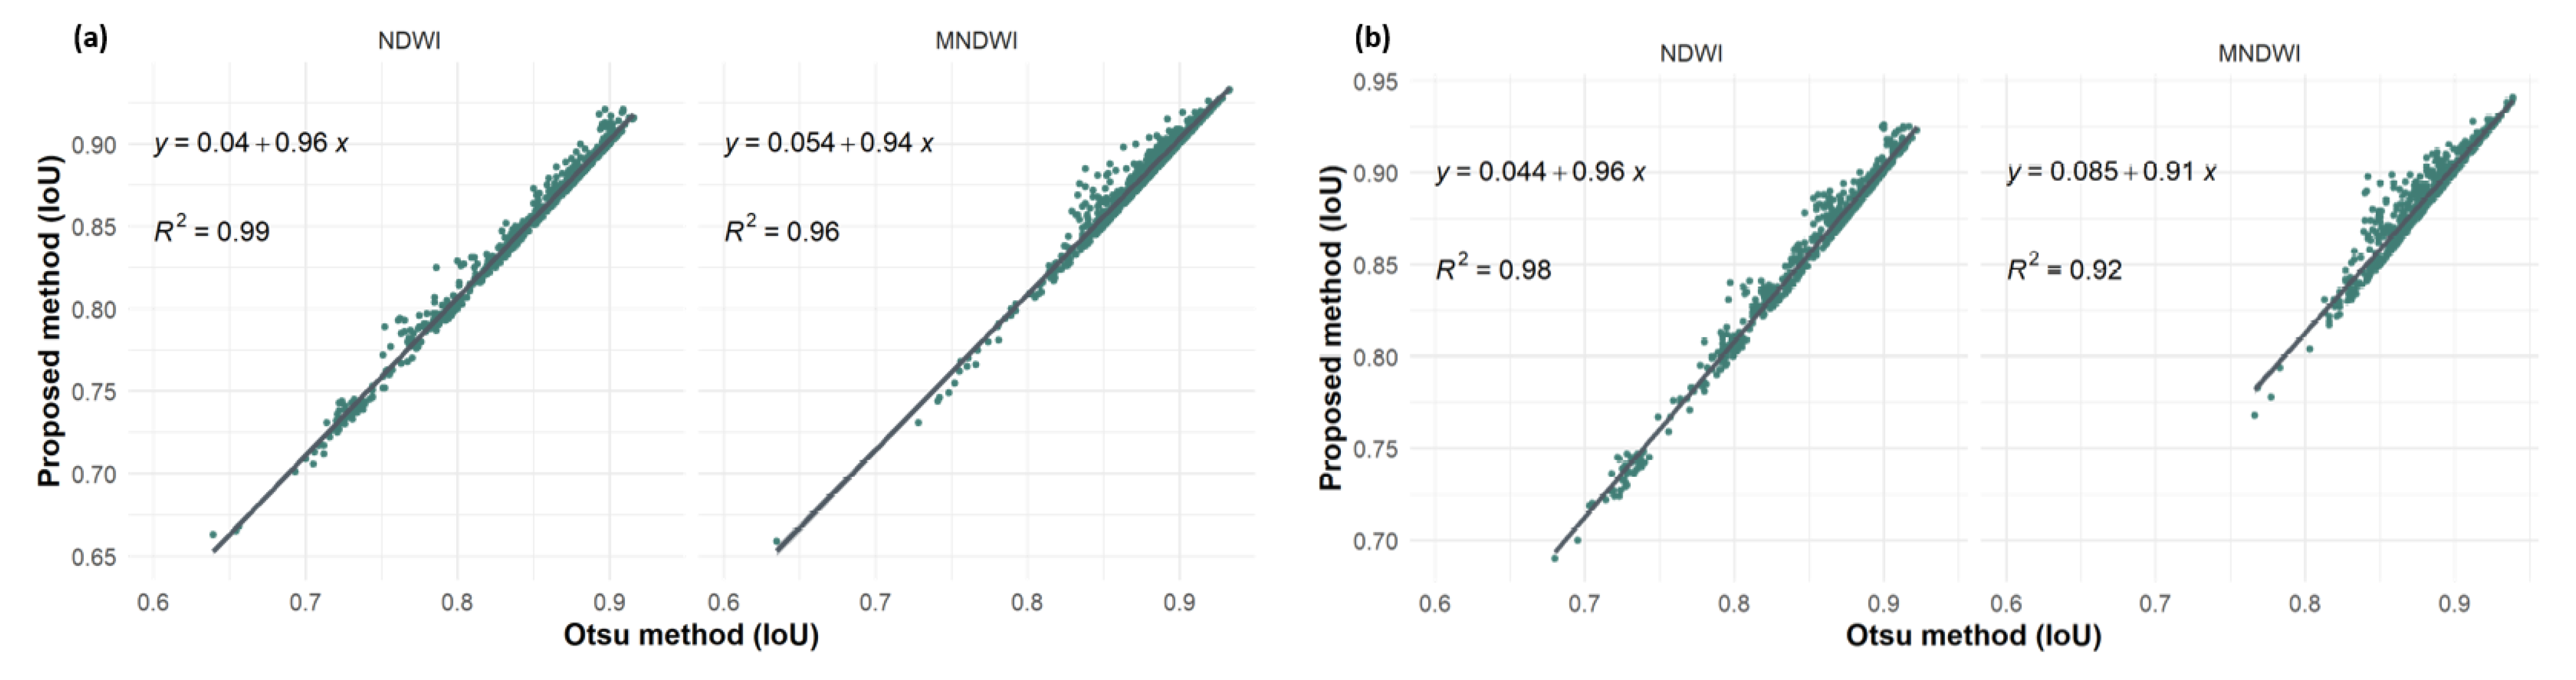
3.3. Comparison with the Otsu Method
3.3.1. Similarity When the Reference Mask Is Available
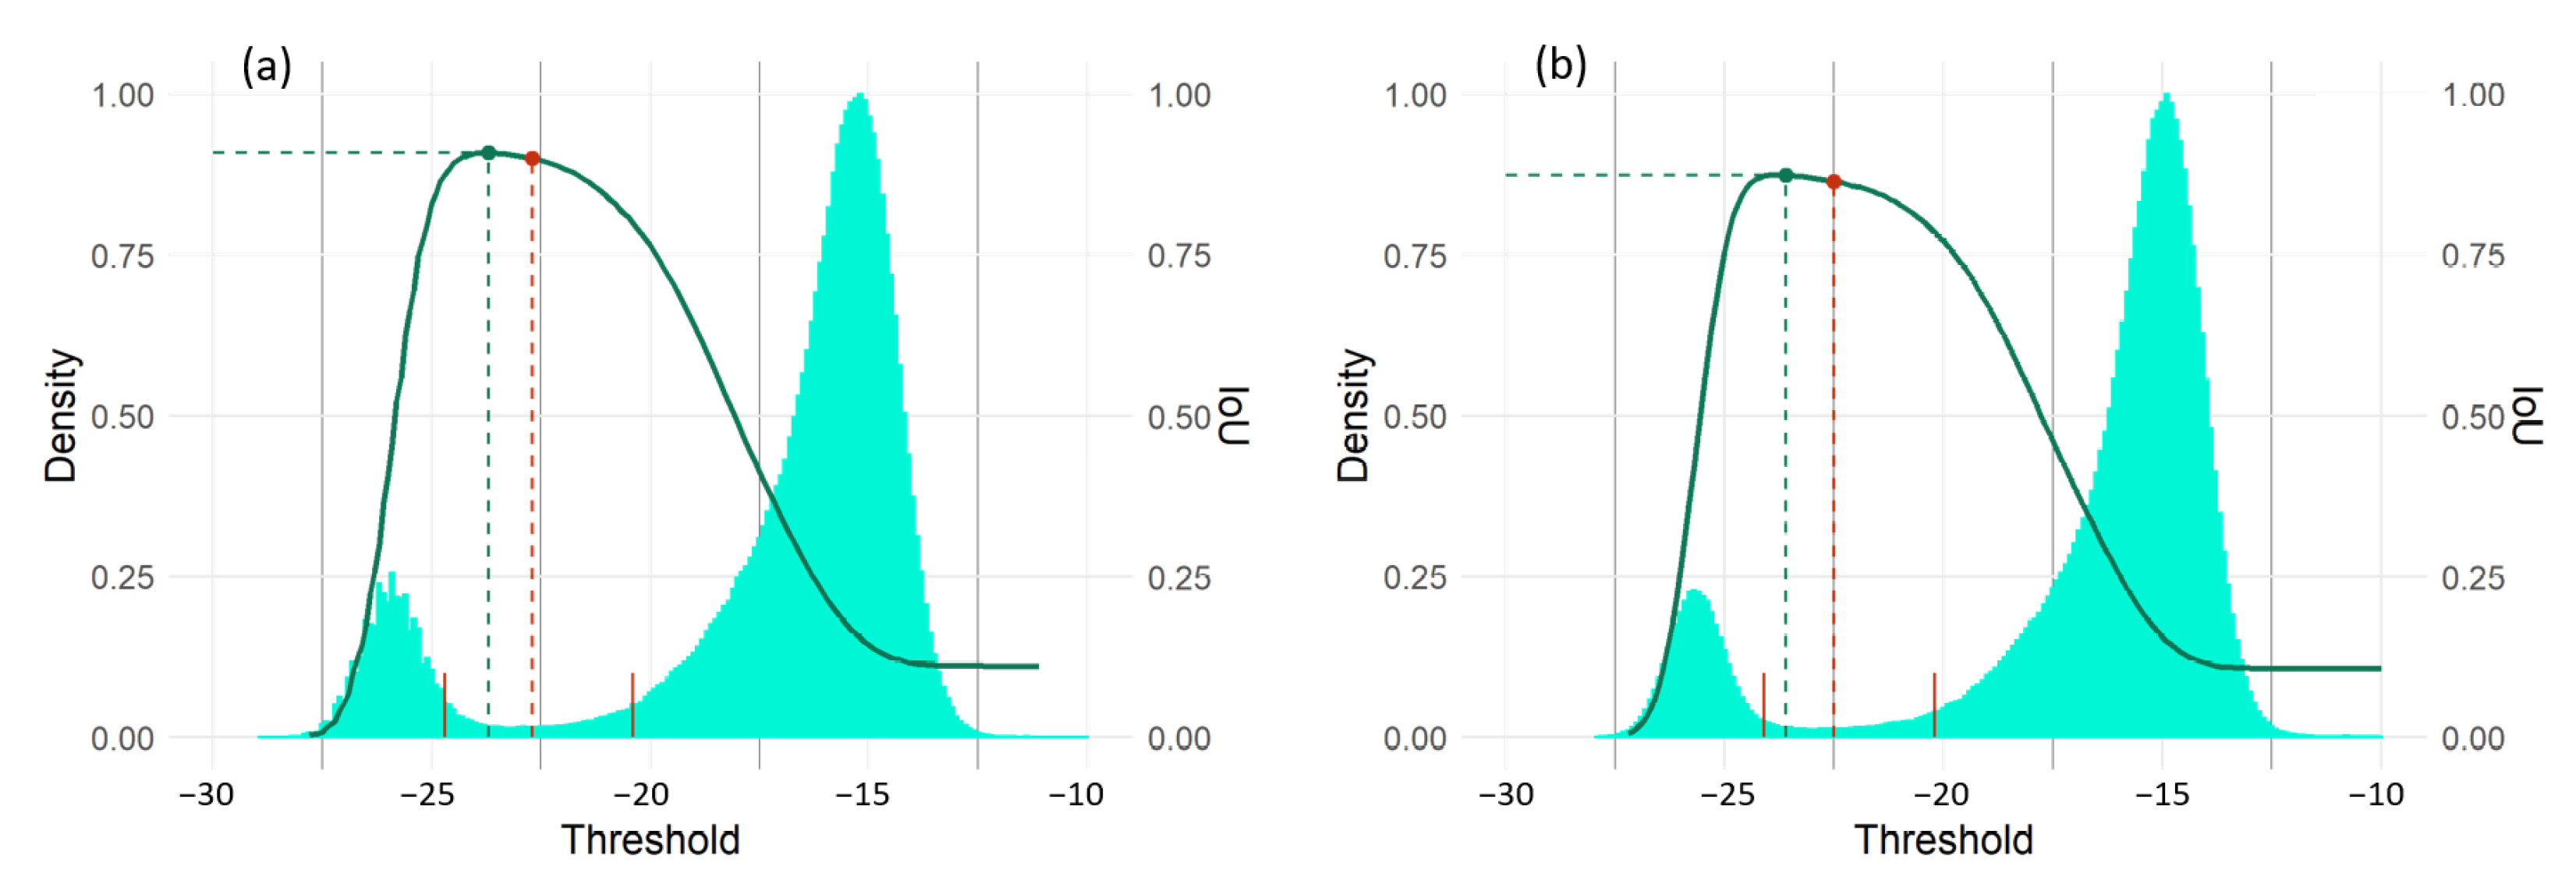
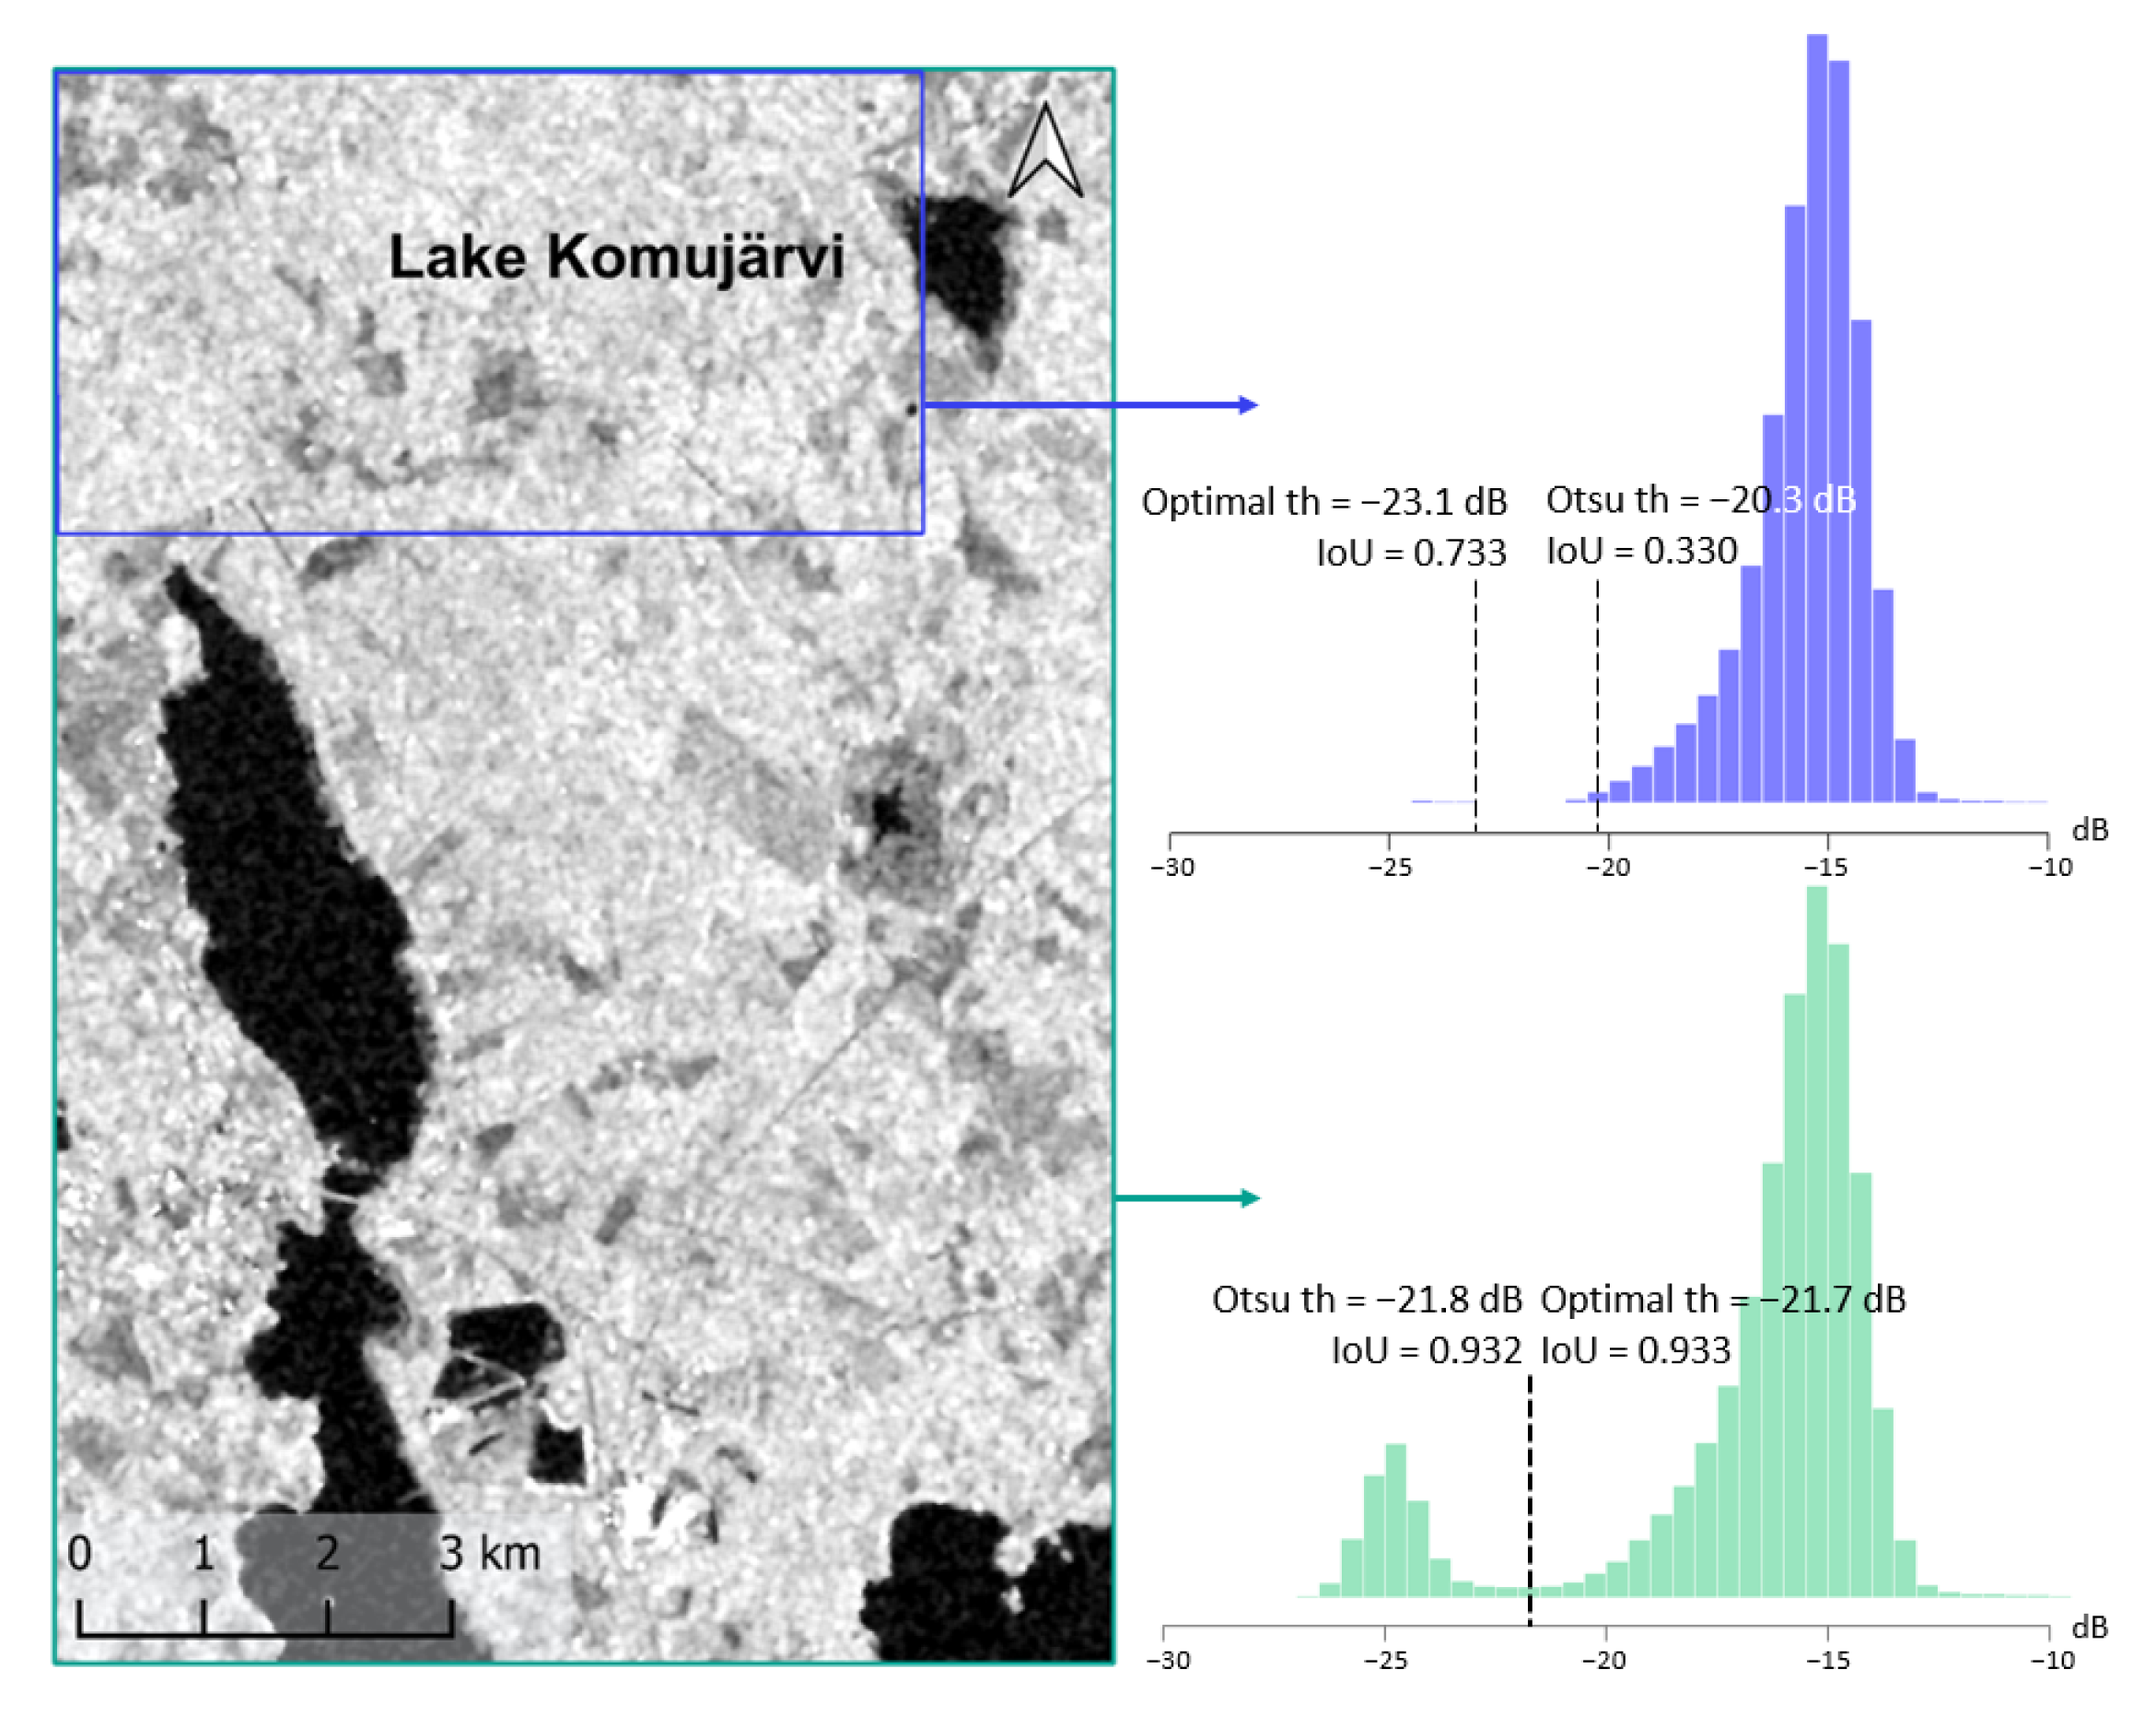
3.3.2. Threshold Arrangement
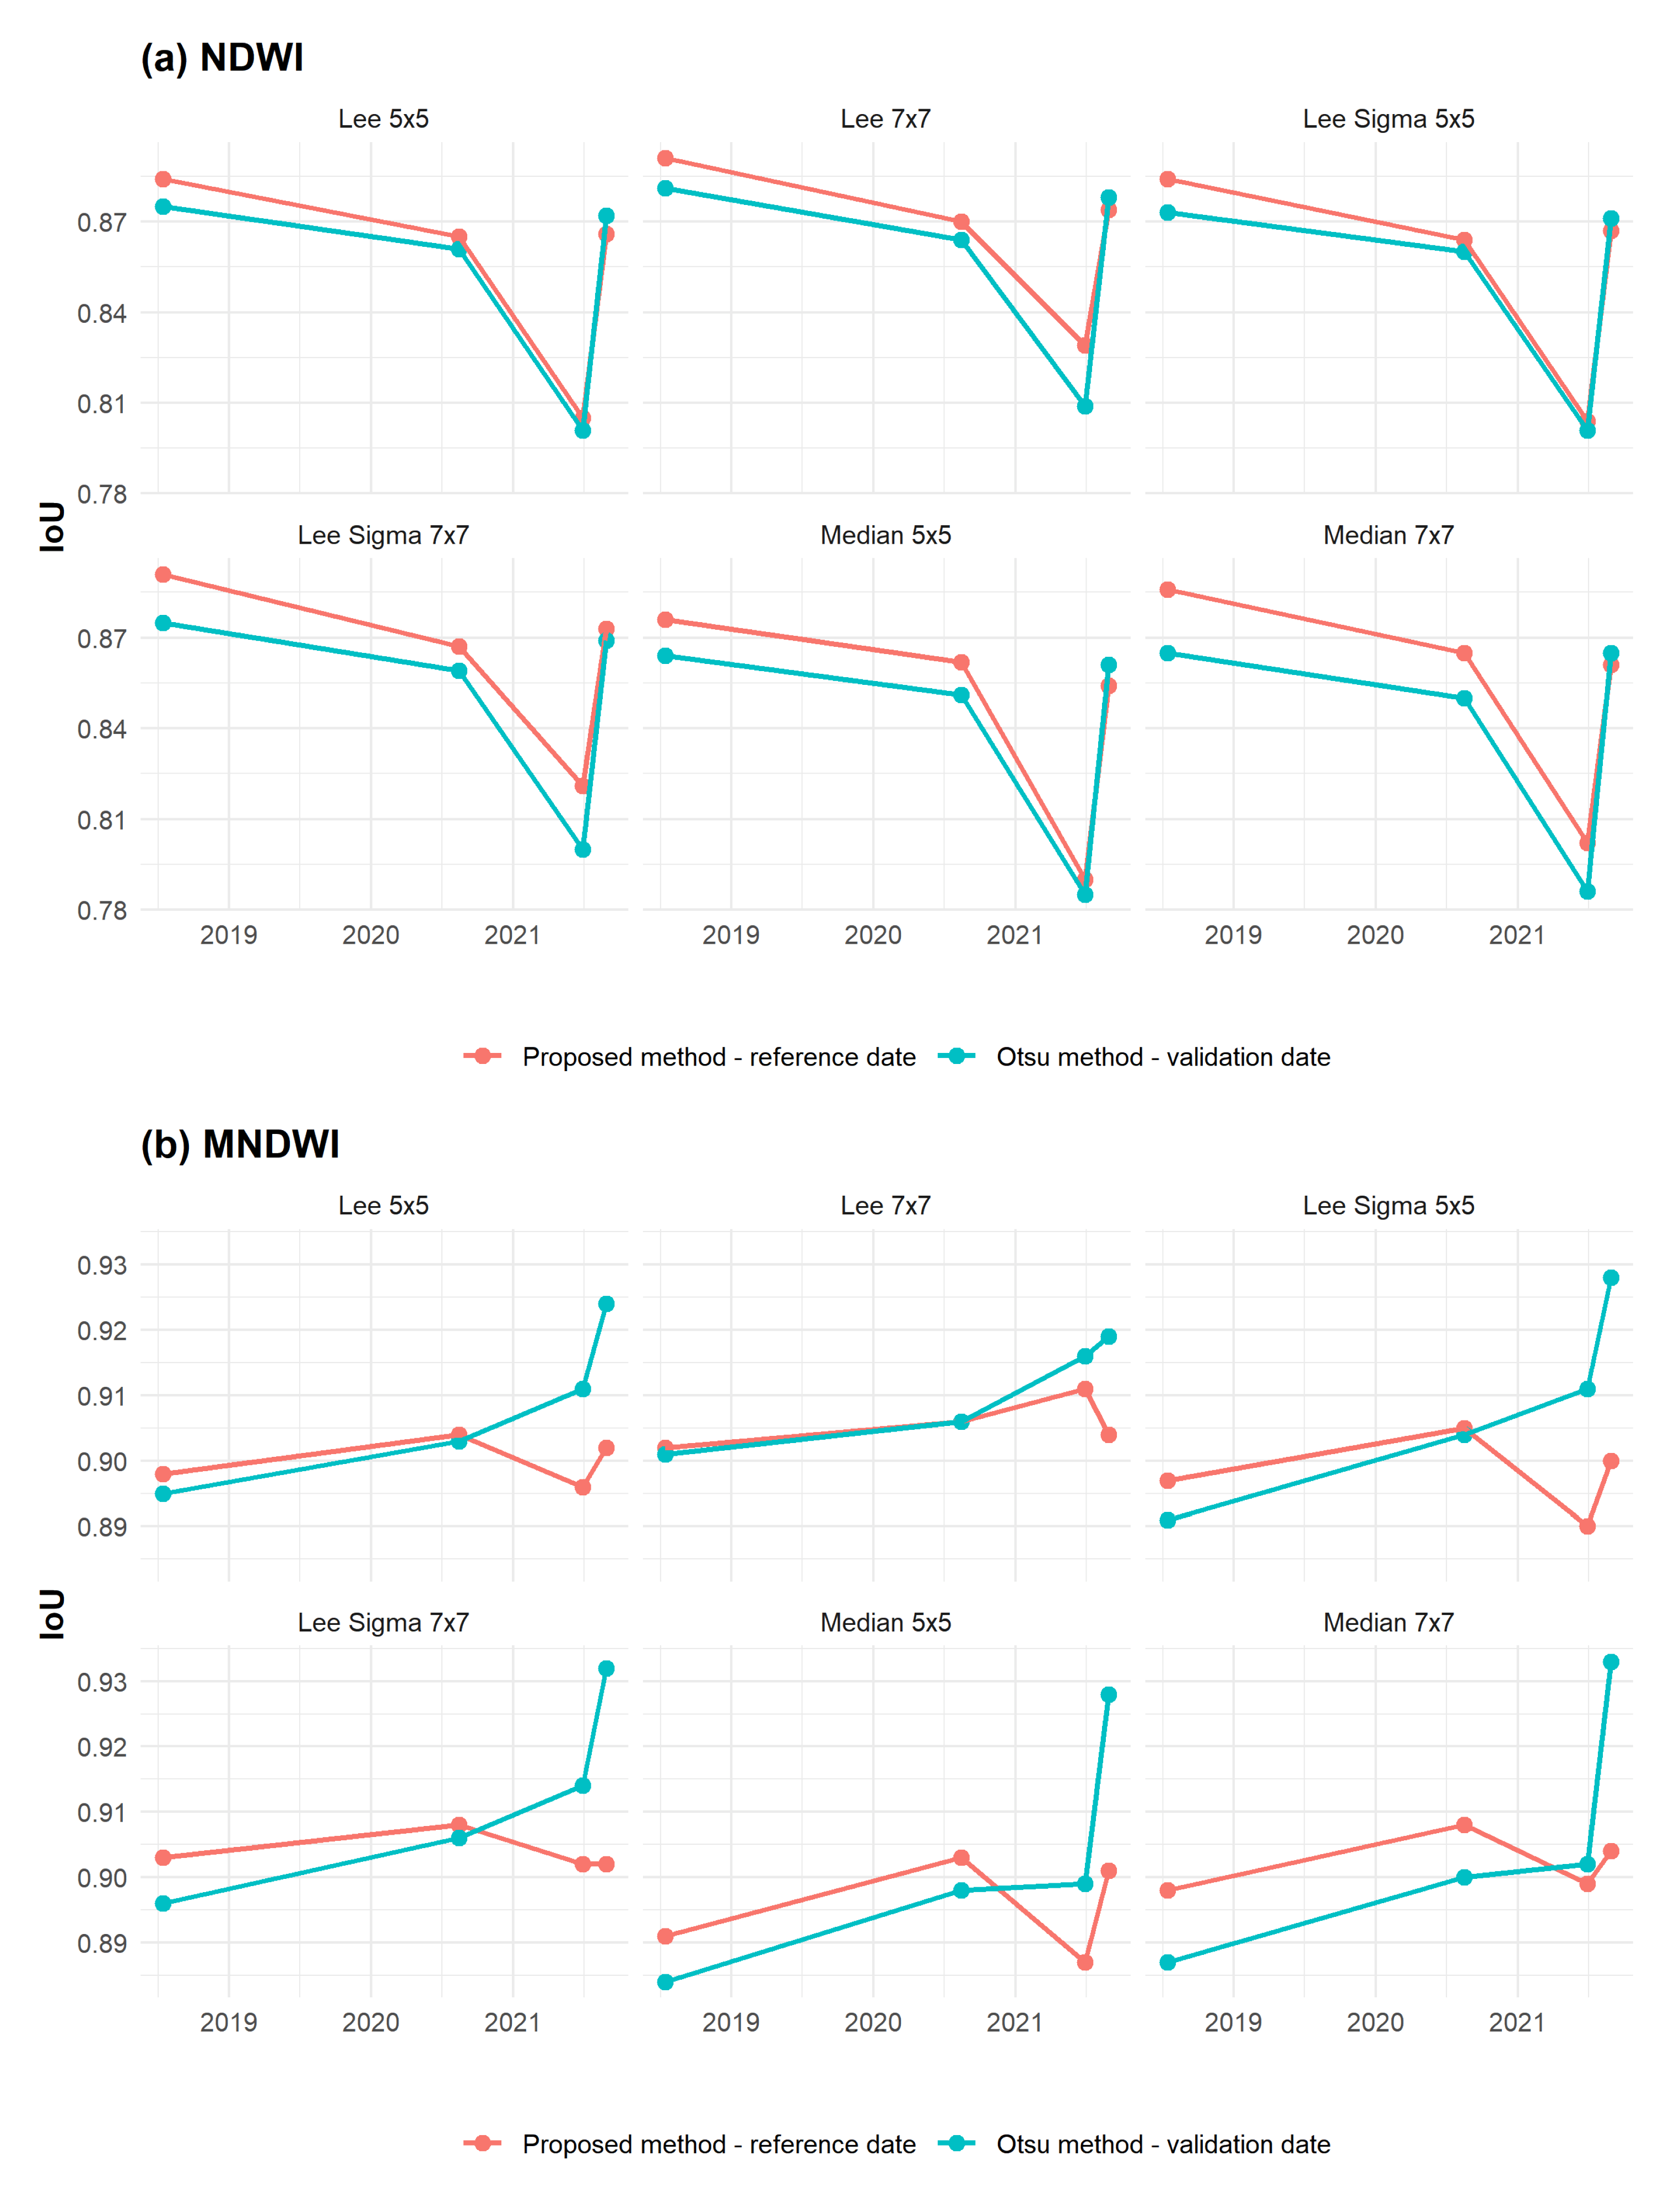
3.3.3. Similarity without Reference Masks
- 3 July 2018–15 July 2018;
- 16 June 2020–15 August 2020;
- 11 June 2021–29 June 2021;
- 11 June 2021–28 August 2021.
4. Discussion
4.1. Analysis of the Results Discrepancies
4.1.1. Discrepancies in Reference Masks
4.1.2. Variations in Accuracy of the Results
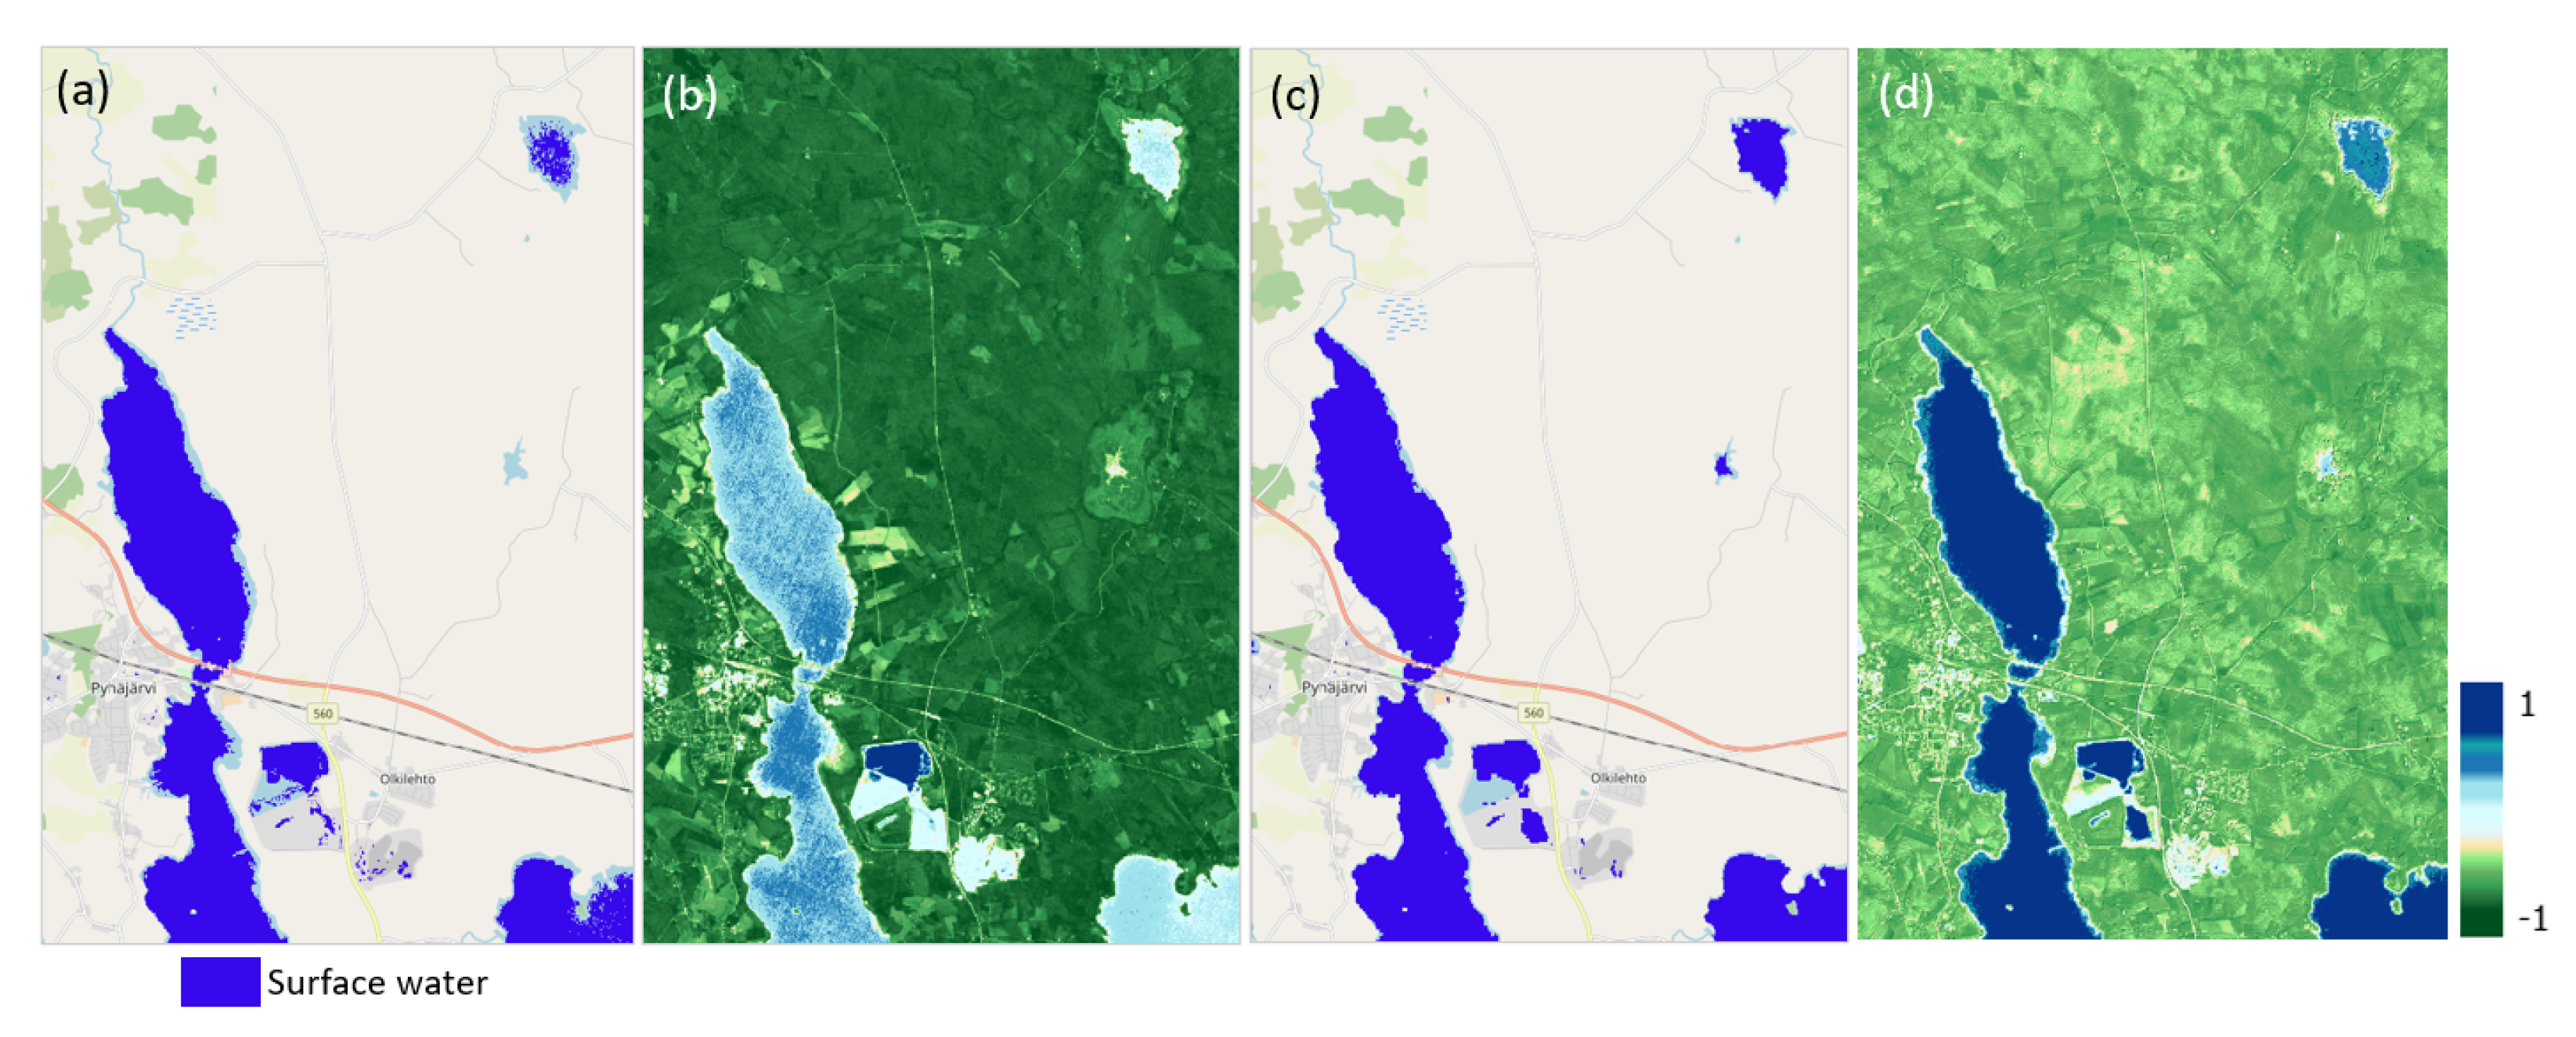
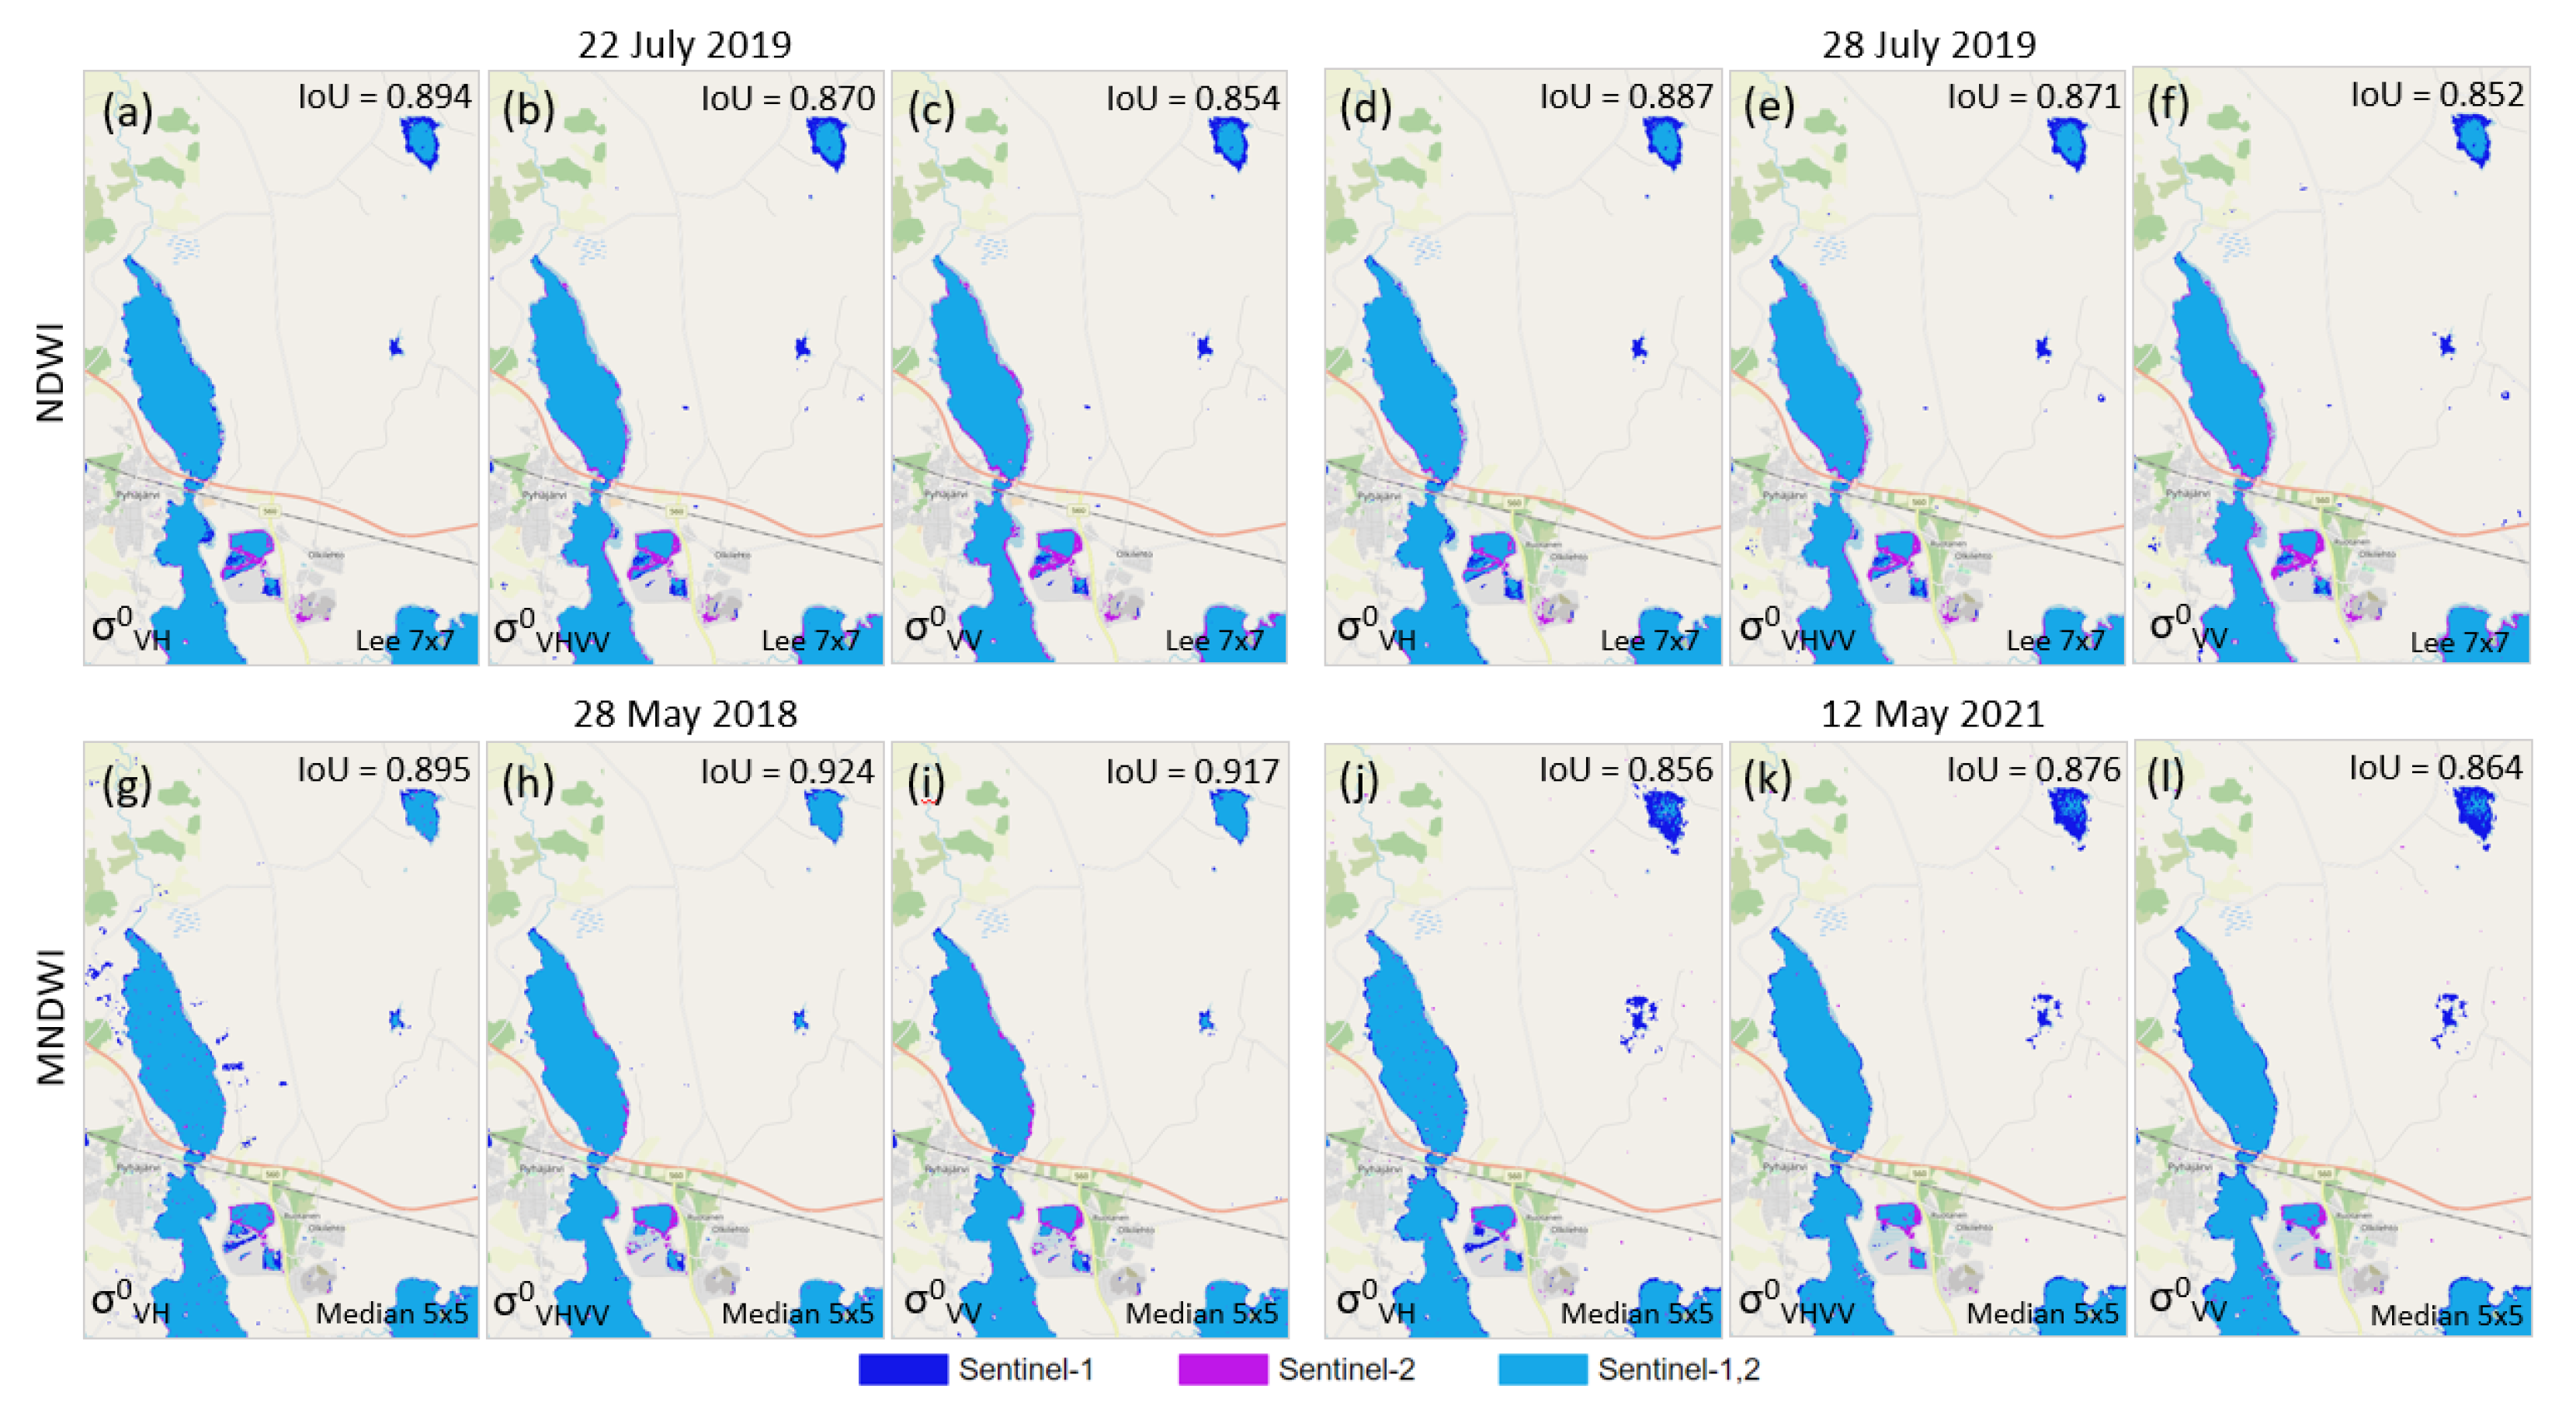
- The presence of false positive noise on water masks , which cannot be filtered (Figure 16c,f).
- Peculiarities of speckle filtering, due to the large kernel size. The water bodies area has decreased, which affected the overall accuracy of IoU = 0.870 (for comparison, on 22 July 2019 the Lee 5 × 5 filtering provides IoU = 0.876, with Lee 3 × 3 filtering IoU = 0.879).
4.2. “Water”/“Land” Class Imbalance
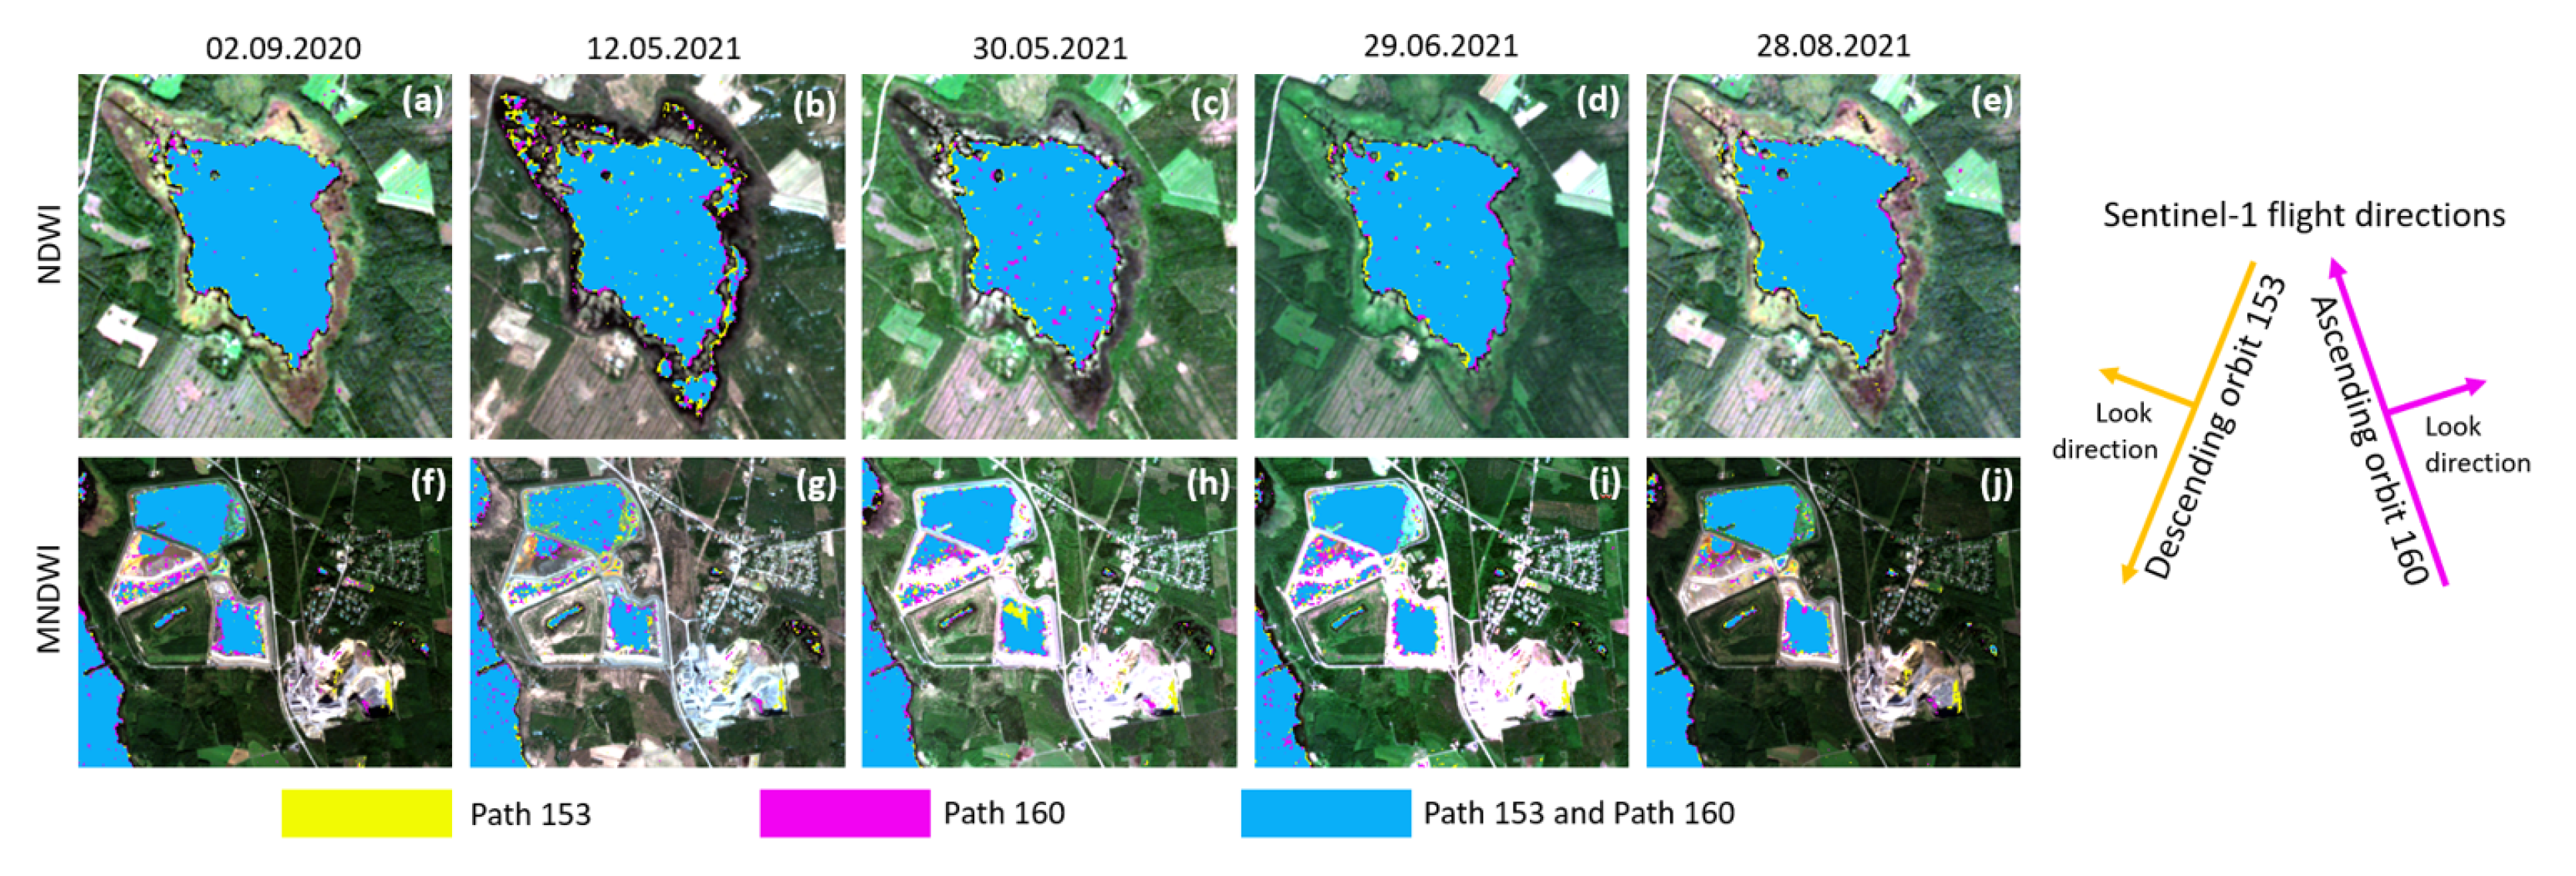
4.3. Ascending and Descending Orbits
4.4. Post-Processing
4.5. Recommendations and Future Research
5. Conclusions
Author Contributions
Funding
Acknowledgments
Conflicts of Interest
Abbreviations
| AWEI | Automated Water Extraction Index |
| BOA | Bottom of Atmosphere |
| DEM | Digital Elevation Model |
| FN | False Negative |
| FP | False Positive |
| GRD | Ground Range Detected |
| HAND | Height Above Nearest Drainage |
| IDE | Integrated Development Environment |
| IoU | Intersection-Over-Union |
| IW | Interferometric Wide |
| MAP | Maximum A Posteriori |
| MNDWI | Modified Normalized Difference Water Index |
| NDVI | Normalized Difference Vegetation Index |
| NDWI | Normalized Difference Water Index |
| NIR | Near-infra-red |
| PA | Producer accuracy |
| SAR | Synthetic aperture radar |
| SD | Standard deviation |
| SWIR | Shortwave Infrared |
| TP | True Positive |
| UA | User Accuracy |
| VH | Vertical transmit and horizontal receive |
| VV | Vertical transmit and vertical receive |
References
- Haines-Young, R.; Potschin, M. Common International Classification of Ecosystem Services (CICES) V5.1; Technical Report; Fabis Consulting Ltd.: Nottingham, UK, 2018. [Google Scholar]
- Grizzetti, B.; Lanzanova, D.; Liquete, C.; Reynaud, A.; Cardoso, A. Assessing water ecosystem services for water resource management. Environ. Sci. Policy 2016, 61, 194–203. [Google Scholar] [CrossRef]
- Shaad, K.; Souter, N.J.; Vollmer, D.; Regan, H.M.; Bezerra, M.O. Integrating Ecosystem Services Into Water Resource Management: An Indicator-Based Approach. Environ. Manag. 2022, 69, 752–767. [Google Scholar] [CrossRef] [PubMed]
- Owusu, S.; Cofie, O.; Mul, M.; Barron, J. The significance of small reservoirs in sustaining agricultural landscapes in dry areas of West Africa: A review. Water 2022, 14, 1440. [Google Scholar] [CrossRef]
- Alahuhta, J.; Joensuu, I.; Matero, J.; Vuori, K.M.; Saastamoinen, O. Freshwater Ecosystem Services in Finland; Technical Report; Finnish Environment Institute: Helsinki, Finland, 2013. [Google Scholar]
- Rankinen, K.; Holmberg, M.; Peltoniemi, M.; Akujärvi, A.; Anttila, K.; Manninen, T.; Markkanen, T. Framework to Study the Effects of Climate Change on Vulnerability of Ecosystems and Societies: Case Study of Nitrates in Drinking Water in Southern Finland. Water 2021, 13, 472. [Google Scholar] [CrossRef]
- Cai Gao, B. NDWI—A normalized difference water index for remote sensing of vegetation liquid water from space. Remote Sens. Environ. 1996, 58, 257–266. [Google Scholar] [CrossRef]
- Xu, H. Modification of normalised difference water index (NDWI) to enhance open water features in remotely sensed imagery. Int. J. Remote Sens. 2006, 27, 3025–3033. [Google Scholar] [CrossRef]
- Feyisa, G.L.; Meilby, H.; Fensholt, R.; Proud, S.R. Automated Water Extraction Index: A new technique for surface water mapping using Landsat imagery. Remote Sens. Environ. 2014, 140, 23–35. [Google Scholar] [CrossRef]
- Marcus, W.A.; Fonstad, M.A. Optical remote mapping of rivers at sub-meter resolutions and watershed extents. Earth Surf. Process. Landforms J. Br. Geomorphol. Res. Group 2008, 33, 4–24. [Google Scholar] [CrossRef]
- Huang, C.; Chen, Y.; Zhang, S.; Wu, J. Detecting, Extracting, and Monitoring Surface Water From Space Using Optical Sensors: A Review. Rev. Geophys. 2018, 56, 333–360. [Google Scholar] [CrossRef]
- Yang, X.; Chen, L. Evaluation of automated urban surface water extraction from Sentinel-2A imagery using different water indices. J. Appl. Remote Sens. 2017, 11, 026016. [Google Scholar] [CrossRef]
- Peng, J.; Liu, S.; Lu, W.; Liu, M.; Feng, S.; Cong, P. Continuous Change Mapping to Understand Wetland Quantity and Quality Evolution and Driving Forces: A Case Study in the Liao River Estuary from 1986 to 2018. Remote Sens. 2021, 13, 4900. [Google Scholar] [CrossRef]
- Ogilvie, A.; Poussin, J.C.; Bader, J.C.; Bayo, F.; Bodian, A.; Dacosta, H.; Dia, D.; Diop, L.; Martin, D.; Sambou, S. Combining Multi-Sensor Satellite Imagery to Improve Long-Term Monitoring of Temporary Surface Water Bodies in the Senegal River Floodplain. Remote Sens. 2020, 12, 3157. [Google Scholar] [CrossRef]
- Cavallo, C.; Papa, M.; Gargiulo, M.; Palau-Salvador, G.; Vezza, P.; Ruello, G. Continuous Monitoring of the Flooding Dynamics in the Albufera Wetland (Spain) by Landsat-8 and Sentinel-2 Datasets. Remote Sens. 2021, 13, 3525. [Google Scholar] [CrossRef]
- Acharya, T.D.; Subedi, A.; Lee, D.H. Evaluation of Water Indices for Surface Water Extraction in a Landsat 8 Scene of Nepal. Sensors 2018, 18, 2580. [Google Scholar] [CrossRef]
- Rokni, K.; Ahmad, A.; Selamat, A.; Hazini, S. Water feature extraction and change detection using multitemporal Landsat imagery. Remote Sens. 2014, 6, 4173–4189. [Google Scholar] [CrossRef]
- Blasco, F.; Bellan, M.F.; Chaudhury, M. Estimating the extent of floods in Bangladesh using SPOT data. Remote Sens. Environ. 1992, 39, 167–178. [Google Scholar] [CrossRef]
- Caballero, I.; Ruiz, J.; Navarro, G. Sentinel-2 Satellites Provide Near-Real Time Evaluation of Catastrophic Floods in the West Mediterranean. Water 2019, 11, 2499. [Google Scholar] [CrossRef]
- Wang, Y.; Colby, J.D.; Mulcahy, K.A. An efficient method for mapping flood extent in a coastal floodplain using Landsat TM and DEM data. Int. J. Remote Sens. 2002, 23, 3681–3696. [Google Scholar] [CrossRef]
- Betancourt-Suarez, V.; García-Botella, E.; Ramon-Morte, A. Flood Mapping Proposal in Small Watersheds: A Case Study of the Rebollos and Miranda Ephemeral Streams (Cartagena, Spain). Water 2021, 13, 102. [Google Scholar] [CrossRef]
- Tong, X.; Luo, X.; Liu, S.; Xie, H.; Chao, W.; Liu, S.; Liu, S.; Makhinov, A.; Makhinova, A.; Jiang, Y. An approach for flood monitoring by the combined use of Landsat 8 optical imagery and COSMO-SkyMed radar imagery. ISPRS J. Photogramm. Remote Sens. 2018, 136, 144–153. [Google Scholar] [CrossRef]
- Van der Sande, C.; de Jong, S.; de Roo, A. A segmentation and classification approach of IKONOS-2 imagery for land cover mapping to assist flood risk and flood damage assessment. Int. J. Appl. Earth Obs. Geoinf. 2003, 4, 217–229. [Google Scholar] [CrossRef]
- Thenkabail, P.S. Remote Sensing Handbook Volume 3: Remote Sensing of Water Resources, Disasters and Urban Studies; Taylor & Francis: Abingdon, UK, 2016. [Google Scholar]
- Shen, X.; Wang, D.; Mao, K.; Anagnostou, E.; Hong, Y. Inundation Extent Mapping by Synthetic Aperture Radar: A Review. Remote Sens. 2019, 11, 879. [Google Scholar] [CrossRef]
- Lusch, D. Introduction to Microwave Remote Sensing; Center For Remote Sensing and Geographic Information Science, Michigan State University: East Lansing, MI, USA, 1999; p. 84. [Google Scholar]
- O’Hara, R.; Green, S.; McCarthy, T. The agricultural impact of the 2015–2016 floods in Ireland as mapped through Sentinel 1 satellite imagery. Ir. J. Agric. Food Res. 2019, 58, 44–65. [Google Scholar] [CrossRef]
- Ikonen, A.T.K.; Kangasniemi, V.; Ijäs, A.; Kumpumaki, T. A feasibility study of machine learning to delineate open-water surfaces of mires from archived aerial imagery (western Finland). Suo 2018, 69, 7–11. [Google Scholar]
- Sefrin, O.; Riese, F.; Keller, S. Deep Learning for Land Cover Change Detection. Remote Sens. 2020, 13, 78. [Google Scholar] [CrossRef]
- Ko, B.C.; Kim, H.H.; Nam, J.Y. Classification of Potential Water Bodies Using Landsat 8 OLI and a Combination of Two Boosted Random Forest Classifiers. Remote Sens. 2015, 15, 13763–13777. [Google Scholar] [CrossRef] [PubMed]
- Guzder-Williams, B.; Alemohammad, H. Surface Water Detection from Sentinel-1. In Proceedings of the 2021 IEEE International Geoscience and Remote Sensing Symposium IGARSS, Brussels, Belgium, 11–16 July 2021; pp. 286–289. [Google Scholar] [CrossRef]
- Merchant, M.A. Classification of Open Water Features Using OBIA and Deep Learning. In Proceedings of the 2021 IEEE International Geoscience and Remote Sensing Symposium IGARSS, Brussels, Belgium, 11–16 July 2021; pp. 104–107. [Google Scholar] [CrossRef]
- Otsu, N. A Threshold Selection Method from Gray-Level Histograms. IEEE Trans. Syst. Man Cybern. 1979, 9, 62–66. [Google Scholar] [CrossRef]
- Kittler, J.; Illingworth, J. Minimum error thresholding. Pattern Recognit. 1986, 19, 41–47. [Google Scholar] [CrossRef]
- Step by Step: Recommended Practice Flood Mapping. 2019. Available online: http://www.un-spider.org/advisory-support/recommended-practices/recommended-practice-flood-mapping/step-by-step (accessed on 1 September 2022).
- Martinis, S.; Twele, A.; Voigt, S. Towards operational near real-time flood detection using a split-based automatic thresholding procedure on high resolution TerraSAR-X data. Nat. Hazards Earth Syst. Sci. 2009, 9, 303–314. [Google Scholar] [CrossRef]
- Chini, M.; Hostache, R.; Giustarini, L.; Matgen, P. A Hierarchical Split-Based Approach for Parametric Thresholding of SAR Images: Flood Inundation as a Test Case. IEEE Trans. Geosci. Remote Sens. 2017, 55, 6975–6988. [Google Scholar] [CrossRef]
- Liang, J.; Liu, D. A local thresholding approach to flood water delineation using Sentinel-1 SAR imagery. ISPRS J. Photogramm. Remote Sens. 2020, 159, 53–62. [Google Scholar] [CrossRef]
- Uddin, K.; Matin, M.A.; Thapa, R.B. Rapid Flood Mapping Using Multi-Temporal SAR Images: An Example from Bangladesh; Springer Nature Singapore Pte Ltd.: Singapore, 2021; pp. 201–210. [Google Scholar] [CrossRef]
- Uddin, K.; Matin, M.A.; Meyer, F.J. Operational Flood Mapping Using Multi-Temporal Sentinel-1 SAR Images: A Case Study from Bangladesh. Remote Sens. 2019, 11, 1581. [Google Scholar] [CrossRef]
- Gulácsi, A.; Kovács, F. Sentinel-1-Imagery-Based High-Resolution Water Cover Detection on Wetlands, Aided by Google Earth Engine. Remote Sens. 2020, 12, 1614. [Google Scholar] [CrossRef]
- Henry, J.B.; Chastanet, P.; Fellah, K.; Desnos, Y.L. Envisat multi-polarized ASAR data for flood mapping. Int. J. Remote Sens. 2006, 27, 1921–1929. [Google Scholar] [CrossRef]
- Liu, C.; van der Velde, R.; Vekerdy, Z. Analysis of Sentinel-1 SAR Data for Mapping Standing Water in the Twente Region; Technical Report; University of Twente: Enschede, The Netherlands, 2016. [Google Scholar]
- Surampudi, S.; Yarrakula, K. Mapping and assessing spatial extent of floods from multitemporal synthetic aperture radar images: A case study on Brahmaputra River in Assam State, India. Environ. Sci. Pollut. Res. 2019, 27, 1521–1532. [Google Scholar] [CrossRef]
- Rana, V.K.; Suryanarayana, T. Evaluation of SAR speckle filter technique for inundation mapping. Remote Sens. Appl. Soc. Environ. 2019, 16, 100271. [Google Scholar] [CrossRef]
- Conde, F.C.; Muñoz, M.D.M. Flood Monitoring Based on the Study of Sentinel-1 SAR Images: The Ebro River Case Study. Water 2019, 11, 2454. [Google Scholar] [CrossRef]
- Liao, H.Y.; Wen, T.H. Extracting urban water bodies from high-resolution radar images: Measuring the urban surface morphology to control for radar’s double-bounce effect. Int. J. Appl. Earth Obs. Geoinf. 2020, 85, 102003. [Google Scholar] [CrossRef]
- Tsyganskaya, V.; Martinis, S.; Marzahn, P. Flood Monitoring in Vegetated Areas Using Multitemporal Sentinel-1 Data: Impact of Time Series Features. Water 2019, 11, 1938. [Google Scholar] [CrossRef]
- Bhatt, C.M.; Rao, G.S.; Jangam, S. Detection of urban flood inundation using RISAT-1 SAR images: A case study of Srinagar, Jammu and Kashmir (North India) floods of September 2014. Model. Earth Syst. Environ. 2019, 6, 429–438. [Google Scholar] [CrossRef]
- Pyhajarvi. Available online: https://www.jarviwiki.fi (accessed on 1 September 2022).
- Kihlman, S.; Kauppila, T. Effects of mining on testate amoebae in a Finnish lake. J. Paleolimnol. 2011, 47, 1–15. [Google Scholar] [CrossRef]
- Cala, M. Mining and Processing Waste Management Methodologies and Technologies; Wydawnictwa AGH: Kraków, Poland, 2013; pp. 105–111. [Google Scholar]
- Mäkinen, J.; Lerssi, J. Characteristics and seasonal variation of sediments in Lake Junttiselkä, Pyhäsalmi, Finland. Mine Water Environ. 2007, 26, 217–228. [Google Scholar] [CrossRef]
- Copernicus Open Access Hub. Available online: https://scihub.copernicus.eu/dhus/#/home (accessed on 1 September 2022).
- Land Viewer | EOS—EOS Data Analytics. Available online: https://eos.com/landviewer/ (accessed on 1 September 2022).
- Ferrazzoli, P. SAR for agriculture: Advances, problems and prospects. In Proceedings of the Third International Symposium on Retrieval of Bio- and Geophysical Parameters from SAR Data for Land Applications, Sheffield, UK, 11–14 September 2001; Volume 475, pp. 47–56. [Google Scholar]
- Kavats, O.; Khramov, D.; Sergieieva, K.; Vasyliev, V. Monitoring harvesting by time series of Sentinel-1 SAR data. Remote Sens. 2019, 11, 2496. [Google Scholar] [CrossRef]
- Havisto, J.; Matselyukh, T.; Paavola, M.; Uusitalo, S.; Savolainen, M.; González, A.S.; Knobloch, A.; Bogdanov, K. Golden AI Data Acquisition and Processing Platform for Safe, Sustainable and Cost-Efficient Mining Operations. In Proceedings of the IGARSS 2021–2021 IEEE International Geoscience and Remote Sensing Symposium, Brussels, Belgium, 11–16 July 2021; pp. 5775–5778. [Google Scholar]
- Kavats, O.; Khramov, D.; Sergieieva, K.; Puputti, J.; Joutsenvaar, J.; Kotavaara, O. Optimal Threshold Selection for Water Bodies Mapping from Sentinel-1 Images based on Sentinel-2 Water Masks. In Proceedings of the IGARSS 2022–2022 IEEE International Geoscience and Remote Sensing Symposium, Kuala Lumpur, Malaysia, 17–22 July 2022; pp. 5551–5554. [Google Scholar]
- Filipponi, F. Sentinel-1 GRD Preprocessing Workflow. Proceedings 2019, 18, 11. [Google Scholar] [CrossRef]
- McVittie, A. Sentinel-1 Flood Mapping Tutorial, February 2019. Available online: http://step.esa.int/docs/tutorials/tutorial_s1floodmapping.pdf (accessed on 1 September 2022).
- Bach, H.; Verhoef, W. Sensitivity studies on the effect of surface soil moisture on canopy reflectance using the radiative transfer model GeoSAIL. In Proceedings of the IGARSS 2003–2003 IEEE International Geoscience and Remote Sensing Symposium, Proceedings (IEEE Cat. No. 03CH37477). Toulouse, France, 21–25 July 2003; Volume 3, pp. 1679–1681. [Google Scholar]
- Li, M.; Hong, L.; Guo, J.; Zhu, A. Automated Extraction of Lake Water Bodies in Complex Geographical Environments by Fusing Sentinel-1/2 Data. Water 2022, 14, 30. [Google Scholar] [CrossRef]
- R Core Team. R: A Language and Environment for Statistical Computing; R Foundation for Statistical Computing: Vienna, Austria, 2021. [Google Scholar]
- RStudio Team. RStudio: Integrated Development Environment for R; RStudio, PBC: Boston, MA, USA, 2022. [Google Scholar]
- Hijmans, R.J. Terra: Spatial Data Analysis. R Package Version 1.5-21. 2022. Available online: https://CRAN.R-project.org/package=terra (accessed on 1 September 2022).
- Hu, K.; Li, M.; Xia, M.; Lin, H. Multi-Scale Feature Aggregation Network for Water Area Segmentation. Remote Sens. 2022, 14, 206. [Google Scholar] [CrossRef]
- Li, Z.; Wang, R.; Zhang, W.; Hu, F.; Meng, L. Multiscale features supported deeplabv3+ optimization scheme for accurate water semantic segmentation. IEEE Access 2019, 7, 155787–155804. [Google Scholar] [CrossRef]
- Eltner, A.; Bressan, P.O.; Akiyama, T.; Gonçalves, W.N.; Marcato Junior, J. Using deep learning for automatic water stage measurements. Water Resour. Res. 2021, 57, e2020WR027608. [Google Scholar] [CrossRef]
- Choi, S.S.; Cha, S.H.; Tappert, C.C. A survey of binary similarity and distance measures. J. Syst. Cybern. Informatics 2010, 8, 43–48. [Google Scholar]
- Jaccard, P. Distribution de la flore alpine dans le bassin des Dranses et dans quelques régions voisines. Bull. Soc. Vaudoise Sci. Nat. 1901, 37, 241–272. [Google Scholar]
- Harshberger, J.W. Pflanzensoziologie; Grundzüge der Vegetationskunde. By Dr. J. Braun-Blanquet. Mit 168 Abbildungen und 330 Seiten. Biologische Studienbücher VII. Herausgegeben von Walther Schoeninchen, Berlin. 1928. Science 1929, 69, 275–276. [Google Scholar] [CrossRef]
- Kseňak, L.; Pukanská, K.; Bartoš, K.; Blišt’an, P. Assessment of the Usability of SAR and Optical Satellite Data for Monitoring Spatio-Temporal Changes in Surface Water: Bodrog River Case Study. Water 2022, 14, 299. [Google Scholar] [CrossRef]
- Markert, K.N.; Markert, A.M.; Mayer, T.; Nauman, C.; Haag, A.; Poortinga, A.; Bhandari, B.; Thwal, N.S.; Kunlamai, T.; Chishtie, F.; et al. Comparing Sentinel-1 Surface Water Mapping Algorithms and Radiometric Terrain Correction Processing in Southeast Asia Utilizing Google Earth Engine. Remote Sens. 2020, 12, 2469. [Google Scholar] [CrossRef]
- Zhang, W.; Hu, B.; Brown, G.S. Automatic surface water mapping using polarimetric SAR data for long-term change detection. Water 2020, 12, 872. [Google Scholar] [CrossRef]
- Zhou, S.; Kan, P.; Silbernagel, J.; Jin, J. Application of image segmentation in surface water extraction of freshwater lakes using radar data. ISPRS Int. J. Geo-Inf. 2020, 9, 424. [Google Scholar] [CrossRef]
- Di Traglia, F.; De Luca, C.; Manzo, M.; Nolesini, T.; Casagli, N.; Lanari, R.; Casu, F. Joint exploitation of space-borne and ground-based multitemporal InSAR measurements for volcano monitoring: The Stromboli volcano case study. Remote Sens. Environ. 2021, 260, 112441. [Google Scholar] [CrossRef]
- Wang, X.; Holland, D.M. An Automatic Method for Black Margin Elimination of Sentinel-1A Images over Antarctica. Remote Sens. 2020, 12, 1175. [Google Scholar] [CrossRef]
- Jamil, N.; Sembok, T.M.T.; Bakar, Z.A. Noise removal and enhancement of binary images using morphological operations. In Proceedings of the 2008 International Symposium on Information Technology, Kuala Lumpur, Malaysia, 26–28 August 2008; Volume 4, pp. 1–6. [Google Scholar] [CrossRef]
- Rennó, C.D.; Nobre, A.D.; Cuartas, L.A.; Soares, J.V.; Hodnett, M.G.; Tomasella, J.; Waterloo, M.J. HAND, a new terrain descriptor using SRTM-DEM: Mapping terra-firme rainforest environments in Amazonia. Remote Sens. Environ. 2008, 112, 3469–3481. [Google Scholar] [CrossRef]
- Reksten, J.H.; Salberg, A.B.; Solberg, R. Flood Detection in Norway based on Sentinel-1 SAR Imagery. Int. Arch. Photogramm. Remote Sens. Spatial Inf. Sci. 2019, XLII-3/W8, 349–355. [Google Scholar] [CrossRef]


| Sentinel-1 | Sentinel-2 | |||
|---|---|---|---|---|
| Date | Time | Date | Time | |
| Path 153 | Path 160 | |||
| 28 August 2021 | 04:41:12 | 15:57:48 | 28 August 2021 | 10:02:50 |
| 23 July 2021 | 04:41:10 | 15:57:46 | 26 July 2021 | 09:52:55 |
| 29 June 2021 | 04:41:09 | 15:57:45 | 29 June 2021 | 10:02:50 |
| 11 June 2021 | 04:40:30 | 15:57:11 | 11 June 2021 | 09:52:53 |
| 30 May 2021 | 04:40:22 | 15:57:10 | 30 May 2021 | 10:02:49 |
| 12 May 2021 | 04:41:06 | 15:57:42 | 12 May 2021 | 09:52:50 |
| 02 September 2020 | 04:41:07 | 15:57:43 | 02 September 2020 | 10:02:53 |
| 15 August 2020 | 04:40:21 | 15:57:09 | 15 August 2020 | 09:52:55 |
| 16 June 2020 | 04:40:16 | 15:57:05 | 14 June 2020 | 10:02:55 |
| 23 May 2020 | 04:40:16 | 15:57:04 | 22 May 2020 | 09:52:57 |
| 28 July 2019 | 04:40:13 | 15:57:01 | 25 July 2019 | 10:02:57 |
| 22 July 2019 | 04:40:56 | 15:57:33 | 25 July 2019 | 10:02:57 |
| 23 May 2019 | 04:40:54 | 15:57:29 | 18 May 2019 | 09:52:55 |
| 15 July 2018 | 04:40:51 | 15:57:26 | 12 July 2018 | 09:50:30 |
| 03 July 2018 | 04:40:50 | 15:57:25 | 02 July 2018 | 09:50:30 |
| 28 May 2018 | 04:40:48 | 15:57:23 | 31 May 2018 | 10:00:23 |
| Path 153 | |||||||||||
|---|---|---|---|---|---|---|---|---|---|---|---|
| NDWI | MNDWI | ||||||||||
| Sf 1 | IoU | Sf | IoU | Sf | IoU | Sf | IoU | Sf | IoU | Sf | IoU |
| L7 2 | 0.879 | M7 3 | 0.876 | M7 | 0.882 | M7 | 0.908 | LS7 4 | 0.883 | M7 | 0.894 |
| LS7 | 0.879 | LS7 | 0.874 | LS7 | 0.881 | LS7 | 0.906 | M7 | 0.882 | LS7 | 0.893 |
| GM7 5 | 0.876 | LS5 | 0.869 | M5 | 0.881 | L7 | 0.905 | LS5 | 0.876 | LS5 | 0.890 |
| M7 | 0.876 | M5 | 0.869 | LS5 | 0.880 | GM7 | 0.902 | M5 | 0.874 | M5 | 0.889 |
| L5 | 0.871 | RL 6 | 0.861 | RL | 0.878 | L5 | 0.901 | L5 | 0.870 | L5 | 0.886 |
| LS5 | 0.870 | L5 | 0.859 | M3 | 0.875 | LS5 | 0.901 | RL | 0.870 | L3 | 0.885 |
| GM5 | 0.870 | GM5 | 0.857 | L3 | 0.875 | GM5 | 0.899 | GM5 | 0.869 | GM3 | 0.885 |
| M5 | 0.865 | L7 | 0.853 | GM3 | 0.874 | M5 | 0.896 | GM7 | 0.867 | GM5 | 0.885 |
| L3 | 0.846 | L3 | 0.851 | L5 | 0.874 | RL | 0.880 | L7 | 0.866 | GM7 | 0.882 |
| GM3 | 0.845 | GM3 | 0.850 | GM5 | 0.872 | L3 | 0.879 | M3 | 0.865 | L7 | 0.881 |
| RL | 0.845 | GM7 | 0.850 | L7 | 0.871 | GM3 | 0.878 | L3 | 0.864 | RL | 0.881 |
| M3 | 0.837 | M3 | 0.849 | GM7 | 0.869 | M3 | 0.869 | GM3 | 0.863 | M3 | 0.880 |
| None | 0.775 | None | 0.811 | None | 0.854 | None | 0.805 | None | 0.832 | None | 0.868 |
| SD 7 | 0.029 | SD | 0.017 | SD | 0.007 | SD | 0.028 | SD | 0.013 | SD | 0.007 |
| LS7 | 0.887 | M7 | 0.878 | LS7 | 0.887 | M7 | 0.905 | M7 | 0.890 | M7 | 0.897 |
| L7 | 0.885 | LS7 | 0.877 | M7 | 0.887 | LS7 | 0.904 | LS7 | 0.888 | LS7 | 0.894 |
| M7 | 0.885 | M5 | 0.876 | M5 | 0.886 | L7 | 0.903 | LS5 | 0.883 | LS5 | 0.892 |
| L5 | 0.882 | LS5 | 0.876 | LS5 | 0.886 | GM7 | 0.900 | M5 | 0.882 | M5 | 0.892 |
| GM7 | 0.881 | RL | 0.874 | RL | 0.884 | L5 | 0.900 | L5 | 0.879 | RL | 0.890 |
| LS5 | 0.881 | L3 | 0.869 | M3 | 0.883 | LS5 | 0.900 | GM5 | 0.878 | L5 | 0.890 |
| GM5 | 0.879 | GM3 | 0.869 | L3 | 0.882 | GM5 | 0.898 | RL | 0.876 | GM5 | 0.889 |
| M5 | 0.876 | L5 | 0.868 | GM3 | 0.881 | M5 | 0.898 | L7 | 0.873 | GM7 | 0.887 |
| L3 | 0.864 | M3 | 0.868 | L5 | 0.881 | RL | 0.892 | L3 | 0.872 | L7 | 0.887 |
| GM3 | 0.864 | GM5 | 0.867 | GM5 | 0.880 | L3 | 0.889 | GM3 | 0.871 | GM3 | 0.886 |
| RL | 0.860 | L7 | 0.864 | L7 | 0.879 | GM3 | 0.888 | GM7 | 0.871 | L3 | 0.886 |
| M3 | 0.858 | GM7 | 0.861 | GM7 | 0.877 | M3 | 0.884 | M3 | 0.867 | M3 | 0.885 |
| None | 0.821 | None | 0.828 | None | 0.868 | None | 0.835 | None | 0.836 | None | 0.874 |
| SD | 0.018 | SD | 0.013 | SD | 0.005 | SD | 0.018 | SD | 0.013 | SD | 0.006 |
| NDWI | MNDWI | ||||||||||
|---|---|---|---|---|---|---|---|---|---|---|---|
| Filter | Start 1 | End 2 | PW 3 | IoU | Filter | Start | End | PW | IoU | ||
| L7 4 | −14.8 | −19.3 | 4.5 | 0.854 | GM7 5 | −14.8 | −19.2 | 4.4 | 0.836 | ||
| GM7 | −14.9 | −19.3 | 4.4 | 0.852 | L7 | −14.7 | −19.1 | 4.4 | 0.837 | ||
| LS7 6 | −15.0 | −19.4 | 4.4 | 0.876 | LS7 | −14.9 | −19.2 | 4.3 | 0.866 | ||
| GM7 | −17.1 | −21.5 | 4.4 | 0.869 | GM5 | −15.1 | −19.3 | 4.2 | 0.845 | ||
| L7 | −17.1 | −21.5 | 4.4 | 0.870 | M7 7 | −15.3 | −19.5 | 4.2 | 0.871 | ||
| LS7 | −17.3 | −21.7 | 4.4 | 0.885 | GM7 | −17.0 | −21.2 | 4.2 | 0.857 | ||
| M7 | −15.4 | −19.7 | 4.3 | 0.878 | L5 | −15.1 | −19.2 | 4.1 | 0.846 | ||
| M7 | −17.7 | −22.0 | 4.3 | 0.886 | LS5 | −15.1 | −19.2 | 4.1 | 0.861 | ||
| GM5 | −15.2 | −19.4 | 4.2 | 0.860 | GM5 | −17.3 | −21.4 | 4.1 | 0.864 | ||
| L5 | −15.2 | −19.4 | 4.2 | 0.862 | M7 | −17.5 | −21.6 | 4.1 | 0.886 | ||
| GM5 | −17.4 | −21.6 | 4.2 | 0.875 | L5 | −17.3 | −21.4 | 4.1 | 0.865 | ||
| L5 | −17.4 | −21.6 | 4.2 | 0.876 | L7 | −17.0 | −21.1 | 4.1 | 0.857 | ||
| LS5 | −17.5 | −21.7 | 4.2 | 0.884 | LS7 | −17.2 | −21.3 | 4.1 | 0.880 | ||
| LS5 | −15.3 | −19.4 | 4.1 | 0.873 | M5 | −15.5 | −19.5 | 4.0 | 0.867 | ||
| M5 | −17.9 | −21.9 | 4.0 | 0.885 | M5 | −17.7 | −21.7 | 4.0 | 0.881 | ||
| M5 | −15.7 | −19.6 | 3.9 | 0.875 | LS5 | −17.4 | −21.4 | 4.0 | 0.877 | ||
| RL 8 | −15.7 | −19.5 | 3.8 | 0.874 | RL | −17.7 | −21.5 | 3.8 | 0.880 | ||
| RL | −17.9 | −21.7 | 3.8 | 0.884 | RL | −15.6 | −19.3 | 3.7 | 0.865 | ||
| GM3 | −15.7 | −19.3 | 3.6 | 0.864 | GM3 | −17.7 | −21.4 | 3.7 | 0.869 | ||
| L3 | −15.7 | −19.3 | 3.6 | 0.865 | L3 | −17.7 | −21.4 | 3.7 | 0.870 | ||
| GM3 | −17.9 | −21.5 | 3.6 | 0.878 | GM3 | −15.6 | −19.2 | 3.6 | 0.852 | ||
| L3 | −17.9 | −21.5 | 3.6 | 0.879 | L3 | −15.6 | −19.2 | 3.6 | 0.852 | ||
| M3 | −16.0 | −19.5 | 3.5 | 0.867 | M3 | −15.9 | −19.4 | 3.5 | 0.857 | ||
| M3 | −18.2 | −21.7 | 3.5 | 0.881 | M3 | −18.0 | −21.5 | 3.5 | 0.876 | ||
| L7 | −20.6 | −23.8 | 3.2 | 0.894 | GM7 | −20.2 | −23.3 | 3.1 | 0.919 | ||
| G7 | −20.7 | −23.8 | 3.1 | 0.892 | L7 | −20.2 | −23.3 | 3.1 | 0.920 | ||
| LS7 | −20.8 | −23.8 | 3.0 | 0.897 | LS7 | −20.3 | −23.4 | 3.1 | 0.924 | ||
| M7 | −20.7 | −23.7 | 3.0 | 0.926 | |||||||
| 29 June 2021 1 | Otsu IoU | Reference Date—11 June 2021 | All Dates 2018–2020 | ||||
|---|---|---|---|---|---|---|---|
| Th 2 | Opt. IoU 3 | IoU 4 | Th | Opt. IoU | IoU | ||
| Lee 5 × 5 | 0.911 | −22.5 | 0.896 | 0.015 | −22.7 | 0.913 | −0.002 |
| Lee 7 × 7 | 0.916 | −22.2 | 0.911 | 0.005 | −22.5 | 0.917 | −0.001 |
| Lee Sigma 5 × 5 | 0.911 | −22.4 | 0.890 | 0.021 | −22.7 | 0.914 | −0.003 |
| Lee Sigma 7 × 7 | 0.914 | −22.4 | 0.902 | 0.012 | −22.7 | 0.920 | −0.006 |
| Median 5 × 5 | 0.899 | −22.7 | 0.887 | 0.012 | −23.0 | 0.908 | −0.009 |
| Median 7 × 7 | 0.902 | −23.0 | 0.899 | 0.003 | −23.1 | 0.919 | −0.017 |
| 28 August 2021 | OtsuIoU | Reference Date—11 June 2021 | All Dates 2018–2020 | ||||
| Th | Opt.IoU | IoU | Th | Opt.IoU | IoU | ||
| Lee 5 × 5 | 0.924 | −22.2 | 0.902 | 0.022 | −22.7 | 0.918 | 0.006 |
| Lee 7 × 7 | 0.919 | −22.3 | 0.904 | 0.015 | −22.5 | 0.915 | 0.004 |
| Lee Sigma 5 × 5 | 0.928 | −22.2 | 0.900 | 0.028 | −22.7 | 0.922 | 0.006 |
| Lee Sigma 7 × 7 | 0.932 | −21.8 | 0.902 | 0.030 | −22.7 | 0.923 | 0.009 |
| Median 5 × 5 | 0.928 | −22.3 | 0.901 | 0.027 | −22.7 | 0.922 | 0.006 |
| Median 7 × 7 | 0.933 | −22.3 | 0.904 | 0.029 | −23.1 | 0.926 | 0.007 |
| SAR Date | NDWI | MNDWI | ||||||
|---|---|---|---|---|---|---|---|---|
| Similarity (IoU) | Threshold (dB) | Similarity (IoU) | Threshold (dB) | |||||
| 153 1 | 160 1 | 153 | 160 | 153 | 160 | 153 | 160 | |
| 28 August 2021 | 0.880 | 0.884 | −22.7 | −24.6 | 0.926 | 0.936 | −21.3 | −22.7 |
| 23 July 2021 | 0.796 | 0.802 | −23.1 | −24.1 | 0.916 | 0.900 | −21.2 | −21.8 |
| 29 June 2021 | 0.831 | 0.841 | −23.1 | −23.9 | 0.918 | 0.907 | −22.2 | −22.2 |
| 11 June 2021 | 0.899 | 0.901 | −23.4 | −23.7 | 0.904 | 0.895 | −23.0 | −23.1 |
| 30 May 2021 | 0.744 | 0.749 | −23.9 | −24.8 | 0.891 | 0.892 | −23.6 | −24.0 |
| 12 May 2021 | 0.905 | 0.907 | −22.1 | −23.2 | 0.884 | 0.891 | −22.7 | −23.9 |
| 02 September 2020 | 0.880 | 0.885 | −23.2 | −24.3 | 0.881 | 0.883 | −22.7 | −23.3 |
| 15 August 2020 | 0.874 | 0.879 | −23.6 | −24.6 | 0.906 | 0.912 | −22.5 | −23.3 |
| 16 June 2020 | 0.909 | 0.914 | −23.0 | −23.7 | 0.906 | 0.912 | −22.9 | −23.5 |
| 23 May 2020 | 0.827 | 0.827 | −23.2 | −24.2 | 0.906 | 0.910 | −23.5 | −24.4 |
| 28 July 2019 | 0.887 | 0.894 | −22.6 | −23.1 | 0.896 | 0.906 | −22.1 | −22.4 |
| 22 July 2019 | 0.894 | 0.899 | −22.5 | −23.4 | 0.920 | 0.922 | −21.6 | −21.5 |
| 23 May 2019 | 0.853 | 0.858 | −23.2 | −24.7 | 0.873 | 0.883 | −23.3 | −24.8 |
| 15 July 2018 | 0.892 | 0.893 | −24.2 | −23.2 | 0.903 | 0.898 | −22.0 | −22.4 |
| 03 July 2018 | 0.878 | 0.887 | −22.7 | −24.0 | 0.881 | 0.885 | −21.8 | −22.8 |
| 28 May 2018 | 0.797 | 0.811 | −23.2 | −24.0 | 0.912 | 0.924 | −22.9 | −23.6 |
Publisher’s Note: MDPI stays neutral with regard to jurisdictional claims in published maps and institutional affiliations. |
© 2022 by the authors. Licensee MDPI, Basel, Switzerland. This article is an open access article distributed under the terms and conditions of the Creative Commons Attribution (CC BY) license (https://creativecommons.org/licenses/by/4.0/).
Share and Cite
Kavats, O.; Khramov, D.; Sergieieva, K. Surface Water Mapping from SAR Images Using Optimal Threshold Selection Method and Reference Water Mask. Water 2022, 14, 4030. https://doi.org/10.3390/w14244030
Kavats O, Khramov D, Sergieieva K. Surface Water Mapping from SAR Images Using Optimal Threshold Selection Method and Reference Water Mask. Water. 2022; 14(24):4030. https://doi.org/10.3390/w14244030
Chicago/Turabian StyleKavats, Olena, Dmitriy Khramov, and Kateryna Sergieieva. 2022. "Surface Water Mapping from SAR Images Using Optimal Threshold Selection Method and Reference Water Mask" Water 14, no. 24: 4030. https://doi.org/10.3390/w14244030
APA StyleKavats, O., Khramov, D., & Sergieieva, K. (2022). Surface Water Mapping from SAR Images Using Optimal Threshold Selection Method and Reference Water Mask. Water, 14(24), 4030. https://doi.org/10.3390/w14244030