1. Introduction
As the IPCC AR6 report [
1] points out, since 1950, climate change has been affecting many weather and climate extremes, and in most of the world, the frequency and intensity of intense precipitation events have increased, with an associated non-negligible impact on population, structures, and infrastructure [
2]. The loss-relevant natural disasters worldwide, mainly associated with weather events (e.g., storms and floods), increased about three times in the past 35 years; in this context, changes in the atmosphere, which include a widespread increase in water vapor content in the lower air layers [
3], are playing a relevant role [
4]. Interesting considerations about the spatial and temporal evolution of intense weather phenomena, including evaluating possible future scenarios [
3,
5], can be found in the scientific literature. Statistical analyses reveal that the situation is constantly evolving and that heavy weather events are increasingly observed even in the mid-latitudes. Examples related to this are the severe thunderstorms associated with large hailstorms and damaging convective winds [
3,
6] in several European regions [
7,
8,
9,
10,
11,
12,
13,
14,
15,
16,
17], medicanes, i.e., Mediterranean tropical-like cyclones [
18,
19,
20,
21,
22], and heavy rainfalls [
23,
24,
25,
26,
27] with the resulting floods, which show significant trends over Europe [
28,
29]. The occurrence of these events is closely linked to climate change, and these phenomena make the Mediterranean one of the most sensitive regions to the problem [
20,
21], and consequently an interesting field of study for meteorology in Europe [
7]. It is clear that the determination of descriptive and predictive algorithms for the atmospheric behavior [
14,
30,
31,
32,
33,
34,
35,
36] is crucial in an area such as Europe, which is strongly affected by severe weather phenomena. Additionally, Alpine lakes and their changes are key indicators of climate change and climate variability, and are useful to understand climate change impacts [
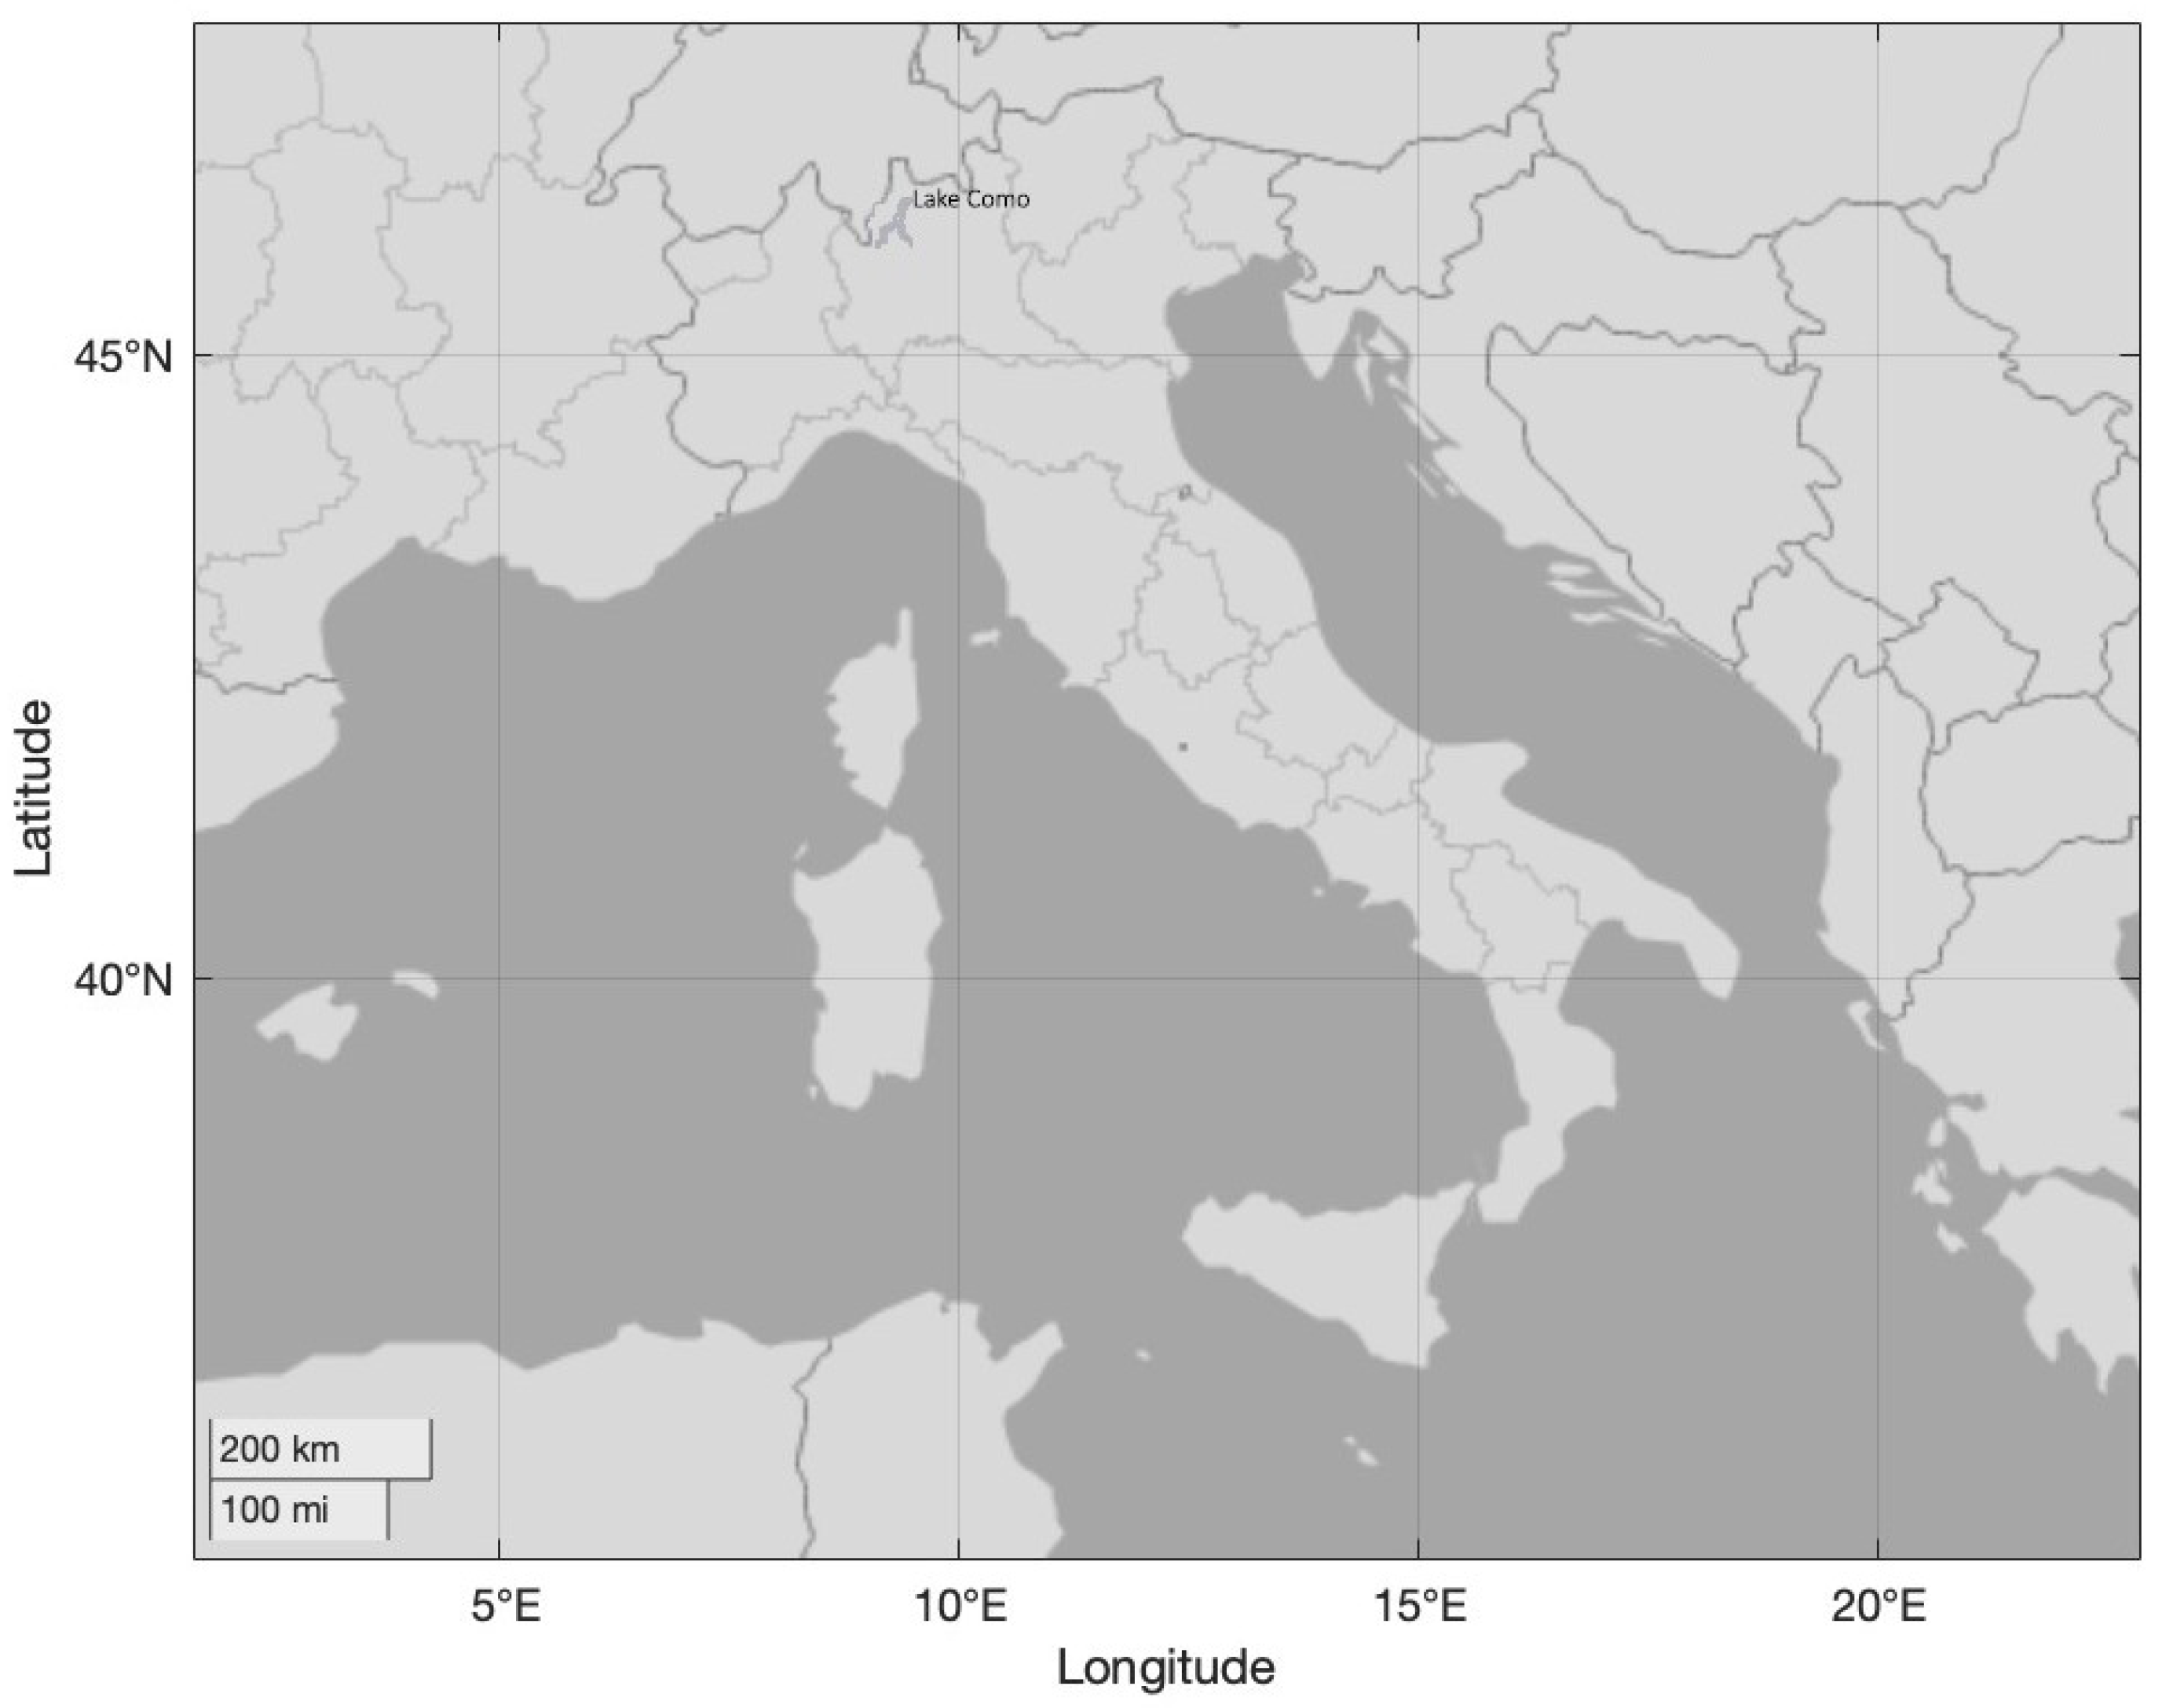
37]. The above overview allowed the determination of some areas of interest and in particular, the areas of Northern Italy and the Alps are among the areas characterized by a higher trend in relation to the frequency of extreme events. The evaluation of climatology from ERA5 dataset allowed to identify the Lake Como area (lat: 43.5° N–48.5° N; lon: 6.8° E–11.8° E—
Figure 1) as an interesting hotspot.
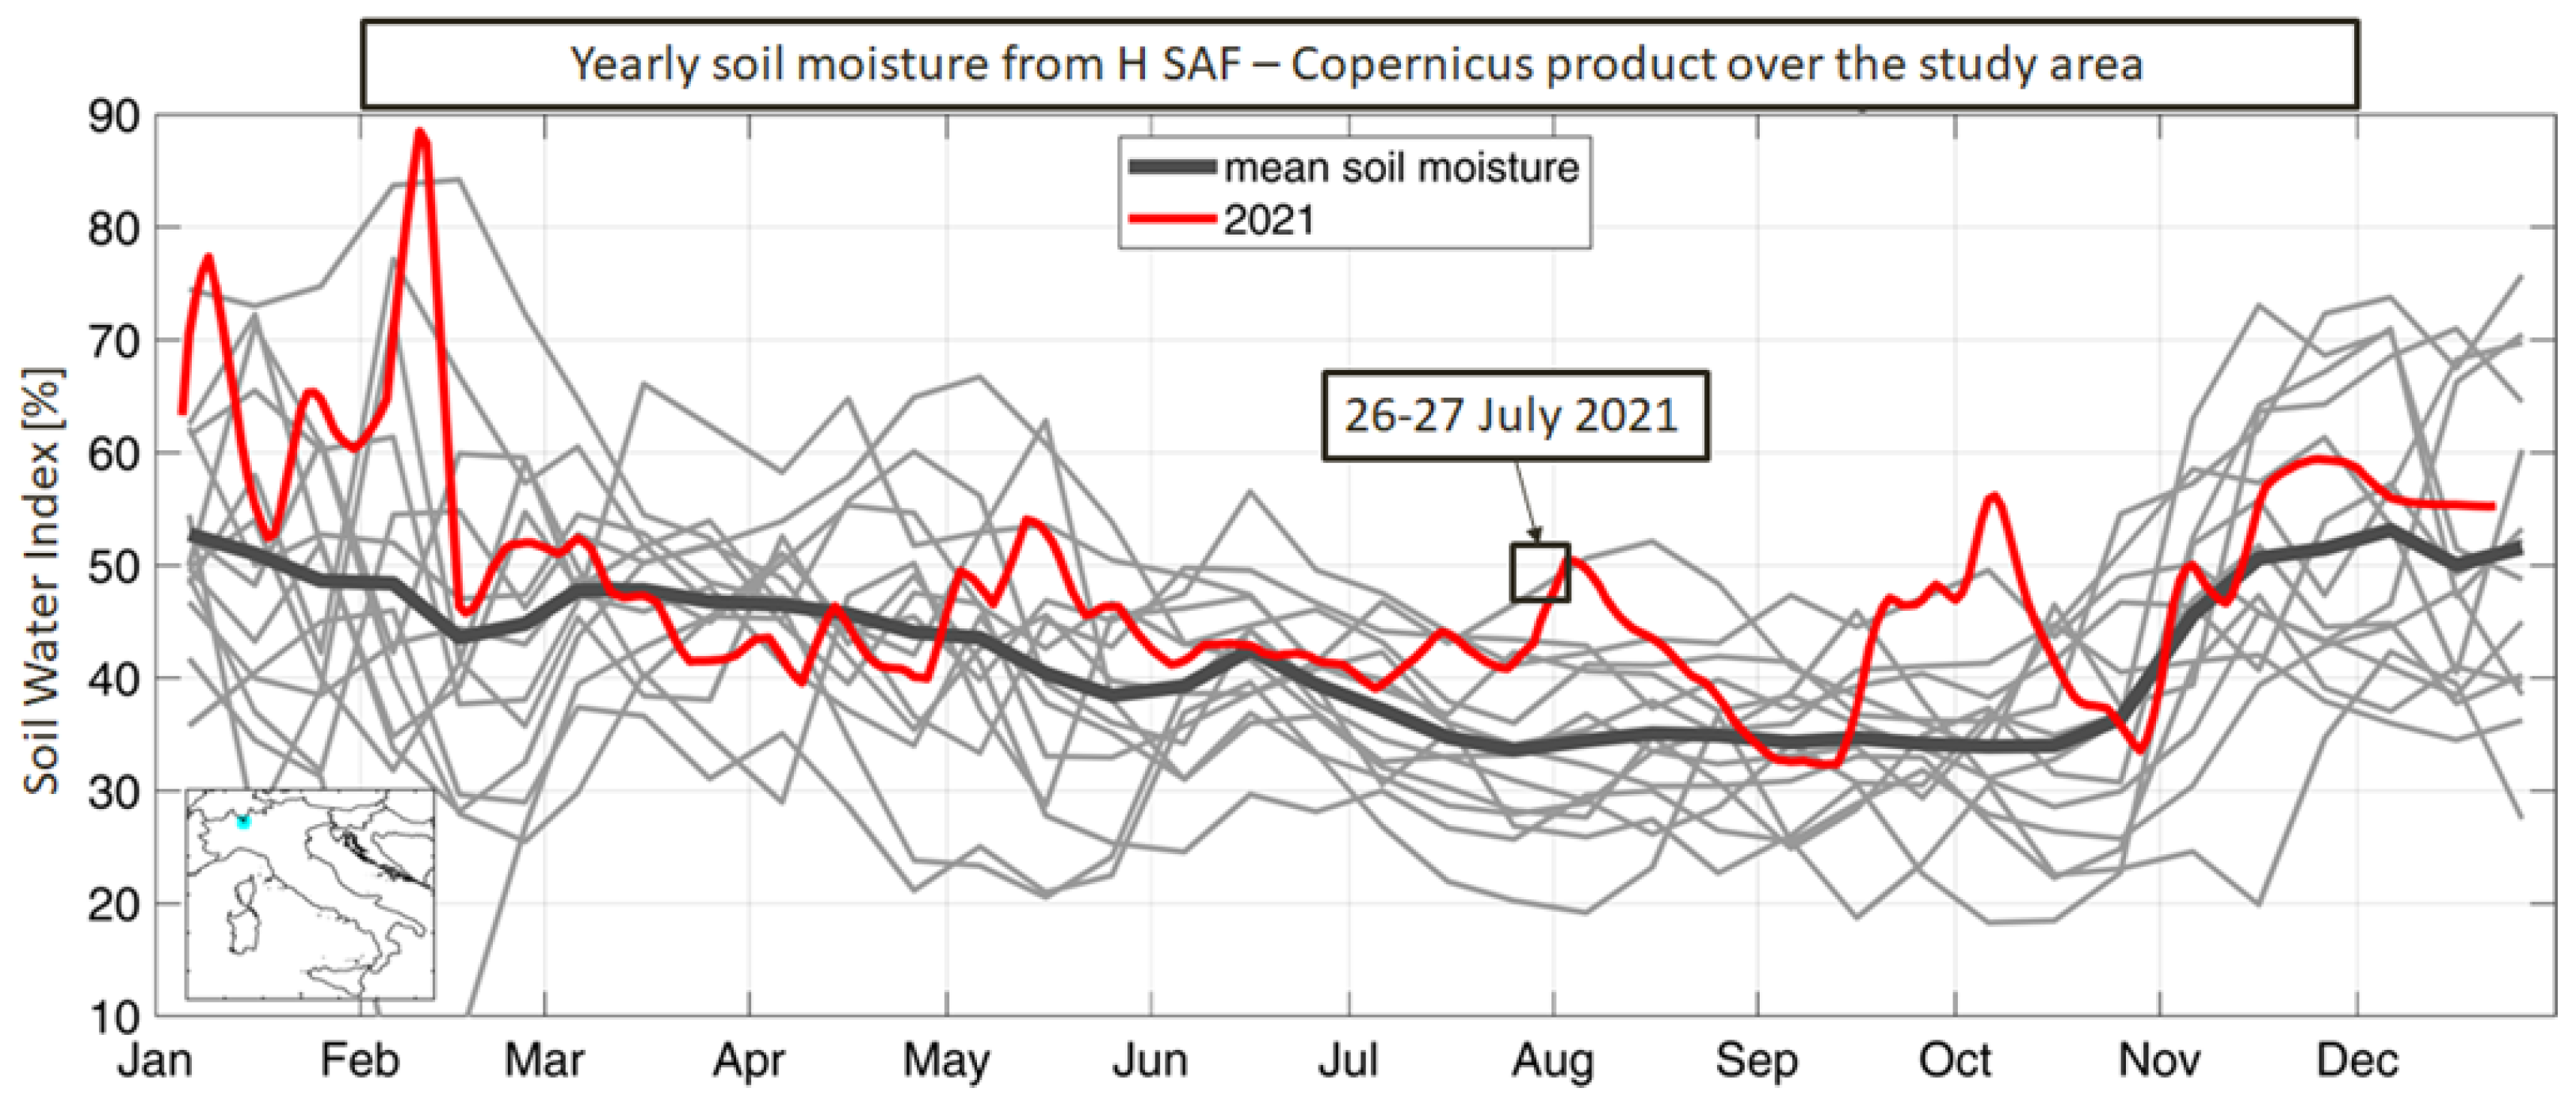
In addition to this, a further evaluation on the climatology of satellite soil moisture in the area, for the period 2007–2020, was carried out. Results clearly indicate the anomalous wet conditions occurred in the area around Como at the end of July 2021 (
Figure 2—red line) also with respect to other years (
Figure 2—grey lines). The Soil Water Index is indeed about 20% higher than the seasonal average calculated over 14 years of data.
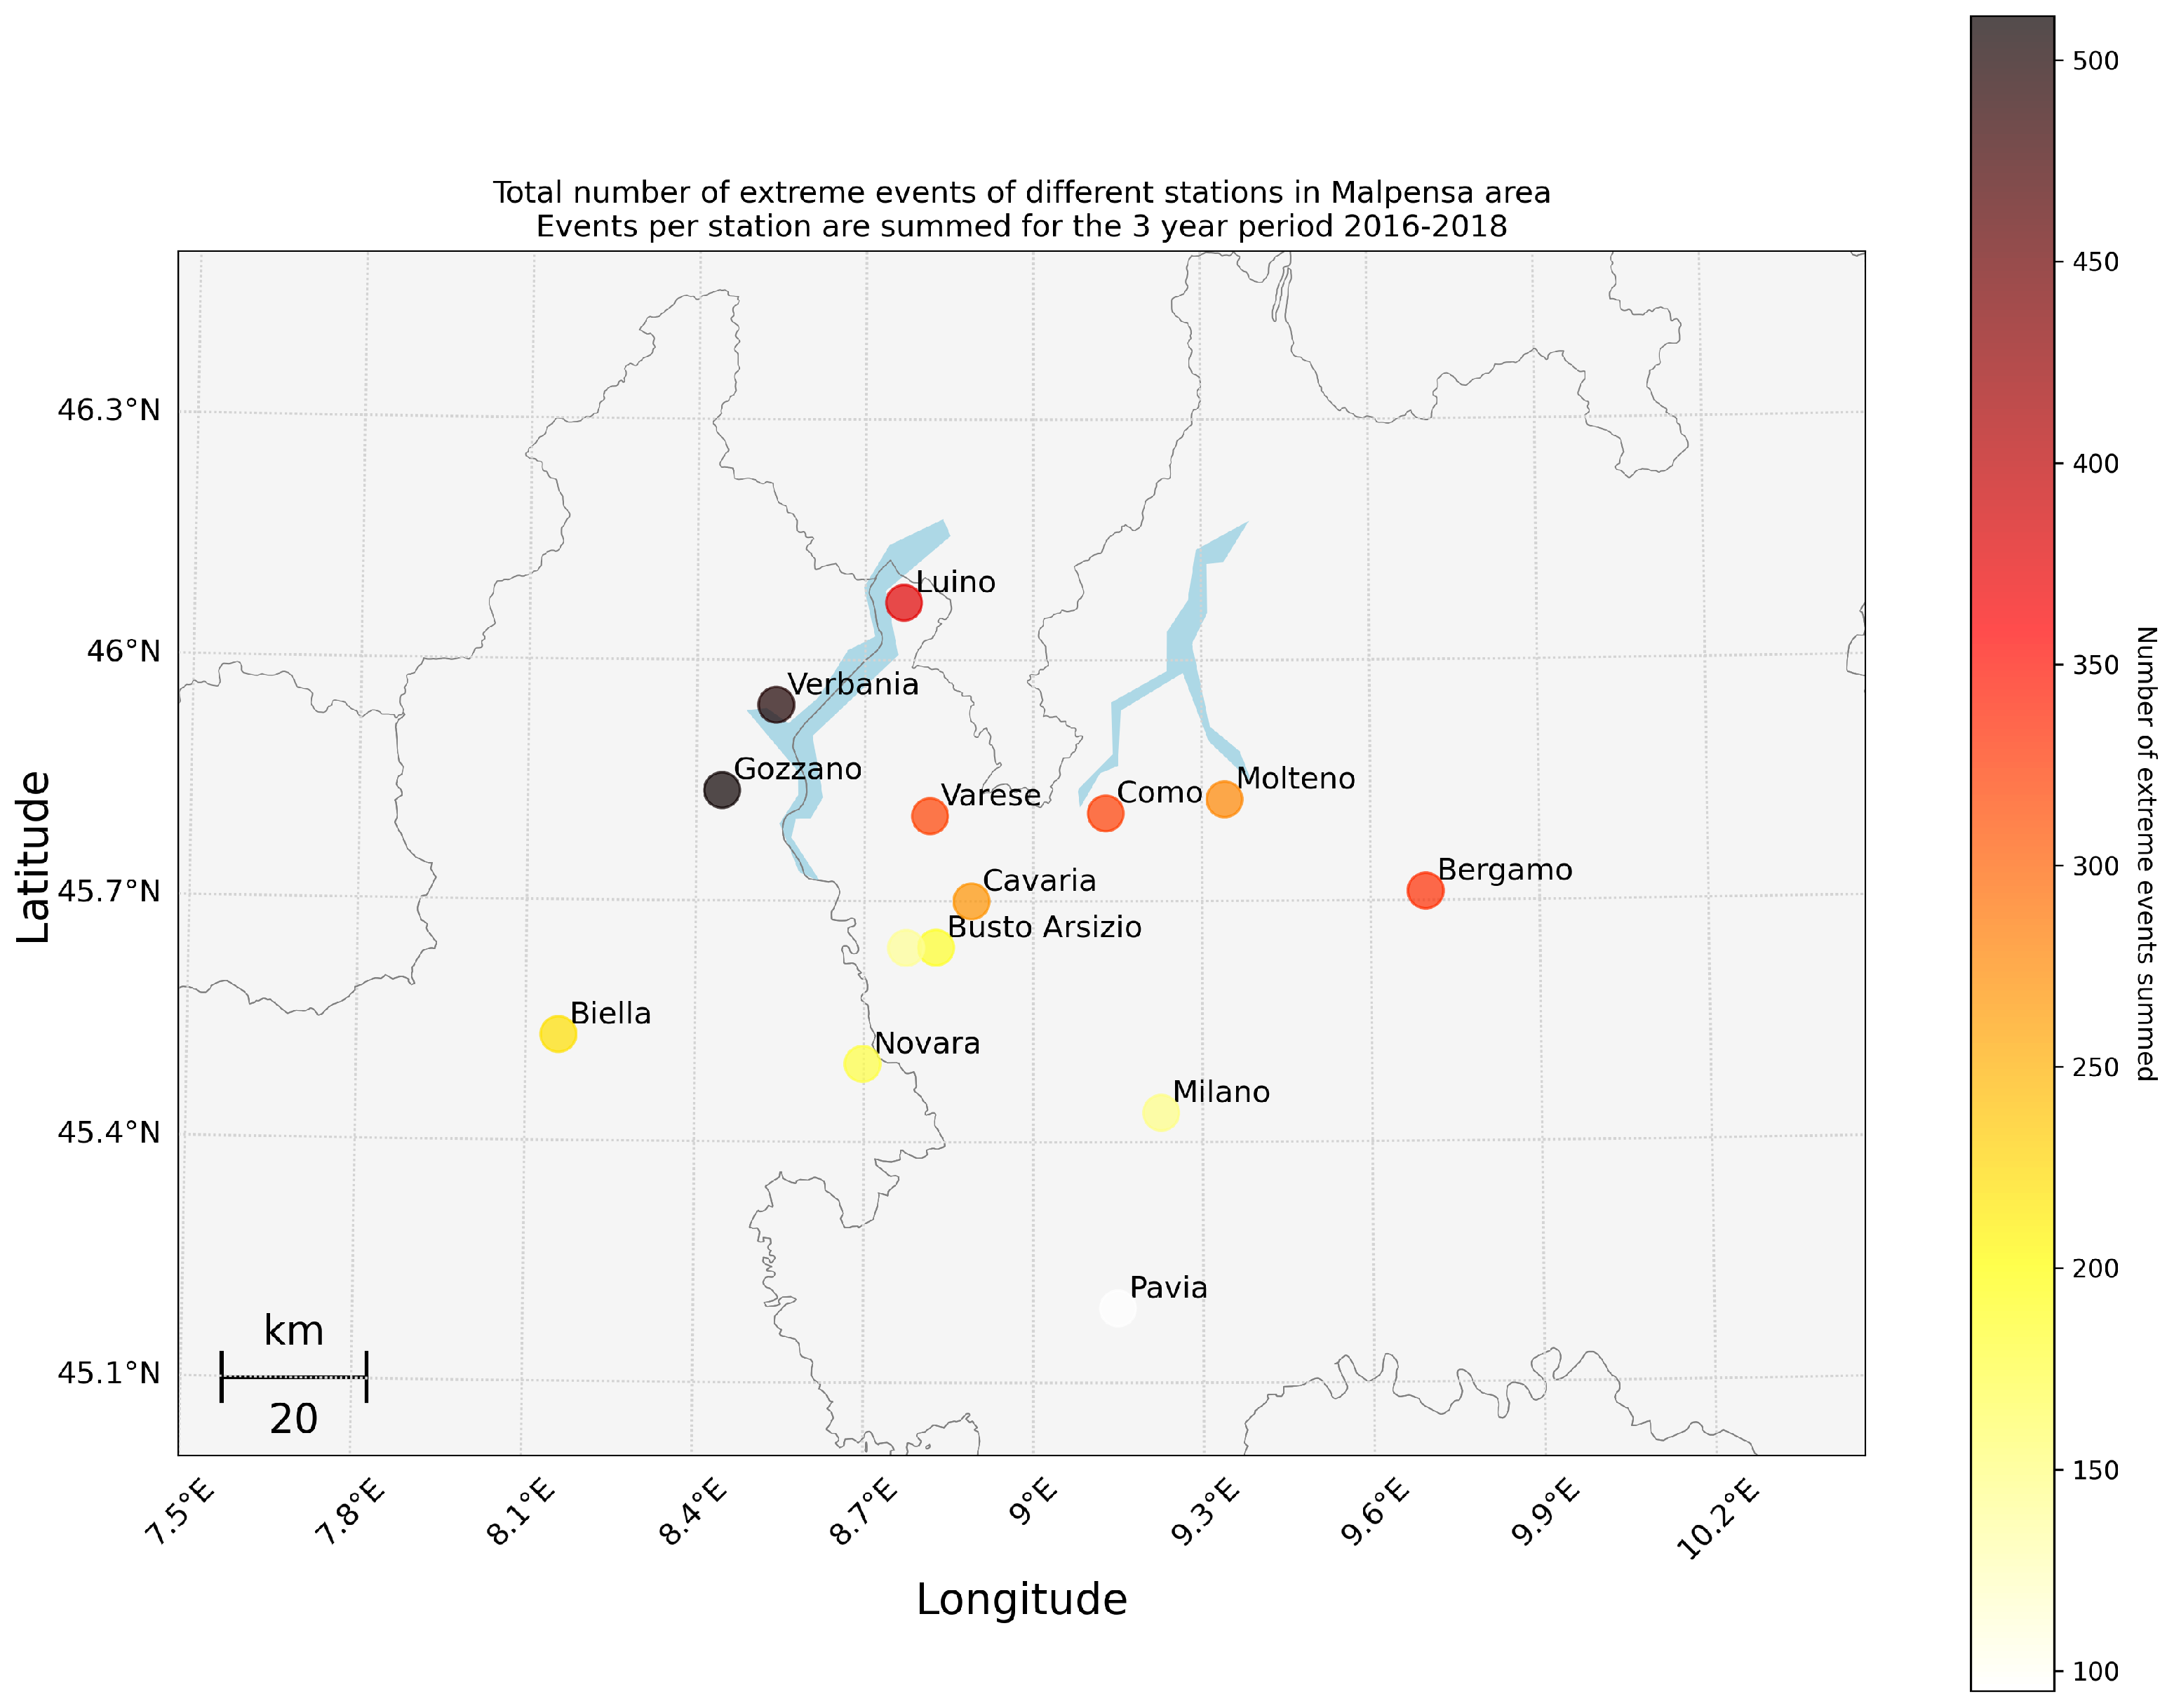
To support the climatological findings, a shorter-term analysis on meteorological stations located in the area was also conducted. In
Figure 3, the sum of the total number of extreme events [
38], for the 3 year period 2016–2018, for each meteorological station, is given. The extremes are selected according to the 95th percentile of the rain events collected by the weather stations shown in
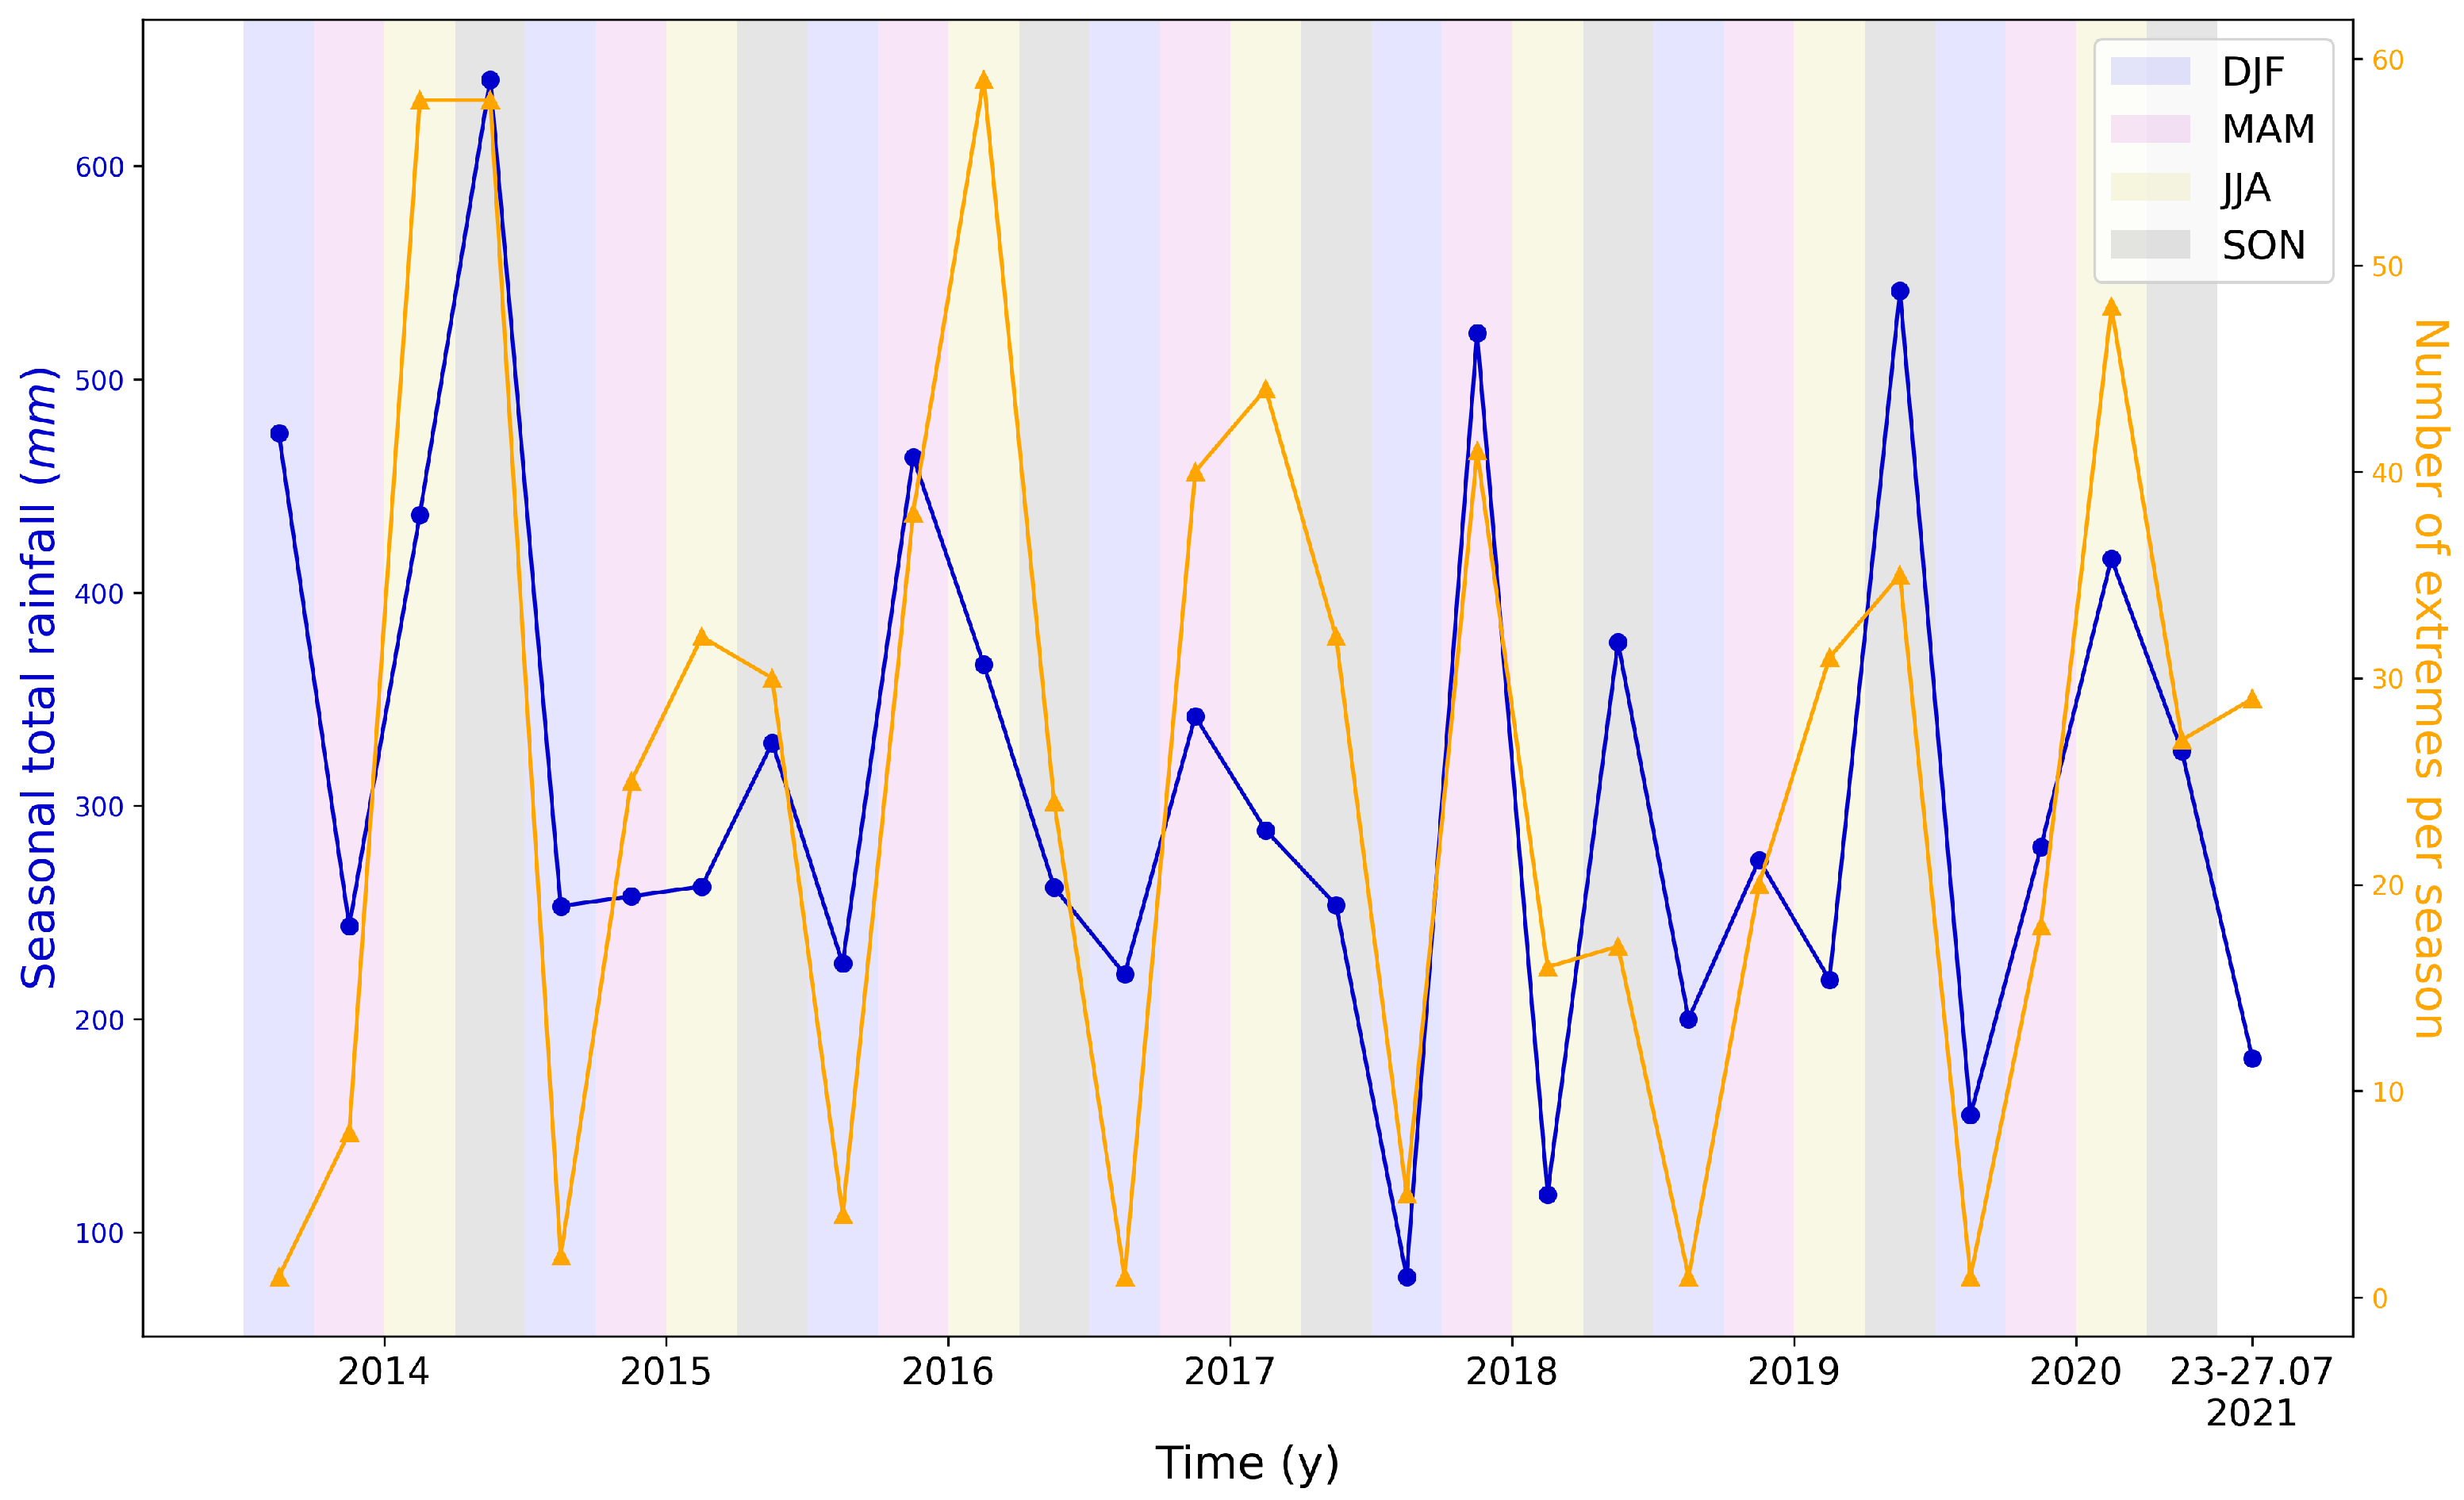
Figure 3 in the period 2010–2020. A plot was generated showing the total seasonal rainfall and the number of extreme events, for the period between 2014 and 2020 plus the last week of July 2021 (
Figure 4); as can be seen, in the five days in which the selected case study occurred, the number of extremes is already comparable to the number of an entire season.
The summer of 2021, indeed, in the northern regions of Italy was characterized by several unstable episodes with strong thunderstorm activity that lasted for most of the period with some very intense thunderstorms, especially in the last week of July 2021. Particularly severe weather phenomena were recorded in the period between 24 and 28 July 2021, within Lombardy. The effects of these meteoric contributions on surface runoff have been most critical in mountain and foothill basins. Moderate and sometimes high critical situations, associated with flash floods generated along the affected hydrographic network, have been reported quite frequently in these areas.
These phenomena are occurring with increasing frequency and often lead to emergency situations in the affected areas. In this context, the state of the art highlights the need to integrate new techniques that can provide additional information to event analysis.
The given overview prompted the selection of the Como event of July 2021 as being of interest for multi-sensor approach test analysis. In this study, we performed an observational study of the Lake Como (Italy) event occurred in July 2021, considering an area centered on the Como GNSS receiver position (latitude = 45.80217; longitude = 9.09563). The event, characterized by a significant impact on the ground in terms of damage and inconvenience [
39], turns out to be particularly interesting in the comparative study by different analysis techniques. The study offers the opportunity to investigate the applicability and consistency of the techniques used and to understand the potential of each type of observation and the possibility of integrating all available information into the analytical phase of this type of meteorological event.
2. Material and Methods
A multi-sensor approach to investigate severe weather conditions [
40] is an effective method to analyze the event from different points of view, such as meteorological, hydrological, and even phenomenological. For this purpose, the event was analyzed using both conventional and non-conventional observations (rain gauges [
41], atmospheric sounding [
42], radar [
43,
44], satellite-based Earth observation products [
45], GNSS [
46], and lightning detection network [
16,
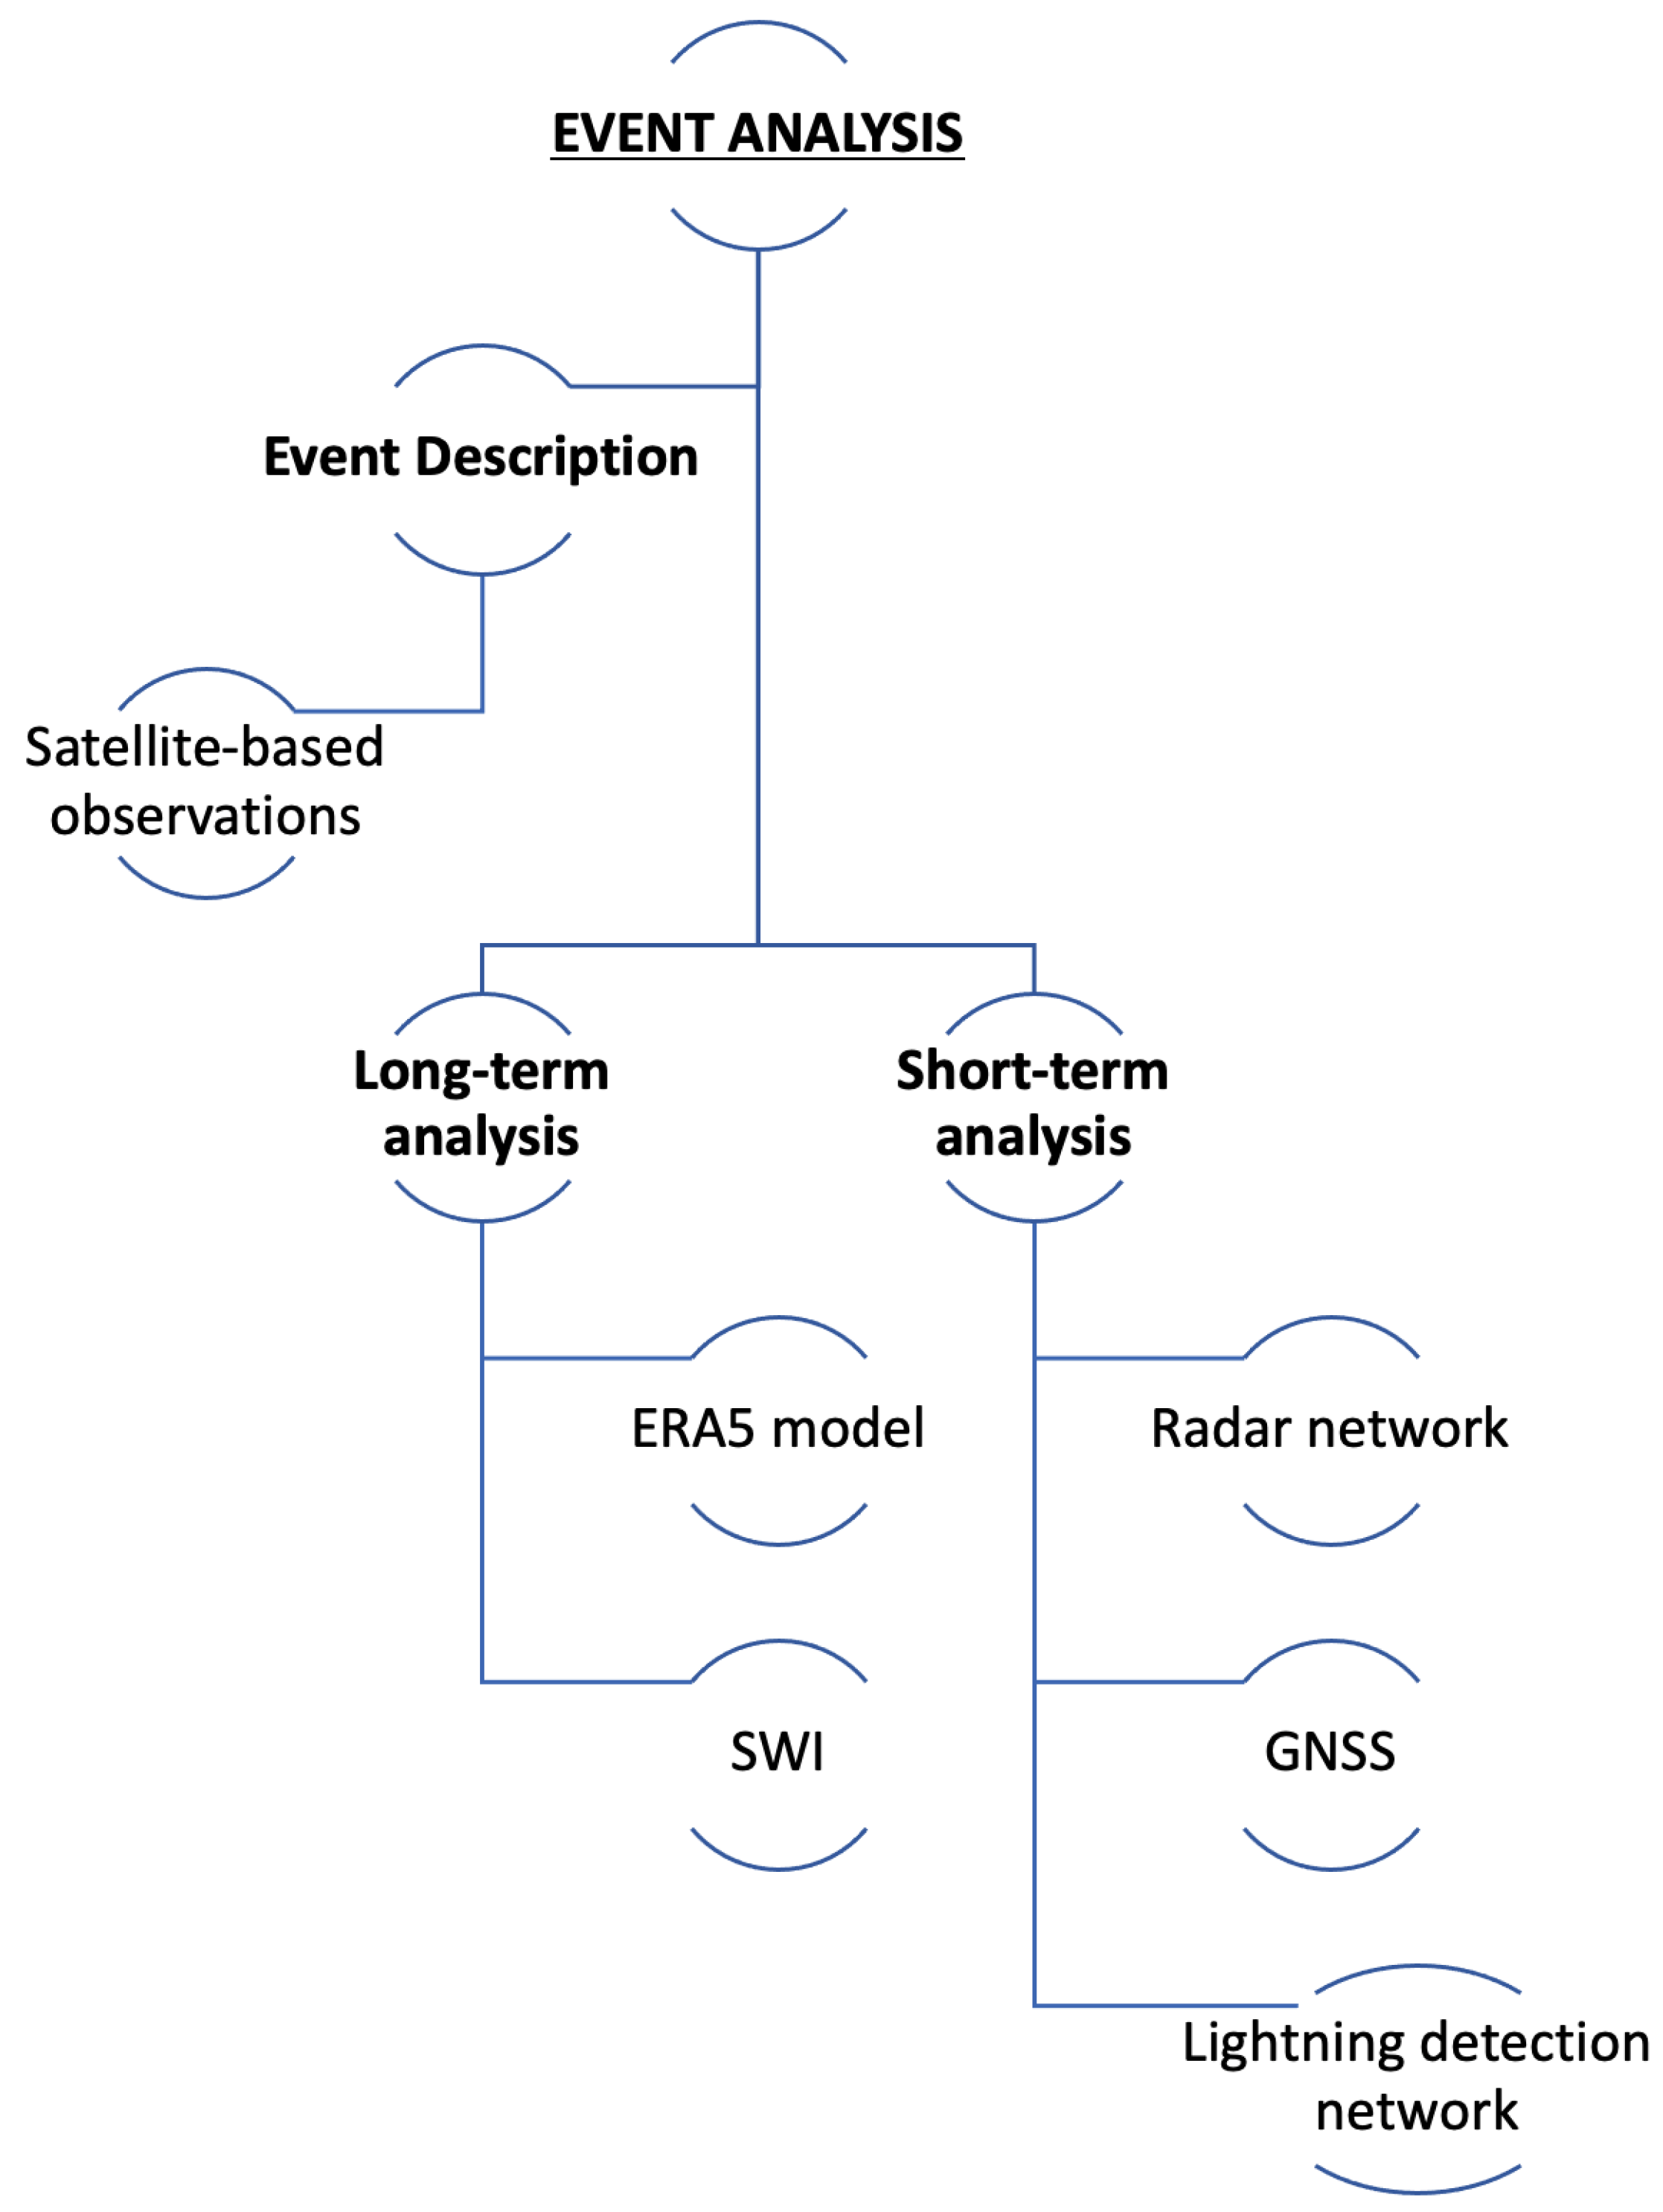
47]). Some techniques were applied for descriptive purposes, others for more strictly analytical purposes. However, the overall aim remains that of assessing the organic use of the various techniques in order to produce a comprehensive analysis of the event under consideration. With reference to the conceptual map shown in
Figure 5, the analysis of the event was conducted organically using satellite data (SEVIRI-MSG, and H SAF products) to describe the event, climatological data (ERA5 and SWI) for a long-term preliminary analysis of the area, and radar, lightning and GNSS data for short-term analysis.
In this section, for the sake of clarity, the different techniques applied are briefly described.
2.1. Satellite-Based Earth Observation Products
Meteosat satellites currently operate over Europe, Africa and the Indian Ocean, in geostationary orbit above the equator. The Meteosat Second Generation (MSG) system is set up in cooperation between EUMETSAT and ESA and ensures the continuity of observations after Meteosat First Generation. MSG is equipped with the SEVIRI (Spinning Enhanced Visible and Infrared Imager) sensor which allows the acquisition in 12 channels (two in visible 0.6 and 0.8 µm; one in NIR 1.6 µm; eight channels in IR 3.9, 6.2, 7.3, 8.7, 9.7, 10.8, 12.0, and 13.4 µm; and the last visible in high-resolution HRV) on a continuous loop. Each cycle takes 15 min to acquire the entire full disk (12 min for acquisition and the remaining for calibration) from the southern hemisphere to the northern hemisphere. There is also a second operational scan called rapid scan service (RSS) that acquires data every 5 min over the European area and part of North Africa. Channel resolution is 3 km (1 km for HRV). The raw data acquired by the Meteosat are collected by the EUMETSAT control center and from there are pre-processed and redistributed via satellite (EUMETCast). During this phase, some possible imperfections of instrumental origin are substantially corrected, and the geometric distortion is improved toward a standard projection [
48]. In this work, appropriate channel analyses (
Table 1), illustrated in the following sections, were performed [
49].
In the frame of the Satellite Application Facility on Support to Operational Hydrology and Water Management (H SAF), the P-IN-SEVIRI-PMW (H60; Precipitation rate at ground by GEO/IR supported by LEO/MW) product was employed for precipitation analysis.
P-IN-SEVIRI-PMW is an operational product based on infrared (IR) images from the SEVIRI instrument on-board MSG satellites blended with all the available precipitation micro-wave estimates (PMW).
The spatial coverage of P-IN-SEVIRI-PMW includes the H SAF area (Europe and Mediterranean basin), Africa and Southern Atlantic Ocean. The product is provided on the MSG SEVIRI grid, at the 15 min imaging rate of SEVIRI, and the spatial resolution is consistent with the SEVIRI pixel (3 km at nadir).
The processing method adopted for the product is called “rapid update” (RU). Following this technique, the precipitation estimates are obtained by combining IR GEO equivalent blackbody temperatures (TB) at 10.8 µm with rain rates (RR) from PMW measurements.
2.2. ERA5 Model
Italy has a large and dense coverage of meteorological sensors, yet its use aimed at a long-term climatological study is rather cumbersome. For this reason, in order to define a climatology, a statistical analysis on the ERA5 (fifth generation of meteorological reanalyses issued by ECMWF (European Centre for Medium-Range Weather Forecasts)) dataset [
50] for the period 1980–2020 was performed. The reanalyses combine the integrated forecasting system (IFS) model background field with observations to achieve the best estimate of the atmosphere. The ERA5 employed model, covering the whole Earth, uses 137 layers to resolve the atmosphere in the vertical direction and has a horizontal resolution of about 30 km. The ERA5 dataset includes hourly estimates of a wide range of variables, and in the frame of this research, we have employed the following parameters:
Total column water vapor (tcwv) [kg m
2], which represents the total amount of water vapor in a column extending from the surface of the Earth to the top of the atmosphere (i.e., the area averaged value for a grid box) [
50].
Total precipitation (tp) [m], which is the accumulated liquid and frozen water, comprising rain and snow, that falls to the Earth’s surface. It is the sum of large-scale precipitation and convective precipitation. Large-scale precipitation is generated by the cloud scheme in the ECMWF-IFS. Convective precipitation is generated by the convection scheme in the IFS, which represents convection at spatial scales smaller than the grid box [
50].
2.3. Soil Water Index
Satellite soil moisture observations are retrieved from the Copernicus Land Monitoring Service that provides the Soil Water Index (SWI) obtained from the EUMETSAT advanced scatterometer (ASCAT) soil moisture starting from January 2007 to now. The ASCAT SWI product is available with a spatial resolution of 10 km and a daily temporal resolution (data are representative of 12:00 local time).
2.4. Radar Network
The Italian weather radar network is currently composed of 24 systems, including 20 C-band and 4 mobile X-band systems, the latter being mainly used as gap fillers. About of the network is composed by radars with dual-polarization capabilities. The northern part of the country benefits from a rather good observational coverage, especially in the Po river basin, where the minimum number of overlapping radars is two on the western side, reaching 5 or more in the eastern sectors.
2.5. GNSS and Atmospheric Sounding
Dry air and water vapor molecules in the troposphere affect GNSS (global navigation satellite system) signals by lowering their propagation velocities [
51]; this effect, if properly analyzed, can provide useful information for atmosphere sensing [
52]. The extensive presence of GNSS sensors in Italy and the availability of their data represent a strong basis for the usage of this technique for meteorological applications. Considering the advantages provided by GNSS post-processed data reported in the scientific literature for various meteorological analyses [
32,
36,
53,
54,
55,
56,
57], the transition to NRT (near real-time) GNSS meteorology operational systems [
46] is crucial for providing information useful to predict rapidly evolving weather events [
58,
59,
60]. Capturing atmospheric water vapor with high spatio-temporal resolution [
59], GNSS-NRT data can be extremely helpful in the case of early warning systems related to severe weather events, in order to mitigate risk by providing timely warning of the hazard and thus giving useful information to limit damages.
The data management methodology described here is only applied to the global positioning system (GPS) constellation data, for reasons of real-time data availability, applying the PPP (precise point positioning) processing technique using the Breva software. Breva is a GNSS data-processing suite developed by GReD using the goGPS software [
61] as its core processing engine. The processing parameters used for this near real-time solution can be seen in
Table 2.
The area of interest is covered by 12 dual-frequency GNSS receivers and, in order to demonstrate the validity of the data obtained from them, validation was carried out by radiosonde, using a procedure already used in the past for post-processed data [
36].
The comparison was performed among punctual ZTD (Zenith Total Delay) values derived from sondes released at the launch point of the Radiosonde 16064 LIMN Novara Cameri and the ZTD estimated by processing the closer GNSS station NOVR. The target period was from 23 July to 30 July 2021. RAOB data were collected every 12 h, whereas GNSS outputs had a time step of 5 min. The results of the ZTD comparison show great consistency between the data, with a favorable [
42] difference analysis: Mean = 0.2 cm and standard deviation = 1.0 cm, which provides an encouraging feedback on the dataset obtained through the NRT processing outlined above. In this study, GNSS data are employed in different comparisons, both in terms of IWV (estimate of the integrated water vapor overlying the receiver [
52], obtained by mapping function from observations on the different satellites lines of sight) and PWV (precipitable water vapor, obtained dividing the value of IWV by the water density [
46]). These quantities [
46,
52] were computed from GNSS-NRT data using the meteorological parameters from global pressure/temperature (GPT) model (a global empirical model providing an approximation of meteorological parameters) [
62]. In this work, we had no real-time data available from weather stations; therefore, we preferred to rely on the GPT model. The above model, in similar circumstances and in the absence of observed data, provided reliable results in the past [
47]; however, we point out that if there is the availability of more accurate data, it is certainly appropriate to refer to those, avoiding problems that might occur in the analysis of severe weather events.
2.6. Lightning Detection Network
Lightning data used in this paper are provided by the Lightning Detection Network (LINET) [
63,
64]. The LINET is a ground network which counts more than 500 sensors worldwide, more than 200 of which are located in Europe, with a higher density over Central Europe and Western Mediterranean (from 10° W to 35° E and from 30° N to 60° N). LINET measures the total lightning, i.e., both intra-cloud (IC) and cloud-to-ground (CG) discharges. Data processing is performed through a 3D procedure called time-of-arrival (TOA) [
64]. This 3D algorithm consists of three phases: flash 2D location through TOA, exploitation of the time delay at the sensor nearest to the lightning, and time relaxation of the travel path of the radio wave. Following this procedure, two pieces of information can be obtained. First, it is possible to distinguish between IC and CG discharges and second, the flash height can be calculated for IC flashes. LINET sensors provide, for each discharge, the following data: date and time of occurrence, latitude, longitude, type of discharge (IC or CG), lightning amperage and height (for IC discharges). In this work, lightning data over the Italian territory are used, and all discharges recorded in 1 s and in a 10 km radius are considered as a single flash [
65].
3. Results
A mostly stable phase over central Mediterranean area has persisted since the beginning of June, with short-lived inflows of cooler air at high altitudes, especially over the northern regions. After this, in the last week of July, a deep depression area has positioned between France and the United Kingdom, causing a lowering of the jet stream at latitudes even below the Alpine area and over the Po Valley.
This situation persisted until the end of the month, with an acute phase between 26 and 28 of July 2021. On 25 July 2021, a southwesterly flow, derived from a deep Atlantic tough extending from the North Sea to the Iberian Peninsula, was observed over the northern regions of Italy. This configuration, facilitated by the arrival of colder air in the middle and upper troposphere, resulted in the development of intense thunderstorm cells over Northern Italy, including supercells in the lowlands.The effect of the intense updrafts, with high vertical shear, is accentuated in this event by the intense jet stream at high level, with a direction from south-west to north-east right across the Po Valley.
In the morning of 27 July 2021, the deep Atlantic tough approached further the northern regions, again causing the development of intense thunderstorm cells, following a south-west to north-east direction, with a slow eastward movement.
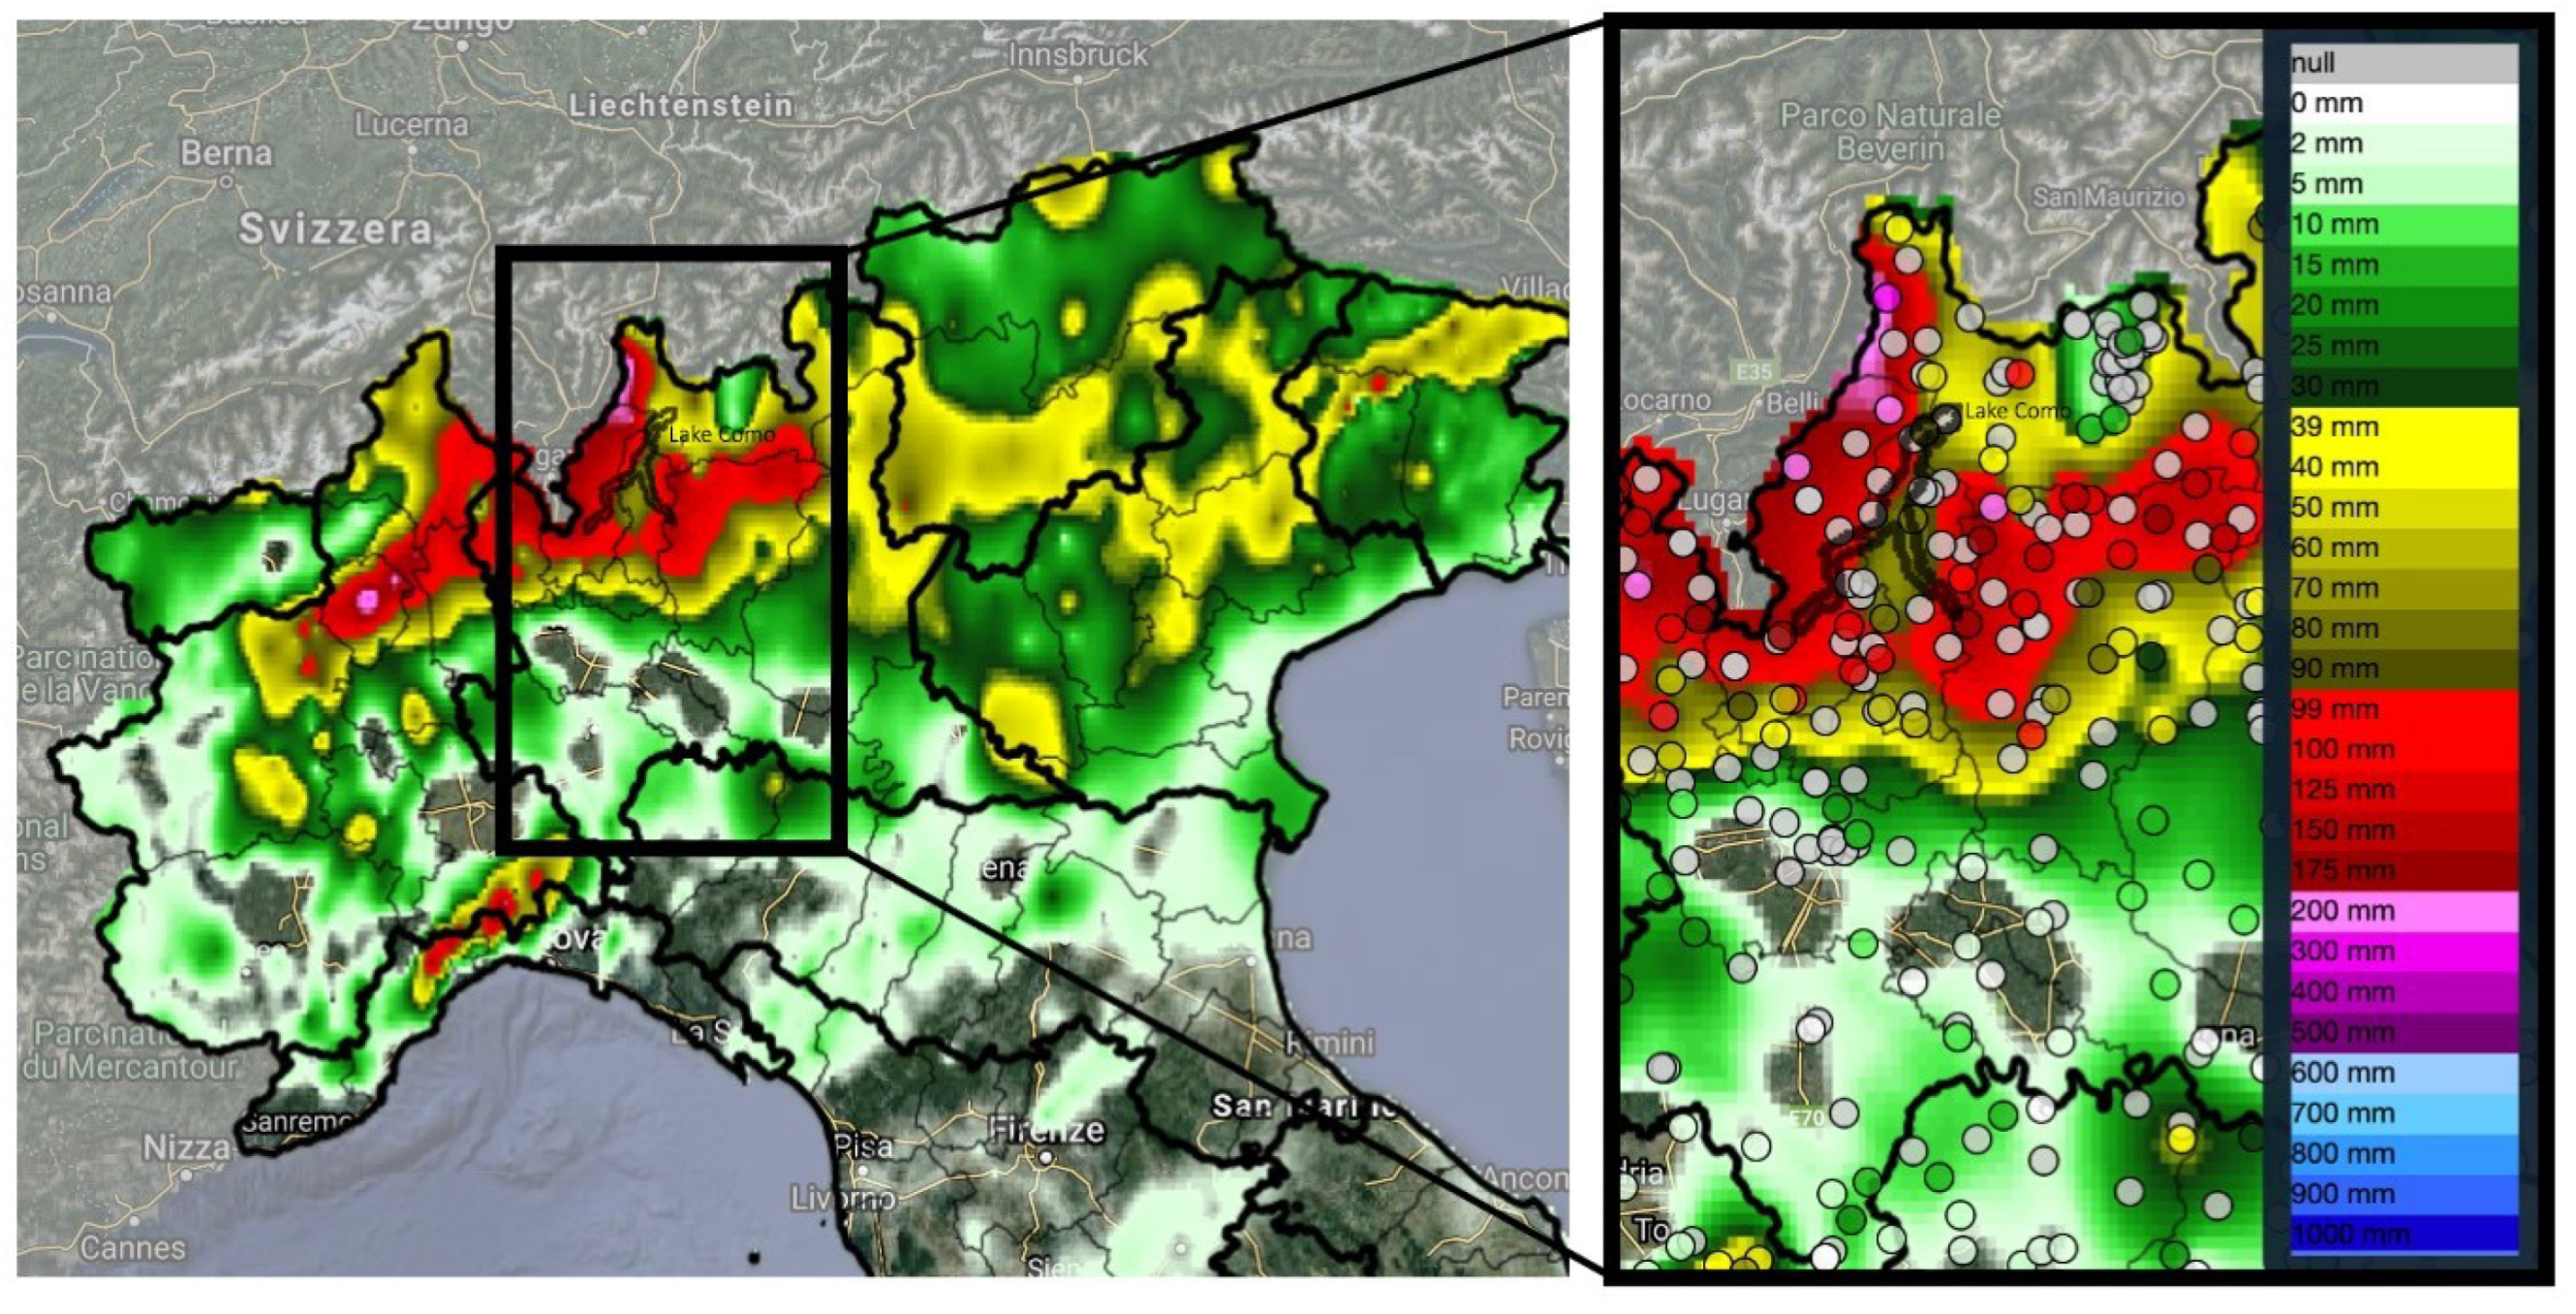
The thunderstorms developing over Northern Italy determined a considerable rainfall over the area well-detectable by both the Italian rain gauge network and the satellite-based Earth observation products. Specifically, the H SAF P-IN-SEVIRI-PMW product was employed to evaluate the accumulated rainfall, and it showed good accordance with radar—SRT1 (Surface Rainfall Total) adjusted data. This agreement encourages the joint use of different platforms, future multi-instrumental applications and potential use of the H SAF product for the analysis of events in areas not covered by radar.
Figure 6 shows the rain map downloaded from the MyDewetra platform [
66]. The map provided by this platform is produced using the Random Generator of Spatial Interpolation from uncertain Observations (GRISO) [
67,
68], which obtains spatially continuous rainfall maps (over 5 × 5 km grid) from individual gauge measurements, and is given for the whole period of interest (5 full days between 24 July 2021 at 00:00 UTC and 28 July 2021 at 23:55 UTC).
Specifically, the severe weather caused great inconveniences and damages everywhere in Como city and its province.
The Lariana road was completely blocked in several points due to debris, flooding and landslides caused by overflowing torrents. No injuries were recorded but the damages and inconveniences were considerable.
Significant disruptions were also found in the Como center, where some streets were flooded. A long-term analysis, on the whole area in the period 1980–2020, was carried out by ERA5 data. The analysis was performed on the whole area over the period 1980–2020. The value corresponding to the 90th percentile of total precipitation and total column water vapor ERA5 parameters was computed and used as a threshold to assess how many times this value was exceeded in each pixel. The linear trend in the period 1980–2020 was computed, pixel by pixel, and normalized [
69] according to the maximum value of the entire area. This kind of analysis allowed to assess how, over a period of 40 years, there has been an increasing rate of threshold exceedences in the area affected by the event, particularly in the northern part of Lake Como (see
supplementary material).
Hence, the identification of the area as increasingly exposed to intense events and therefore of interest for the study. An analysis of soil moisture during the days before, and a day after, the main hydrological event was also conducted in order to better understand the soil condition which led to the phenomena.
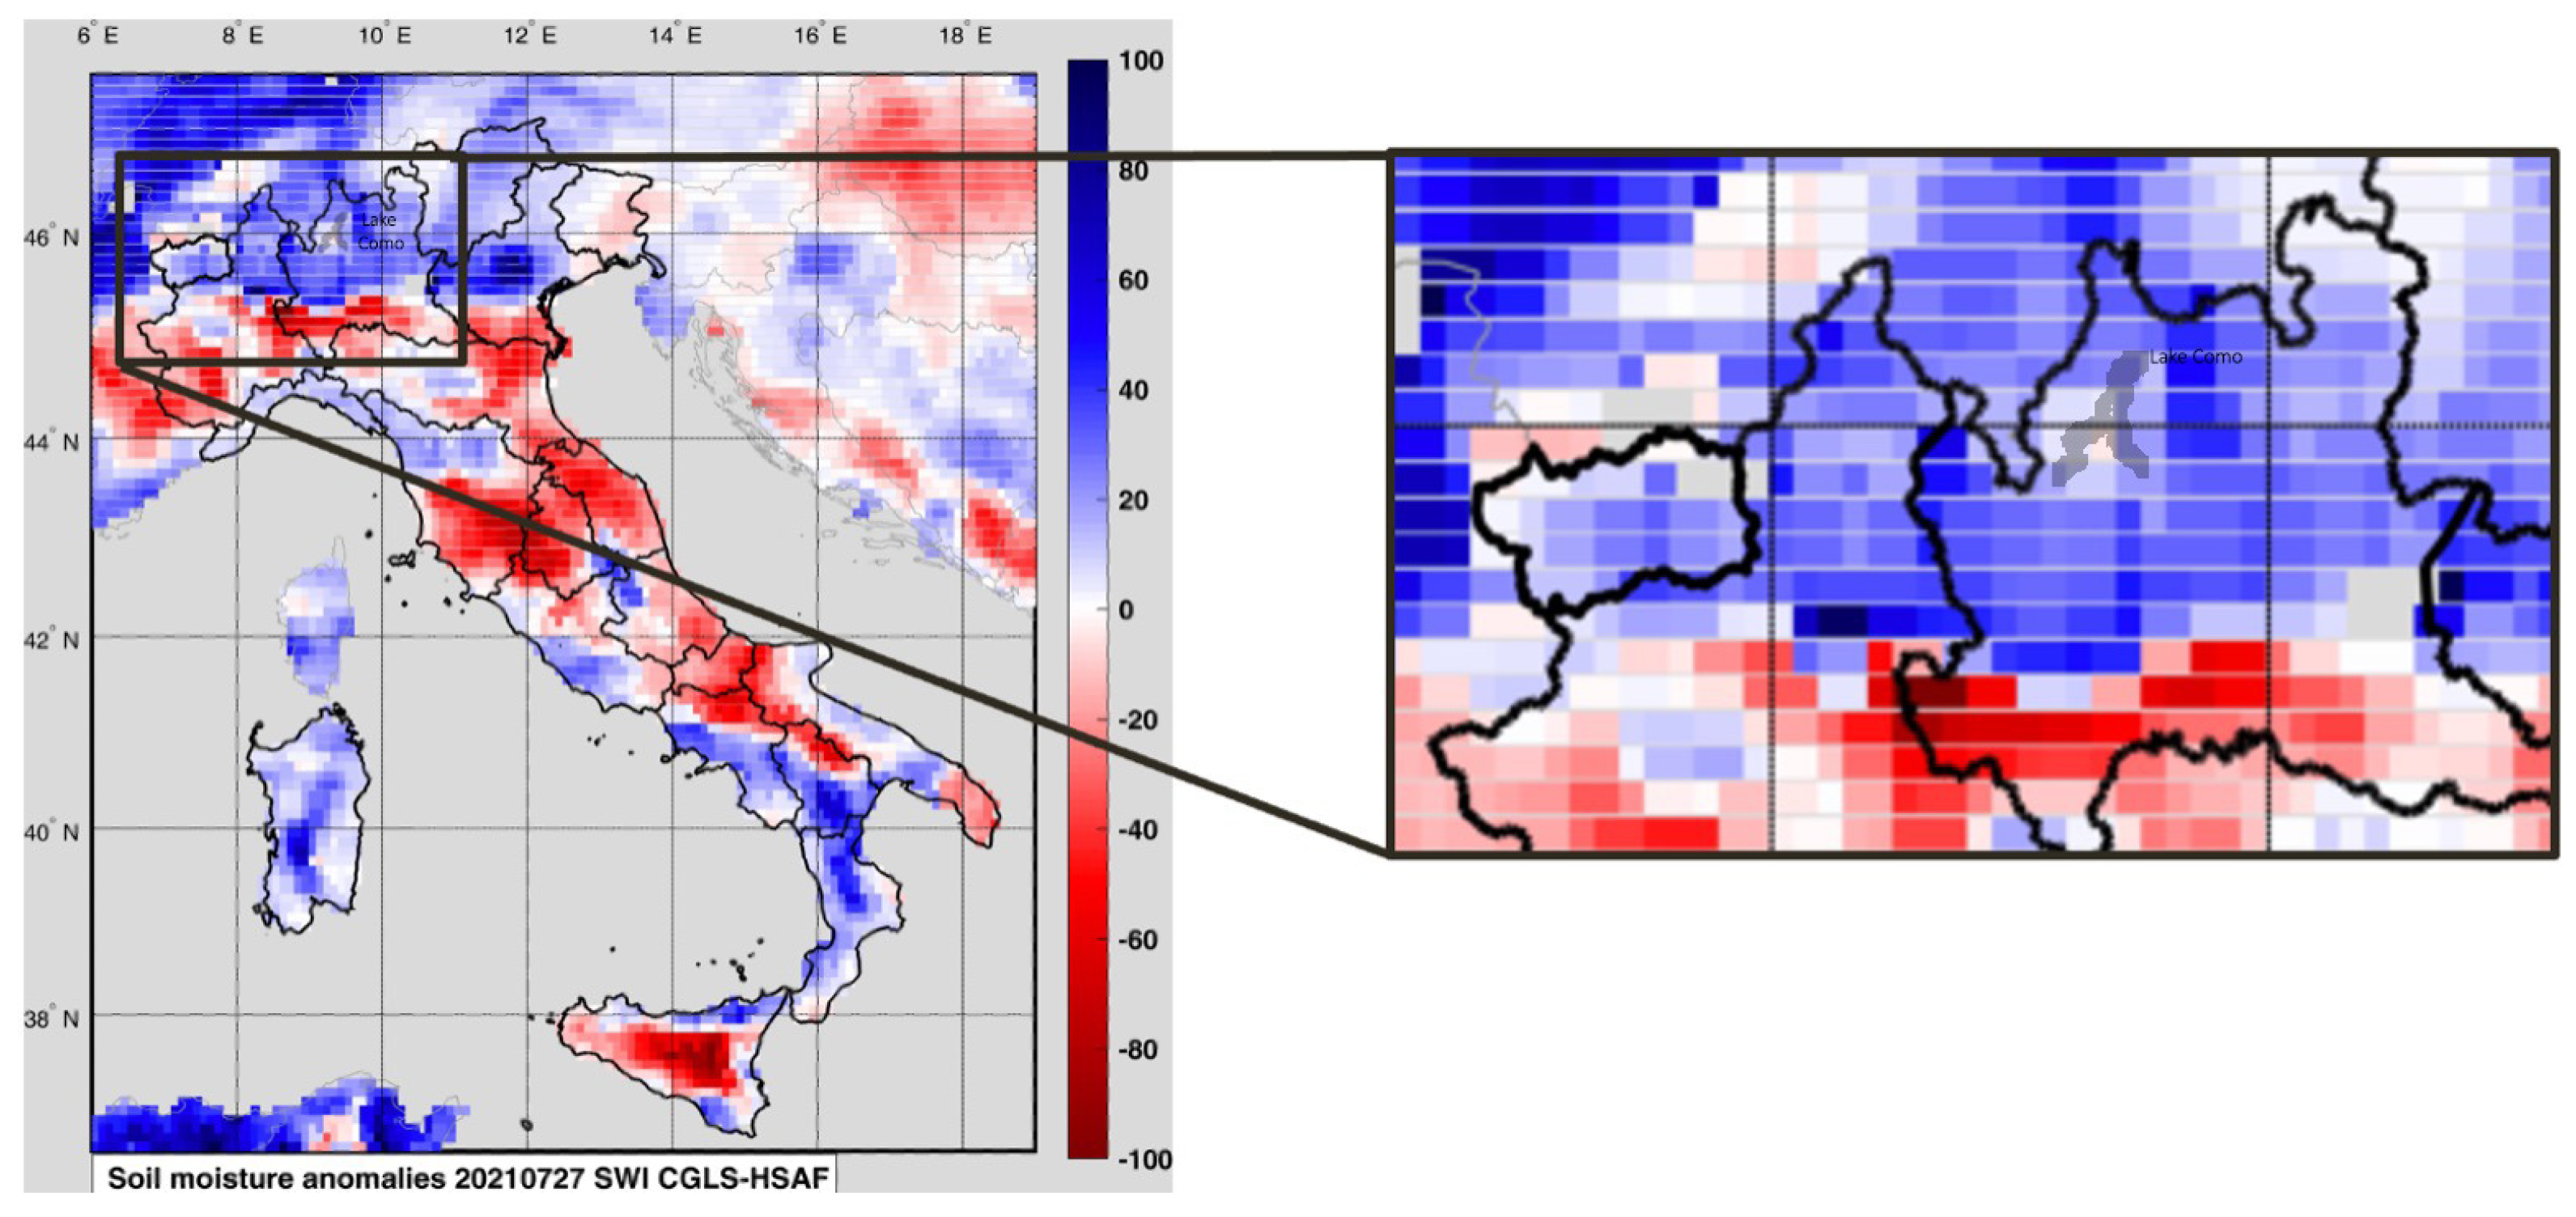
By considering the ASCAT SWI product, the seasonal anomalies were computed for each day of the year (i.e., the difference between the current soil moisture conditions and the monthly climatology of each pixel).
During the whole period, the soil moisture conditions in the investigated area were wetter than normal, and in the days of 27 and 28 July, very wet conditions were achieved (close to saturation). Specifically, by looking at
Figure 7, showing a zoom over the investigated area, it is evident the occurrence of very wet conditions at the borders between Italy and canton of Ticino (north of Como city). These wet conditions together with the significant rainfall amounts were the main factors causing the large impact of the event over the territory. One of the most significant events that occurred during the period analyzed is the heavy hailstorm recorded in the afternoon of 25 July. For this specific event, a short-term analysis was performed using data from the lightning network, radar and GNSS.
Short-Term Analysis
Based on the observations provided by the dual-polarization weather radar sited in Turin, far by about 145 km from the storm core, the event most intense phase was observed on July 25th, between 14:00 and 15:00 UTC. Despite the distance, the detected echo was rather intense. Indeed, looking at the storm time evolution in terms of the maximum intensity along the vertical, the reflectivity (dBz) mostly exceeded 55 dBz, with a maximum of about 65 dBz. The time sequence of the estimated vertically integrated liquid (VIL) content (expressed in kg/m
) between 14:00 and 14:40 UTC of the 25 July 2021, allows to argue that the Como area has been affected by a large-sized hail bearing storm and, according with the empirical linear relation linking the maximum hail size to the VIL (kg m
) in the range 45–70 kg m
proposed by [
70], extrapolated as in [
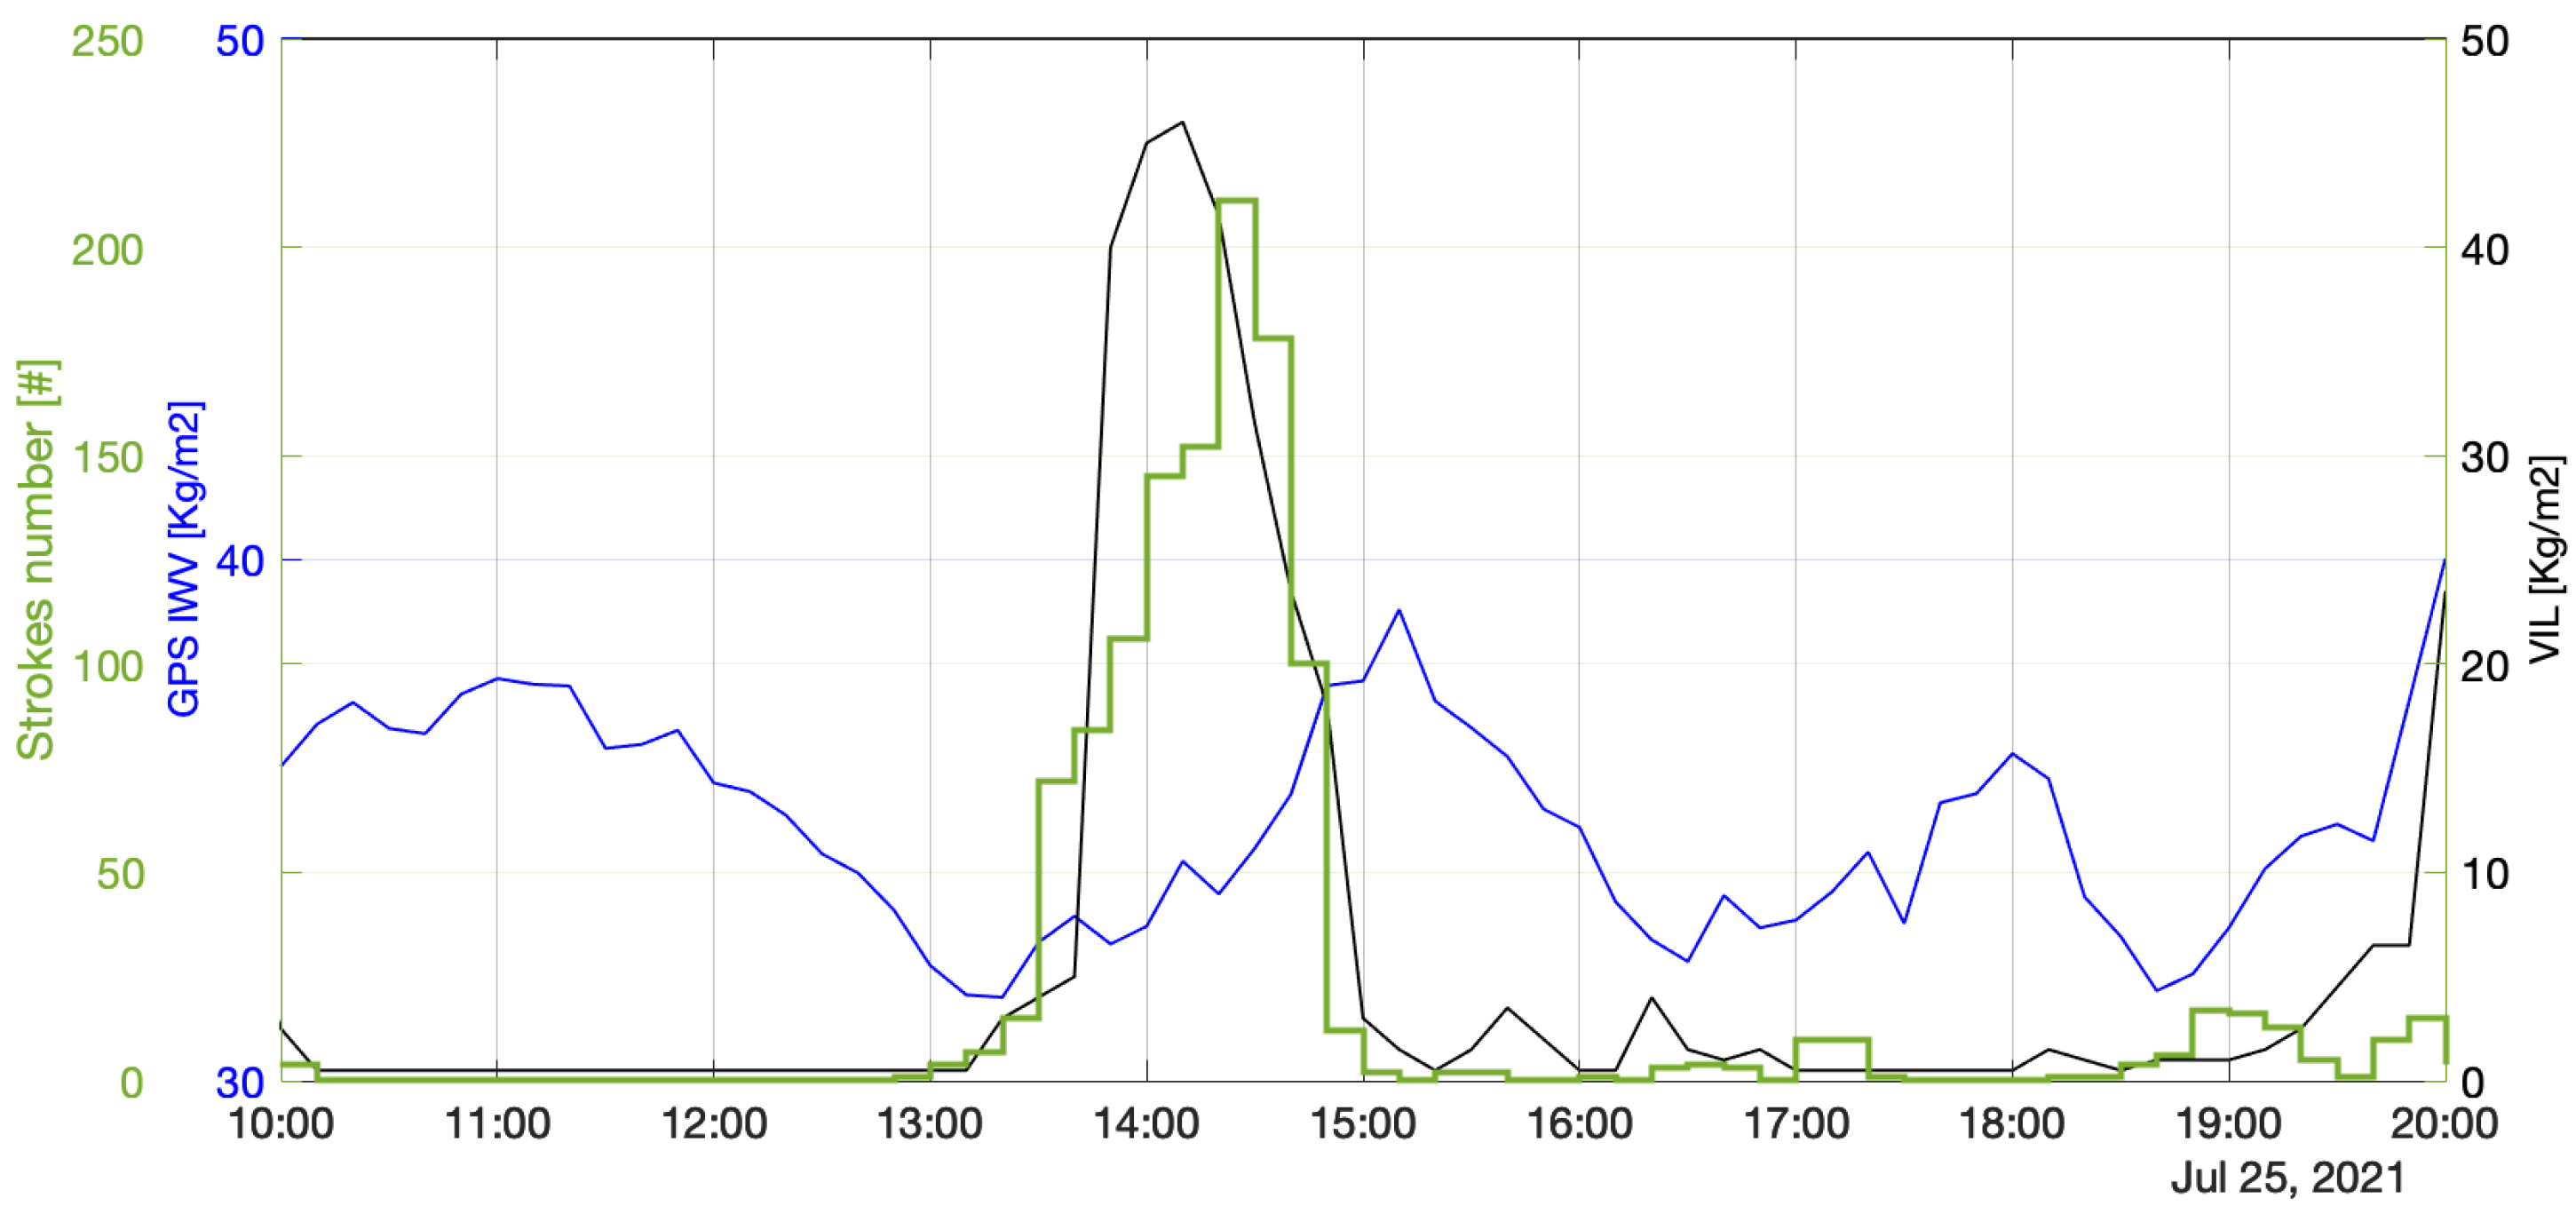
71] to higher values, we estimated that the hail size likely exceeded 10 cm. Given these premises, the analysis was performed focusing on the time period between 10 a.m. and 8 p.m. on 25 July 2021. The study was made assessing organically MSG SEVIRI data at 15 min (Ch9 black line in
Figure 8, Ch7-Ch9 cyan line in
Figure 8 and Ch5-Ch6 purple line in
Figure 8 (
Table 1)), lightning data from LINET network with a time span at 10 min (green line in
Figure 8), radar-VIL data at 10 min and PWV [
46,
52] also at 10 min.
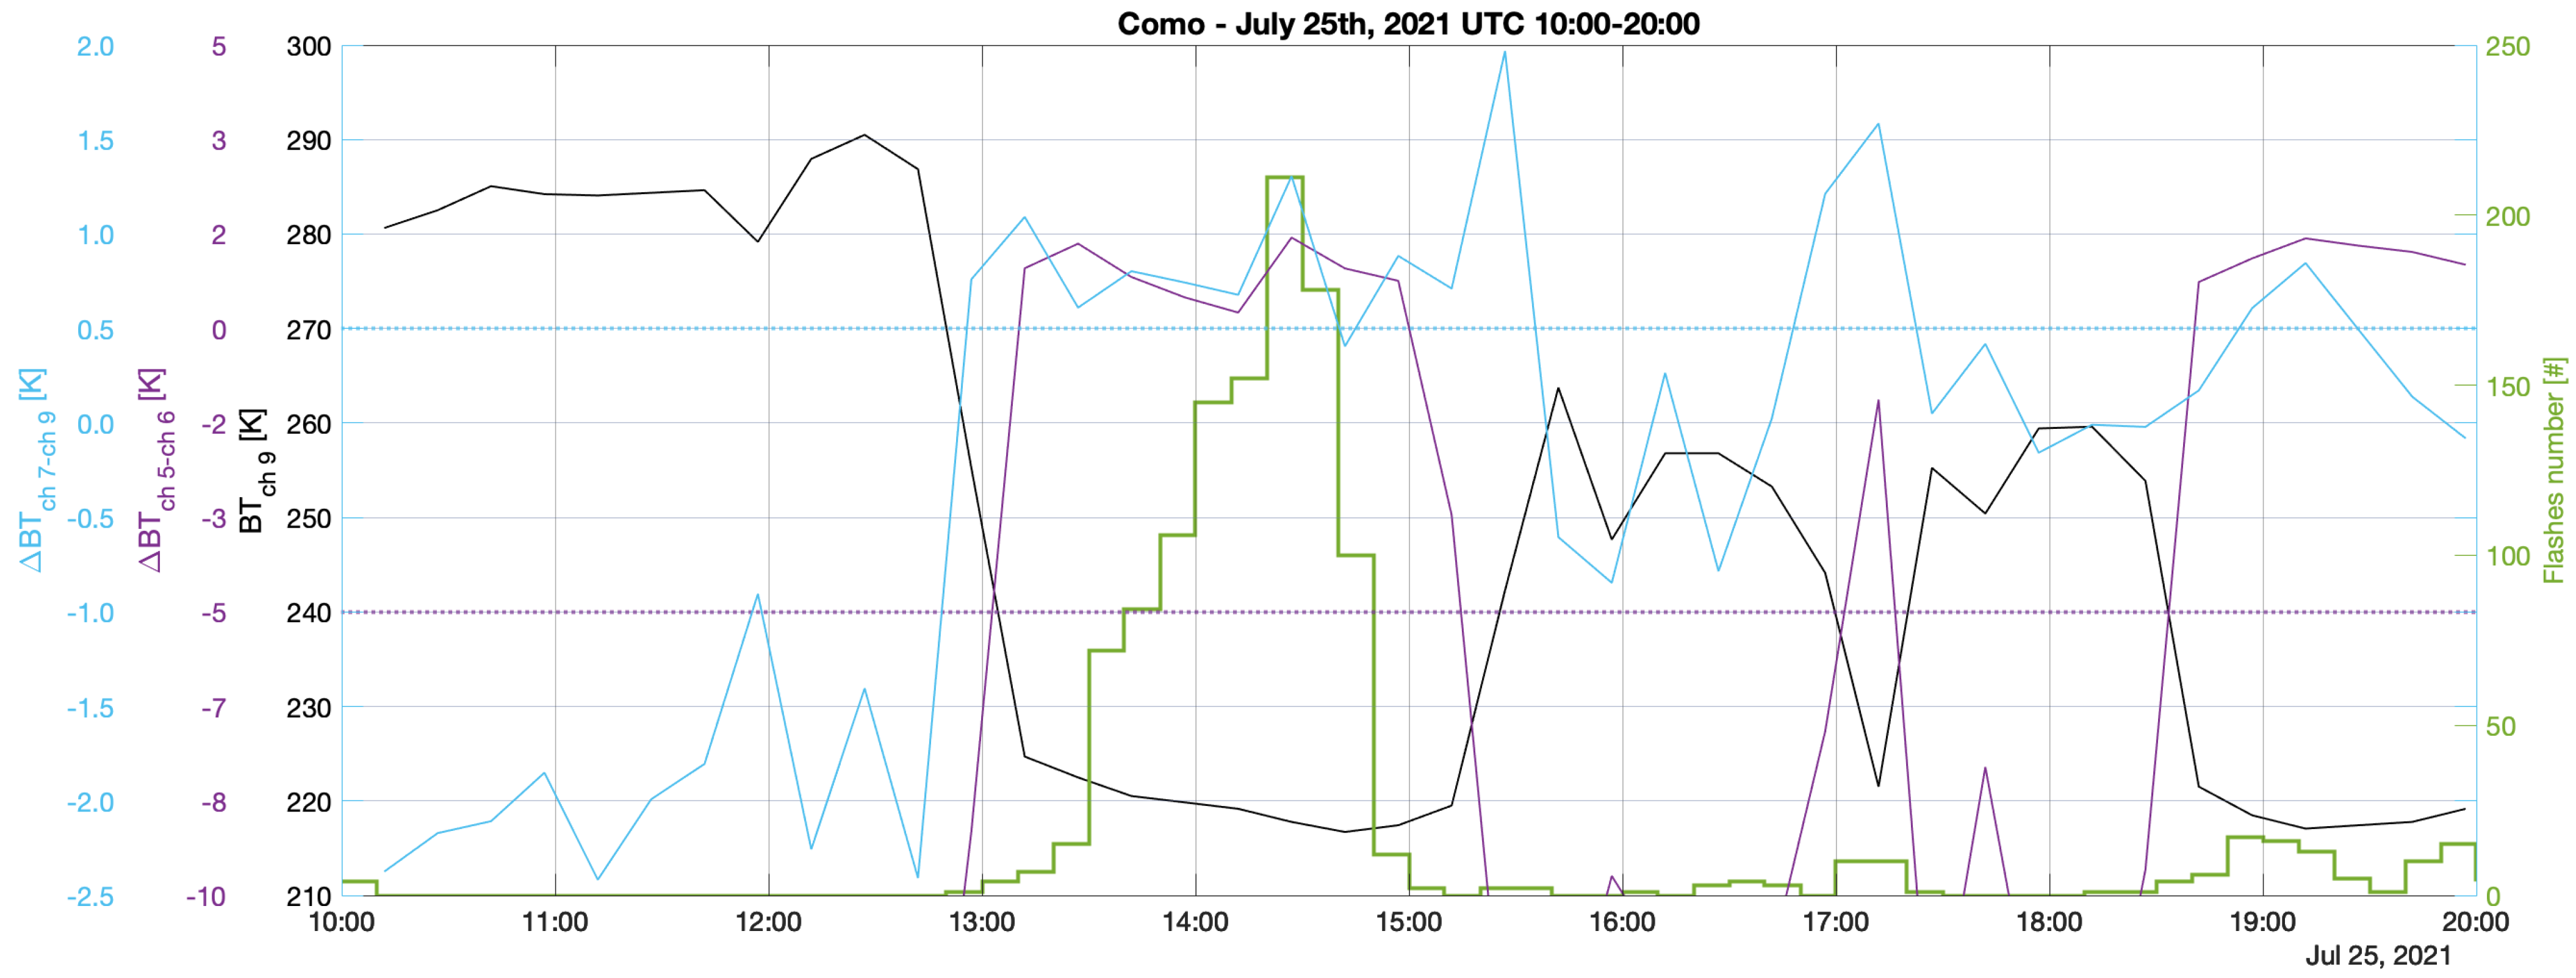
As plotted in the
Figure 8, the lightning data show a high electrical activity over Como between 1.00 p.m. and 3.00 p.m., with maximum values more than 200 str/10 min.
With reference to this event, an analysis of brightness temperatures from SEVIRI MSG was carried out. The brightness temperature (BT) of the IR channels was computed as the median value over the 3 × 3 pixels around the grid point on Como (lat = 45.80217; lon = 9.09563). Channel 9 (black line in
Figure 8), which estimates the cloud top temperature, highlights a decrease of the cloud temperature (vertical growth) just before 1.00 p.m., a few minutes before the beginning of the lightning strike, when it goes from 285 K to 225 K in 30 min. At 2.57 p.m., it reaches the minimum BT value (around 220 K) corresponding with the maximum lightning strike.
The difference between channels 7 and 9 (cyan line in
Figure 8) identifies the presence of ice at the top of the cloud when the value exceeds 0.5 K (horizontal cyan line in
Figure 8). This happens around 13:00; actually, it is evident between 13:00 and 15:00 when lightning strikes also reach the maximum values.
The difference between channels 5 and 6 (purple line in
Figure 8) identifies a high cloud thickness if the difference exceeds −5 K (horizontal purple line in
Figure 8), which is apparent between 1 and 3 p.m.
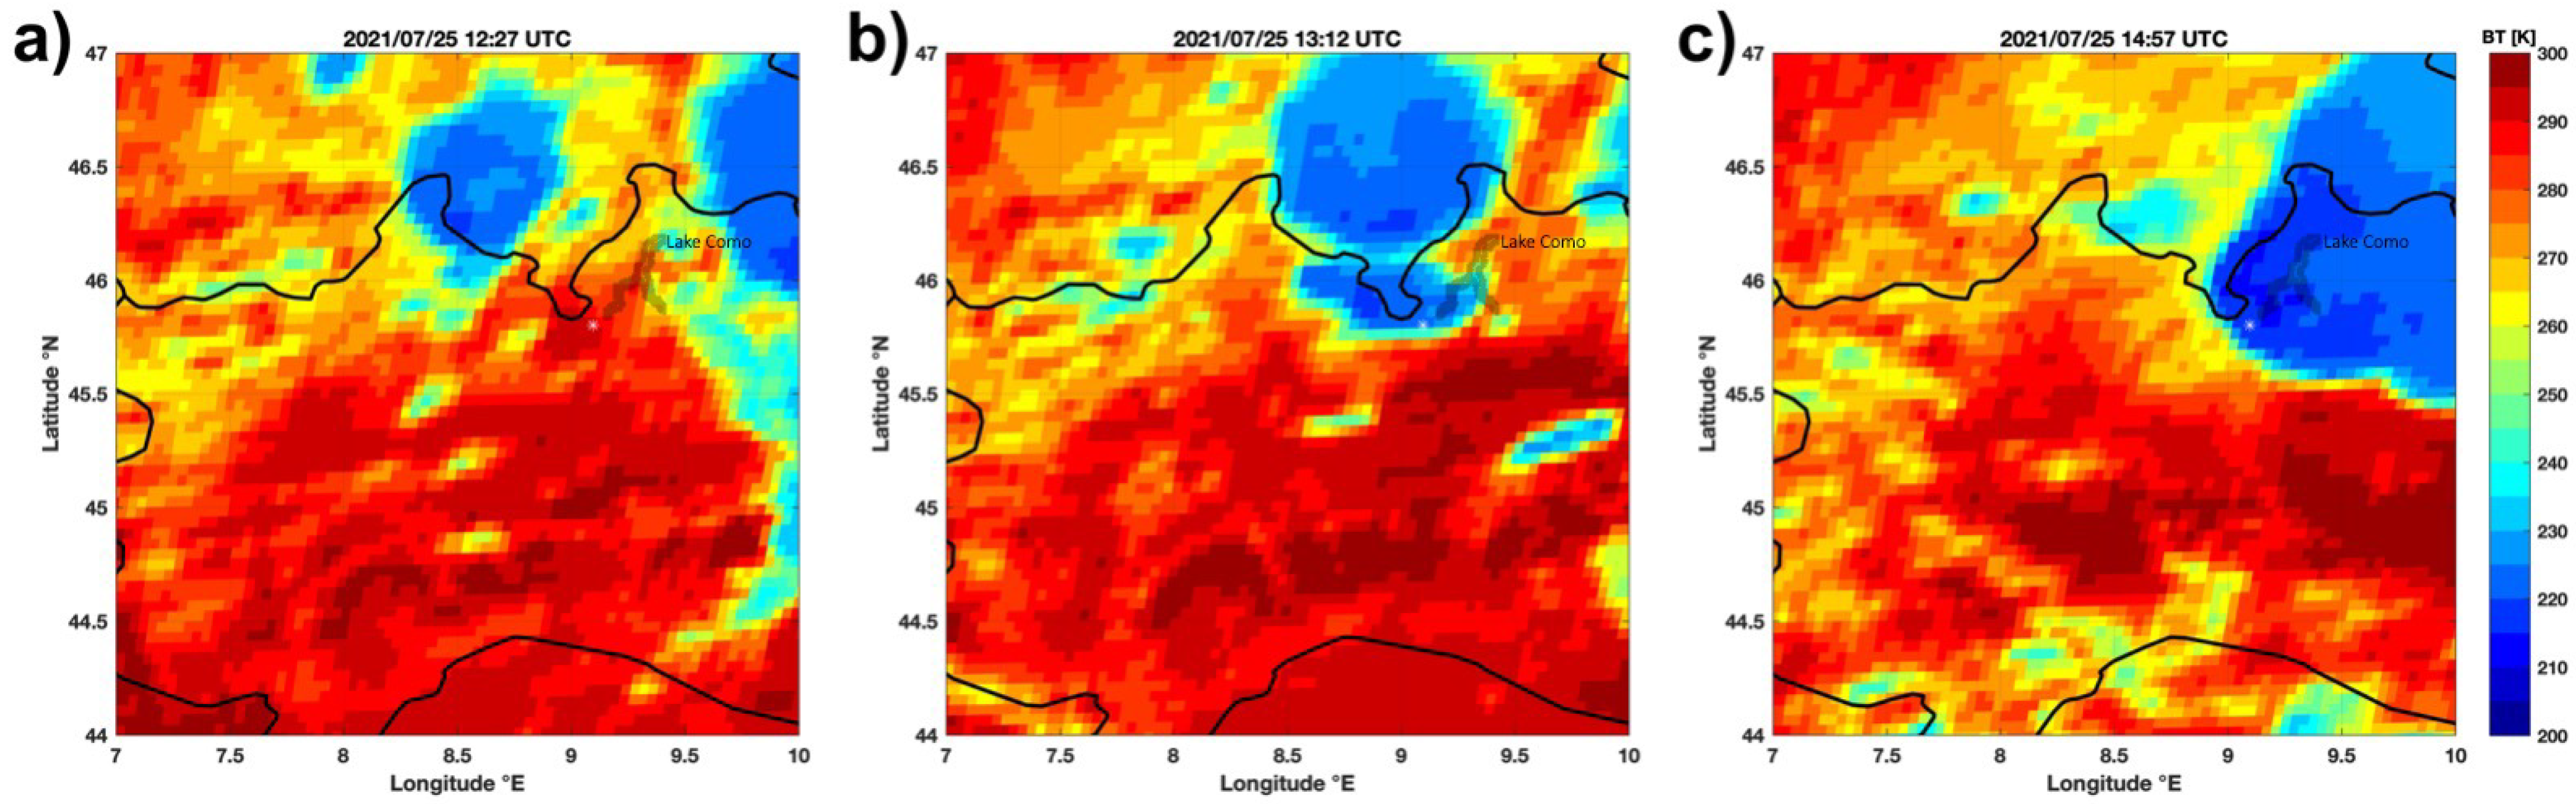
A qualitative analysis of satellite images allows to notice the evolution of the thundercloud that involved the Como area and evolved in a V-shape thundercloud. The cloud originally developed to the west of Lake Como, over Southern Switzerland near the Italian border and moved east-south/eastward over the next 2.5 h, involving the Como area between 1 and 3 p.m. (
Figure 9).
Figure 9 shows 3 panels, (a) 12:27, (b) 13:12 and (c) 14:57 UTC), representing acquisitions in the 10.8 micron channel from the SEVIRI sensor on board MSG cropped over the area of interest (Como coordinates: lat = 45.80217; lon = 9.09563). The panels show, respectively, (a) the instant just before the arrival of the convective cloud over Lake Como; (b) the instant in which the storm cell reaches the area of interest, which is the beginning of the event on the Como area; and (c) the moment in which the minimum of the BT (217 K), i.e., the maximum of the convective development of the cloud, is reached in Como. This instant is the closest to the maximum of lightning as shown in
Figure 8. The color scale in the figure indicates the cloud top BT and ranges from blue (200 K) to red (300 K). Shades of blue (BT ≤ 240 K) indicate the presence of clouds with a gradually increasing altitude as the BT decreases. More intense blue tones indicate a colder cloud top and, generally, greater severity of the storm cloud.
The analysis of radar data and, especially, VIL allows the evolution of the main convective cell to be monitored. As shown in
Figure 10, lightning is well-correlated (correlation coefficient = 0.85) with VIL and tends to follow its trend temporally. GNSS observation also shows a good ability to track the event; however, as can be seen from
Figure 10, the peak recorded by the GNSS data does not coincide with the maximum provided by the lightning data. Making a test calculating the VIL median over a gradually increasing area (from a radius of about 10 km to a radius of almost 30 km), a closer approximation of the VIL to the GNSS dataset trend is noticed; indeed, increasing the size of the box where the median is calculated, the peak of VIL is smoothed and shifted in time in the direction of the maximum value recorded by the GNSS data (see
supplementary material). This suggests that the delay in the GNSS observation is related to the geometry of the observation which, in the case of these receivers, is inclusive of the observations collected within a radius of view greater than the 10 km that characterizes the other observations shown in
Figure 10.
4. Discussion
The comprehensive analysis of the intense weather event that occurred in July 2021 in the Lake Como surrounding areas has highlighted many features under different points of view. The introductory description of the event was provided resorting to the data by operative tools [
66,
72,
73] mainly used in Italian DPC. The climatological analysis, carried out in terms of different parameters (TCWV and TP by ERA5 [
50] and Soil Water index), highlighted how the area of interest can be considered a hotspot when it comes to exposure and vulnerability to severe weather events and supported the author in the definition of event exceptionality. First, the event was studied in terms of SWI because the antecedent conditions underline how the wet ground together with the significant rainfall amounts were the main factors causing the large impact of the event over the territory. In particular, at the end of July 2021, SWI is indeed about 20% higher than the seasonal average calculated over 14 years of data; anomalous wet conditions occurred also in February and October 2021. However, they were not followed by heavy rainfall, and therefore no significant impact was observed on the ground in those cases.
The event analysis enables the strengths and weaknesses of different observational techniques to be highlighted. The observations provided by a dual-polarization weather radar, shows that the Como area was affected by a large-sized hail bearing storm between 14:00 and 14:40 UTC on 25 July 2021. The analysis of radar data and, especially, VIL allows the evolution of the main convective cell to be monitored with excellent spatial and temporal accuracy and represents the best observation, when it is available, to follow this type of event.
Lightning is well-correlated (correlation coefficient = 0.85) with VIL and tends to follow its trend temporally, due to the fact that cloud electrification processes take time to produce lightning from the genesis of convective processes.
GNSS observation also shows a good ability to track the event; however, as can be seen from
Figure 10, the peak recorded by the GNSS data does not coincide with the maximum provided by the lightning data. Throughout other studies [
16], a non-replicative behavior in the trend of GNSS data compared to lightning data was observed; this aspect can be traced back to the GNSS observation geometry, indeed GNSS data are inclusive of observations collected within a radius of view greater than the 10 km cut characterizing the other observations shown in
Figure 10. This topic will be explored more in depth in future studies. Satellite measurements are of considerable utility, as they support the description of the event and show the evolution of the convective cell in space and time. The proposed analysis also proves to be suitable for providing both a large-scale and a local-scale snapshot of intense events, as previously tested [
47,
74]. The agreement between all the products involved in this study is evident and encourages the joint use of different platforms, future multi-instrumental applications and potential use of some products (e.g., satellite-based) for the analysis of events of interest in areas not covered by operative tools.
5. Conclusions
The main aims of the study reported in this paper were to describe in the most complete and detailed way the intense meteorological event that occurred in the Lake Como surrounding areas in July 2021 and to show the agreement between the products involved in this study in order to evaluate the joint use of different platforms, future multi-instrumental applications and potential use of some products (e.g., satellite-based) for the analysis of events of interest in areas not covered by operative tools.
In particular, we started from a long-term and large-scale study concerning the climatology of the area, to a short-term and more local scale where we described the one of the most acute phases of the event, which occurred in the early afternoon of 25 July 2021 around Lake Como.
For the long-term analysis:
ERA5 model data were employed and highlighted the increase in time of the threshold exceedance number of total precipitation and total column water vapor parameters in the area north of Lake Como.
The analysis carried out on 14 years of ASCAT SWI product clearly indicates the exceptionality of the event by showing anomalous wet conditions at the end of July 2021.
As for the case study:
Moreover, the satellite-based Earth observation products are available even in areas covered by the sea, and the results are particularly fruitful in the case of events generated in areas far from the coast. For the short-term analysis of the event, data from different instruments were used, involving conventional and non-conventional techniques in order to conduct the study focusing on different phases and aspects. The data involved were from lightning network, radar and GNSS sensors:
Lightning and radar data provided an overview of the most intense phase of the event, and the comparison with satellite-based data, from both SEVIRI-MSG and GNSS, made it possible to understand the potential and the role of these instruments in the event analysis.
It is useful to point out how the GNSS technique, while not developed for meteorological purposes, makes an interesting contribution to the analysis. Moreover, it is characterized by a strong spread of sensors over the territory and, therefore, the availability of data that can provide continuous information over time and are spatially distributed. The tools used, previously described in detail, showed, in the frame of the event analyzed, mutual consistency in the results, giving an overview of the event occurred. However, each instrument has its peculiarity, which highlights different aspects of the event; this is important for model verification, data assimilation in NWP models and observational nowcasting.
Author Contributions
The authors confirm contribution to the paper as follows. Conceptualization: A.M., M.P., S.P., R.C.T., S.F. and S.D.; Methodology: A.M., S.F. and S.D.; Validation: A.M., E.R., A.G., R.B., A.A., R.C.T. and S.F.; Formal Analysis: A.M., M.P., E.R., A.G., R.B., A.A., L.B., G.V., R.C.T., S.F. and A.O.; Investigation: A.M., M.P., S.P., E.R., A.G., R.B., A.A., L.B., G.V., R.C.T., S.F., A.O. and S.D.; Data Curation: A.M., M.P., E.R., A.G., R.B., A.A., L.B., G.V., R.C.T., S.F., A.O.; Writing—Original Draft Preparation: A.M., M.P., S.P., E.R., A.G., R.B., A.A., L.B., G.V., R.C.T., S.F., A.O. and S.D.; Writing—Review & Editing: A.M., M.P., E.R., A.G., R.B., A.A., L.B., R.C.T., S.F., A.O. and S.D.; Supervision: A.M., S.F. and S.D.; All authors reviewed the results and approved the final version of the manuscript.
Funding
This research received no external funding.
Data Availability Statement
The soil moisture and precipitation satellite data that support the findings of this study are openly available by the H SAF project at
http://h-saf.eumetsat.int (accessed on 10 October 2022) website address. MSG channel data are freely available by EUMETSAT at
https://www.eumetsat.int/ (accessed on 10 October 2022) The lightning data LINET are not freely available due to commercial restrictions; ISAC-CNR holds the access and management of the Italian data. Raingauge and radar data are subject to third party restrictions; DPC holds the access and management of the Italian data. The GNSS data belong to the SPIN network (Piedmont and Lombardy regions). Two GNSS receivers (GRTR and SNP1) belong to Geomatics Research & Development s.r.l.
Acknowledgments
Part of this work took place in the frame of the ALARM project funded by the SESAR Joint Undertaking (JU) Program under grant agreement No. 891467. Part of this work belongs to the H SAF Project.
Conflicts of Interest
The authors have no conflicts of interest to declare.
References
- Masson-Delmotte, V.; Zhai, P.A.; Pirani, S.; Péan, C.; Berger, S.; Caud, N.; Chen, Y.; Goldfarb, L.; Gomis, M.; Huang, M.; et al. IPCC, 2021: Climate Change 2021: The Physical Science Basis. In Contribution of Working Group I to the Sixth Assessment Report of the Intergovernmental Panel on Climate Change; Cambridge University Press: Cambridge, UK, 2021. [Google Scholar]
- Prestileo, F.; Mascitelli, A.; Meli, G.; Petracca, M.; Giorgi, C.; Melfi, D.; Puca, S.; Dietrich, S. Safeguarding of the Villa Romana del Casale UNESCO site from severe weather events: The case study of Apollo medicane occurred in October 2021. In Proceedings of the 17th Plinius Conference on Mediterranean Risks, Roma, Italy, 18–21 October 2022. [Google Scholar]
- Rädler, A.T.; Groenemeijer, P.H.; Faust, E.; Sausen, R.; Púčik, T. Frequency of severe thunderstorms across Europe expected to increase in the 21st century due to rising instability. npj Clim. Atmos. Sci. 2019, 2, 30. [Google Scholar] [CrossRef]
- Hoeppe, P. Trends in weather related disasters—Consequences for insurers and society. Weather. Clim. Extrem. 2016, 11, 70–79. [Google Scholar] [CrossRef]
- Púčik, T.; Groenemeijer, P.; Rädler, A.T.; Tijssen, L.; Nikulin, G.; Prein, A.F.; van Meijgaard, E.; Fealy, R.; Jacob, D.; Teichmann, C. Future changes in European severe convection environments in a regional climate model ensemble. J. Clim. 2017, 30, 6771–6794. [Google Scholar] [CrossRef]
- van Delden, A. The synoptic setting of thunderstorms in western Europe. Atmos. Res. 2001, 56, 89–110. [Google Scholar] [CrossRef]
- Rädler, A.T.; Groenemeijer, P.; Faust, E.; Sausen, R. Detecting severe weather trends using an additive regressive convective hazard model (AR-CHaMo). J. Appl. Meteorol. Climatol. 2018, 57, 569–587. [Google Scholar] [CrossRef]
- Sander, J.; Eichner, J.; Faust, E.; Steuer, M. Rising variability in thunderstorm-related US losses as a reflection of changes in large-scale thunderstorm forcing. Weather. Clim. Soc. 2013, 5, 317–331. [Google Scholar] [CrossRef]
- Punge, H.J.; Kunz, M. Hail observations and hailstorm characteristics in Europe: A review. Atmos. Res. 2016, 176, 159–184. [Google Scholar] [CrossRef]
- Kunz, M.; Sander, J.; Kottmeier, C. Recent trends of thunderstorm and hailstorm frequency and their relation to atmospheric characteristics in southwest Germany. Int. J. Climatol. 2009, 29, 2283–2297. [Google Scholar] [CrossRef]
- Nisi, L.; Martius, O.; Hering, A.; Kunz, M.; Germann, U. Spatial and temporal distribution of hailstorms in the Alpine region: A long-term, high resolution, radar-based analysis: Spatial and Temporal Distribution of Hailstorms in the Alpine Region. Q. J. R. Meteorol. Soc. 2016, 142, 1590–1604. [Google Scholar] [CrossRef]
- Punge, H.; Bedka, K.; Kunz, M.; Werner, A. A new physically based stochastic event catalog for hail in Europe. Nat. Hazards 2014, 73, 1625–1645. [Google Scholar] [CrossRef]
- Merino, A.; Wu, X.; Gascón, E.; Berthet, C.; García-Ortega, E.; Dessens, J. Hailstorms in southwestern France: Incidence and atmospheric characterization. Atmos. Res. 2014, 140–141, 61–75. [Google Scholar] [CrossRef]
- Laviola, S.; Levizzani, V.; Ferraro, R.; Beauchamp, J. Hailstorm Detection by Satellite Microwave Radiometers. Remote Sens. 2020, 12, 621. [Google Scholar] [CrossRef]
- Marra, A.; Porcù, F.; Baldini, L.; Petracca, M.; Casella, D.; Dietrich, S.; Mugnai, A.; Sanò, P.; Vulpiani, G.; Panegrossi, G. Observational analysis of an exceptionally intense hailstorm over the Mediterranean area: Role of the GPM Core Observatory. Atmos. Res. 2017, 192, 72–90. [Google Scholar] [CrossRef]
- D’Adderio, L.; Pazienza, L.; Mascitelli, A.; Tiberia, A.; Dietrich, S. A Combined IR-GPS satellite analysis for potential applications in detecting and predicting lightning activity. Remote Sens. 2020, 12, 1031. [Google Scholar] [CrossRef]
- Merino, A.; López, L.; Sánchez, J.L.; García-Ortega, E.; Cattani, E.; Levizzani, V. Daytime identification of summer hailstorm cells from MSG data. Nat. Hazards Earth Syst. Sci. 2014, 14, 1017–1033. [Google Scholar] [CrossRef]
- Romero, R.; Emanuel, K. Climate Change and Hurricane-Like Extratropical Cyclones: Projections for North Atlantic Polar Lows and Medicanes Based on CMIP5 Models. J. Clim. 2017, 30, 279–299. [Google Scholar] [CrossRef]
- Romera, R.; Gaertner, M.Á.; Sánchez, E.; Domínguez, M.; González-Alemán, J.J.; Miglietta, M.M. Climate change projections of medicanes with a large multi-model ensemble of regional climate models. Glob. Planet. Chang. 2017, 151, 134–143. [Google Scholar] [CrossRef]
- Walsh, K.; Giorgi, F.; Coppola, E. Mediterranean warm-core cyclones in a warmer world. Clim. Dyn. 2014, 42, 1053–1066. [Google Scholar] [CrossRef]
- Cavicchia, L. Mediterranean Tropical-Like Cyclones in Present and Future Climate. J. Clim. 2014, 27, 9. [Google Scholar] [CrossRef]
- Romero, R.; Emanuel, K. Medicane risk in a changing climate. J. Geophys. Res. Atmos. 2013, 118, 5992–6001. [Google Scholar] [CrossRef]
- Scoccimarro, E.; Villarini, G.; Vichi, M.; Zampieri, M.; Fogli, P.G.; Bellucci, A.; Gualdi, S. Projected Changes in Intense Precipitation over Europe at the Daily and Subdaily Time Scales. J. Clim. 2015, 28, 6193–6203. [Google Scholar] [CrossRef]
- Ban, N.; Schmidli, J.; Schär, C. Heavy precipitation in a changing climate: Does short-term summer precipitation increase faster? Geophys. Res. Lett. 2015, 42, 1165–1172. [Google Scholar] [CrossRef]
- Rajczak, J.; Pall, P.; Schär, C. Projections of extreme precipitation events in regional climate simulations for Europe and the Alpine Region: Projections of Extreme Precipitation. J. Geophys. Res. Atmos. 2013, 118, 3610–3626. [Google Scholar] [CrossRef]
- Stott, P. How climate change affects extreme weather events. Science 2016, 352, 1517–1518. [Google Scholar] [CrossRef]
- O’Gorman, P.A. Precipitation Extremes Under Climate Change. Curr. Clim. Chang. Rep. 2015, 1, 49–59. [Google Scholar] [CrossRef]
- Van den Besselaar, E.J.M.; Klein Tank, A.M.G.; Buishand, T.A. Trends in European precipitation extremes over 1951–2010: Trends in European Precipitation Extremes. Int. J. Climatol. 2012, 33, 2682–2689. [Google Scholar] [CrossRef]
- Maraun, D. When will trends in European mean and heavy daily precipitation emerge? Environ. Res. Lett. 2013, 8, 014004. [Google Scholar] [CrossRef]
- Olaiya, F.; Adeyemo, A.B. Application of data mining techniques in weather prediction and climate change studies. Int. J. Inf. Eng. Electron. Bus. 2012, 4, 51. [Google Scholar] [CrossRef]
- Li, H.; Wang, X.; Wu, S.; Zhang, K.; Chen, X.; Qiu, C.; Zhang, S.; Zhang, J.; Xie, M.; Li, L. Development of an Improved Model for Prediction of Short-Term Heavy Precipitation Based on GNSS-Derived PWV. Remote Sens. 2020, 12, 4101. [Google Scholar] [CrossRef]
- Bonafoni, S.; Biondi, R.; Brenot, H.; Anthes, R. Radio occultation and ground-based GNSS products for observing, understanding and predicting extreme events: A review. Atmos. Res. 2019, 230, 104624. [Google Scholar] [CrossRef]
- Avolio, E.; Federico, S. WRF simulations for a heavy rainfall event in southern Italy: Verification and sensitivity tests. Atmos. Res. 2018, 209, 14–35. [Google Scholar] [CrossRef]
- Cassola, F.; Burlando, M. Wind speed and wind energy forecast through Kalman filtering of Numerical Weather Prediction model output. Appl. Energy 2012, 99, 154–166. [Google Scholar] [CrossRef]
- Biondi, R.; Randel, W.; Ho, S.P.; Neubert, T.; Syndergaard, S. Thermal structure of intense convective clouds derived from GPS radio occultations. Atmos. Chem. Phys. 2012, 12, 5309–5318. [Google Scholar] [CrossRef]
- Mascitelli, A.; Federico, S.; Torcasio, R.; Dietrich, S. Assimilation of GPS Zenith Total Delay estimates in RAMS NWP model: Impact studies over central Italy. Adv. Space Res. 2021, 68, 4783–4793. [Google Scholar] [CrossRef]
- Song, C.; Huang, B.; Ke, L.; Richards, K.S. Remote sensing of alpine lake water environment changes on the Tibetan Plateau and surroundings: A review. ISPRS J. Photogramm. Remote Sens. 2014, 92, 26–37. [Google Scholar] [CrossRef]
- Biondi, R.; Chkeir, S.; Anesiadou, A.; Mascitelli, A.; Realini, E.; Nisi, L.; Cimarelli, C. Multivariate Multi-Step Convection Nowcasting with Deep Neural Networks: The Novara Case Study. In Proceedings of the IGARSS 2022—2022 IEEE International Geoscience and Remote Sensing Symposium, Kuala Lumpur, Malaysia, 17–22 July 2022; pp. 6598–6601. [Google Scholar] [CrossRef]
- MeteoReporter24. Available online: https://www.youtube.com/watch?v=uj5Xp5nBz4c (accessed on 17 July 2022).
- Roberto, N.; Adirosi, E.; Baldini, L.; Casella, D.; Dietrich, S.; Gatlin, P.; Panegrossi, G.; Petracca, M.; Sanò, P.; Tokay, A. Multi-sensor analysis of convective activity in central Italy during the HyMeX SOP 1.1. Atmos. Meas. Tech. 2016, 9, 535–552. [Google Scholar] [CrossRef]
- Petracca, M.; D’Adderio, L.; Porcù, F.; Vulpiani, G.; Sebastianelli, S.; Puca, S. Validation of GPM dual-frequency precipitation radar (DPR) rainfall products over Italy. J. Hydrometeorol. 2018, 19, 907–925. [Google Scholar] [CrossRef]
- Mascitelli, A.; Barindelli, S.; Realini, E.; Luini, L.; Venuti, G. Precipitable Water Vapor Content from GNSS/GPS: Validation Against Radiometric Retrievals, Atmospheric Sounding and ECMWF Model Outputs over a Test Area in Milan. In Proceedings of the First International Workshop in memory of Prof. Raffaele Santamaria on R3 in Geomatics: Research, Results and Review, R3GEO 2019, Naples, Italy, 10–11 October 2019; pp. 27–34. [Google Scholar]
- Vulpiani, G.; Montopoli, M.; Passeri, L.; Gioia, A.; Giordano, P.; Marzano, F. On the use of dual-polarized C-band radar for operational rainfall retrieval in mountainous areas. J. Appl. Meteorol. Climatol. 2012, 51, 405–425. [Google Scholar] [CrossRef]
- Federico, S.; Torcasio, R.C.; Avolio, E.; Caumont, O.; Montopoli, M.; Baldini, L.; Vulpiani, G.; Dietrich, S. The impact of lightning and radar reflectivity factor data assimilation on the very short-term rainfall forecasts of RAMS@ ISAC: Application to two case studies in Italy. Nat. Hazards Earth Syst. Sci. 2019, 19, 1839–1864. [Google Scholar] [CrossRef]
- Brocca, L.; Ciabatta, L.; Massari, C.; Moramarco, T.; Hahn, S.; Hasenauer, S.; Kidd, R.; Dorigo, W.; Wagner, W.; Levizzani, V. Soil as a natural rain gauge: Estimating global rainfall from satellite soil moisture data. J. Geophys. Res. Atmos. 2014, 119, 5128–5141. [Google Scholar] [CrossRef]
- Mascitelli, A. New Applications and Opportunities of GNSS Meteorology; Sapienza Università di Roma: Rome, Italy, 2020. [Google Scholar]
- Tiberia, A.; Mascitelli, A.; D’Adderio, L.; Federico, S.; Marisaldi, M.; Porcù, F.; Realini, E.; Gatti, A.; Ursi, A.; Fuschino, F.; et al. Time Evolution of Storms Producing Terrestrial Gamma-Ray Flashes Using ERA5 Reanalysis Data, GPS, Lightning and Geostationary Satellite Observations. Remote Sens. 2021, 13, 784. [Google Scholar] [CrossRef]
- Schmetz, J.; Pili, P.; Tjemkes, S.; Just, D.; Kerkmann, J.; Rota, S.; Ratier, A. An introduction to Meteosat second generation (MSG). Bull. Am. Meteorol. Soc. 2002, 83, 977–992. [Google Scholar] [CrossRef]
- Mecikalski, J.; MacKenzie Jr, W.; Koenig, M.; Muller, S. Cloud-top properties of growing cumulus prior to convective initiation as measured by Meteosat Second Generation. Part I: Infrared fields. J. Appl. Meteorol. Climatol. 2010, 49, 521–534. [Google Scholar] [CrossRef]
- Hersbach, H.; Bell, B.; Berrisford, P.; Biavati, G.; Horányi, A.; Muñoz Sabater, J.; Nicolas, J.; Peubey, C.; Radu, R.; Rozum, I.; et al. ERA5 Hourly Data on Single Levels from 1979 to Present. In Copernicus Climate Change Service (C3S) Climate Data Store (CDS, 2021-03-30); 2021; Available online: https://cds.climate.copernicus.eu/cdsapp#!/dataset/reanalysis-era5-single-levels?tab=overview (accessed on 10 October 2022).
- Saastamoinen, J. Atmospheric correction for the troposphere and stratosphere in radio ranging satellites. Use Artif. Satell. Geod. 1972, 15, 247–251. [Google Scholar]
- Bevis, M.; Businger, S.; Herring, T.; Rocken, C.; Anthes, R.; Ware, R. GPS meteorology: Remote sensing of atmospheric water vapor using the Global Positioning System. J. Geophys. Res. Atmos. 1992, 97, 15787–15801. [Google Scholar] [CrossRef]
- Mahfouf, J.; Ahmed, F.; Moll, P.; Teferle, F. Assimilation of zenith total delays in the AROME France convective scale model: A recent assessment. Tellus A Dyn. Meteorol. Oceanogr. 2015, 67, 26106. [Google Scholar] [CrossRef]
- Guerova, G.; Jones, J.; Douša, J.; Dick, G.; Haan, S.; Pottiaux, E.; Bock, O.; Pacione, R.; Elgered, G.; Vedel, H.; et al. Review of the state of the art and future prospects of the ground-based GNSS meteorology in Europe. Atmos. Meas. Tech. 2016, 9, 5385–5406. [Google Scholar] [CrossRef]
- Yang, S.; Huang, Z.; Huang, C.; Tsai, C.; Yeh, T. A case study on the impact of ensemble data assimilation with GNSS-Zenith total delay and radar data on heavy rainfall prediction. Mon. Weather Rev. 2020, 148, 1075–1098. [Google Scholar] [CrossRef]
- Bonafoni, S.; Biondi, R. The usefulness of the Global Navigation Satellite Systems (GNSS) in the analysis of precipitation events. Atmos. Res. 2016, 167, 15–23. [Google Scholar] [CrossRef]
- Meroni, A.; Montrasio, M.; Venuti, G.; Barindelli, S.; Mascitelli, A.; Manzoni, M.; Monti-Guarnieri, A.; Gatti, A.; Lagasio, M.; Parodi, A.; et al. On the definition of the strategy to obtain absolute InSAR Zenith Total Delay maps for meteorological applications. Front. Earth Sci. 2020, 8, 359. [Google Scholar] [CrossRef]
- Bennitt, G.; Jupp, A. Operational assimilation of GPS zenith total delay observations into the Met Office numerical weather prediction models. Mon. Weather Rev. 2012, 140, 2706–2719. [Google Scholar] [CrossRef]
- Norazmi, M.; Opaluwa, Y.; Musa, T.; Othman, R. The concept of operational near real-time GNSS meteorology system for atmospheric water vapour monitoring over Peninsular Malaysia. Arab. J. Sci. Eng. 2015, 40, 235–244. [Google Scholar] [CrossRef]
- Müller, M.; Homleid, M.; Ivarsson, K.; Køltzow, M.; Lindskog, M.; Midtbø, K.; Andrae, U.; Aspelien, T.; Berggren, L.; Bjørge, D.; et al. AROME-MetCoOp: A Nordic convective-scale operational weather prediction model. Weather Forecast. 2017, 32, 609–627. [Google Scholar] [CrossRef]
- Herrera, A.M.; Suhandri, H.F.; Realini, E.; Reguzzoni, M.; Lacy, M. goGPS: Open-source MATLAB software. GPS Solut. 2016, 20, 595–603. [Google Scholar] [CrossRef]
- Kouba, J. Testing of global pressure/temperature (GPT) model and global mapping function (GMF) in GPS analyses. J. Geod. 2009, 83, 199–208. [Google Scholar] [CrossRef]
- Betz, H.; Schmidt, K.; Oettinger, P.; Wirz, M. Lightning detection with 3-D discrimination of intracloud and cloud-to-ground discharges. Geophys. Res. Lett. 2004, 31. [Google Scholar] [CrossRef]
- Betz, H.; Schmidt, K.; Laroche, P.; Blanchet, P.; Oettinger, W.; Defer, E.; Dziewit, Z.; Konarski, J. LINET—An international lightning detection network in Europe. Atmos. Res. 2009, 91, 564–573. [Google Scholar] [CrossRef]
- Federico, S.; Avolio, E.; Petracca, M.; Panegrossi, G.; Sanò, P.; Casella, D.; Dietrich, S. Simulating lightning into the RAMS model: Implementation and preliminary results. Nat. Hazards Earth Syst. Sci. 2014, 14, 2933–2950. [Google Scholar] [CrossRef][Green Version]
- Italian Civil Protection Department; CIMA Research Foundation. The Dewetra platform: A multi-perspective architecture for risk management during emergencies. In Proceedings of the Information Systems For Crisis Response and Management in Mediterranean Countries: First International Conference, ISCRAM-med 2014, Toulouse, France, 15–17 October 2014; pp. 165–177. [Google Scholar]
- Pignone, F.; Rebora, N.; Silvestro, F.; Castelli, F. GRISO (Generatore Random di Interpolazioni Spaziali da Osservazioni incerte)-Piogge. Report 2010, 272, 353. [Google Scholar]
- Feidas, H.; Porcu, F.; Puca, S.; Rinollo, A.; Lagouvardos, C.; Kotroni, V. Validation of the H-SAF precipitation product H03 over Greece using rain gauge data. Theor. Appl. Climatol. 2018, 131, 377–398. [Google Scholar] [CrossRef]
- Biran, A.; Breiner, M. MATLAB 6 for Engineers; Pearson Education: London, UK, 2002. [Google Scholar]
- Edwards, R.; Thompson, R. Nationwide comparisons of hail size with wsr-88d vertically integrated liquid water and derived thermodynamic sounding data. Weather Forecast. 1998, 13, 277–285. [Google Scholar] [CrossRef]
- Montopoli, M.; Picciotti, E.; Baldini, L.; Fabio, S.; Marzano, F.; Vulpiani, G. Gazing inside a giant-hail-bearing Mediterranean supercell by dual-polarization Doppler weather radar. Atmos. Res. 2021, 264, 105852. [Google Scholar] [CrossRef]
- Leonforte, G.; Cheloni, A. WEPES (Weather Environment Prediction Editing System). Available online: https://www.aeronautica.difesa.it/comunicazione/editoria/rivmeteorologia/orainedicola/Documents/02_2018/6_WEPES%20FINALE_N.pdf (accessed on 14 July 2022).
- Prometeo2 Aeronautica Militare. Available online: http://prometeo2.meteoam.it (accessed on 14 July 2022).
- Coletta, V.; Mascitelli, A.; Bonazza, A.; Ciarravano, A.; Federico, S.; Prestileo, F.; Torcasio, R.C.; Dietrich, S. Multi-instrumental Analysis of the Extreme Meteorological Event Occurred in Matera (Italy) on November 2019. In Proceedings of the International Conference on Computational Science and Its Applications, Cagliari, Italy, 13–16 September 2021; pp. 140–154. [Google Scholar]
| Publisher’s Note: MDPI stays neutral with regard to jurisdictional claims in published maps and institutional affiliations. |
© 2022 by the authors. Licensee MDPI, Basel, Switzerland. This article is an open access article distributed under the terms and conditions of the Creative Commons Attribution (CC BY) license (https://creativecommons.org/licenses/by/4.0/).


 ,
, 


