Article

Comparative Analysis on the DMA Partitioning Methods Whether Trunk Mains Participated

1
Huadong Engineering Corporation Limited, Hangzhou 311122, China
2
Shaoxing Water Industry Corporation Limited, Shaoxing 312099, China
3
Zhejiang Institute of Mechanical and Electrical Engineering Corporation Limited, Hangzhou 310051, China
4
College of Civil Engineering and Architecture, Zhejiang University, Hangzhou 310058, China
5
Key Laboratory of Drinking Water Safety and Distribution Technology of Zhejiang Province, Hangzhou 310058, China
*
Author to whom correspondence should be addressed.
Water 2022, 14(23), 3876; https://doi.org/10.3390/w14233876
Submission received: 23 October 2022 / Revised: 22 November 2022 / Accepted: 23 November 2022 / Published: 28 November 2022
(This article belongs to the Special Issue Drinking Water Distribution Systems: Hydraulics and Water Quality)

Abstract

:
In recent years, the District Metered Area (DMA) of water distribution networks (WDNs) has become a major development trend in the water leakage control area. It has significant value in the active leakage control and pressure management of WDNs. This study comments on two DMA partitioning methods (Scheme A and B, previously introduced in another paper) and compares three aspects of their respective performances to elucidate their respective strengths and weaknesses. Scheme A partitions all the network nodes, whereas Scheme B only partitions the remaining network nodes, except the trunk mains. Whether the trunk mains participated in the partitioning process is the key distinction between the two approaches. There is little relevant research that compares and analyzes the effects of the above two methods. This paper applies these two types of partitioning methods to a case network. The respective performances in three aspects, namely economy, water quality, and leakage control, were evaluated and compared. For economy, Scheme A is more economical than Scheme B, saving about 15.34%. For water quality, Scheme B is the best partitioning method because it reduces water age better than Scheme A does. For leakage control, Scheme B has a drop of 19.46%, which is better than Scheme A (a decline of 15.12%) in comparison to the initial leakage.

1. Introduction

In the early 1980s, the British Water Industry Association first introduced the District Metered Area (DMA) concept for a water distribution network at a joint conference. By carrying out the concept of “divide and conquer” to the WDN, the purpose of simplifying management and improving leakage control efficiency can be achieved. A DMA is an independent area in a WDN that is cut and separated by gate valves and flowmeters. By measuring and analyzing the amount of water entering and flowing out of an area, the leakage level of the area can be quantified, which helps leakage inspectors to prioritize areas with high leakage levels and achieve the purpose of active leakage control [1]. After years of development, DMAs have been widely used in pressure management, pipe burst monitoring, water pollution prevention, energy recovery, and other fields [2,3,4].
Generally, research on the reasonable partitioning of WDNs focuses on the following two phases [5,6,7]: (1) the clustering phase and (2) the dividing phase. In the clustering phase, one should figure out how to divide the WDN into a certain number of sub-areas of reasonable shapes and sizes and, at the same time, find out how to reduce the number of boundary pipes among these sub-areas as much as possible to control the construction investment effectively. The dividing phase follows the clustering phase. After node clustering, there are many boundary pipes between DMAs. Optimizing the positioning of the flowmeter and valves on the boundary pipes to realize the optimal isolation between DMAs is another crucial issue in the process of WDN partitioning. Over the past ten years, many researchers have introduced many algorithms to achieve the optimal WDN partitioning method. The spectral clustering algorithm [8], community detection algorithm [9,10], multi-agent algorithm [11], and graph theory algorithm [12] are applied to the clustering phase; meanwhile, the iterative method [13] and multi-objective genetic algorithm [14,15,16] are applied to the dividing phase. Compared with the traditional “trial and error method”, these algorithms have not only high computational efficiency but also high scientific rationality.
On the other hand, some scholars think that the trunk mains should be identified and extracted before the WDN partitioning. For example, Ferrari et al. [17] take a series of continuous pipes with diameters greater than or equal to 300–350 mm from the water source in the case network as the trunk mains. Ciaponi et al. [10] defined the trunk mains as consisting of a series of continuous pipes with diameter D D.T. (the preset diameter threshold of trunk mains) starting from the source node. The proportion of pipes should be controlled in the range of 5–10%. Campbell et al. [18] used the product value of the frequency and flow rate of the pipe on the shortest hydraulic path to reflect the difference in hydraulic importance of each pipe and used it as the basis for distinguishing the trunk mains from the WDN. This partitioning method makes each DMA form a relatively independent hydraulic state. The water in each DMA is supplied directly by the trunk mains, and there is almost no water flow exchange between adjacent DMAs, so it has some unique advantages. However, there is presently little relevant research that compares and analyzes the effects of the two types of partition methods (regardless of whether the trunk mains participated in the partitioning or not). It is a lack of insightful findings regarding the choice of partition methods in practical projects that prevents the final partition scheme from adequately meeting the local requirements.
This paper applies the two abovementioned partition methods to a case network and compares three aspects of their respective performances (namely, economy, water quality, and leakage control) to elucidate their respective strengths and weaknesses and provide some references for practical engineering. This paper integrates a larger number of methods than previous studies to achieve these purposes, including the automatic identification technology of trunk mains, the modified Fast-Newman algorithm, and the improved multi-objective genetic algorithm [5,19]; meanwhile, adequate measures are taken to ensure the objectivity of the comparison. This paper comprises three main parts: (1) a brief introduction to the two partitioning schemes; (2) a comparative analysis of three aspects of DMA performance; (3) and a summary of some general engineering construction opinions.

2. Brief Introduction to Two Partitioning Methods

The first method, marked as Scheme A, involves clustering all nodes using the modified Fast-Newman algorithm while considering elevation uniformity, water demand similarity, and the trunk mains’ participation in the partitioning process. The Fast-Newman algorithm can divide the systems into sub-systems with stronger internal than external connections [20]. The algorithm is based on the concept of “modularity”, which guides and determines the overall partitioning procedure. Usually, Q > 0.3 indicates a good division into communities. The adjacent DMAs are connected. As shown in Figure 1a, water in DMA2 may come from DMA1 and DMA3. The boundary pipes between the DMAs must be fitted with gate valves or flowmeters. Their main purpose is to ensure that the DMAs are not independent of each other.
In the second method, marked as Scheme B, trunk mains do not participate in the partitioning procedure. The optimal trunk mains will be selected first using three reference indicators, and then the remanding distribution network will be partitioned using a modified Fast-Newman algorithm. All of the DMAs are independent of each other because they are supplied directly by the trunk mains, and there is no water exchanged between them. Gate valves must isolate the connections between the DMAs. As shown in Figure 1b, the pipes [6,7,9,10] must be closed to ensure that only DMA2 is connected to the trunk mains.
For more details about the modified Fast-Newman algorithm and the optimal selection method of trunk mains adopted in this paper, please refer to Zhang et al. [19].

3. Introduction to Case Network

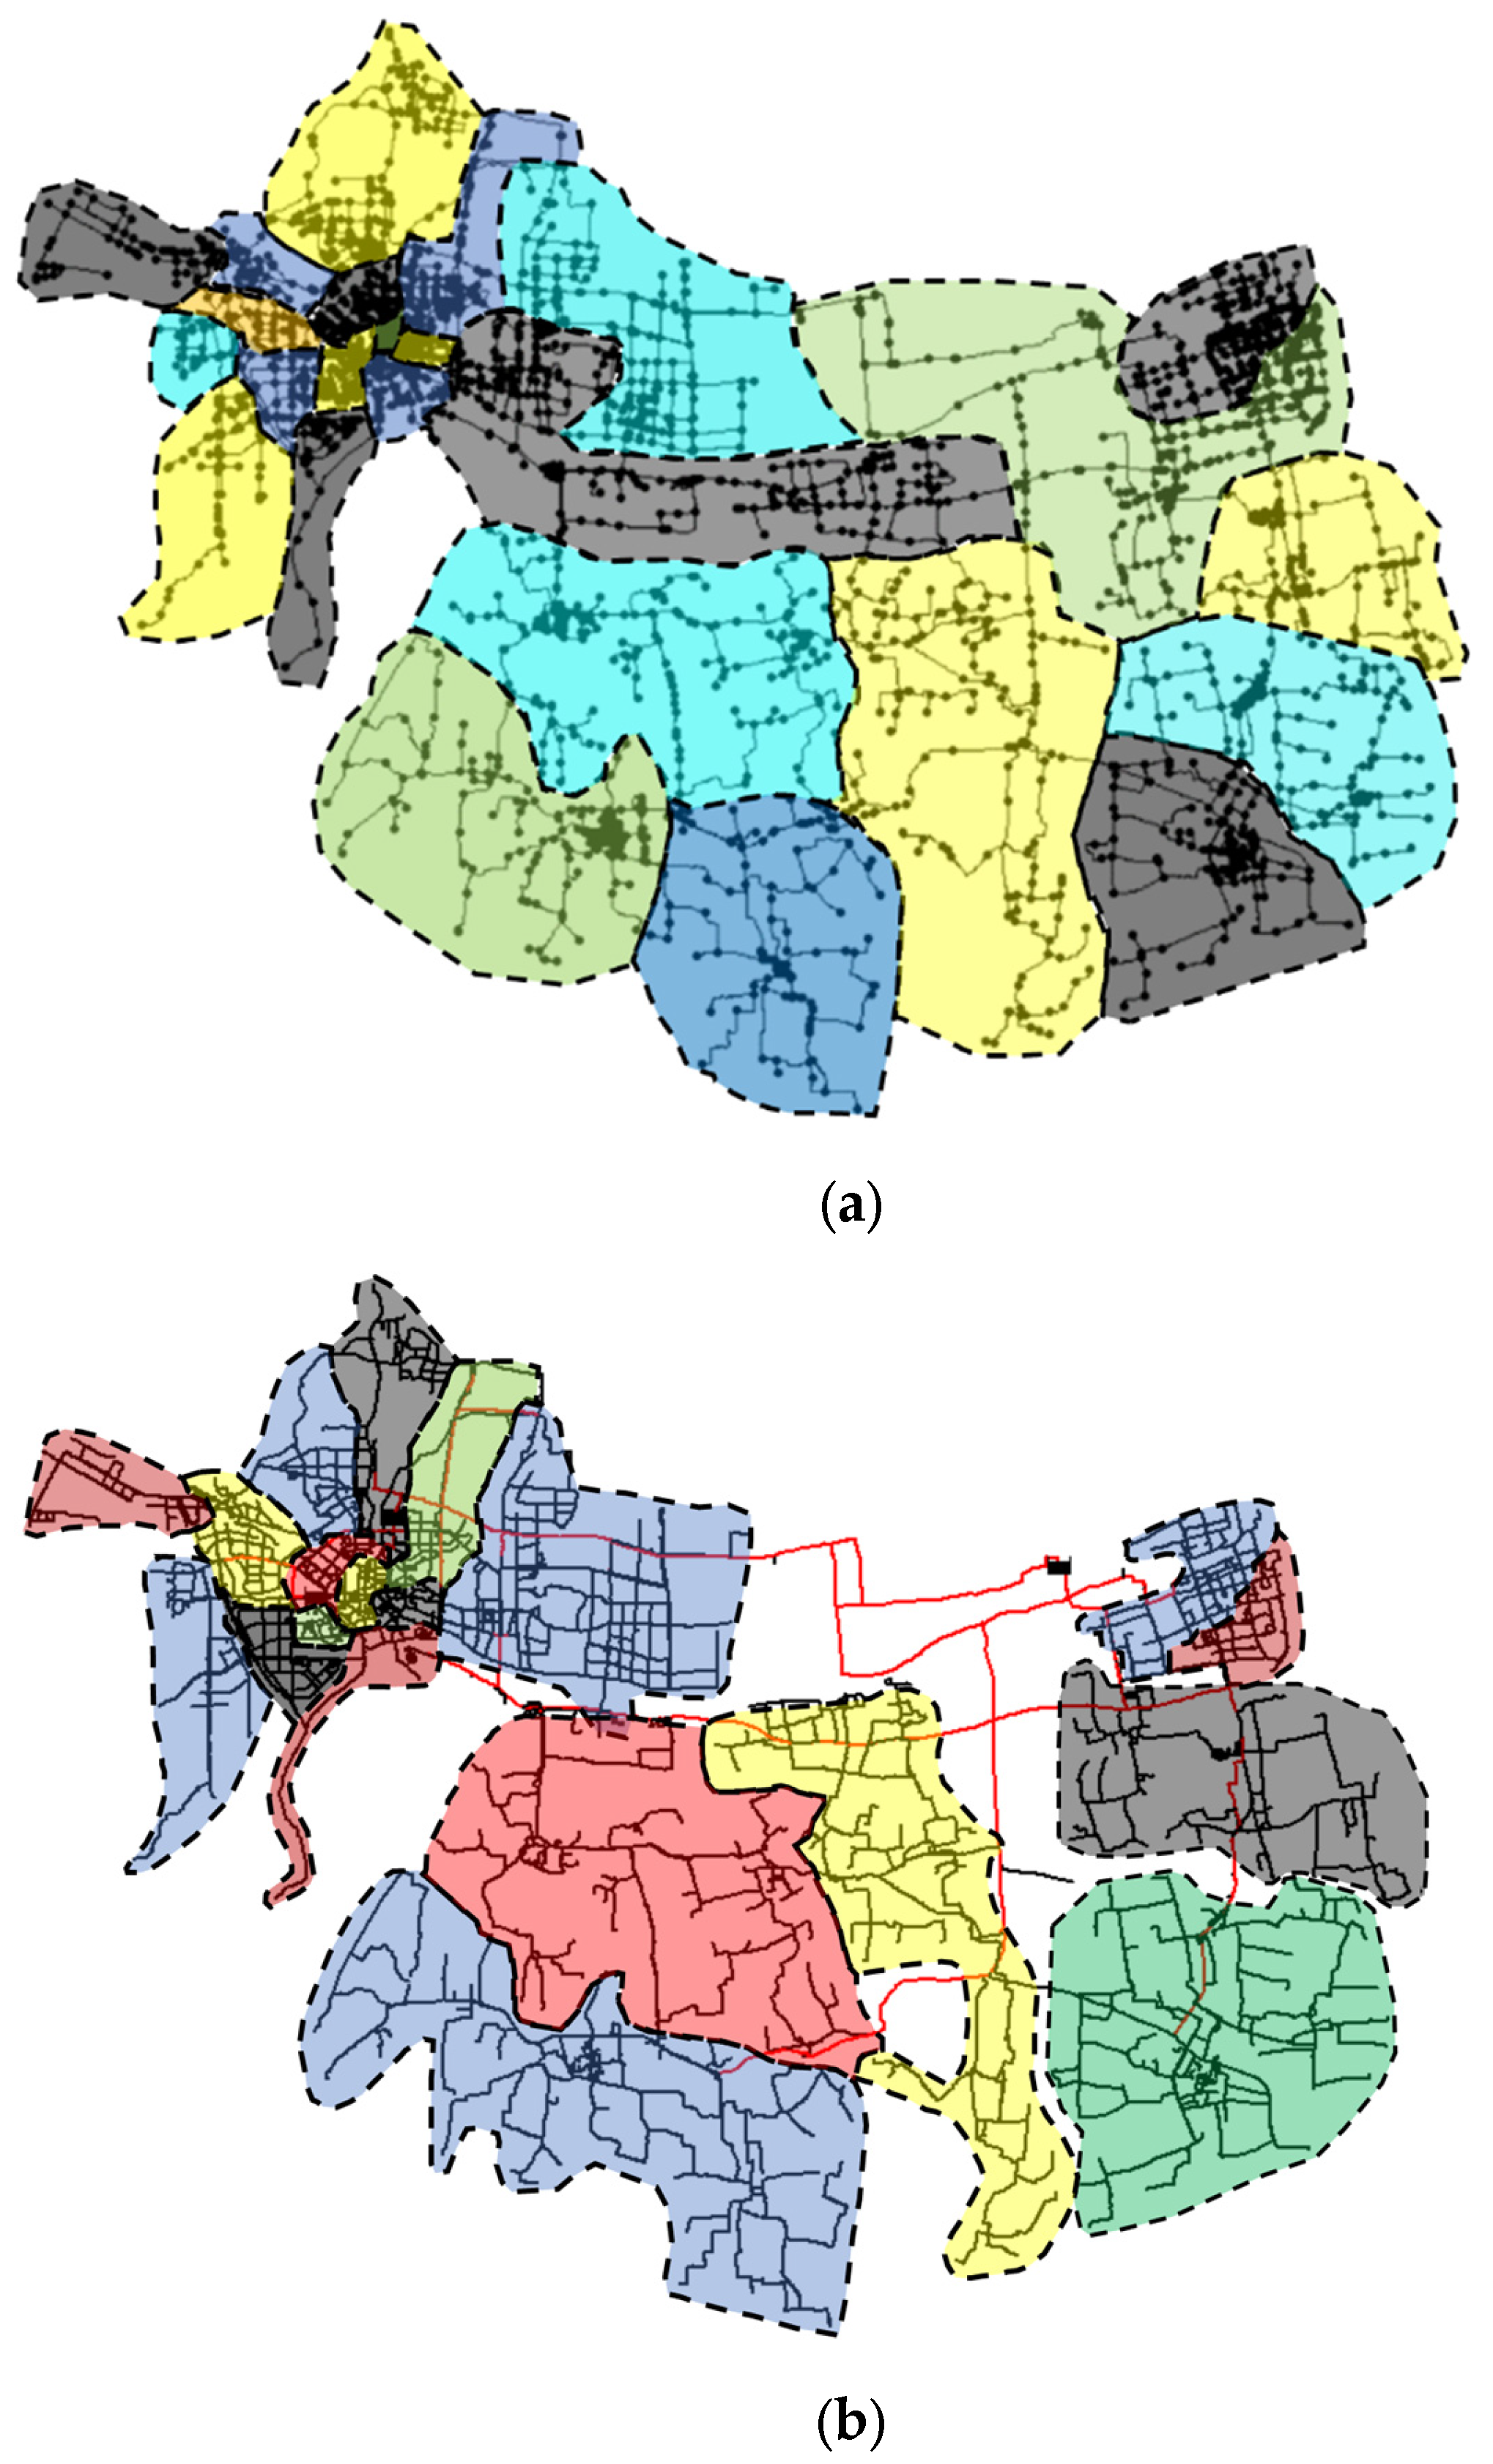
This paper uses the H-Town network as a case network, as shown in Figure 2. The WDN consists of 4245 nodes and 4841 pipes and has three gravity water sources. The average total water demand is 2882.49 L/s, and the water demand per unit user is fixed at 0.036 L/s/user.
Figure 2a shows the partitioning results of the H-Town network using the method that the trunk mains participate in the partitioning process, which includes 28 DMAs and 100 boundary pipes. Figure 2b shows the partitioning results using the method wherein the trunk mains do not participate in the partitioning process, including 20 DMAs and 160 boundary pipes. It should be stressed that the two schemes are the most economical in their respective methods. That is to say, the 500–5000 connections in each DMA exceed the number of DMAs, but a comparison between the two mehod can illustrate their relative performance.
After the node clustering, the paper uses a multi-objective genetic algorithm to isolate the DMAs in these two partition schemes (that is, to optimize the positioning of the flowmeter and valve in the boundary pipes). The following two objective functions were adopted [19]:
f 1 = min C o s t = i N f k i + i N v b j
f 2 = min C V P = m = 1 M 1 N m 1 j = 1 N m P m , j P m ¯ P m ¯
where Cost is the total cost of scheme implementation, Nf is the number of flowmeters in the scheme, Nv is the number of gate valves in the scheme, ki is the cost of the i-th flowmeter, and bi is the cost of the i-th gate valve. Table 1 shows the purchase costs of flowmeters and gate valves with different pipe diameters. CVP is the cumulative pressure variation coefficient of the DMAs, that is to say, the sum of the pressure variation coefficients of the nodes of all the DMAs in the WDN; M is the number of DMAs; Nm is the number of nodes contained in the m-th DMA; P m , j is the pressure of the i-th node of the m-th DMA; P m ¯ is the average pressure of the m-th DMA.
After the dividing phase in Scheme A, a total of 35 boundary pipes need to be equipped with flowmeters, and the remaining 65 boundary pipes need to be equipped with gate valves and closed. In Scheme B, it is necessary to install flowmeters in 33 boundary pipes and install gate valves in 127 boundary pipes and close them at the same time.

4. Performance Comparison

In this section, based on the above two different partition schemes, we compare and evaluate these two partition methods’ economy, water quality, and leakage control.

4.1. Economy

After the regions are partitioned, flowmeters or boundary valves must be installed in each boundary pipe section to achieve “physical isolation” between the DMAs. The implementation cost mainly comes from the purchase of these hydraulic devices. Generally speaking, the higher the number of boundary pipes between DMAs, the higher the implementation cost of the WDN partition will be. At the same time, under the premise that the number of boundary pipes is certain, the distribution of the number of flowmeters and boundary valves and the pipe diameter value of the corresponding boundary pipes have become the main factors affecting the implementation cost of WDN partitions [21,22].
Table 2 shows the comparison of the cost of the two partitioning schemes. It can be seen that even though the number of DMAs in Scheme B is less than that of Scheme A, the total project cost is 15.34% higher because the separation of the trunk mains and the water distribution system in Scheme B produces many boundary pipes. In addition, it can be seen from the table that the acquisition cost of the flow meter in the two schemes is not considerably different. However, the purchase cost of the gate valves in Scheme B is twice that of Scheme A, so it can be seen that the cost increase in Scheme B is mainly due to an increase in the number of gate valves.
In terms of the economy of WDN partitioning, the method wherein the trunk mains participate in the partitioning process is better than the method wherein the trunk mains do not.

4.2. Water Age

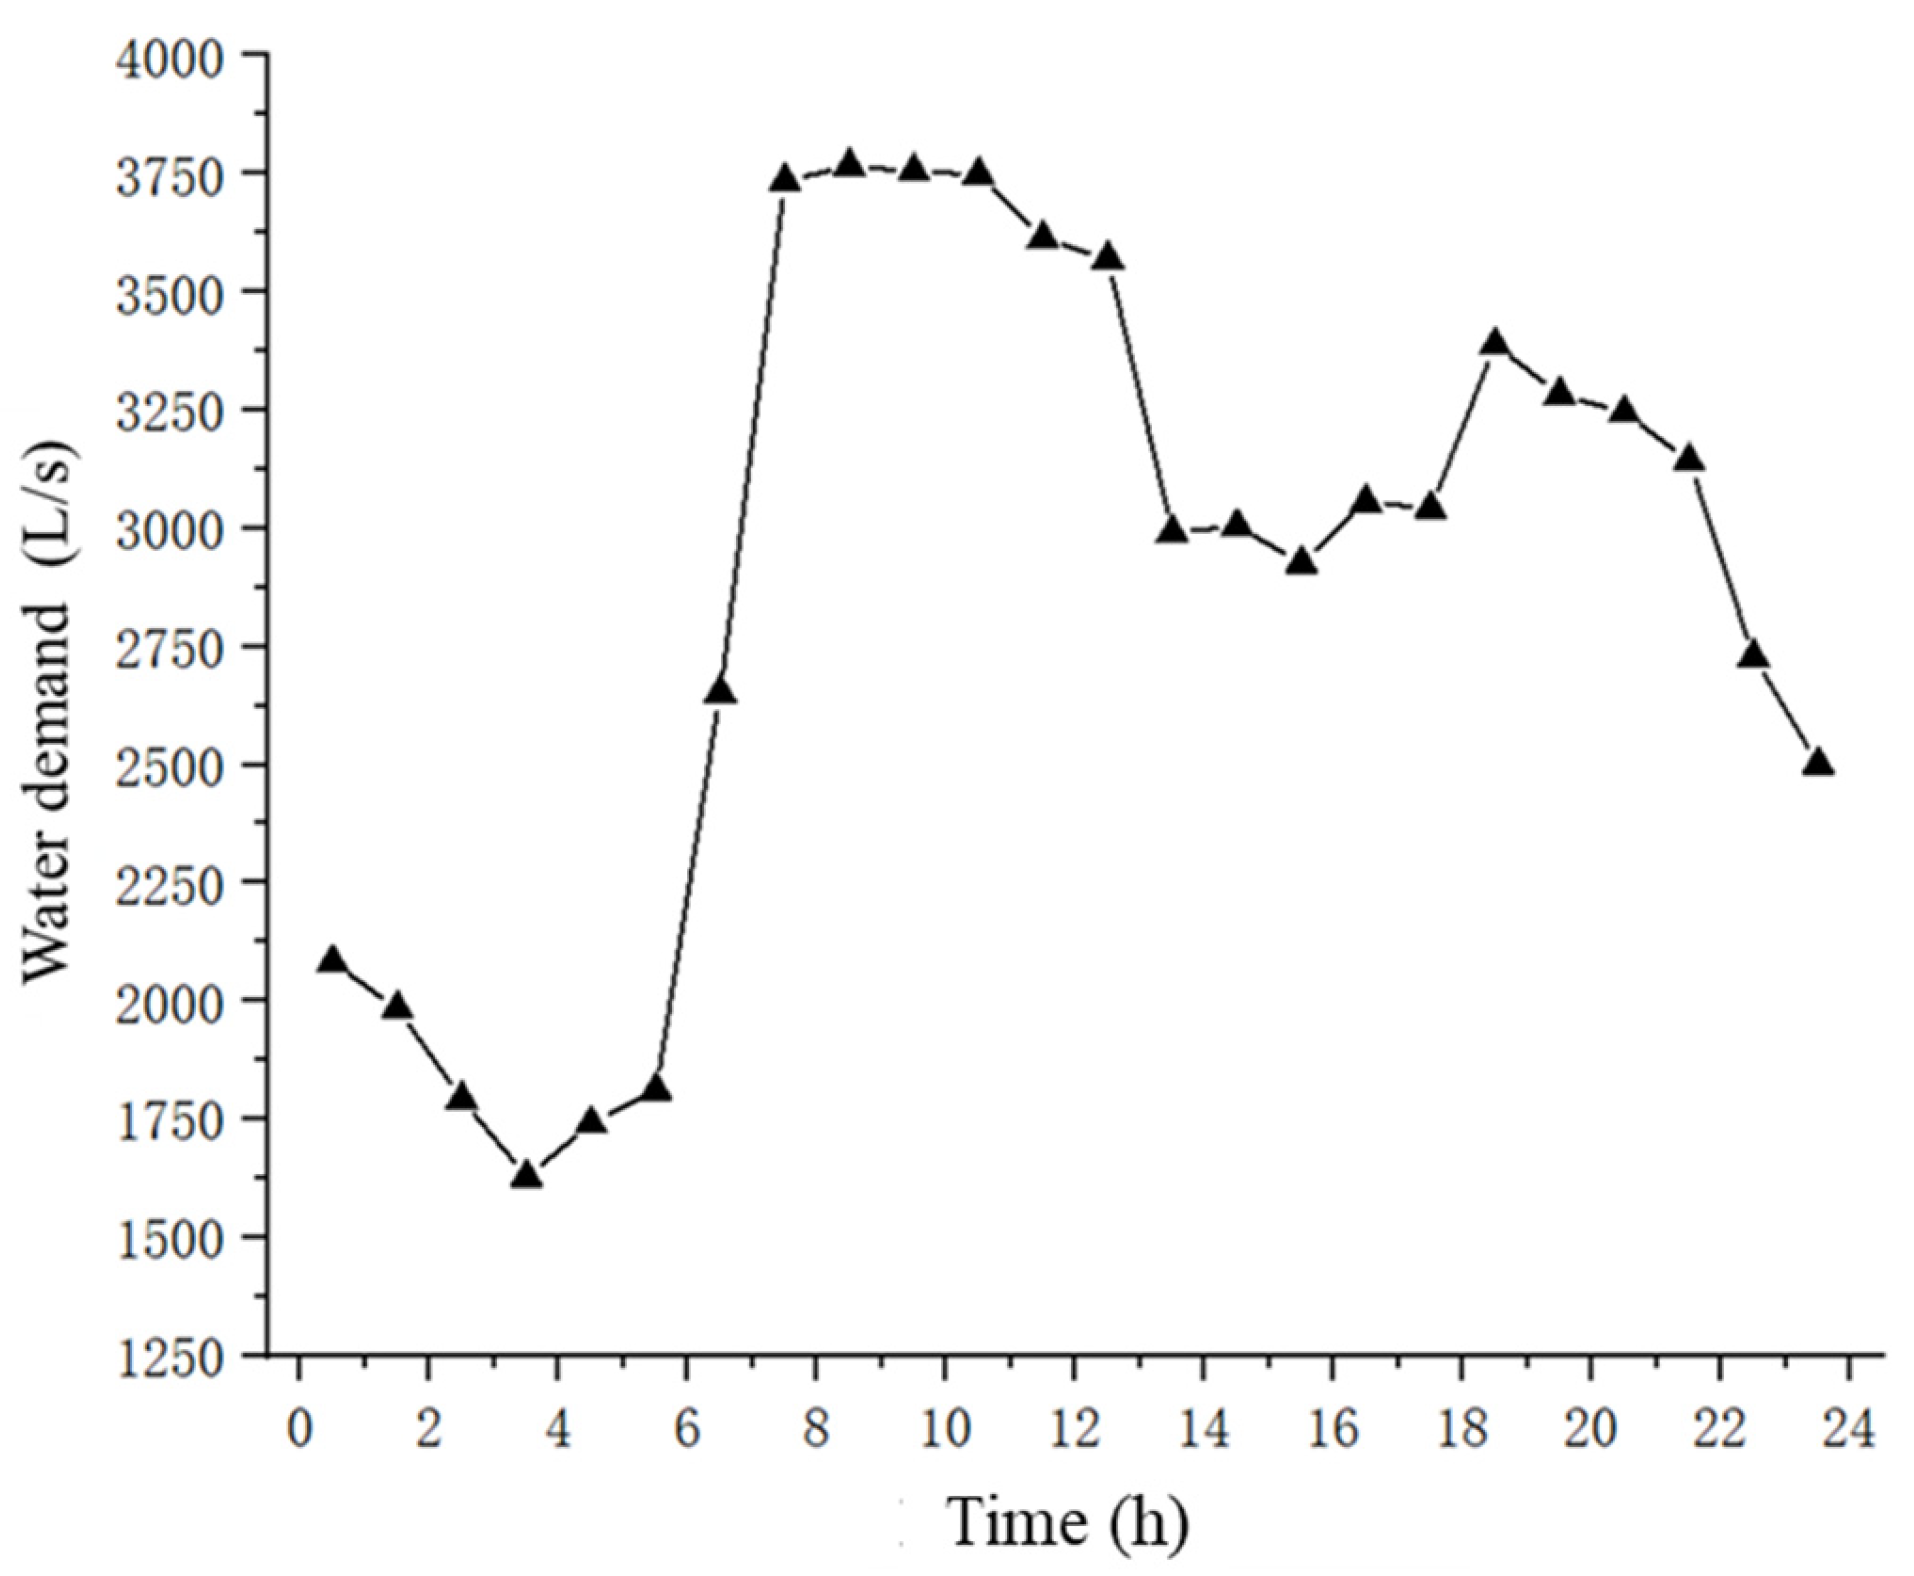
After the regions are partitioned, the closure of some boundary pipes will cause changes in the hydraulic path, causing changes in the water age of the WDN as a whole. In addition, WDN partitioning may generate a large amount of stagnant terminal water, resulting in poor water quality and microbial growth. In this section, we compare and analyze the water age status of the original pipe network and two DMA partitioning schemes using the water age data from the eighth day of the operation in the EPA software as a sample. Figure 3 shows the water use pattern diagram of the case network for 24 h. The peak water consumption is 8–9 a.m., and the water demand is 3766.07 L/s. The valley's peak water consumption is 3–4 a.m., and the water demand is 1627.19 L/s.
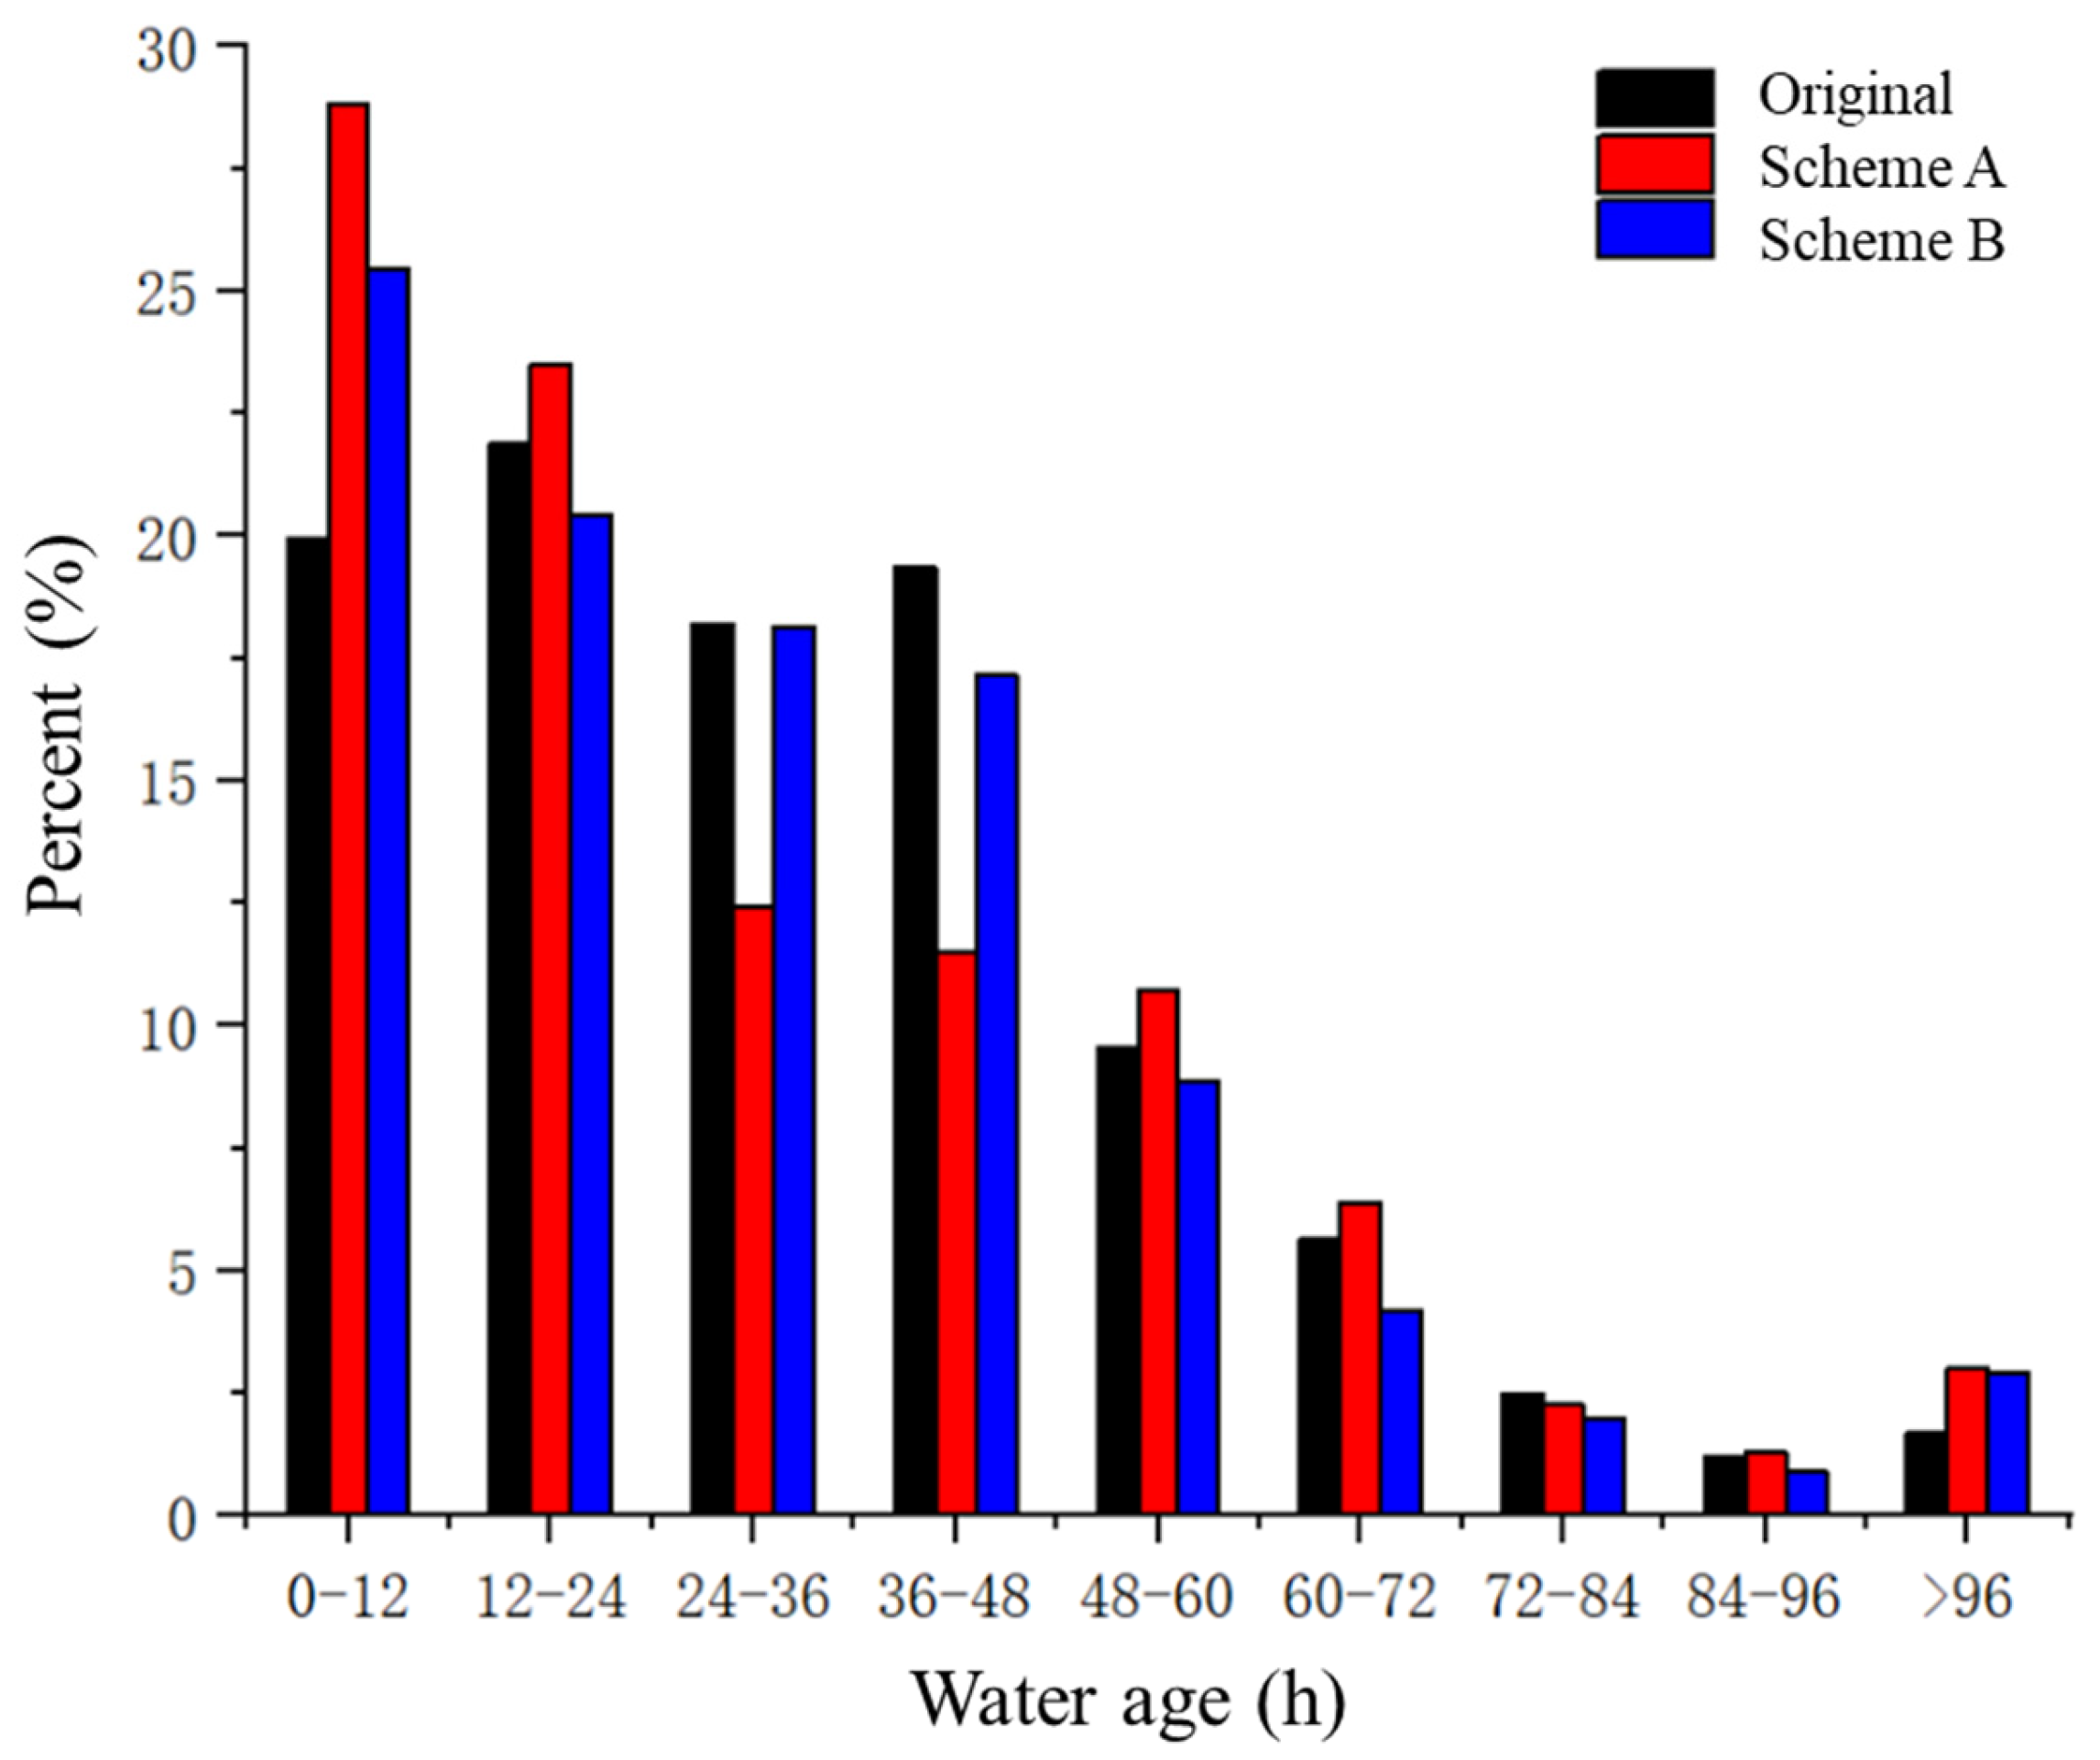
Figure 4 and Table 3 give the distribution of the water age. It can be seen that the percentage of water in age 0–24 h after partitioning (especially Scheme A) is significantly higher than the original WDN, which is also the main reason why the average water age of nodes in the WDN after the partitioning is lower than the original WDN. The percentage of water in age 24–48 h of Scheme A decreases sharply (only two-thirds of the original WDN and Scheme B). The percentage of water in age 2–4 days (i.e., 48 h–96 h) of Scheme A is significantly higher than that of the original WDN and Scheme B. However, the percentage of water in age 12–96 h of Scheme B is slightly lower than the original WDN. For the water with a water age of more than four days, the proportion in schemes A and B are almost twice as large as the original WDN, which confirms that the WDN will produce a large amount of stagnant terminal water after the partitioning process, thus causing water quality to deteriorate. In general, the water age of Scheme B is closer to the original WDN and better than Scheme A.
To sum up, in both scheme A and scheme B, the amount of water with an age of less than 24 h and more than 96 h is much more than in the original scheme. However, in general, the distribution of water age in scheme B is better than that in scheme A (due to none of the trunk mains being closed in scheme B).

4.3. Leakage Control

Nowadays, pressure management based on DMAs has become an indispensable way to achieve low-consumption operations of WDNs because of its efficiency and convenience compared with traditional methods. In this section, we implement pressure management for the two partitioning schemes and compare the advantages and disadvantages of the two schemes by analyzing the leakage amount and pressure distribution of the WDN.
The overall pressure of the WDN is regulated by the method of joint scheduling of pumps and valves. To facilitate the calculation, we simulate the adjustment of the pump and pressure-reducing valves [23] by adjusting the pipe diameter value of the outlet pipes of the water sources and the inlet pipes of each DMA. The minimum service water pressure of 18 m was guaranteed at each demand node.
The following is the formula for calculating the average daily leakage of the WDN:
l k = t = 1 T i = 1 N C L L i p i γ T
where CL is the leakage constant of the unit pipe length, the unit is m0.18 s2.36 kg−0.18, and it is used as 10−5 in this study [23]; Li is the subsidiary pipe length of node i, which is equal to half the sum of the lengths of all pipes connected to node i; pi is the water pressure at node i; γ is the leakage index, used as 1.18 in this study; T is the number of hydraulic simulation periods.
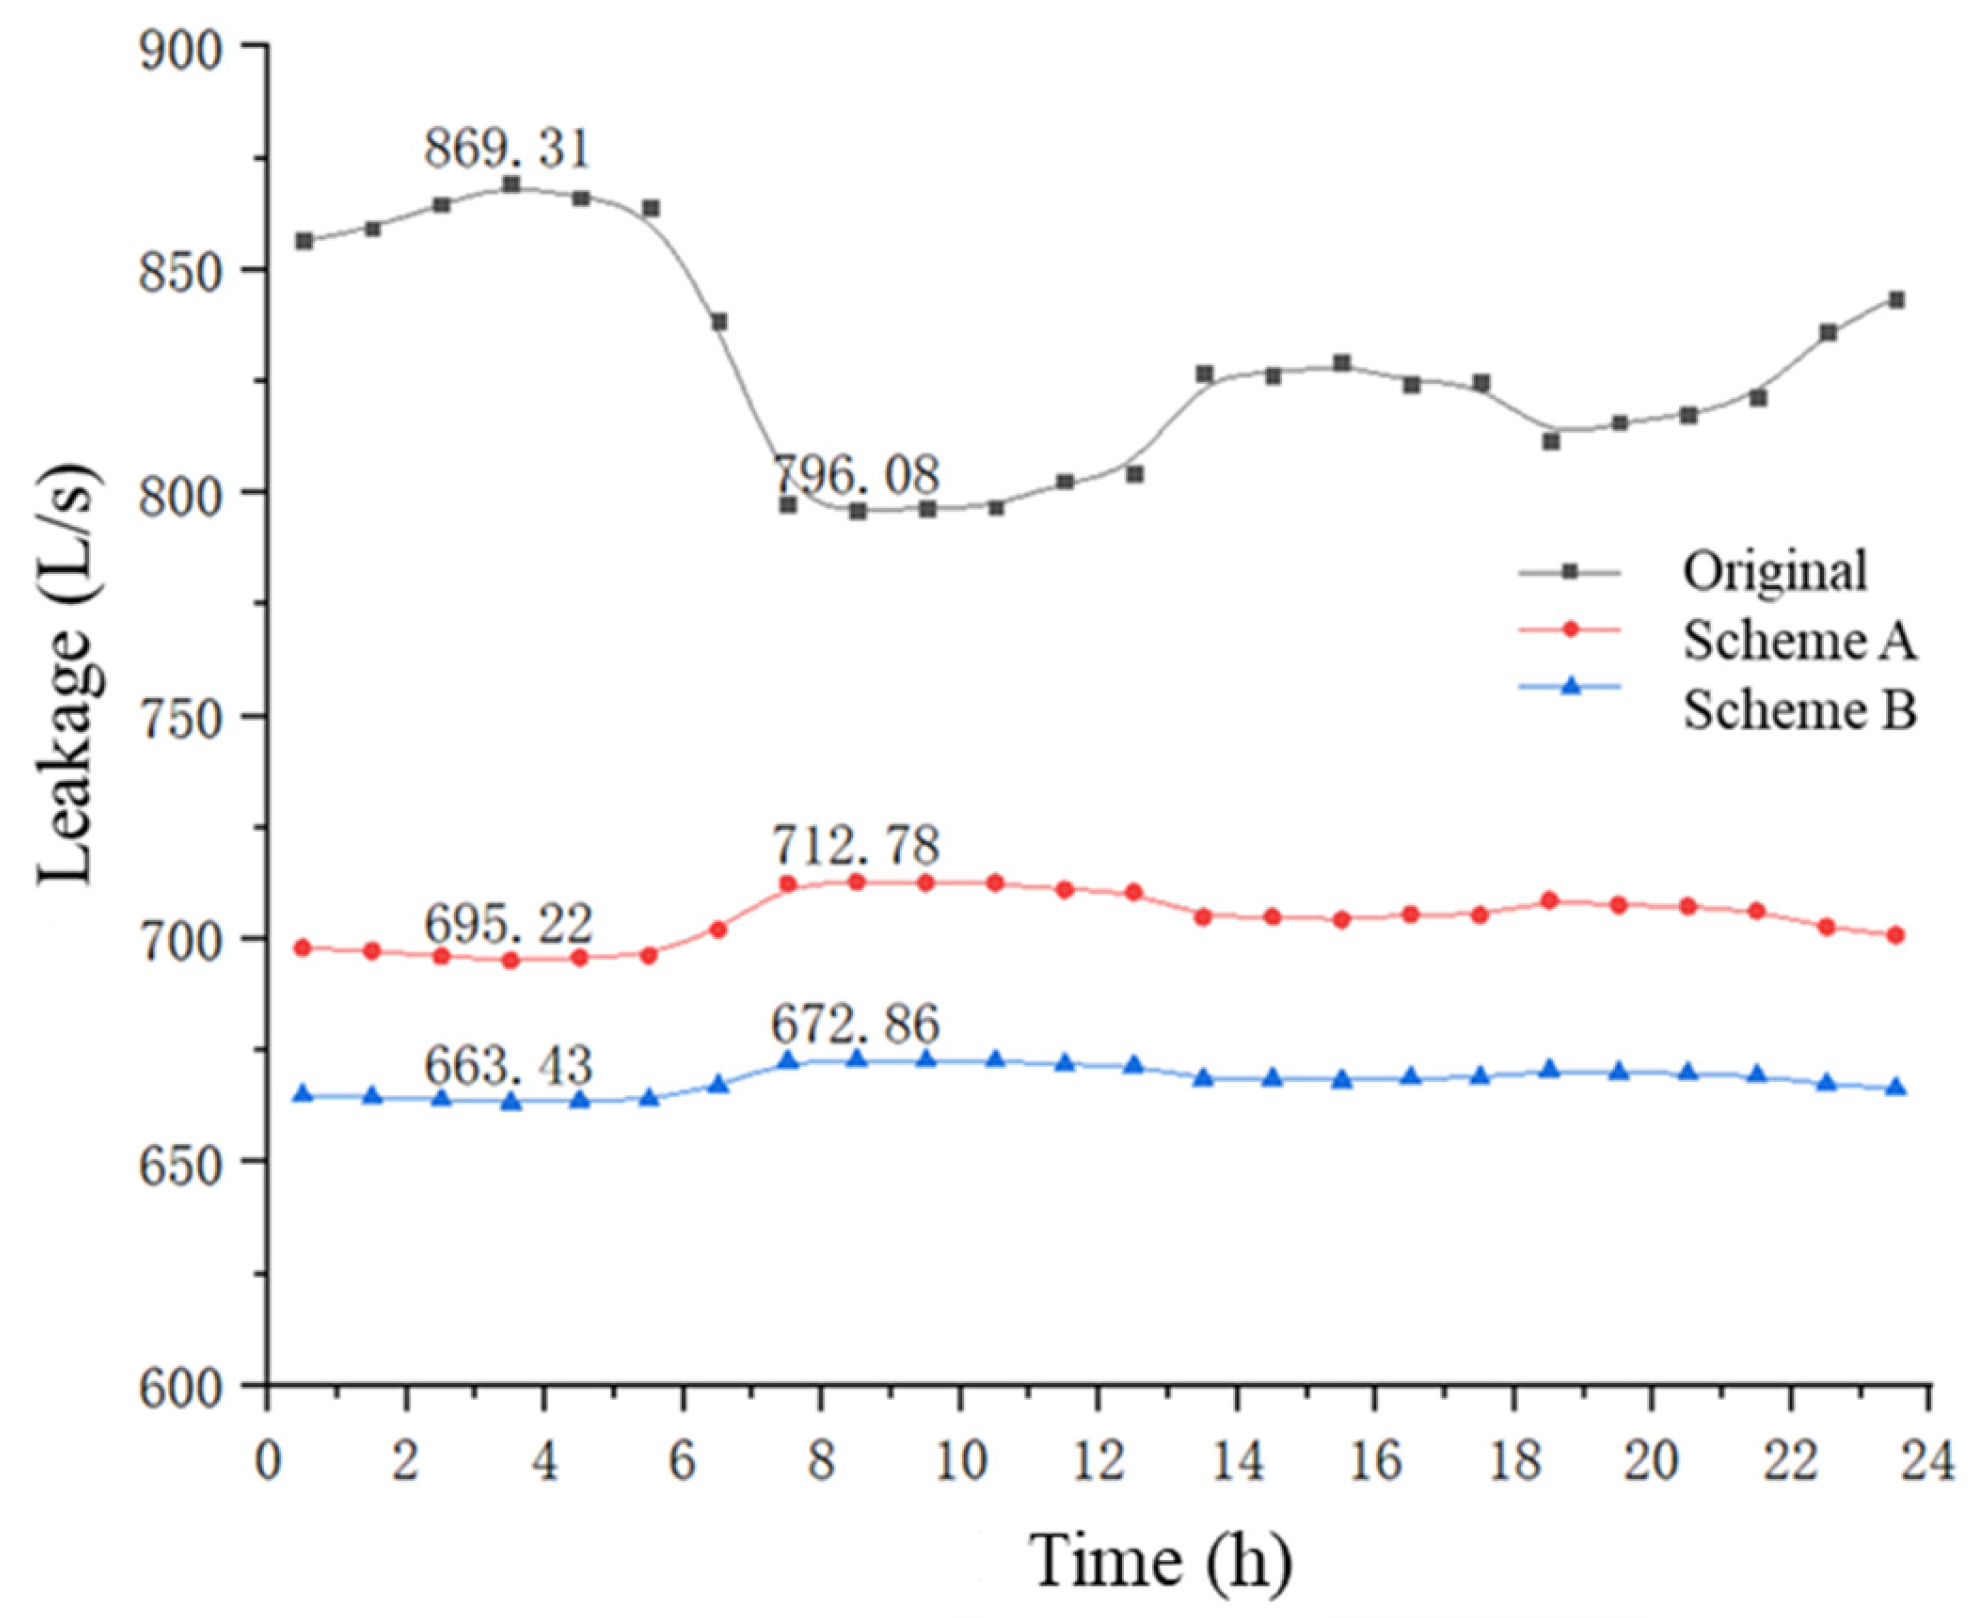
Figure 5 shows the leakage for 24 h in three scenarios. In the original WDN, the maximum leakage of the pipe network occurred at 3–4 a.m. (869.31 L/s), while the smallest leakage occurred at 8–10 a.m. (796.08 L/s). However, in Schemes A and B, the maximum leakage of the pipe network occurs around 8–9 a.m., and the minimum leakage occurs around 3–4 a.m., which is contrary to the original scenario. The primary cause is the ineffective regulation of nodal pressures in the original WDN, which led to higher pressure at night and more leakage than during the day. The pressure was lower throughout the day for schemes A and B. The pressure was higher than at night because of the increased water usage during the day, resulting in more leaks during the day than at night. This will be discussed in the following section.
Compared with the daily average leakage rate of 829.89 L/s of the original WDN, Scheme A reduced it to 704.40 L/s, a decrease of 15.12%, and Scheme B reduced it to 668.36 L/s, a decrease of 19.46%. However, Scheme B’s depressurization and leakage reduction effect are still significantly better than Scheme A’s. It is primarily due to the sequential relationship between the DMAs upstream and downstream in Scheme A.
To further compare the advantages and disadvantages of the two DMA schemes in pressure control, we selected the valley demand period at 3–4 a.m. and the peak demand period at 8–9 a.m. for further analysis.
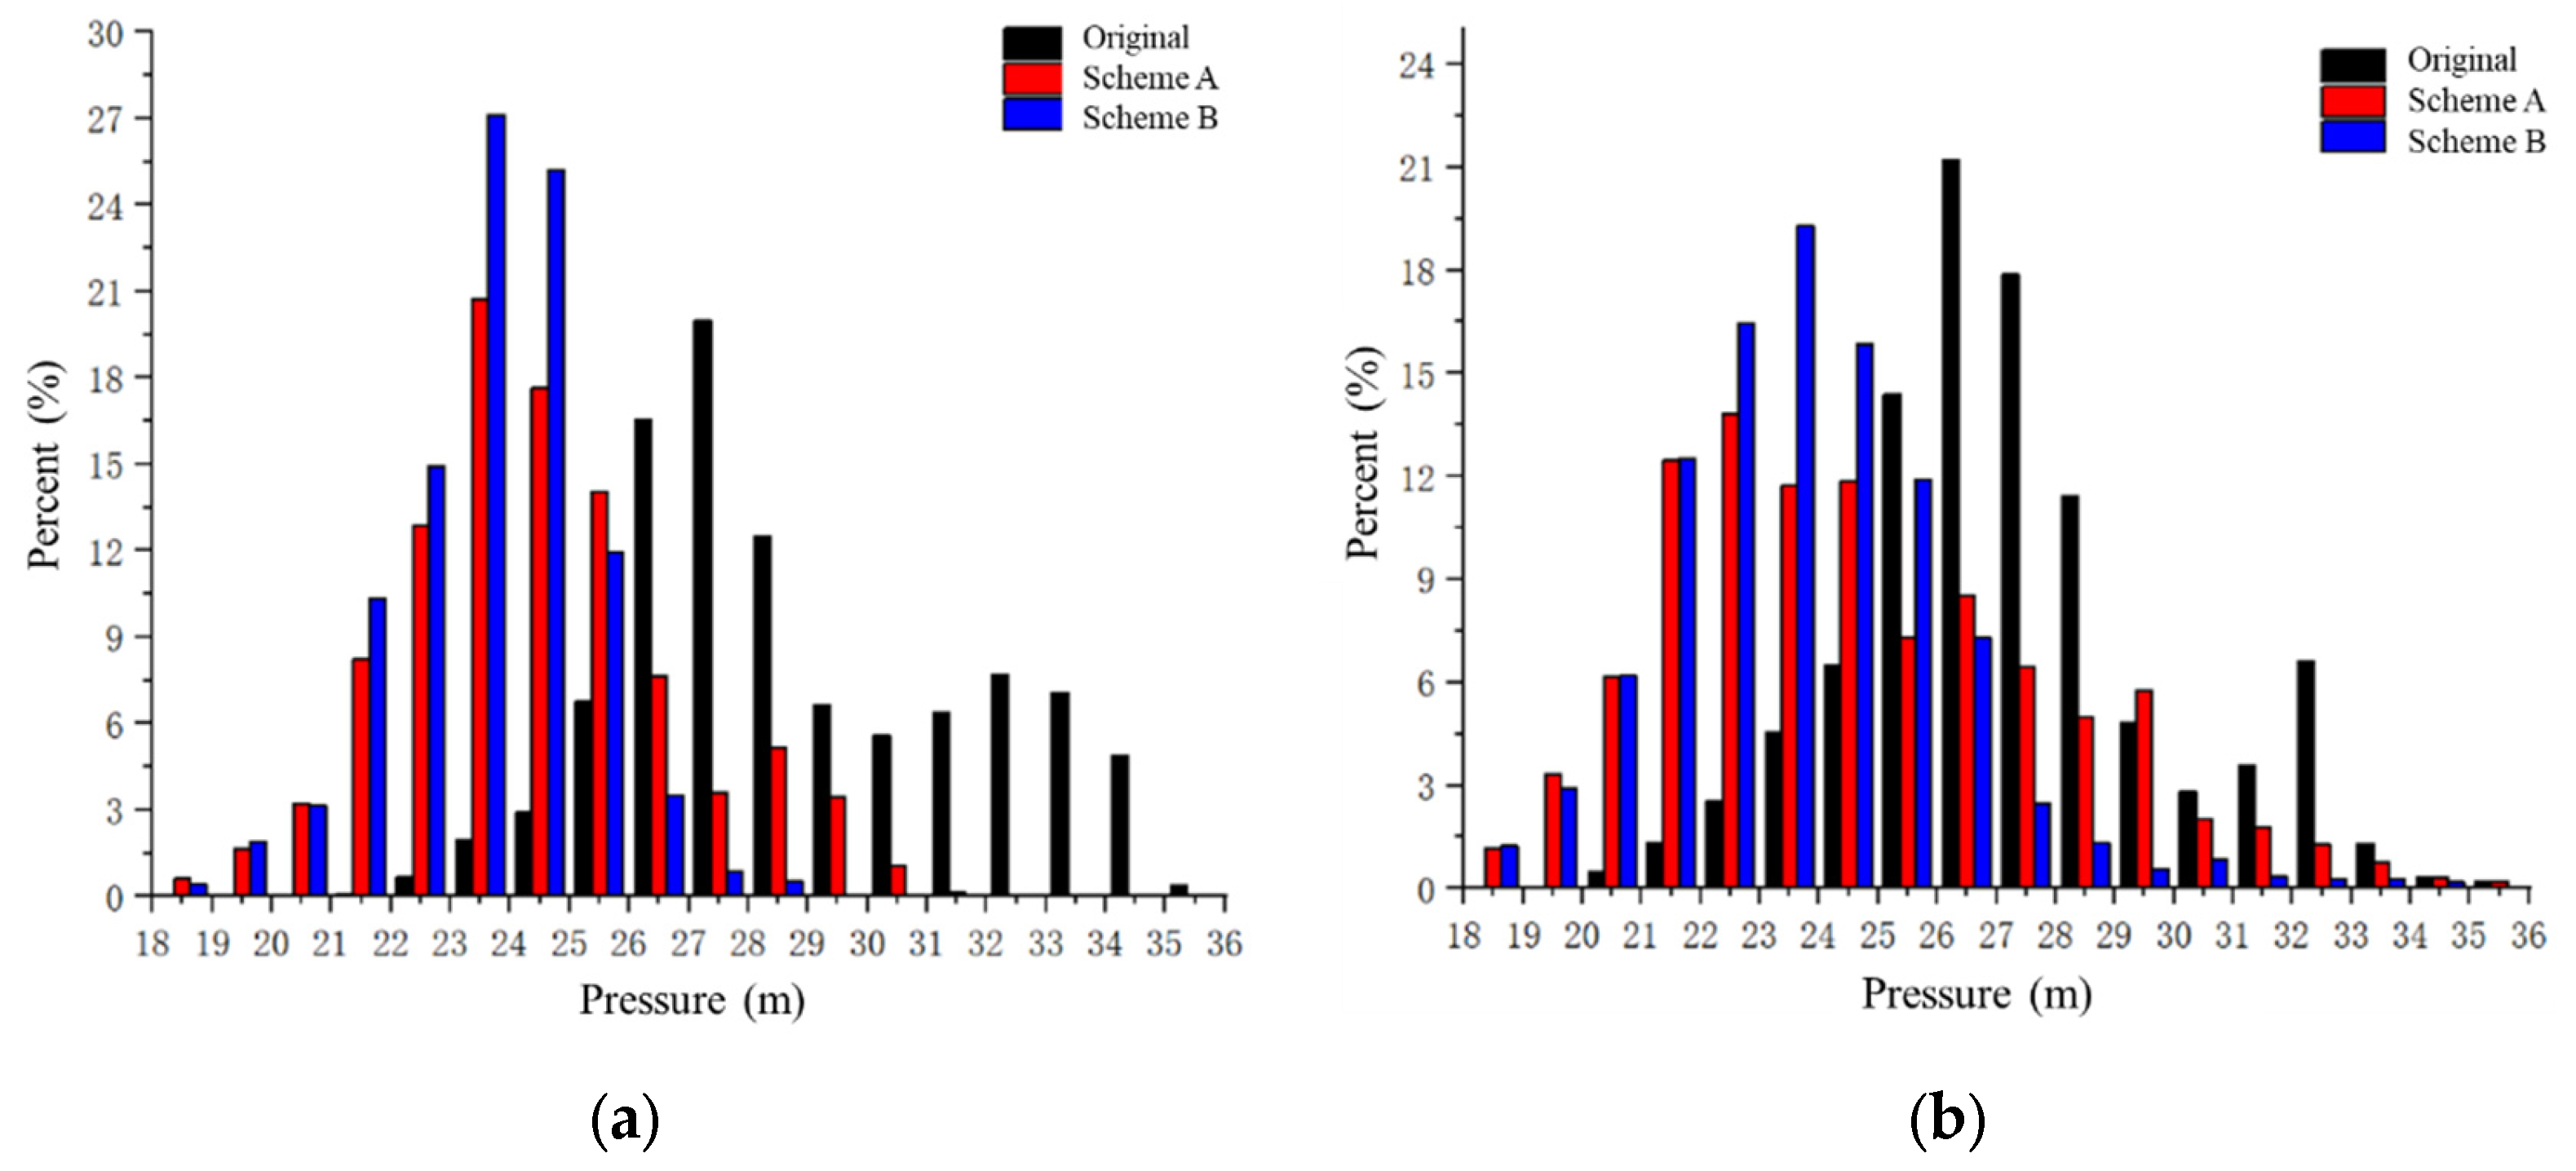
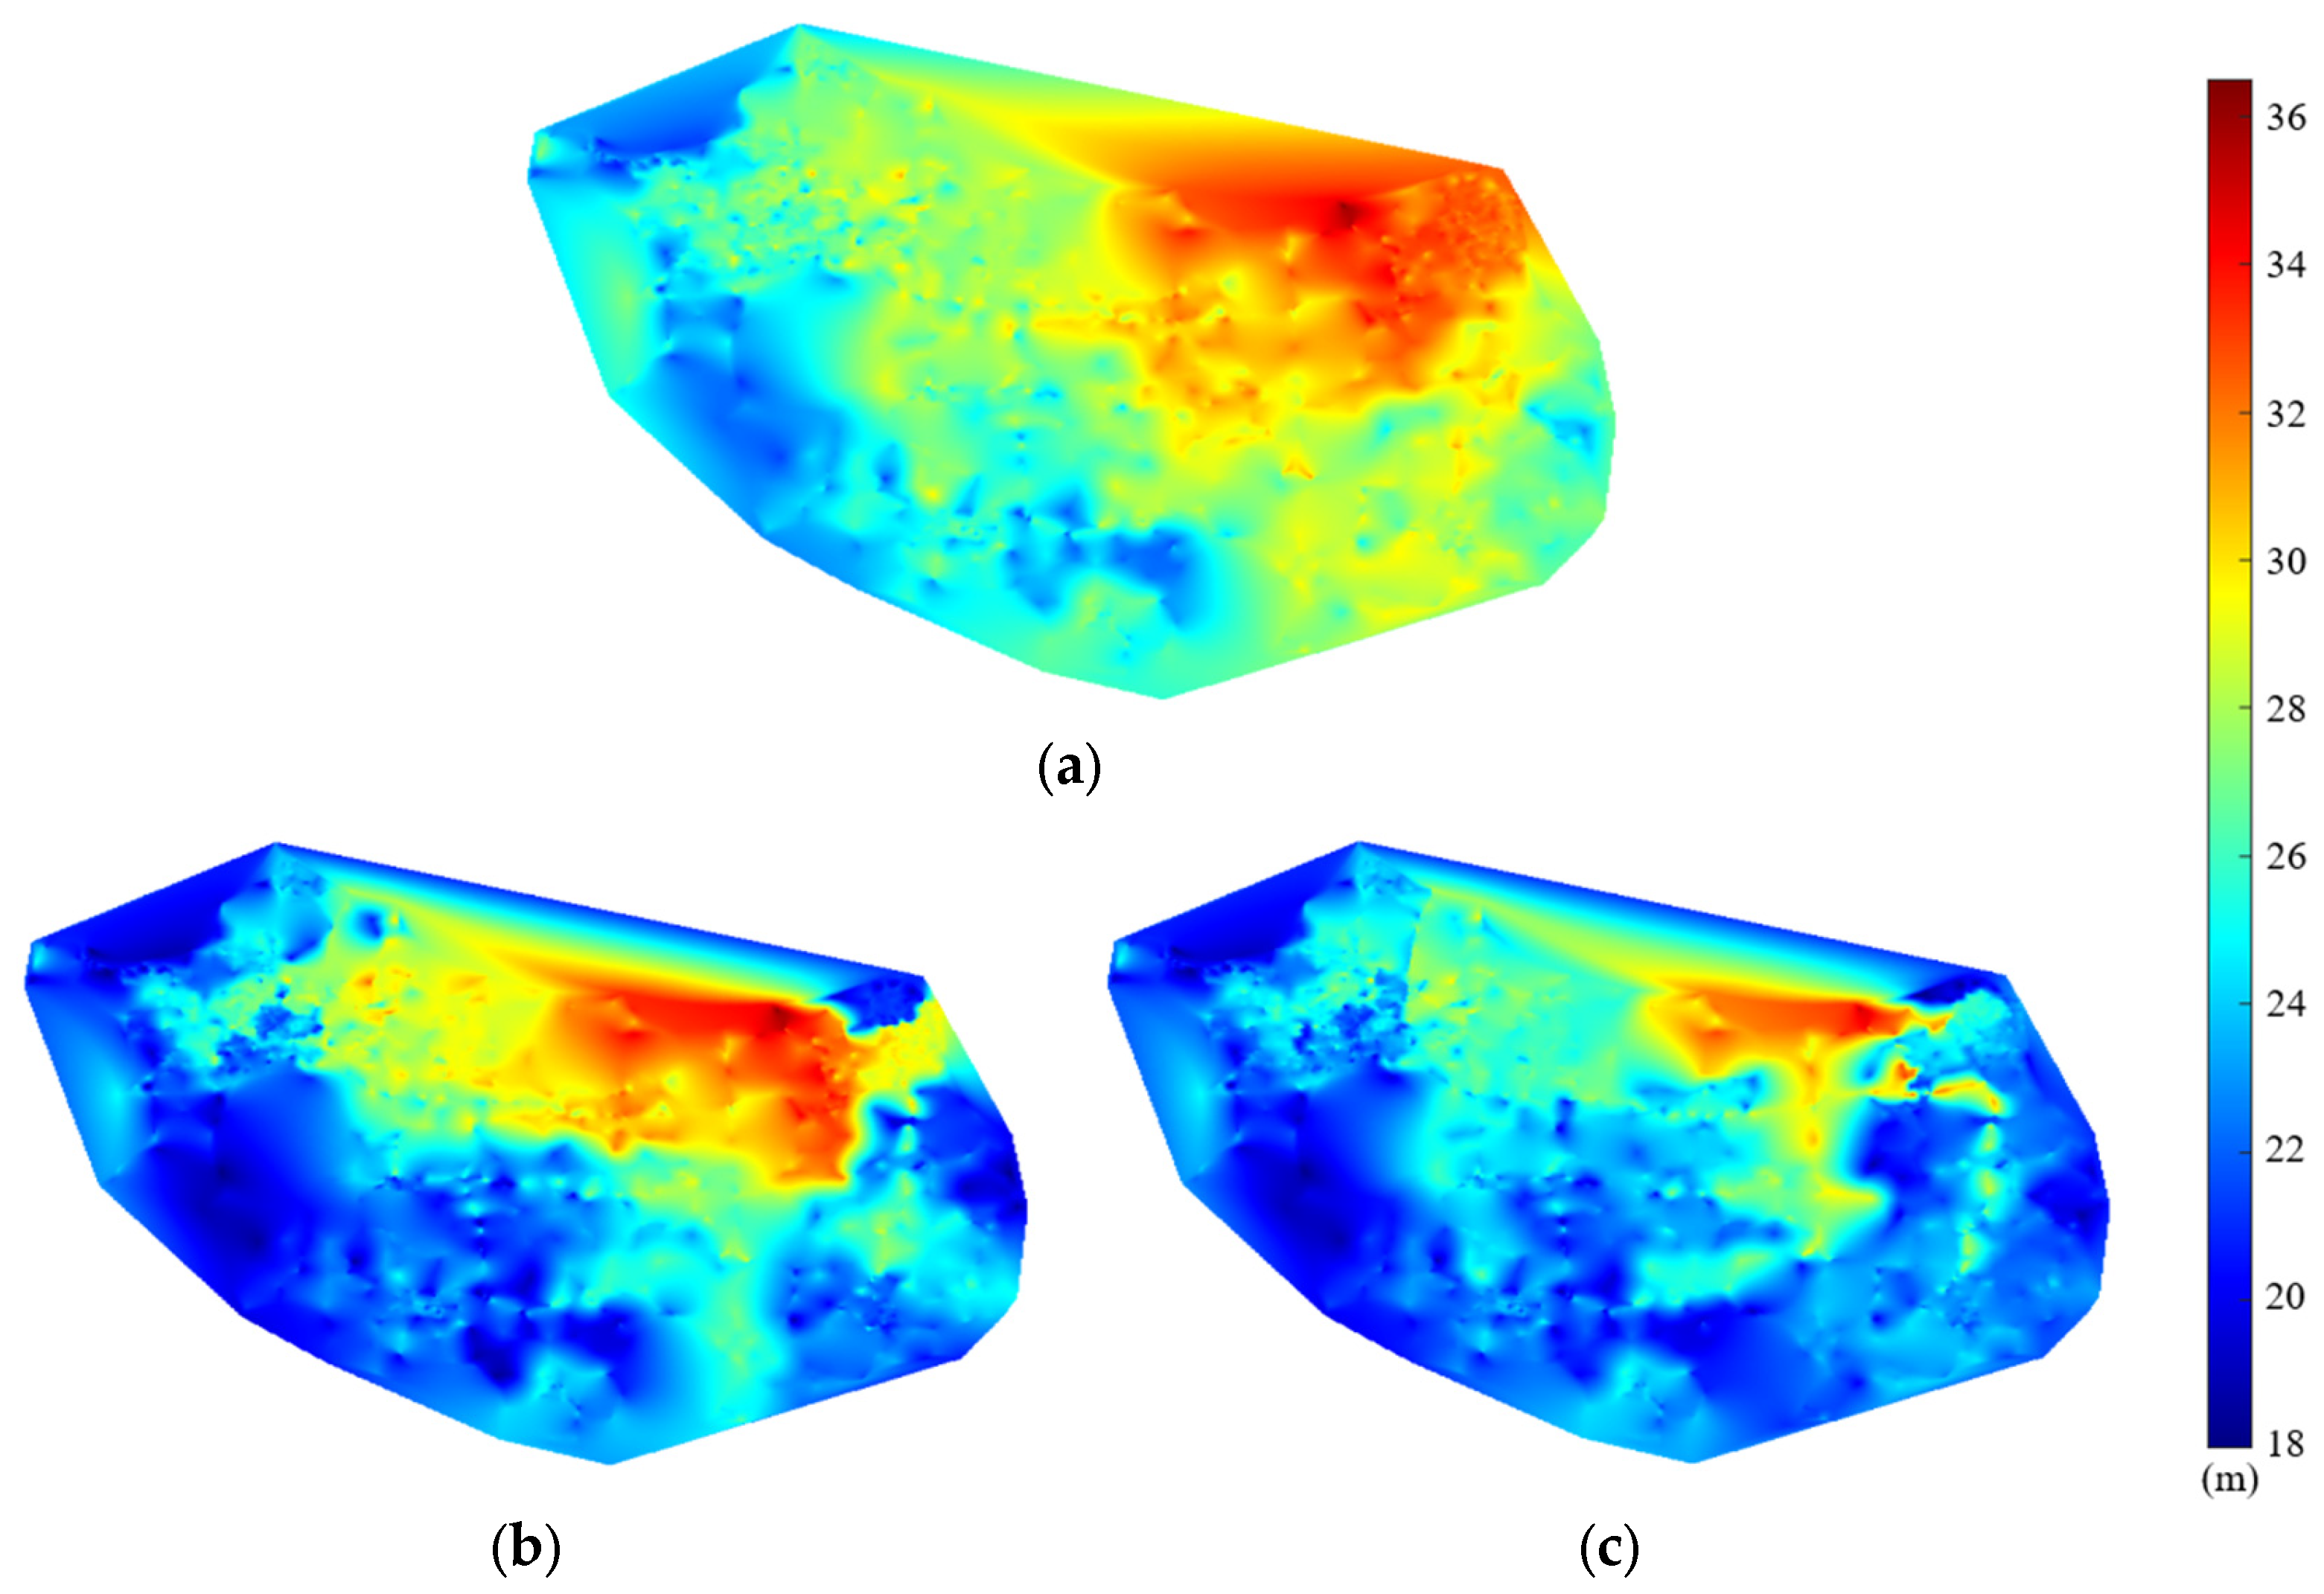
Figure 6a shows the distribution of weighted nodal pressure during the valley demand period. It can be seen that the pressure of the nodes in the original WDN is mainly concentrated in the range of 25–35 m, and the redundant pressure is large. After pressure management, the node pressure in the two partition schemes is controlled. However, the proportion of low-pressure nodes in Scheme B is significantly higher than that of Scheme A, and only a small proportion of node pressures in Scheme B are greater than 27 m, while there are still some nodes in Scheme A with pressures in the range of 26–31 m. In addition, the nodal pressure is shown in Figure 7. In comparison to Figure 7a, the pressures in Figure 7b,c are almost at the minimum service head in the area far from the water source. However, the high-pressure region in Figure 7c is significantly smaller than that in Figure 7b, demonstrating that the parallel connection between DMA partitions benefits further control leakage.
Figure 6b shows the weighted nodal water pressure distribution during the peak demand period. The nodal water pressure in the original WDN is mainly concentrated in 23–32 m, and the redundant pressure is large. After pressure management, the node pressure in the two schemes is significantly reduced. Moreover, the proportion of low-pressure nodes in Scheme B is considerably higher than in Scheme A. Figure 8 displays the nodal pressure at the peak load period. As predicted, the high-pressure region near the water source for Scheme B (Figure 8c) is smaller than Scheme A (Figure 8a). The high-pressure areas in Figure 7b,c are also much smaller than those in Figure 8b,c. Additionally, we can observe that the high-pressure areas in Figure 7b,c are substantially smaller than those in Figure 8b,c, indicating that the water pressure in the period of peak demand is higher than in the period of valley demand.
In scheme A, in order to meet the minimum service head of each node in the downstream DMA, the upstream partition must maintain a certain surplus head, making it difficult to control the leakage of upstream DMA more effectively. On the other hand, the trunk mains keep all of the DMAs in scheme B in a parallel relationship, making it simple to manage the leakage of upstream DMAs better; hence, the pressure reduction and leakage control effect of scheme B is better than scheme A.

5. Conclusions

In this paper, the two partition methods of whether the trunk mains participates in partition are compared and evaluated based on three aspects: economy, water quality protection, and leak control effects. The main conclusions are as follows:
(1)
For economy, the method in which the trunk mains participates in the partitioning process (Scheme A) is better than the method in which the trunk mains does not participate in the partitioning process (Scheme B). In Scheme B, when the trunk mains are separated from the WDN, many boundary pipes are generated within the remaining pipe system, increasing the cost of the DMA partition. In the case study, even though Scheme B has eight fewer DMA partitions than Scheme A, the overall project cost is 15.34% higher than Scheme A. Therefore, for cities with tight budgets, it is recommended to choose the method wherein the trunk mains participate in the partitioning process.
(2)
For water quality, Scheme B is a better choice than Scheme A. In the case study, Scheme B has less high-age water than Scheme A. Even the percentage of water in age 12–96 h of Scheme B is slightly lower than the original WDN. Therefore, if water quality protection needs to be considered when partitioning the WDN, it is recommended to choose the method in which the trunk mains do not participate in the partitioning process.
(3)
For leakage control, Scheme B is better than Scheme A. There is an obvious upstream and downstream relationship between DMAs in Scheme A. The impact on downstream DMAs needs to be considered when managing the pressure of upstream partitions. In contrast, the trunk mains supply water to DMAs directly in Scheme B. The DMAs are relatively independent. Therefore, in terms of its long-term leakage control objectives, it is recommended to choose the method wherein the trunk mains do not participate in the partitioning process.
In summary, if the local government’s financial resources are relatively insufficient, it is recommended to choose the method wherein the trunk mains participate in the partitioning process. However, if the long-term safe and efficient operation of the WDN is concerned, it is recommended to choose the method wherein the trunk mains do not participate in the partitioning process.
On the other hand, it needs to be emphasized that the above conclusions may only apply to networks with a similar network topology and water demand distribution as the case network, and future work will involve applying the two partition methods to multiple types of WDNs to verify the universality of the conclusions.

Author Contributions

H.Z.: Conceptualization, Methodology; Y.L.: Software, Validation, Writing-Original Draft; H.Y.: Writing-Original Draft; T.Y.: Writing—Review & Editing, Funding acquisition; Y.S.: Writing—Review & Editing, Writing-Original Draft, Funding acquisition. All authors have read and agreed to the published version of the manuscript.

Funding

This research was funded by [the National Natural Science Foundation of China] grant number [52270095] and [the National Natural Science Foundation of China] grant number [52070167].

Data Availability Statement

Data is available on request from the authors.

Conflicts of Interest

The authors declare no conflict of interest.

References

  1. Ozdemir, O. Water leakage management by district metered areas at water distribution networks. Environ. Monit. Assess. 2018, 190, 182. [Google Scholar] [CrossRef] [PubMed]
  2. Di Nardo, A.; Di Natale, M.; Musmarra, D.; Santonastaso, G.F.; Tzatchkov, V.; Alcocer-Yamanaka, V.H. Dual-use value of network partitioning for water system management and protection from malicious contamination. J. Hydroinformatics 2015, 17, 361–376. [Google Scholar] [CrossRef]
  3. Liu, J.; Kang, Y. Segment-based resilience response and intervention evaluation of water distribution systems. J. Water Supply Res. Technol.-Aqua 2022, 71, 100–119. [Google Scholar] [CrossRef]
  4. Huang, Y.; Zheng, F.; Kapelan, Z.; Savic, D.; Duan, H.F.; Zhang, Q. Efficient leak localization in water distribution systems using multistage optimal valve operations and smart demand metering. Water Resour. Res. 2020, 56, e2020WR028285. [Google Scholar] [CrossRef]
  5. Shao, Y.; Yao, H.; Zhang, T.; Chu, S.; Liu, X. An Improved Genetic Algorithm for Optimal Layout of Flow Meters and Valves in Water Network Partitioning. Water 2019, 11, 1087. [Google Scholar] [CrossRef] [Green Version]
  6. Brentan, B.M.; Campbell, E.; Meirelles, G.L.; Luvizotto, E.; Izquierdo, J. Social Network Community Detection for DMA Creation: Criteria Analysis through Multilevel Optimization. Math. Probl. Eng. 2017, 2017, 1–12. [Google Scholar] [CrossRef]
  7. Zhang, K.; Yan, H.; Zeng, H.; Xin, K.; Tao, T. A practical multi-objective optimization sectorization method for water distribution network. Sci. Total Environ. 2019, 656, 1401–1412. [Google Scholar] [CrossRef]
  8. Han, R.; Liu, J. Spectral Clustering and Genetic Algorithm for Design of District Metered Areas in Water Distribution Systems. Procedia Eng. 2017, 186, 152–159. [Google Scholar] [CrossRef]
  9. Diao, K.; Zhou, Y.; Rauch, W. Automated Creation of District Metered Area Boundaries in Water Distribution Systems. J. Water Resour. Plan. Manag. 2013, 139, 184–190. [Google Scholar] [CrossRef]
  10. Ciaponi, C.; Murari, E.; Todeschini, S. Modularity-Based Procedure for Partitioning Water Distribution Systems into Independent Districts. Water Resour. Manag. 2016, 30, 2021–2036. [Google Scholar] [CrossRef]
  11. Di Nardo, A.; Di Natale, M.; Santonastaso, G.F.; Venticinque, S. An Automated Tool for Smart Water Network Partitioning. Water Resour. Manag. 2013, 27, 4493–4508. [Google Scholar] [CrossRef]
  12. Di Nardo, A.; Di Natale, M. A heuristic design support methodology based on graph theory for district metering of water supply networks. Eng. Optim. 2011, 43, 193–211. [Google Scholar] [CrossRef]
  13. Gomes, R.; Sá Marques, A.; Sousa, J. Identification of the optimal entry points at District Metered Areas and implementation of pressure management. Urban Water J. 2012, 9, 365–384. [Google Scholar] [CrossRef]
  14. Deb, K.; Pratap, A.; Agarwal, S.; Meyarivan, T.A.M.T. A Fast and Elitist Multi-objective Genetic Algorithm: NSGA-II. IEEE Trans. Evol. Comput. 2002, 6, 182–197. [Google Scholar] [CrossRef] [Green Version]
  15. Mora-Melia, D.; Iglesias-Rey, P.L.; Martinez-Solano, F.J.; Fuertes-Miquel, V.S. Design of Water Distribution Networks using a Pseudo-Genetic Algorithm and Sensitivity of Genetic Operators. Water Resour. Manag. 2013, 27, 4149–4162. [Google Scholar] [CrossRef]
  16. Liu, J.; Lansey, K.E. Multiphase DMA Design Methodology Based on Graph Theory and Many-Objective Optimization. J. Water Resour. Plan. Manag. 2020, 146, 04020068. [Google Scholar] [CrossRef]
  17. Ferrari, G.; Savic, D.; Becciu, G. Graph-Theoretic Approach and Sound Engineering Principles for Design of District Metered Areas. J. Water Resour. Plan. Manag. 2014, 140. [Google Scholar] [CrossRef] [Green Version]
  18. Campbell, E.; Izquierdo, J.; Montalvo, I.; Pérez-García, R. A Novel Water Supply Network Sectorization Methodology Based on a Complete Economic Analysis, Including Uncertainties. Water 2016, 8, 179. [Google Scholar] [CrossRef] [Green Version]
  19. Zhang, T.; Yao, H.; Chu, S.; Yu, T.; Shao, Y. Optimized DMA Partition to Reduce Background Leakage Rate in Water Distribution Networks. J. Water Resour. Plan. Manag. 2021, 147. [Google Scholar] [CrossRef]
  20. Clauset, A.; Newman, M.E.J. Finding community structure in very large networks. Phys. Rev. E 2004, 70, 066111. [Google Scholar] [CrossRef]
  21. De Paola, F.; Fontana, N.; Galdiero, E.; Giugni, M.; Savic, D.; Uberti, G.S.d. Automatic Multi-objective Sectorization of a Water Distribution Network. Procedia Eng. 2014, 89, 1200–1207. [Google Scholar] [CrossRef] [Green Version]
  22. De Paola, F.; Fontana, N.; Galdiero, E.; Giugni, M.; Uberti, G.S.d.; Vitaletti, M. Optimal Design of District Metered Areas in Water Distribution Networks. Procedia Eng. 2014, 70, 449–457. [Google Scholar] [CrossRef] [Green Version]
  23. Nicolini, M.; Zovatto, L. Optimal Location and Control of Pressure Reducing Valves in Water Networks. J. Water Resour. Plan. Manag. 2009, 135. [Google Scholar] [CrossRef]
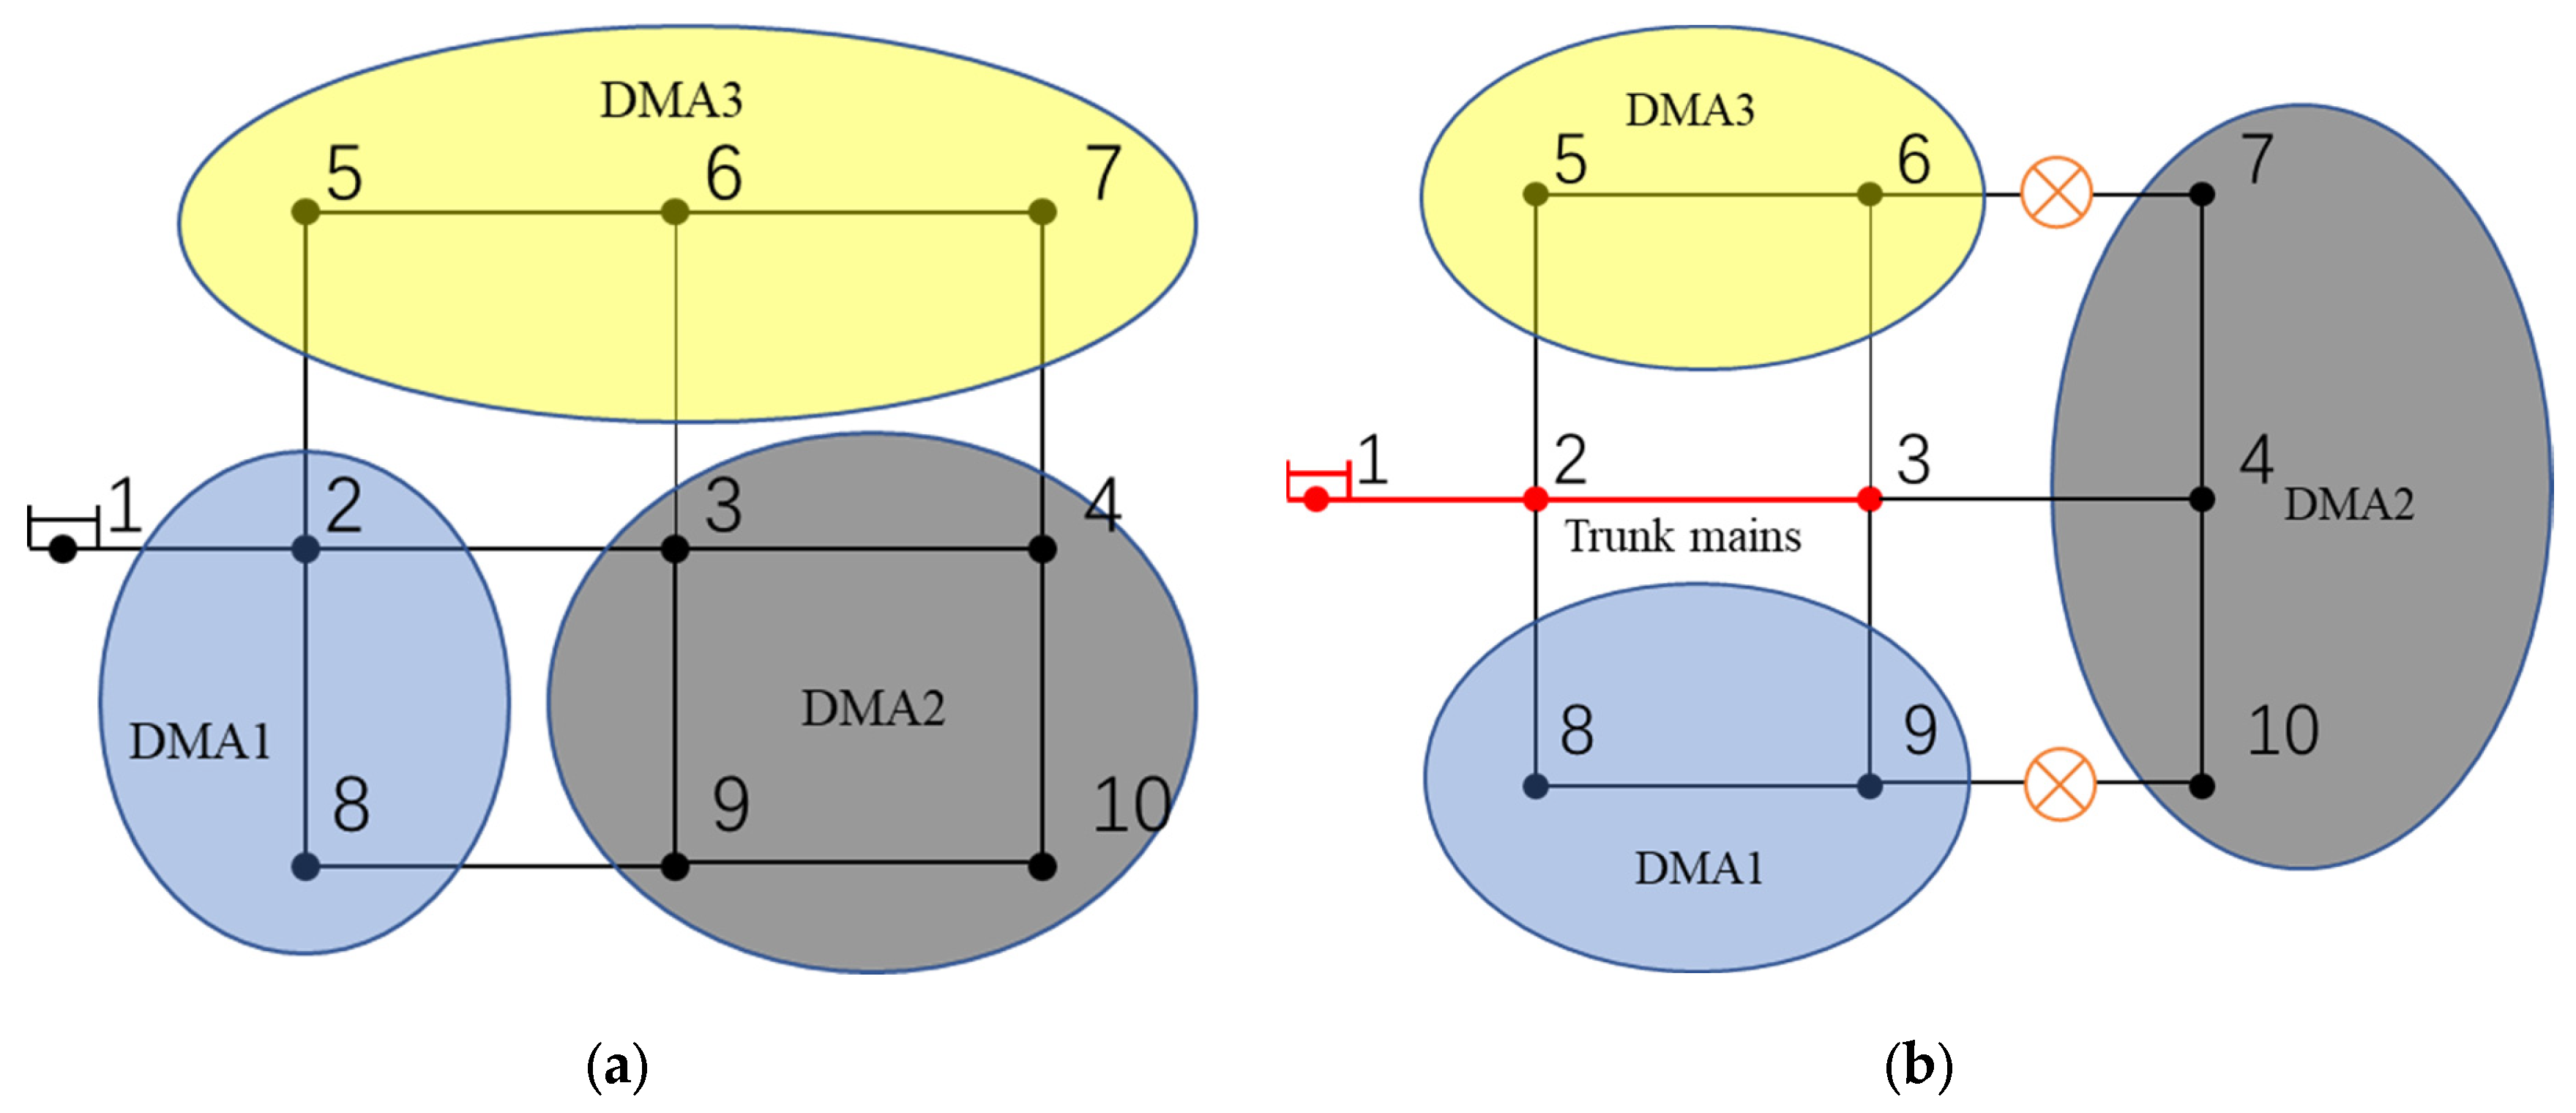
Figure 1. The Schematic diagrams of Schemes A and B: (a): Scheme A; (b): Scheme B.
Water 14 03876 g001
Figure 2. H-Town partitioning schemes: (a) Scheme A and (b) Scheme B.
Water 14 03876 g002
Figure 3. The water demand pattern of case WDN.
Water 14 03876 g003
Figure 4. Water proportion statistics of each age period in the three scenarios.
Water 14 03876 g004
Figure 5. Statistics of leakage loss in three scenarios.
Water 14 03876 g005
Figure 6. Pressure distribution: (a) valley demand period; (b) Peak demand period.
Water 14 03876 g006
Figure 7. Pressure distribution in valley demand period: (a) Original; (b) Scheme A; (c) Scheme B.
Water 14 03876 g007
Figure 8. Pressure distribution in peak demand period: (a) Original; (b) Scheme A; (c) Scheme B.
Water 14 03876 g008
Table 1. The price of the flowmeter and gate valve.
Diameter (mm)Gate Valve ($)Flowmeter ($)
15095 177
200134 256
250186 356
300250 535
400373 891
450481 1117
500506 1160
600835 2023
7001196 2903
8001535 3953
8501874 4066
9002214 4842
10003191 7122
12005693 12,355
14008986 18,458
Table 2. The implementation costs of two DMA partition schemes ($).
SchemesAB
Flowmeters100,23091,398
gate valves55,36488,060
Sum155,594179,459
Table 3. Water proportion statistics of each age period in the three scenarios.
Percent (%)Water Age (h)
0–1212–2424–3636–4848–6060–7272–8484–94>96
Original19.621.918.119.79.05.32.51.21.6
Scheme A28.523.412.311.910.66.22.41.32.7
Scheme B25.620.818.017.38.74.12.31.02.6
Publisher’s Note: MDPI stays neutral with regard to jurisdictional claims in published maps and institutional affiliations.