Article

Effects of Biochar Application before and after Freeze-Thaw on Soil Hydrothermal and Cotton Growth under Drip Irrigation

1
College of Water & Architectural Engineering, Shihezi University, Shihezi 832000, China
2
Key Laboratory of Modern Water-Saving Irrigation of Xinjiang Production & Construction Group, Shihezi University, Shihezi 832000, China
3
Key Laboratory of Northwest Oasis Water-Saving Agriculture, Ministry of Agriculture and Rural Affairs, Shihezi 832000, China
*
Author to whom correspondence should be addressed.
Water 2022, 14(23), 3818; https://doi.org/10.3390/w14233818
Submission received: 27 October 2022 / Revised: 17 November 2022 / Accepted: 21 November 2022 / Published: 23 November 2022

Abstract

:
Biochar as an organic soil conditioner has colossal application potential. Many recent studies revealed the influence of biochar on the soil during the crop growth period. However, few studies considered the effect of seasonal freeze-thaw on biochar’s improvement effect. Therefore, we conducted a field experiment to observe the impact of biochar on soil and cotton (Gossypium hirsutum L.). We used four biochar application rates (0.33%, 0.66%, 1.00%, and 1.33% of soil mass fraction) and applied biochar in the cotton field before and after seasonal freeze-thaw, respectively. The results showed that applying biochar after freeze-thaw was more effective on soil water storage and soil temperature preservation during the cotton growth period. Moreover, applying biochar with 0.66% soil mass fraction after freeze-thaw improved the cotton biomass by 5.31~36.13%, leaf area index by −10.82~32.52%, and seed cotton yield by 3.88~21.98%. Based on the principal component analysis of cotton fiber quality, we found that 0.66% biochar application after freeze-thaw improved cotton fiber most significantly. In total, applying biochar at 0.66% soil mass fraction after freeze-thaw was the most optimal application mode for improving soil hydrothermal conditions, cotton growth, and fiber quality. Our study can provide a scientific reference for applying biochar in northern Xinjiang, China.

1. Introduction

Cotton is Xinjiang’s most important cash crop. The total cotton production of Xinjiang was 89.5% of the total cotton production in China [1]. But continuous cropping and seasonal freeze-thaw caused soil structure degradation [2,3]. Soil erosion was affected by the freeze-thaw cycles ulteriorly because thawing and water erosion reinforced each other [4]. Due to the pore expansion and water migration caused by the freeze-thaw process, salt accumulation was also generated in the surface soil [5]. Consequently, farmers returned straw to the cotton field in northern Xinjiang to reduce soil freeze damage. However, unreasonable straw returning to the field had harmed the soil. Returning a large amount of straw to the field increased verticillium wilt and affected the seedlings’ growth in the second year [6]. Excessive straw returning to the field caused crop yield reduction [7] and aggravated greenhouse gas emissions [8]. The returning straw will return a large number of pathogenic bacteria to the soil, providing a suitable environment for the growth, reproduction, and accumulation of pathogens and aggravating the occurrence of soil-borne diseases [9]. In wheat fields, adding straw reduced soil N residues from green manure but increased cumulative losses [10]. Therefore, biochar was used to replace crop straw in the field [11].
Biochar is a stable carbon-rich product formed by the thermal cracking of agricultural and forestry waste biomass under anoxic conditions [12]. Biochar has a graphite-like structure, which gives biochar strong adsorption and antioxidant capacity [13,14]. In some studies, biochar application protected the soil during the seasonal freeze-thaw to reduce soil degradation [15,16]. Applying biochar weakened soil salinization during the freeze-thaw [17], improved the utilization efficiency of snowmelt, and alleviated the soil drought problem in spring [18]. Otherwise, scientific researchers paid great attention to improving crop yield [19,20] and maintaining crop productivity [21] with biochar applied during the growth period. Biochar can help improve the soil structure [15,16] and crop yield [22] during the growth period. It can also reduce the content of Cd in soil [23]. Combining biochar and deficit irrigation can also compensate for the loss of vegetable yield and improve water use efficiency [24]. Biochar increased the soybean yield and also improved the soil properties and soybean root growth [25]. In addition, applying co-composted biochar improved soil health and greatly enhanced yields [26]. Wu et al. (2020) indicated that applying modified biochar in saline soils promoted phosphorus adsorption and reduced leaching [27]. Overall, these studies demonstrated the positive effects of biochar or its derivatives on soils and crops.
The field experiments of applying biochar were mainly during the growth periods. However, these studies rarely considered the effect of biochar affected by seasonal freeze-thaw on soil characteristics. In the field experiments of applying biochar in Northern Xinjiang, there was a lack of comparison of different biochar application periods. In this context, our purpose is to explore a reasonable biochar application mode by comparing the effects of biochar application before and after freeze-thaw on the soil hydrothermal conditions and crop growth.
We hypothesized that biochar application before and after freeze-thaw has different effects on soil characteristics during the growth period to observe the effects of different biochar application periods on crop growth. We set four biochar application rates and two application periods (before and after seasonal freeze-thaw) in the drip-irrigated cotton field. The specific objectives of this study were: (1) to explore the effect of biochar application in different periods on soil moisture and temperature in the topsoil (0–60 cm) of drip irrigation cotton field, (2) to investigate the effects of biochar on cotton dry matter accumulation, leaf area index (LAI) and seed cotton yield under drip irrigation, and (3) to find the most optimal biochar application pattern to improve the quality of cotton fiber.

2. Materials and Methods

2.1. Experiment Materials

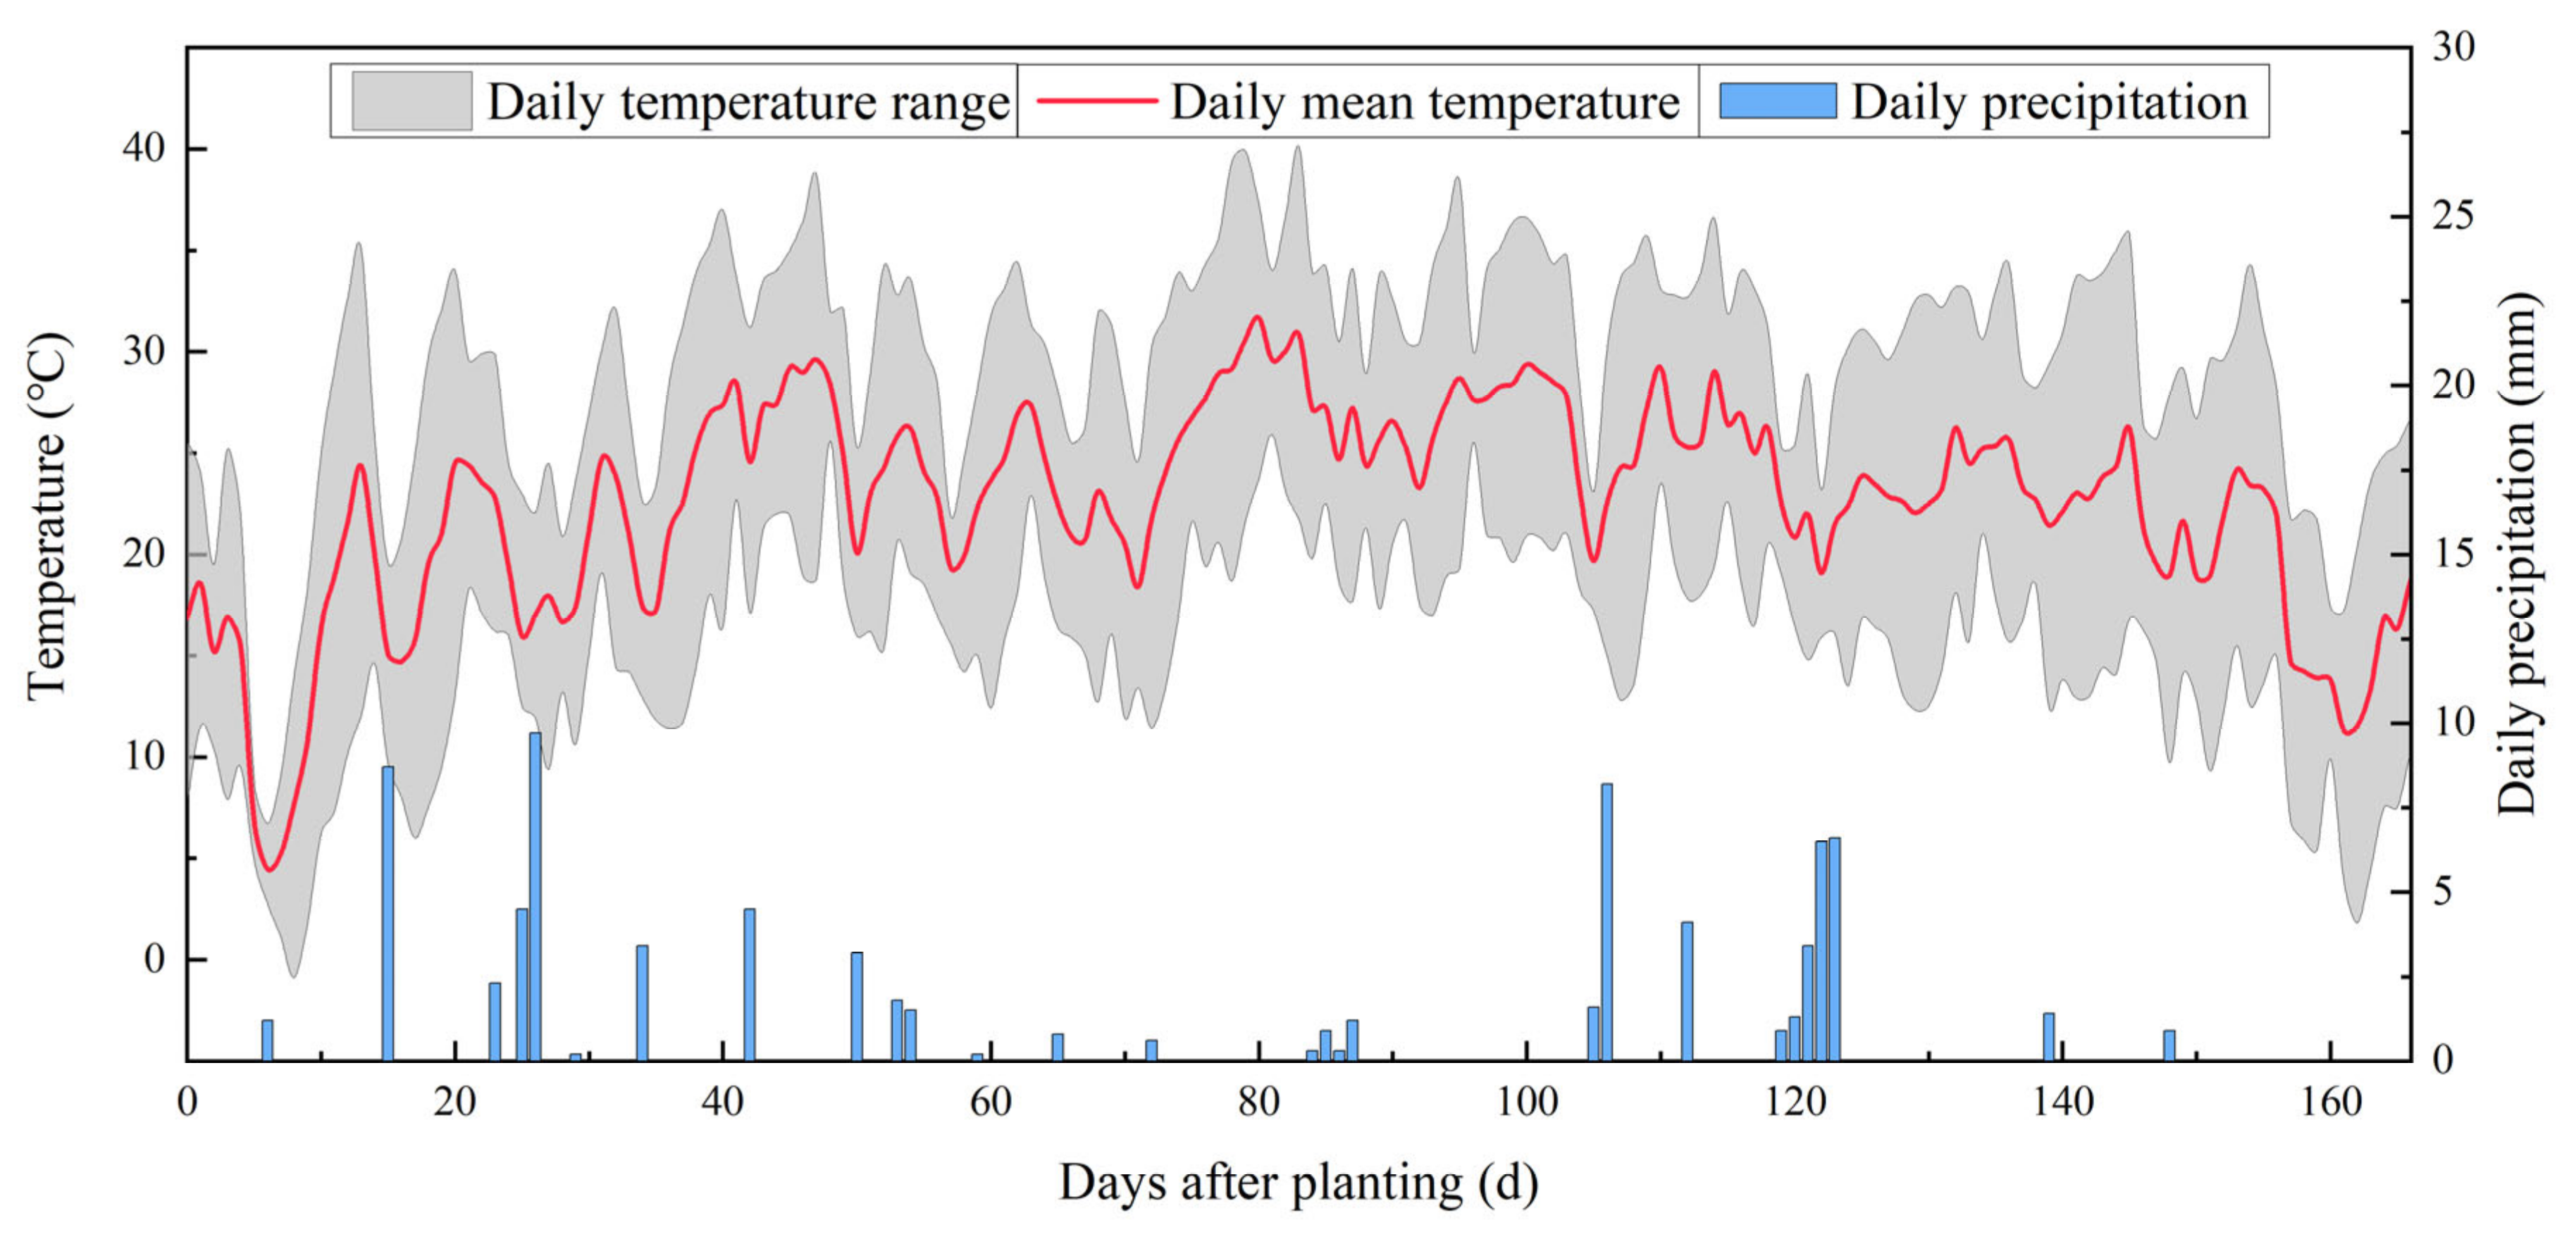
We conducted a field experiment in 2021 at the Key Laboratory of Modern Water-Saving Irrigation of Shihezi University, China (85°59′ E, 44°19′ N, 412 m above sea level). The area of the experimental plot is 0.096 ha, and the regional groundwater level is deeper than 8 m. The average annual sunshine duration at the study site is 2865 h, with an average frost-free period of 168 d. The average annual rainfall and potential evaporation are 207 mm and 1660 mm, respectively. The daily average temperature and precipitation data for one year from 27 October 2020, are shown in Figure 1.
Before the experiment, we randomly selected five points in the test area and measured soil texture, bulk density, total carbon, total nitrogen, and soil organic matter at each depth (Table 1).
The tested biochar was made with cotton straw in anoxic conditions of 550 °C. As a solid material, biochar was plowed into the test field at a depth of 40 cm by a tiller. The main components of tested biochar are shown in Table 2.

2.2. Experimental Design

In this experiment, we set four biochar application rates of 0.33%, 0.66%, 1.00%, and 1.33% in soil mass fraction, two application periods on 27 October 2020 (before freeze-thaw) and 15 April 2021 (after freeze-thaw). We also set a check treatment without biochar applied, in total nine treatments were made. Biochar applied timing and rate in each treatments A are shown in Table 3.
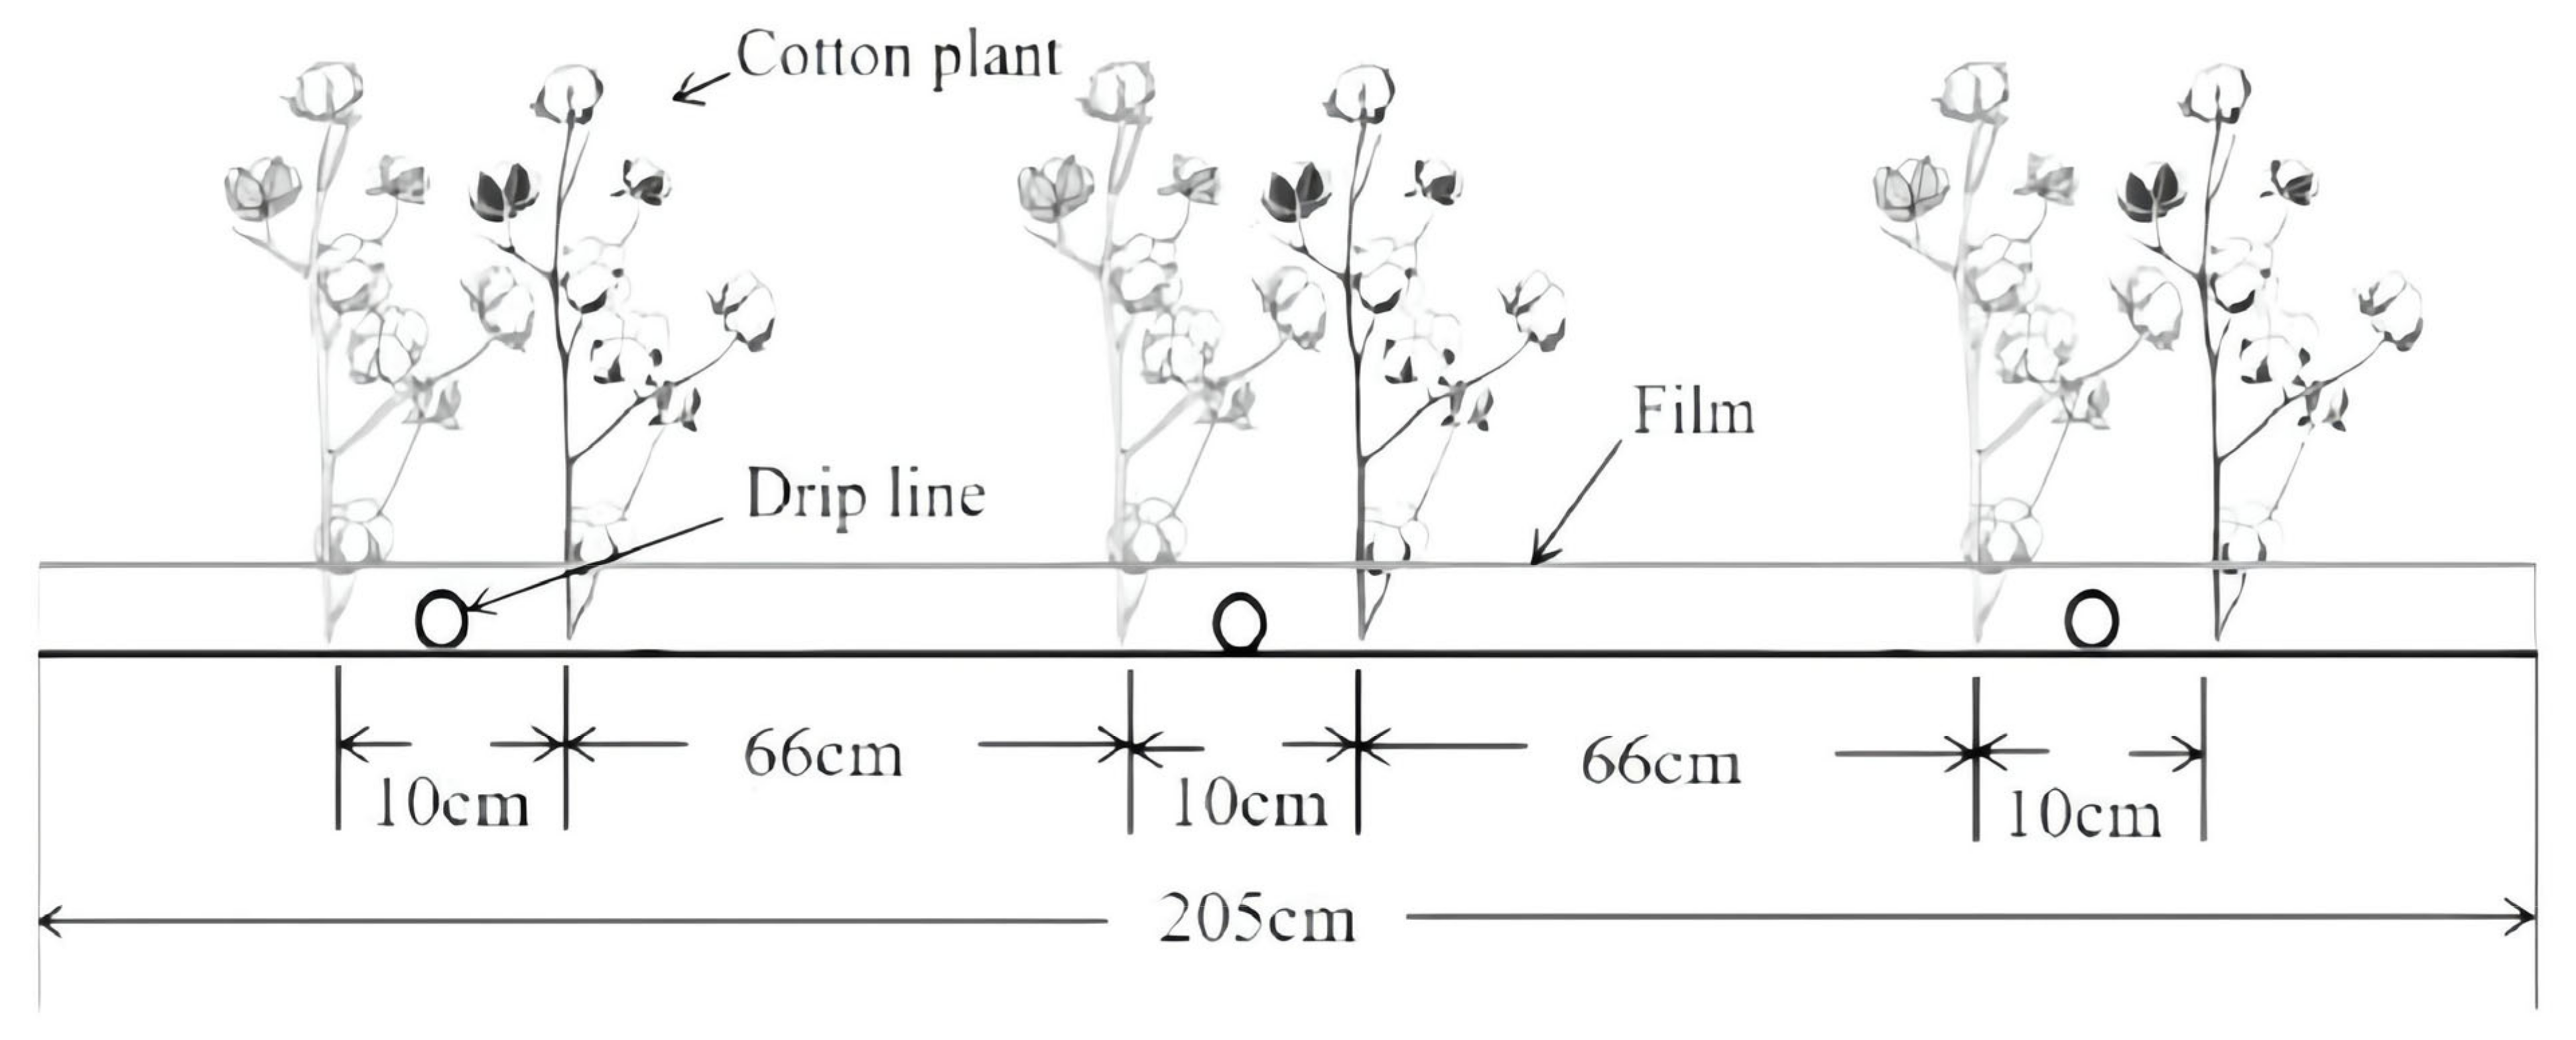
We planted cotton in all test plots on 16 April 2021. The tested cotton (Gossypium hirsutum L.) breed is Xinluzao 42, bred by the cotton Institute of Xinjiang Academy of agricultural reclamation Sciences in 2009. According to the local planting habits, cotton is planted by mulched drip irrigation mode, and the planting mode is shown in Figure 2.
Each treatment was set with three groups of repeated tests, in a total of 27 experimental plots were prepared in the cotton field. In addition to adding biochar, the water and fertilizer management of the experimental treatment was determined according to the local irrigation habits, 295 kg·ha−1 KH2PO4 and 450 kg·ha−1 urea were applied. During the growth period, fertilizer was applied by drip irrigation ten times, and the irrigation amount was 420 m3∙ha−1 each time. Except for biochar application, all treatments have the same irrigation and fertilization.

2.3. Data Collection

2.3.1. Soil Water Storage (SWS) in 0–60 cm Depth

Soil samples were collected at the end of each growth period by soil samplers and ring knives from three randomly selected locations in each plot. Soil samples were taken every 20 cm in a soil layer of 0 to 60 cm. Fresh soil samples were dried for 12 h at 105 °C in an oven until constant weight to measure the mass water content and dry bulk density. To calculate the total SWS in each plot was calculated by the following formula [28]:
S W S t o t = i = 1 i = n θ w i ρ b i Δ z
where SWStot is the total soil water storage in each plot, θwi is the mass water content in different layers of 20 cm depth, ρbi is dry bulk density in different layers of 20 cm depth, and ∆z equals 20 cm.

2.3.2. Soil Temperature in 0–60 cm Depth

Temperature sensors (Apresys, Duluth, MN, USA) are buried every 20 cm in a soil layer of 0 to 40 cm in each plot to measure the soil temperature incessantly every hour after sowing.

2.3.3. Cotton Biomass, Cotton LAI

We measured the length and maximum width of every leaf of three random cotton plants in each experiment plot 50 days after planting (DAP). The interval of our measurement was 10 d. We used the following formula to calculate the LAI [29]:
L A I = 0.84 ρ i = 1 j L i × B i 10000
where, LAI is the leaf area index, ρ is the planting density (plants m−2), j is the number of leaves per plant, L is the leaf length (cm), B is the leaf width (cm), and 0.84 is the conversion coefficient.
At the end of the boll-opening stage, we randomly selected three cotton plants from each experimental plot. Cotton organs were fixed in an oven at 105 °C for an hour and dried at 75 °C. After reaching the constant weight, we weighed the cotton biomass.

2.3.4. Seed Cotton Yield, Cotton Fiber Quality

We collected seed cotton in each experimental plot to measure the seed cotton yield per hectare. We measured the cotton fiber quality by USTER HVI1000 (USTER, Zurich, Switzerland).

2.4. Data Analysis

Microsoft Office 2016 (Redmond, WA, USA) was used for data sorting and table production, and OriginPro 2022b (Northampton, MA, USA) was used for image production. Single-factor ANOVA was used to determine the differences between the treatments. The least significant difference (LSD) multiple comparison methods were applied at a 0.05 probability level. Principal component analysis (PCA) was used to evaluate the cotton quality of each treatment. The data were analyzed with IBM SPSS 22.0 (Armonk, NY, USA).

3. Results

3.1. Effects of Biochar Application before and after Freeze-Thaw on Soil Water Storage and Soil Temperature

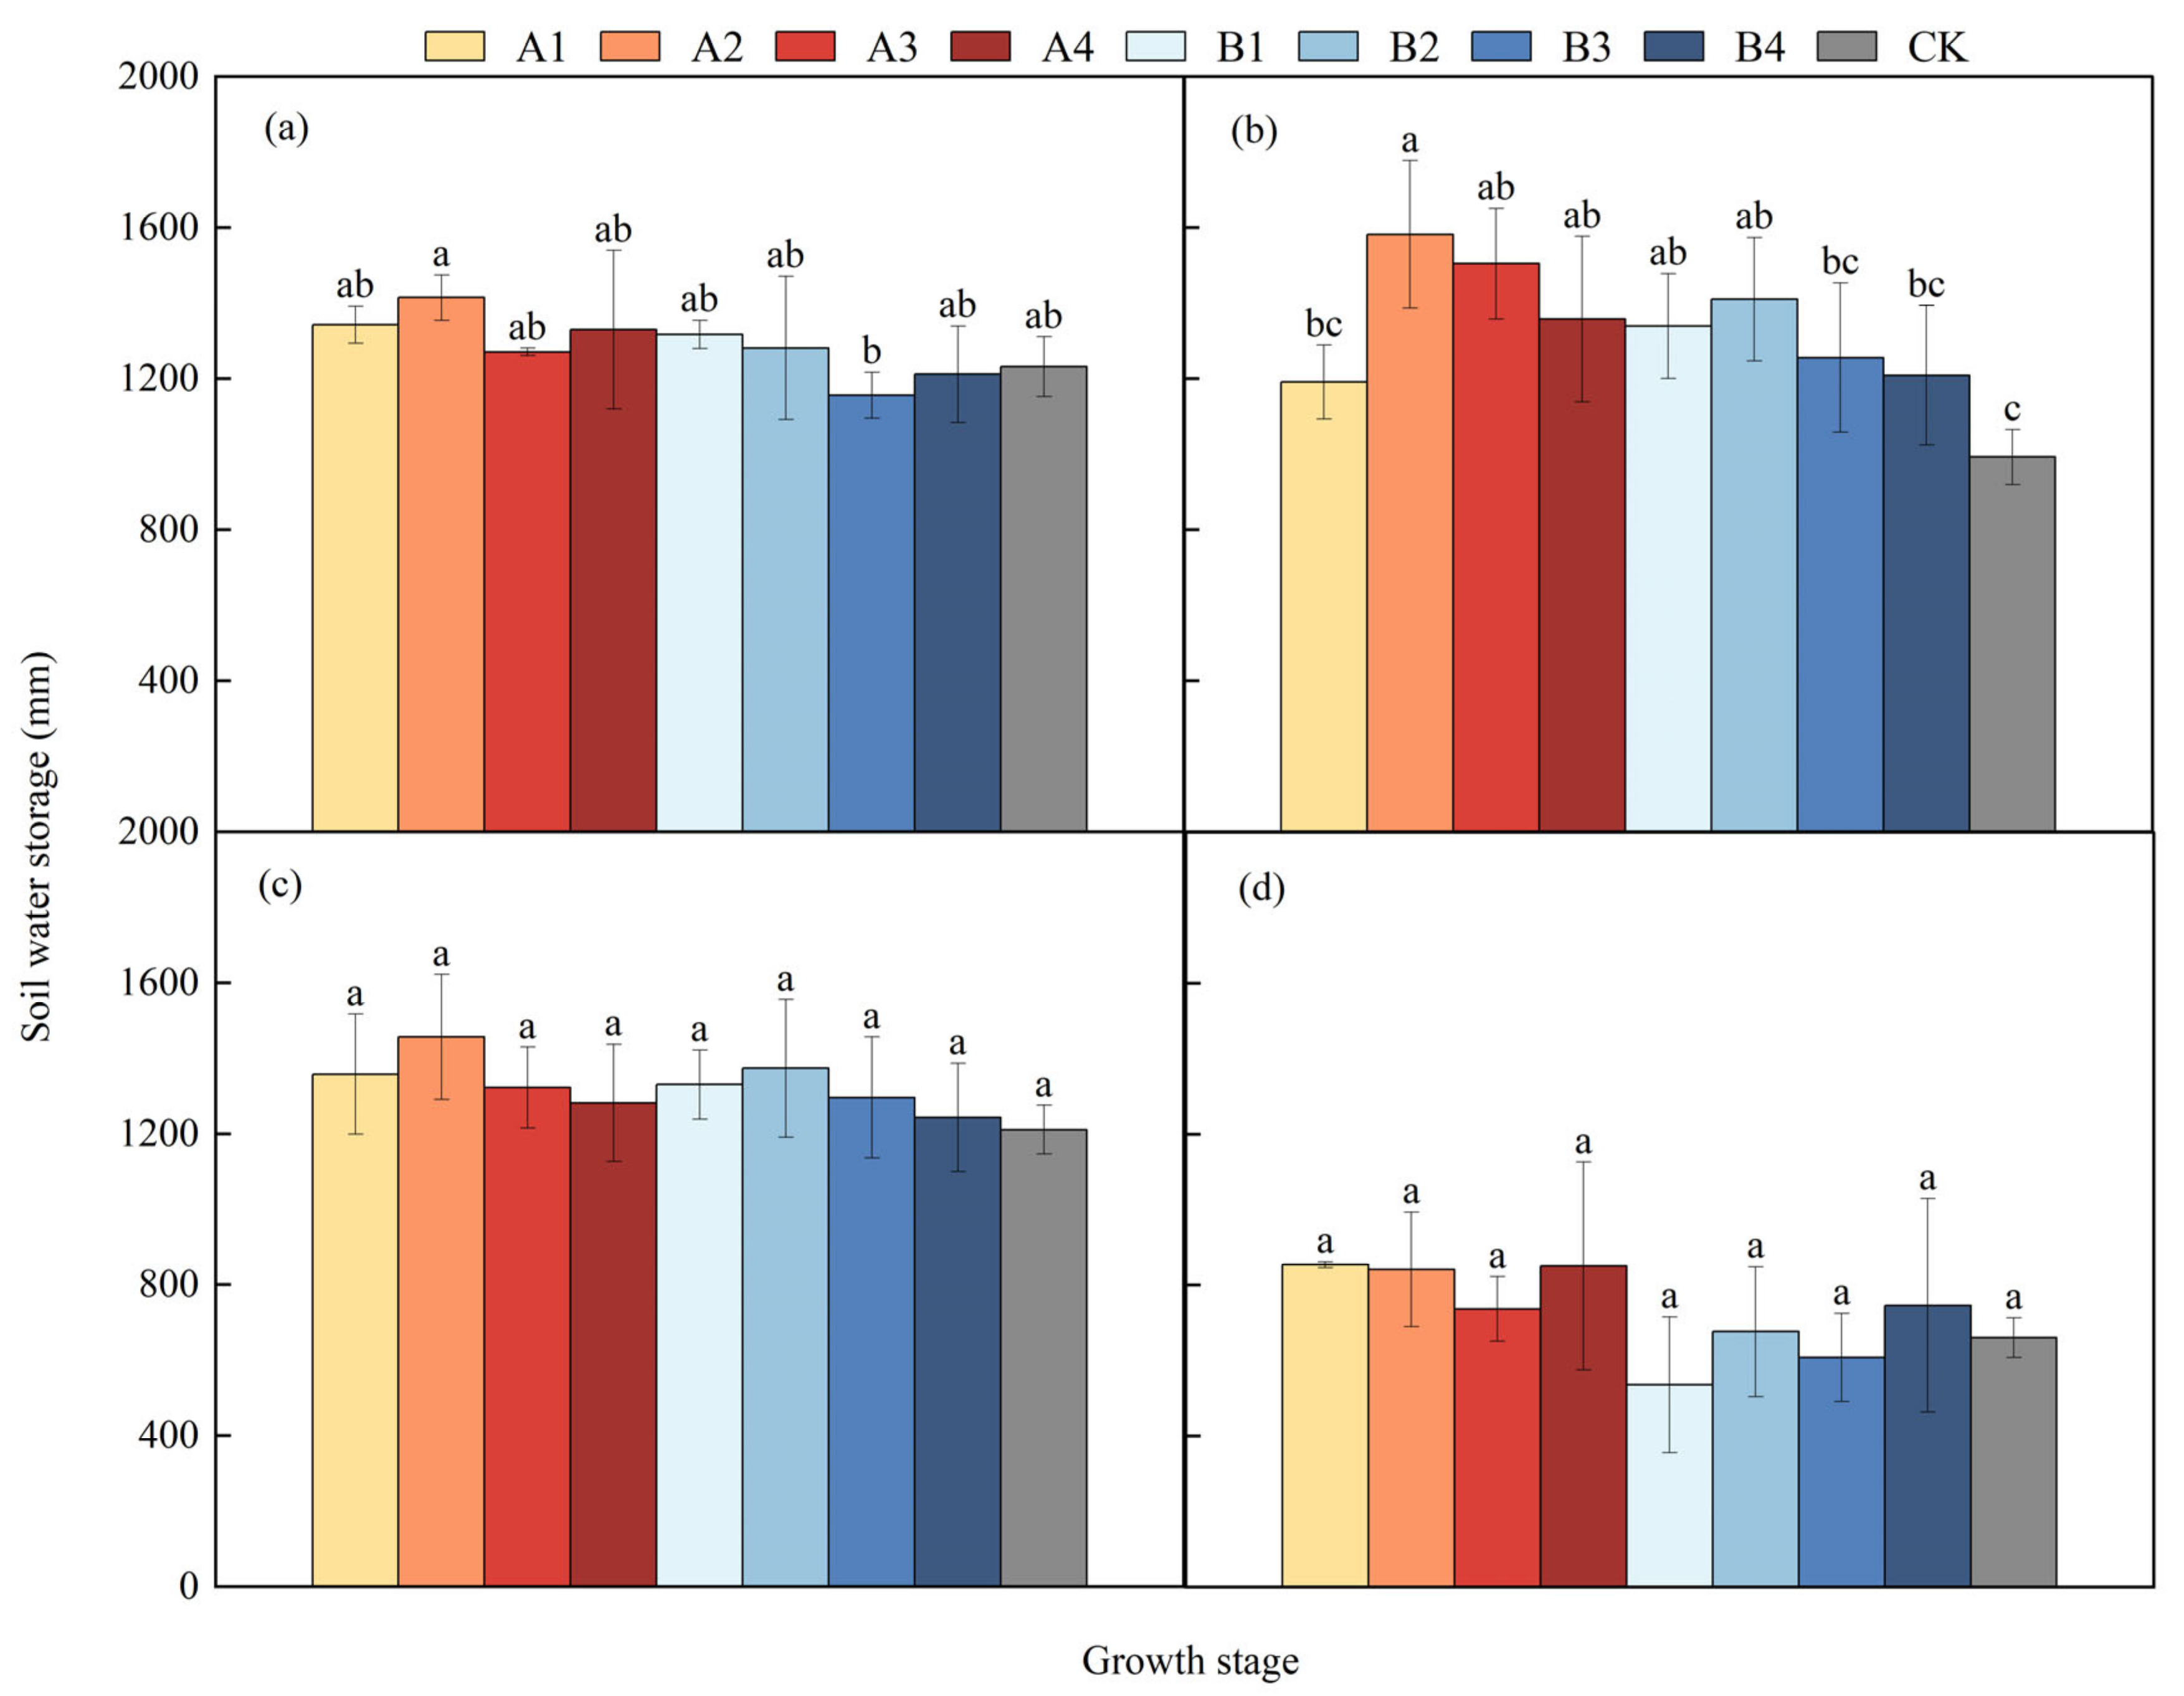
The SWS in 0–60 cm depth at the cotton growth period is shown in Figure 3. Generally, the SWS of biochar application treatment in each growth period was higher than that of CK treatment. The SWS of the A2 treatment was relatively higher in each treatment, which was 14.88%, 59.5%, 20.27%, and 27.3% higher than that of the CK treatment in the four growth stages of cotton. At the seedling stage, the SWS of the treatments with biochar application after freezing was 1.91%, 10.41%, 9.90%, and 9.71% higher than that of the corresponding treatments with biochar application before freezing under the same biochar application amount. With the increase in biochar application rate, the SWS showed a trend of increasing first and then decreasing. The treatments with different biochar application times reached the maximum when the biochar application rate was 0.66% of the soil mass fraction. At the bud stage, with the progress of irrigation, the difference in the SWS among the biochar application treatments under the same amount of biochar application was further expanded, which also reflected the difference in the SWS capacity of each treatment. At the flower-bolling stage, the water storage of the A2 treatment was higher than other treatments, 20.27% higher than that of the CK treatment. This phenomenon showed that the SWS of A2 treatment was better after biochar application, but the difference in the SWS among all treatments wasn’t insignificant (p < 0.05). At the end of the boll-opening period, there was no significant difference in the SWS among the treatments due to the stop of irrigation (p < 0.05).
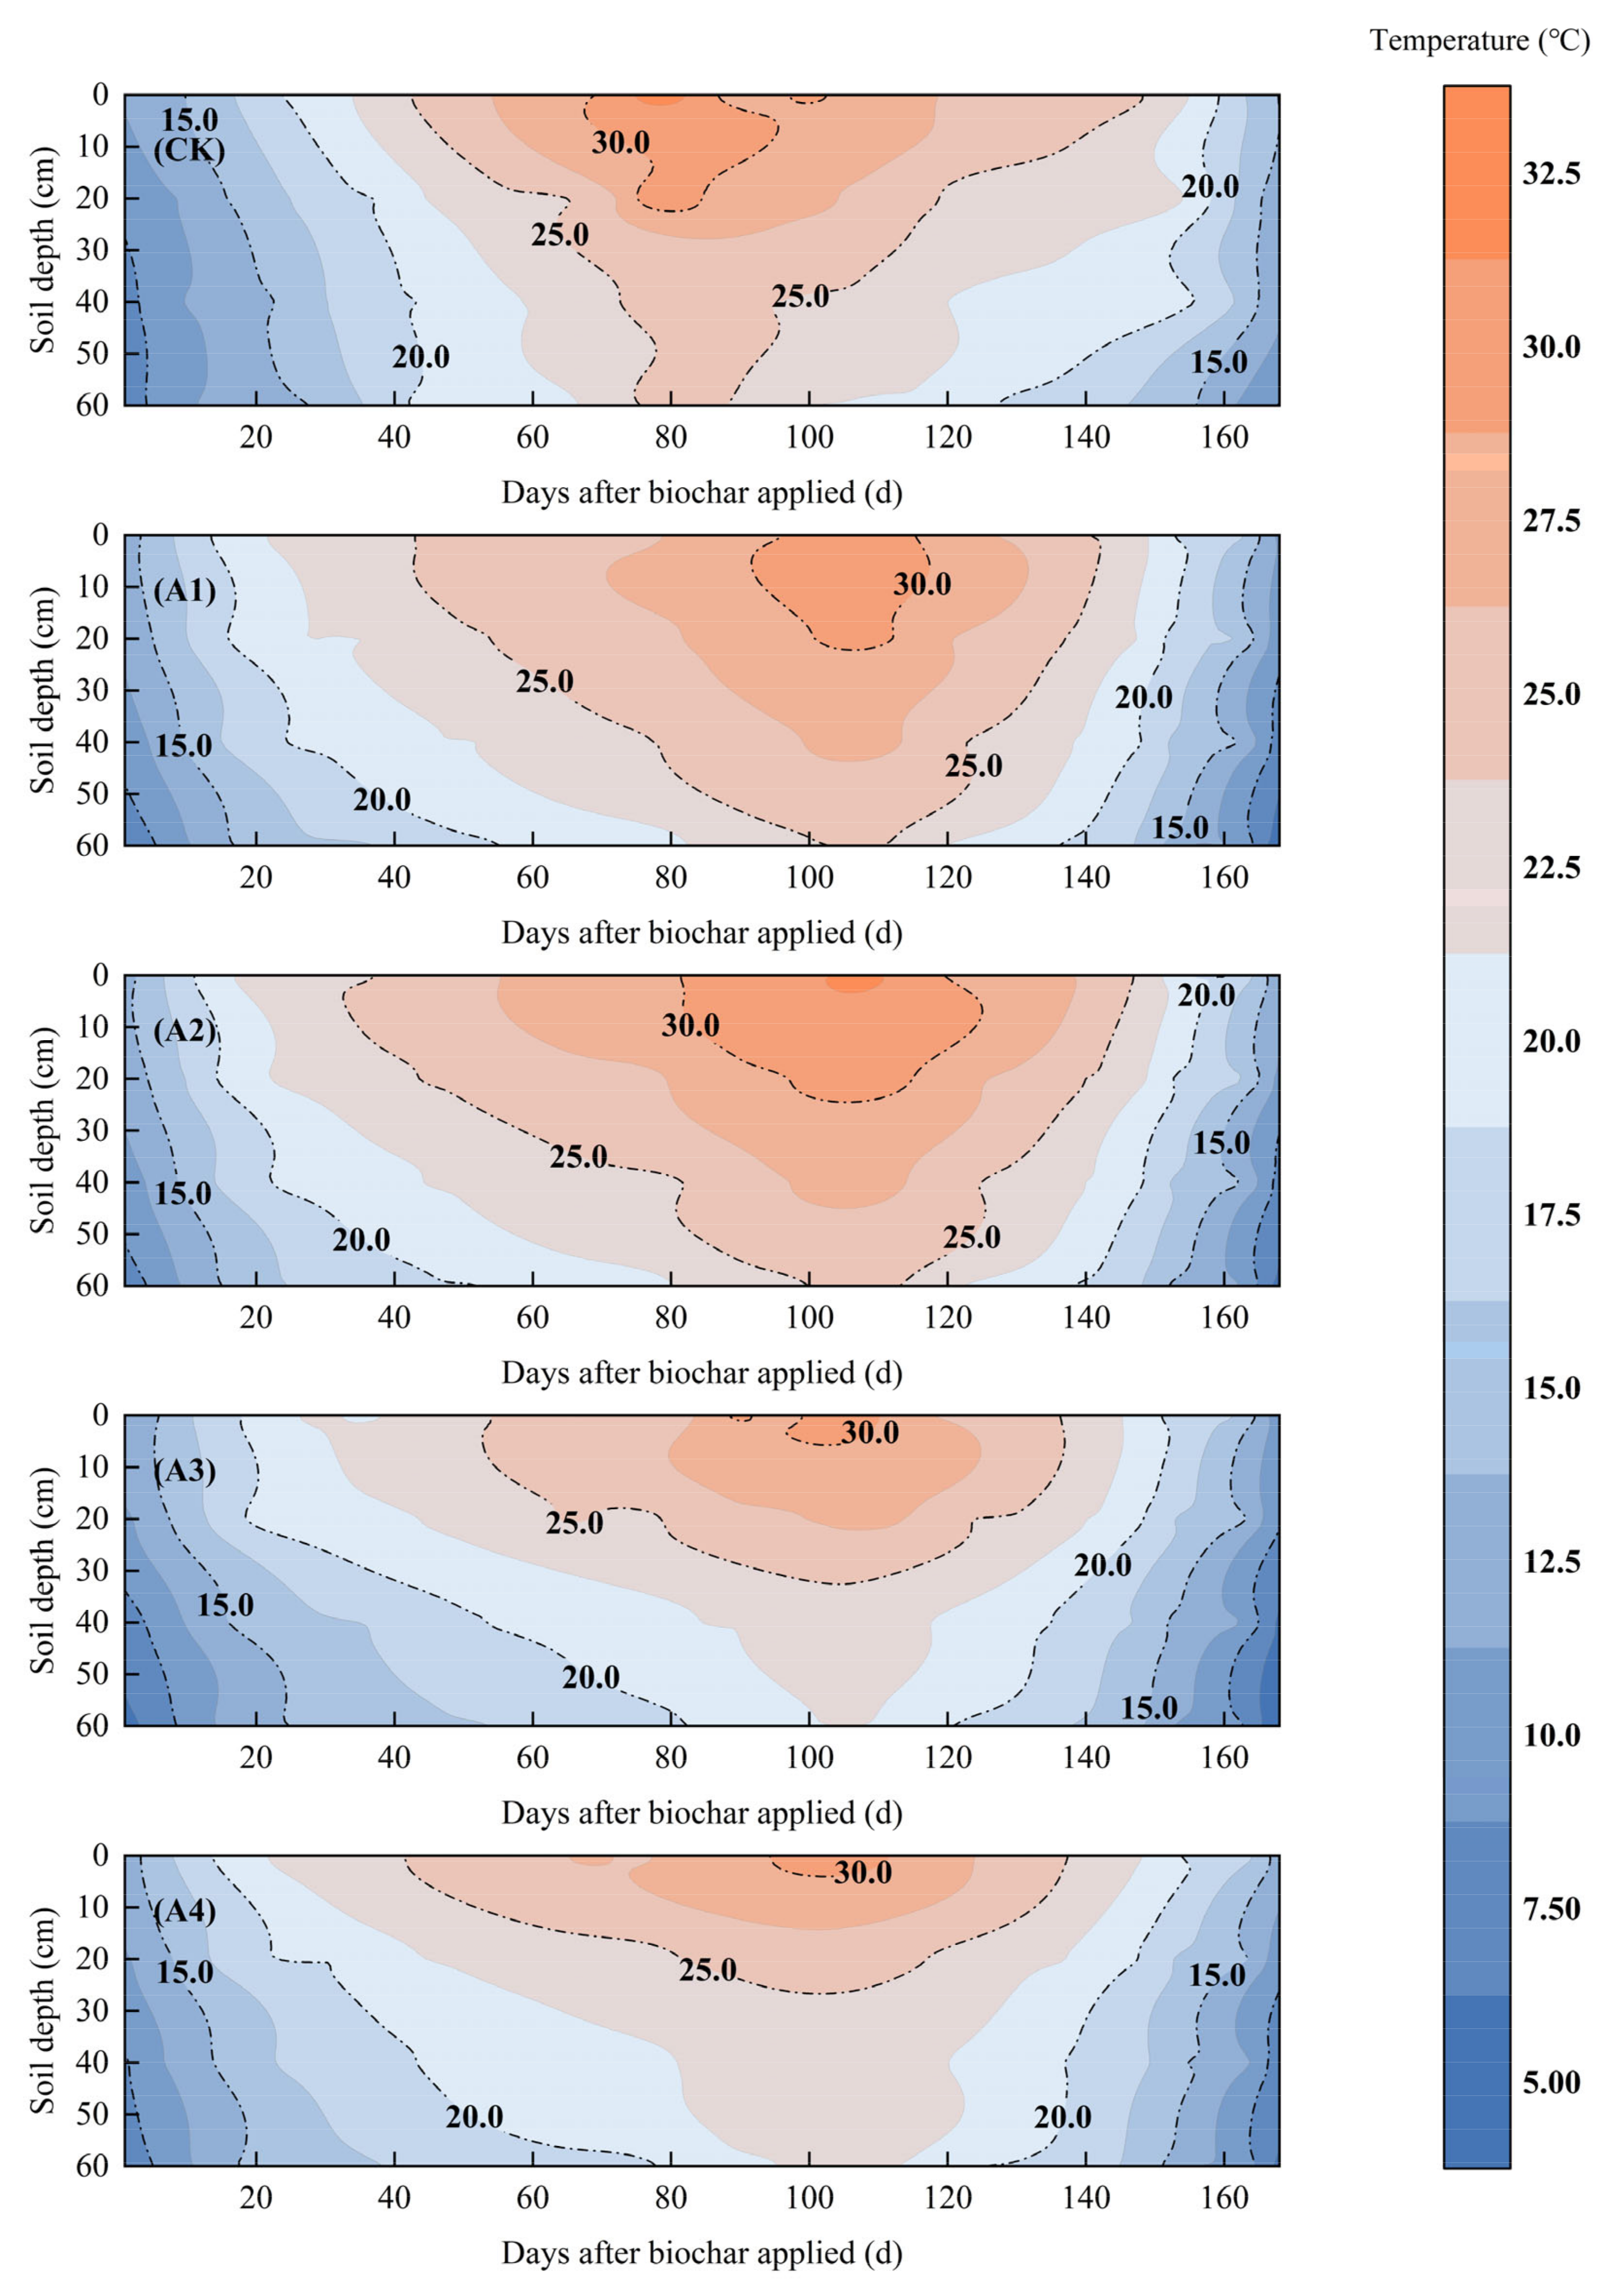
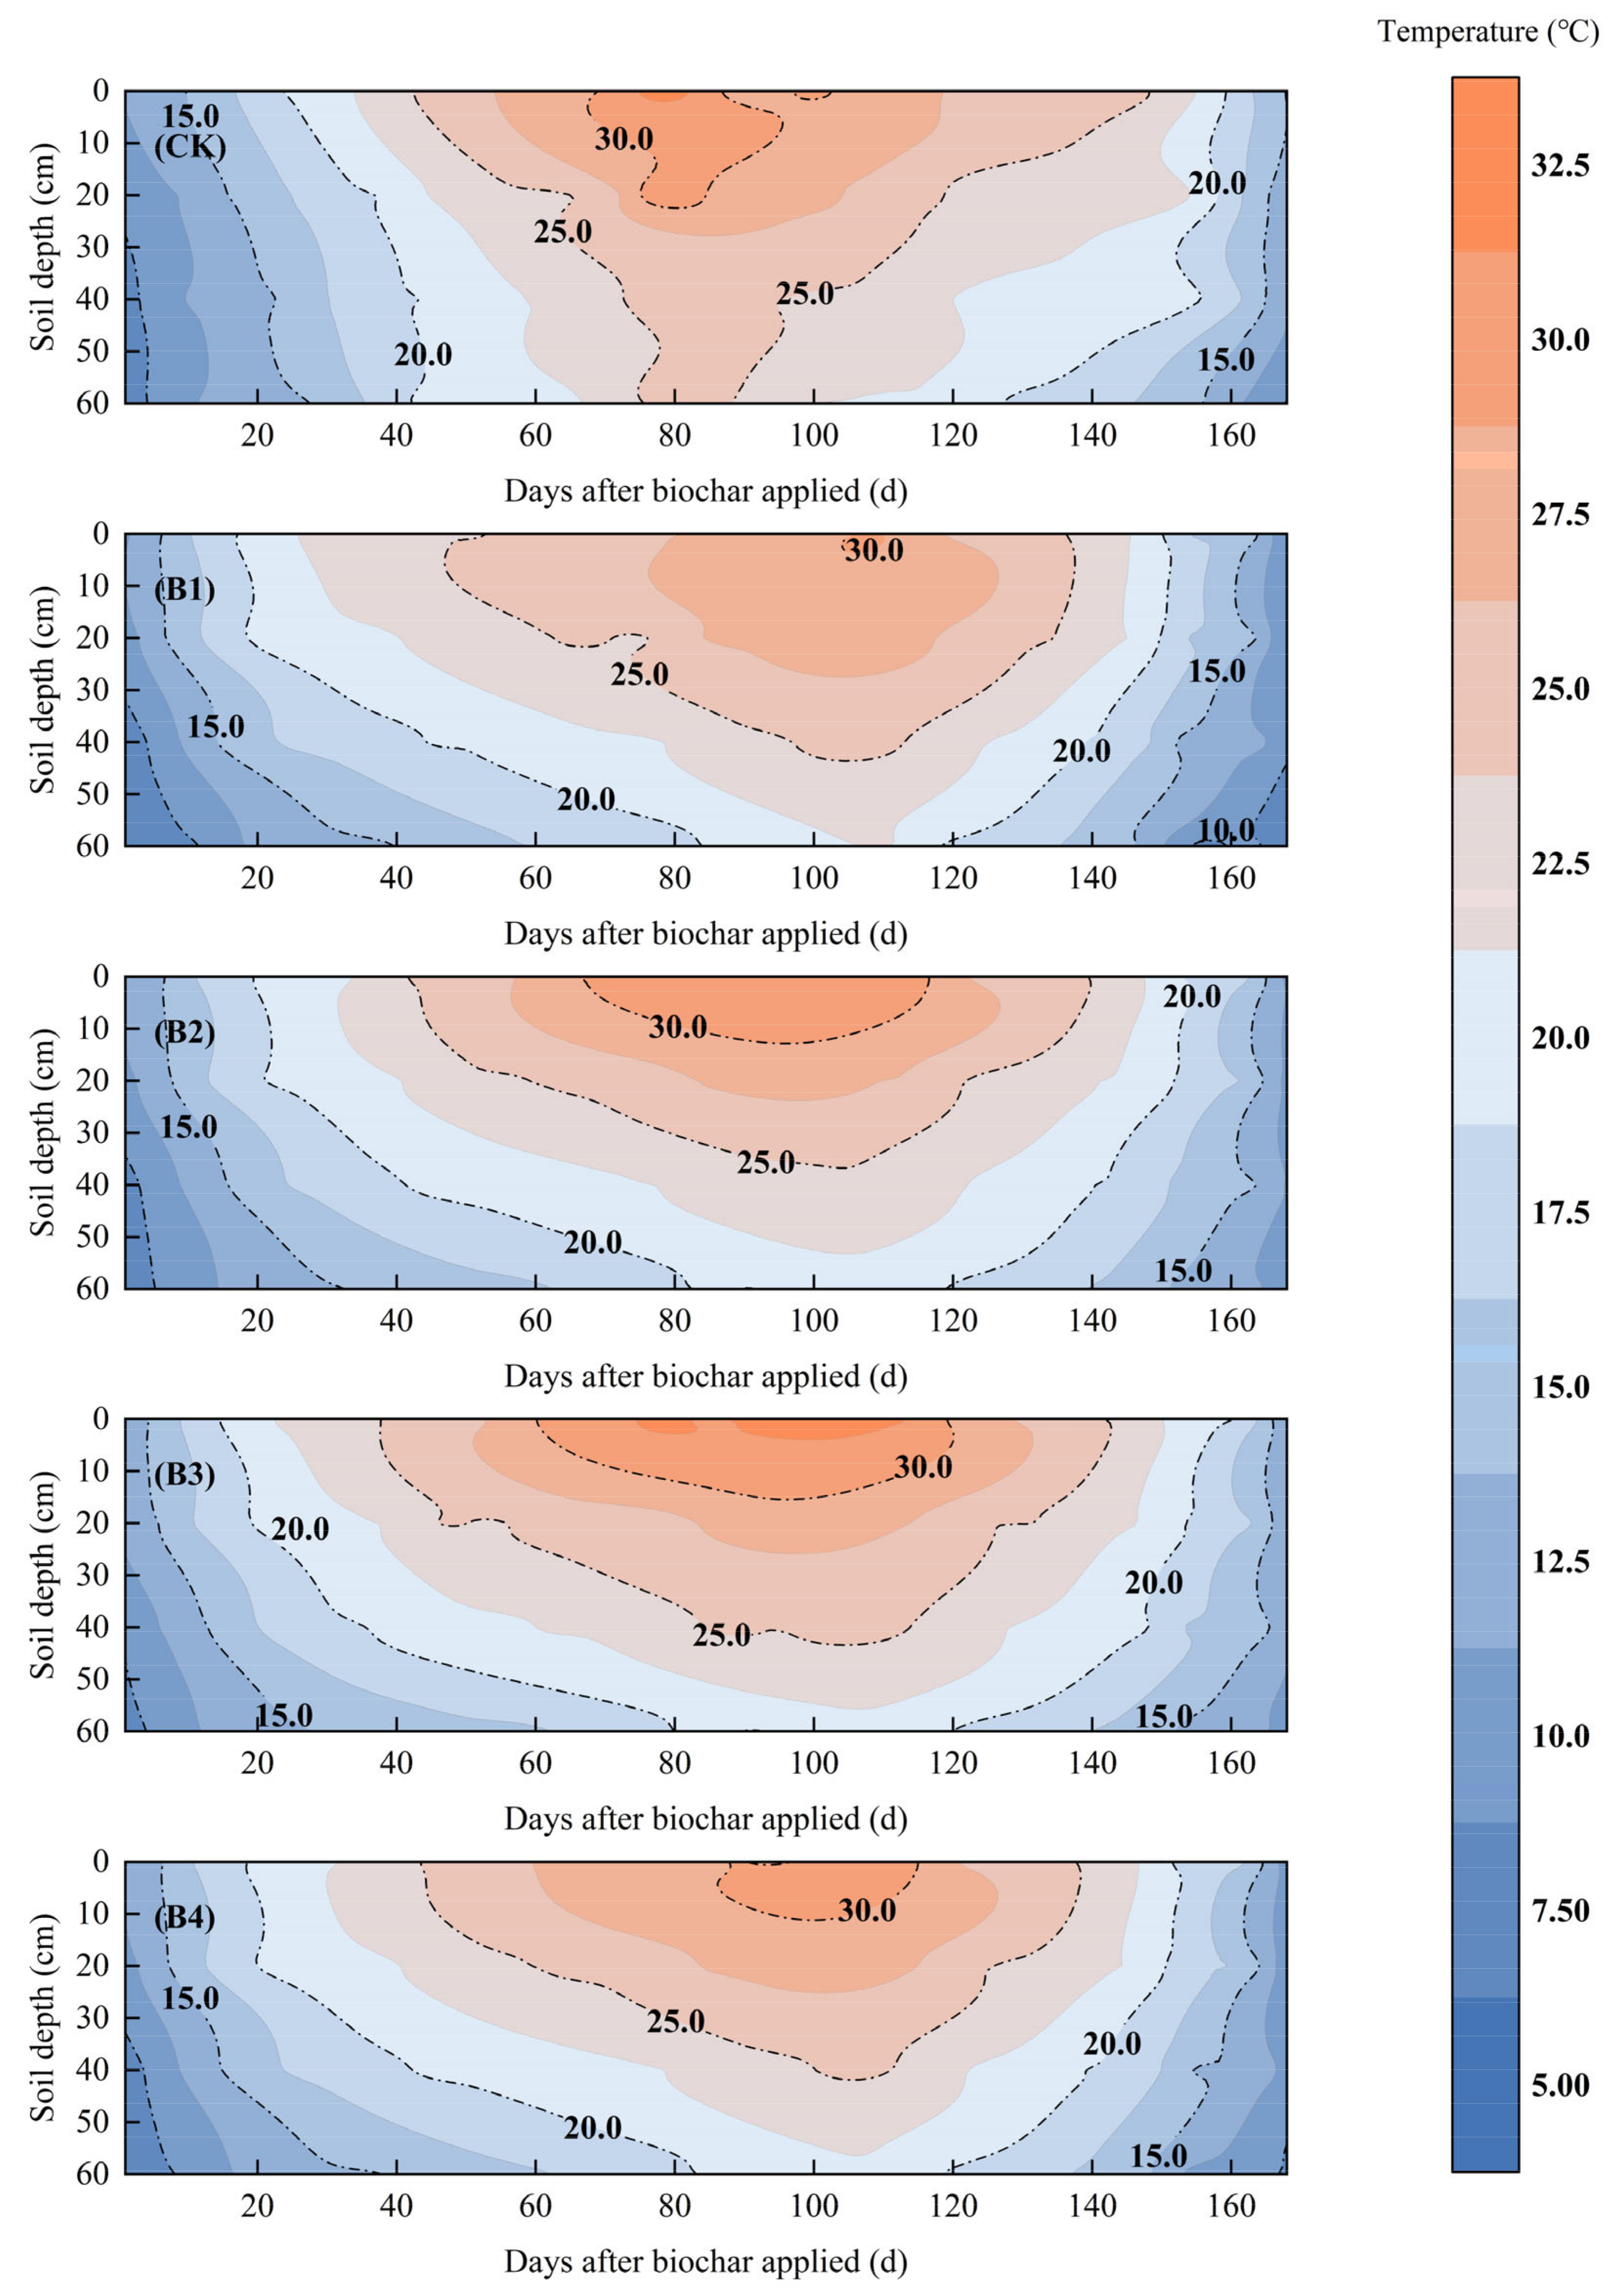
Figure 4 and Figure 5 shows the soil temperature during the growth period of cotton plants in 0–60 cm soil layers of cotton fields. In the CK treatment, the temperature contour gradually changed from dense to sparse. It then became dense again over time, indicating that the change rate of soil temperature during the growth period showed a trend of decreasing first and then increasing. The temperature increased gradually after sowing and reached the maximum value of 34.34 °C 79 DAP. Then the surface temperature gradually decreases with the decrease in ambient temperature. At the end of the crop growth period, the surface soil is rapidly reduced under environmental temperature. The soil temperature decreases layer by layer with the increase in soil depth.
Compared with CK, biochar application increased the surface temperature in treatments A. In the figure, the soil temperature isolines of each treatment become more sparse in 0~60 DAP compared with CK, indicating that biochar slows down the change rate of soil temperature. The density of soil temperature isolines in different biochar treatments was similar, and the soil temperature change rates in this stage were 0.21, 0.23, 0.16, and 0.21 °C per day, which were lower than 0.25 °C per day in CK. The soil surface temperature reached the maximum value in 60~120 days, which was 32.00 °C, 33.25 °C, 31.98 °C, and 32.20 °C respectively. Compared with CK, the maximum soil surface temperature decreased by 1.09~2.34 °C, which reflected the hysteresis effect of biochar application on temperature rise. The soil temperature gradually began to decline in 120~168 DAP, and the temperature changed quickly at first and then slowly with the increase of biochar application.
In the vertical direction of treatments A, the soil temperature of each treatment decreased with the increase in depth. In A3 and A4, the effect of soil temperature increase below 40 cm is worse than that in A1 and A2. With the increase of depth, the change rate of soil temperature gradually decreased, showing a similar trend in each treatment.
In treatments B, biochar application also brought a significant warming effect. The soil temperature isolines of each treatment became sparser compared with CK in 0~60 DAP, and the density was similar to treatments A’s. In this stage, the soil temperature change rates were 0.23, 0.27, 0.32, and 0.26 °C per day, which were higher than CK except for B1. In 60~120 days, the soil surface temperature reached the maximum value, which was 31.38 °C, 33.05 °C, 34.50 °C, and 31.93 °C respectively. Compared with CK, the maximum change of soil surface temperature was −2.96~0.16 °C. Apart from B3, biochar application showed a hysteresis effect on temperature rise. In 120–168 DAP, the soil temperature gradually began to decline, and the density of the temperature contour changed little with the increase in biochar application. After a freeze-thaw period, treatment B’s degree of biochar soil combination is deeper than treatments A’s, showing a similar trend of temperature contour in the figure. The change in biochar application only affected the soil temperature but did not significantly change the trend of soil temperature.
In the vertical direction, the soil temperature of each treatment decreased with the increase in depth. Treatments B experienced two times of tillage before and after freeze-thaw, and the biochar soil mixture and distribution were more uniform. This mixture led to the best warming effect of treatment B’s soil temperature under film mulching, slightly better than treatments A’s, although it required more biochar.

3.2. Effects of Biochar Application before and after Freeze-Thaw on Cotton LAI, Cotton Plant Biomass and Seed Cotton Yield

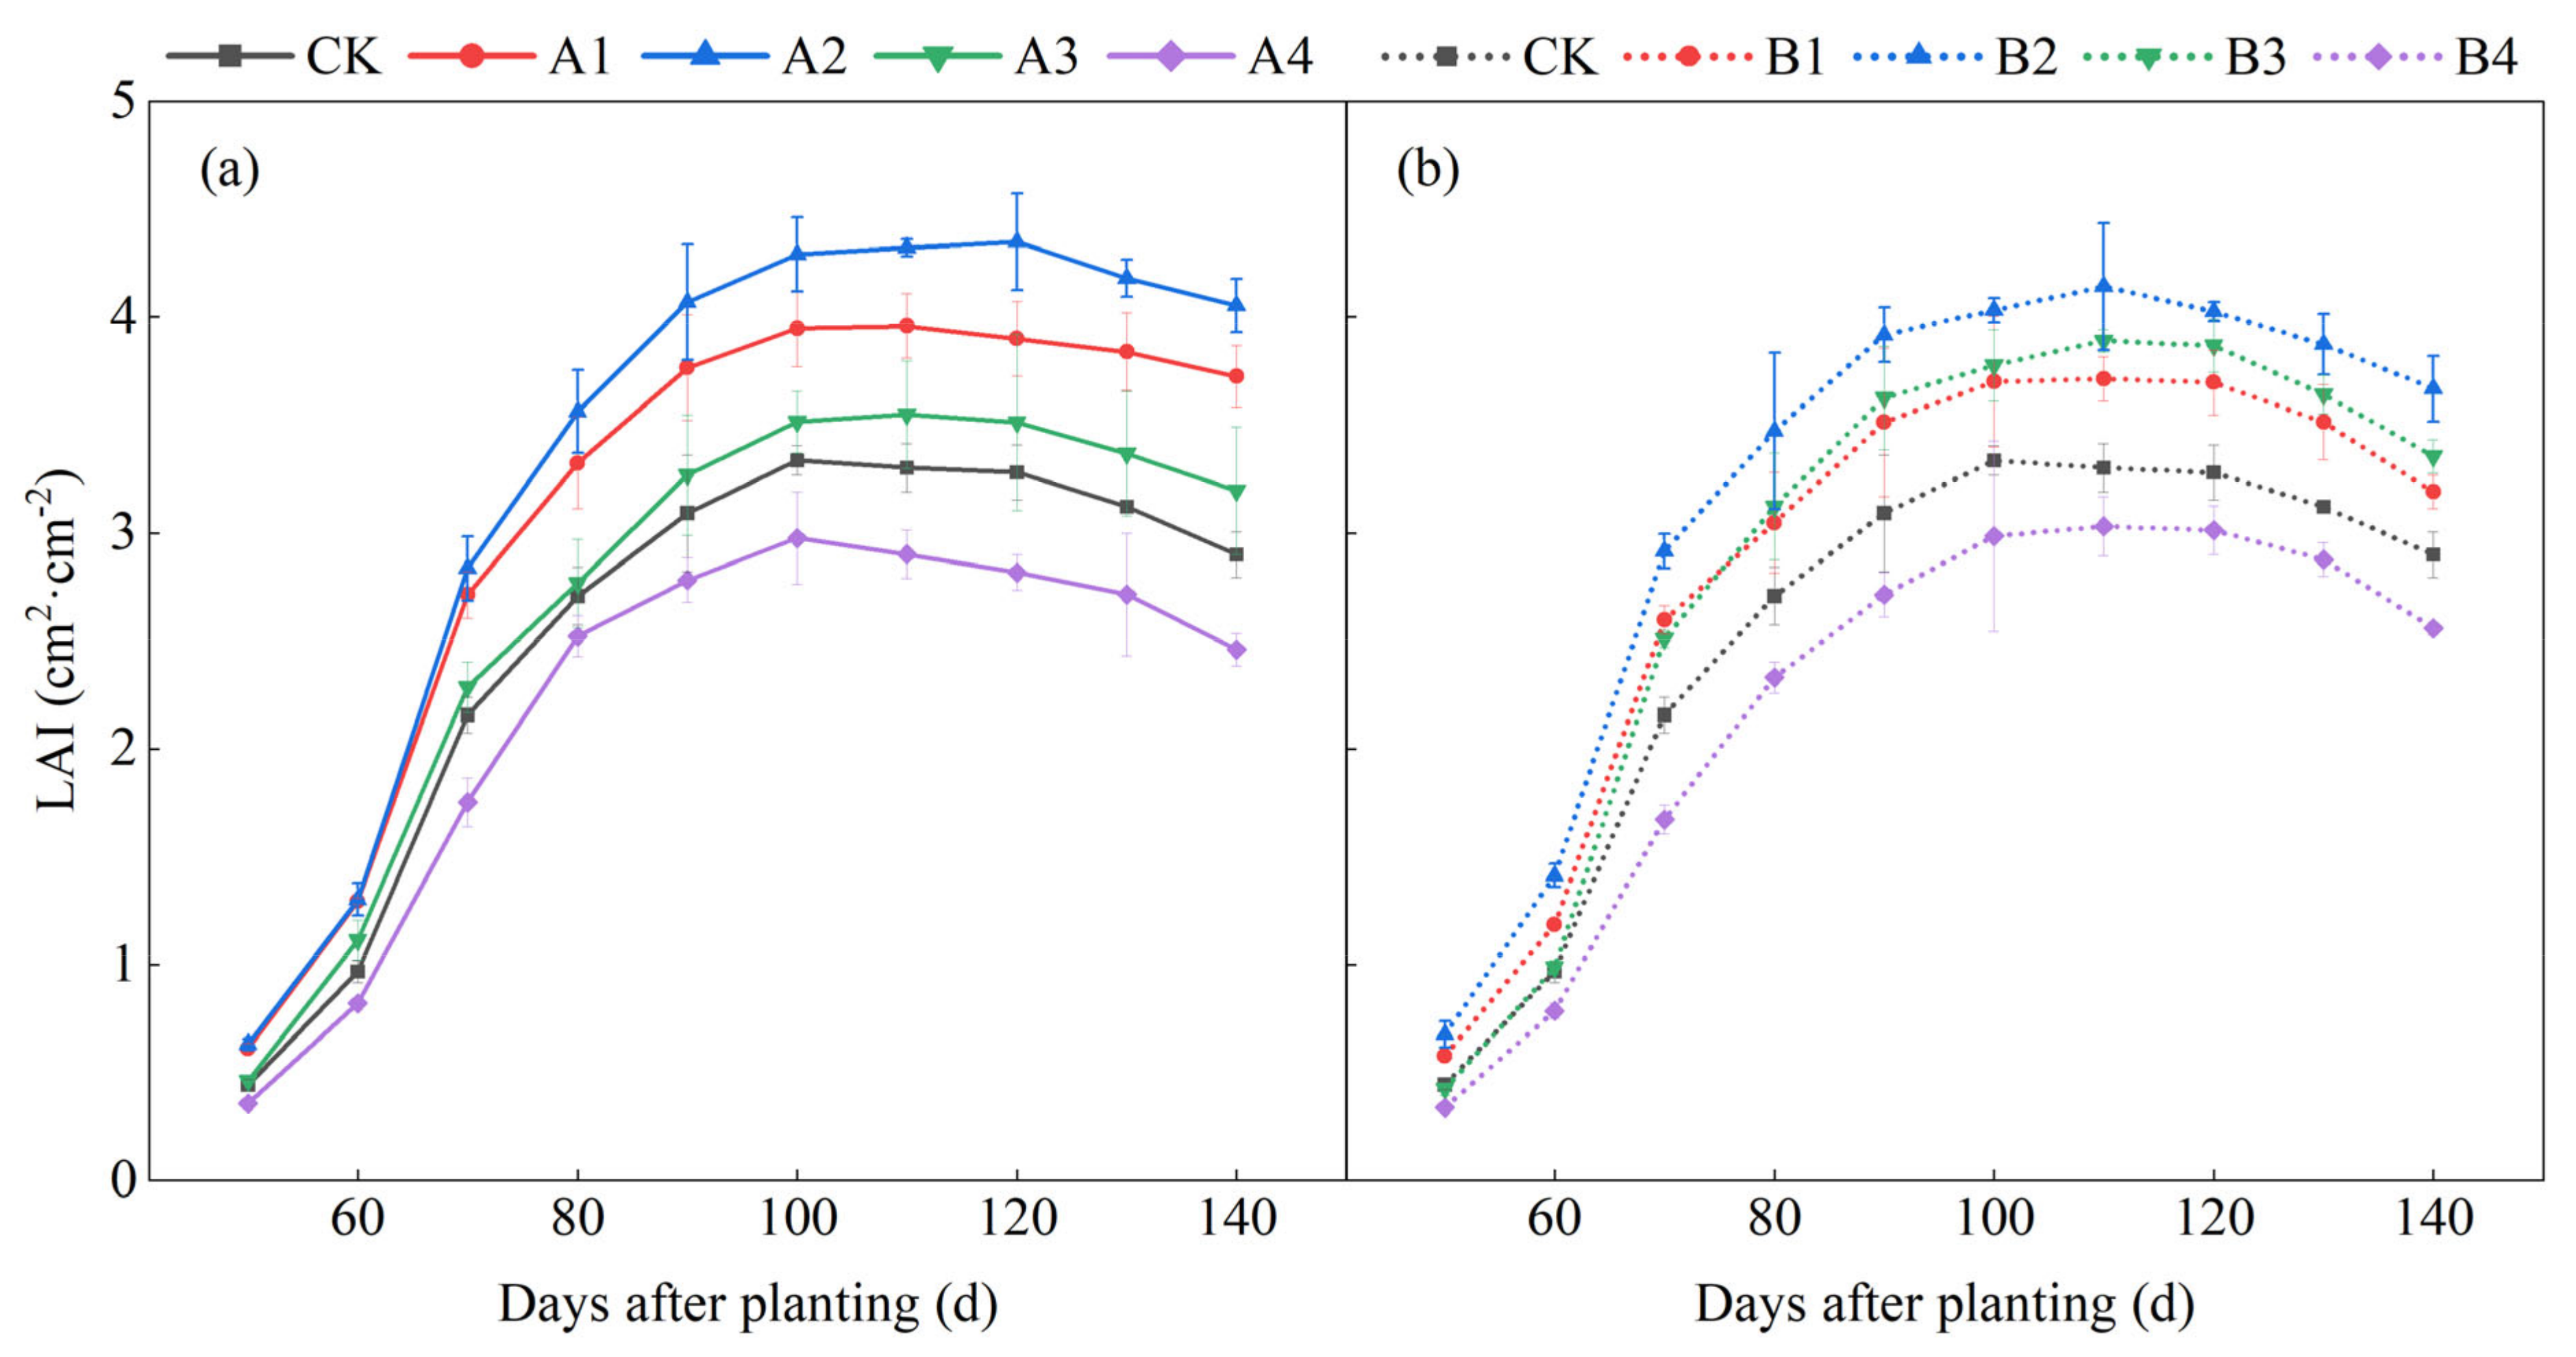
The cotton leaf area index (LAI) in each treatment was shown in Figure 6. Generally, the LAI trends in all treatments were similar. The LAI increased and then decreased during the cotton growth period. The gap between all treatments became significant from 70 days after planting (DAP), but the gap in treatments A was more significant. In treatments A, the LAI in A2, A1, and A3 were successively higher than CK, but the LAI in A4 was lower than CK. The LAI in A2 reached the maximum 120 DAP and was 32.52% higher than CK. The maximum LAI in A4 was 10.82% lower than CK 100 DAP. In B treatments, the LAI in B2, B3, and B1 were successively higher than CK, but the LAI in B4 was lower than CK. The LAI in B2 reached the maximum 110 DAP and was 25.44% higher than CK. The maximum LAI in B4 was 8.21% lower than CK 110 DAP. The tendency showed a conspicuous improvement of biochar to the LAI of cotton plants, but excessive biochar also influenced the LAI. Applying biochar after freeze-thaw with 0.66% of soil mass fraction had the most significant effect on improving the LAI.
The dry matter accumulation and seed cotton yield in each treatment are shown in Table 4.
The cotton biomass dry weight and seed cotton yield were shown in Table 4, different letters in the same column indicate significant differences between different treatments (p < 0.05). In general, cotton dry matter accumulation and seed cotton yield were higher in the treatment with biochar applied than in the treatment without biochar. The increase in dry matter accumulation and seed cotton yield in treatments A was higher than in the B treatments. For the cotton root, the highest amount of dry matter was accumulated in the A2 treatments Among the treatments with biochar application after freeze-thaw, which was 60.13% more than that in the CK treatment. The most significant amount of dry matter was accumulated in the B2 treatments Among B treatments, which was 38.73% more than in the CK treatment. For the cotton stem, the dry matter weight of the A1 treatment reached the maximum among treatments A, which was 44.50% higher than that of the CK treatment. The dry matter accumulation of cotton stem in B2 was the largest among B treatments, which was 34.98% more than that of CK. For the dry matter accumulation of cotton leaves and cotton bolls, there was no significant difference among the treatments in p < 0.05. The maximum value reached in A2 treatments Among A treatments was 41.44% and 19.40% higher than CK treatment, respectively. The maximum value reached in B1 treatments Among B treatments was 25.25% and 14.19% higher than in CK treatment, respectively. The seed cotton yield of each biochar applied treatment was higher than that of CK treatment. The seed cotton yield in post-freeze-thaw biochar application treatments was higher than in the pre-freeze-thaw biochar application treatments. The seed cotton yield in the A2 treatment reached the highest value among all treatments, and it was 21.95% higher than the seed cotton yield in the CK treatment. When the biochar application was higher than 0.66% of soil mass fraction, the dry matter accumulation and seed cotton yield were reduced. The opposite condition indicated the inhibitory effect of excessive biochar application on cotton growth by changing soil hydrothermal conditions. The higher dry matter accumulation and seed cotton yield in the post-freeze-thaw biochar application compared to the biochar application before freeze-thaw indicated that the biochar application after freeze-thaw provided a better soil environment for crop growth and increased the seed cotton yield as well.

3.3. Comprehensive Evaluation of the Quality of Cotton Fiber Traits

The cotton fiber quality traits were shown in Table 5, different letters in the same column indicate significant differences between different treatments (p < 0.05). As shown in Table 5, each biochar applied treatment’s fiber length and elongation were higher than the CK’s. The fiber length and elongation of A treatments were higher than those of B treatments at the same biochar application amount. In treatments A, cotton fiber length and elongation showed a trend of increasing and then decreasing with the increase of biochar application. The fiber length and elongation reached the maximum in the A3 treatment, which was 13.18% and 18.52% higher than those in the CK treatment, respectively. In B treatments, there was no apparent trend of change in cotton fiber length and elongation with the increase of biochar application. The fiber length and elongation achieved the maximum value in B1 and B3 treatments, which were 9.27% and 12.96% higher than in the CK treatment.
There was no significant difference between the specific strengths of the treatments at the p < 0.05 level. The specific strength of all biochar-applied treatments was higher than that of CK treatment, and the specific strength of A treatments with biochar applied after freeze-thaw was higher than B treatments with biochar applied before freeze-thaw except for the level of 1.33%. In treatments A, the fiber-specific strength showed a trend of increasing and then decreasing with the increase of biochar application and achieved the maximum value in treatments A2, which was 10.96% higher than that in treatment CK. In the treatments with biochar application before freeze-thaw, the fiber-specific strength increased continuously with the increase of biochar application. It achieved the maximum value in treatment B4, which was 5.32% higher than in treatment CK.
The reflectivity of each treatment was not significantly different at p < 0.05. The fiber reflectivity of all biochar-applied treatments was higher than that of the CK treatment. When the amount of biochar applied exceeded 0.66% of soil mass fraction, the fiber reflectivity of B treatments was higher than that of A treatments. When the amount of biochar application was not higher than 0.66% of soil mass fraction, the fiber reflectivity of B treatments was higher than that of A treatments. Among the treatments at the same biochar application time, the fiber reflectivity showed a trend of increasing and then decreasing with the increase of biochar application amount and reached a maximum value at a biochar application rate of 1.00% of soil mass fraction, which was 2.25% and 3.25% higher than the CK treatment, respectively. As for the micronaire value, the cotton fiber of the A2 treatment reached grade A, the quality of the CK treatment reached grade C, and the rest were in grade B.
We selected five cotton fiber quality traits for principal component analysis to evaluate the effect of different amounts of biochar on cotton quality in drip irrigation cotton fields before and after freeze-thaw. The fiber length (X1) represents the length of the cotton fiber, and the reflectivity (X2) shows the smoothness of the appearance of the cotton fiber. Before analysis, the micronaire value was corrected by the linear interpolation method according to the quality level, and the cotton fiber grade was reflected by the corrected value (X3). We defined the correction value as 1 when the grade is C, the correction value as 2 when the grade is a, and between 1 and 2 when the grade is B. Elongation (X4) refers to the elongation of cotton fiber. Specific strength (X5) refers to the tensile strength of the cotton fiber.
4. Discussion

4.1. Effect of Biochar Applied before and after Freeze-Thaw to Soil Hydrothermal Conditions

The SWS of the biochar-applied treatment was mostly higher than that of the CK treatment, which was also revealed by [30]. The effect of biochar application on the SWS was evident from the seedling stage due to the water storage capacity of biochar reducing water evaporation under the influence of high temperatures and prolonged sunlight. The SWS decreased to a lower level after irrigation ceased at the boll-opening stage. When the soil dried, water remaining in the pores inside the biochar transferred into the soil, which helped to retain soil moisture for extended periods [31]. Comparatively speaking, soils without biochar additions had lower water permeability than soils with biochar additions, suggesting that biochar affected the SWS [32]. Compared to the treatment with biochar applied before freeze-thaw, the A treatments avoided the aging effects of seasonal freeze-thaw processes and melting snow infiltration on biochar. Its structure was not damaged and had a substantial storage capacity for soil moisture. Therefore, the SWS of A treatments was higher than that of B treatments for the same amount of biochar application. Applying biochar significantly reduces soil bulk density and increases soil porosity [33]. However, excessive biochar in the soil occupies large soil pores and hinders soil water migration to some extent. The treatments in this study that applied more than 0.66% of soil mass fraction showed a decrease in the SWS, reflecting that excessive biochar will weaken the SWS.
In mulched drip irrigation, the properties of biochar may change, and the hysteresis effect on temperature change is no longer apparent. However, this hysteresis effect is still evident in high biochar application rate treatment. Under drip irrigation under mulch, cotton roots were mainly distributed in the 0–60 cm soil layer. Higher temperatures promoted the development of cotton roots in the deep soil below 40 cm and the absorption of water by cotton. By comparing the two groups of treatments A and B, the freeze-thaw cycle, on the one hand, promoted the combination of biochar and soil, reduced the impact of irrigation on the biochar, and led to a similar warming effect with the increase of biochar application. On the other hand, biochar is also consumed in the freeze-thaw process, resulting in more biochar required for pre-freeze-thaw biochar application for the same heat preservation effect. In addition, the impact of mulched drip irrigation on the biochar soil structure of treatments A is more evident than that of treatment B, which is reflected in the changing trend of temperature contour with time under different biochar application rates. In treatments A, the temperature change trend in the heating stage was slower than in the cooling stage, showing the opposite trend with CK, which also showed that the film-covered drip irrigation measures affected the properties of biochar. In treatment B, there was little difference in the temperature rise and fall trend, indicating that the biochar after freeze-thaw was less affected by film mulching drip irrigation.
Biochar is a black material and is mostly used in soil amelioration. Biochar can deepen the soil color after mixing with the soil and increase the soil temperature by absorbing more solar radiation. In our study, the warming effect of biochar was mainly on the soil surface, while the warming effect in deep soil was not significant. Applying biochar can significantly reduce soil’s thermal conductivity and thermal diffusivity [34], slowing the heat transfer to the lower layer of soil, which makes the temperature change rate of the biochar-soil mixture slower than that of soil. This retardation was similar to the research results of Zhang et al. [35]. In addition, 60 to 120 days after sowing, the change rate of soil temperature is slower than at the beginning and end of the growth period. This weakening is because the growth of cotton canopy weakens the solar radiation and reduces the change rate of soil temperature. Higher temperatures promoted the cotton root system’s development and water absorption in the deep soil below 40 cm [36]. By comparing treatments A and B, freeze-thaw promoted the combination of biochar and soil [15], reduced irrigation’s impact on the surface structure of biochar, and led to a similar warming effect with the increase in biochar consumption. Biochar is also consumed in the freeze-thaw process [37], resulting in more biochar needed for treatments B for the same heat preservation effect. In addition, the effect of drip irrigation under film on carbon soil of treatments A was more evident than in treatment B’s, which was reflected in the changing trend of temperature contour with time under different biochar application rates. In treatments A, the temperature change trend in the heating stage is slower than in the cooling stage, showing a reverse trend to that in the opposite direction, which also indicates that the drip irrigation measures with film mulch affect the performance of biochar. The process of irrigation brings about a dry-wet alternate environment to the soil. At the same time, mulching keeps the humidity of the soil under the film. This environment makes the biochar age, change its form and reduce its stability, which is reflected in Cao’s research [38].

4.2. Effects of Biochar Applied to Cotton Biomass, LAI and Seed Cotton Yield

Biochar reduced soil bulk density and increased soil porosity [39], which enhanced root growth and thus increased root weight [40]. However, excessive biochar application could affect the hydraulic properties of the soil [41], which in turn affects water uptake in cotton. Biochar application could also affect growth in the early stages of cotton growth due to higher temperatures [42], leading to a decrease in dry matter accumulation in all organs of the cotton plant. In B treatments, biochar reduced the impact of soil damage from freezing, effectively promoted soil thawing, and reduced freeze-thaw-induced soil deformation. Still, the excessive application of biochar had adverse effects [18]. In addition, the structure of biochar was broken during the seasonal freeze-thaw process [43]. Compared to the biochar application treatments After freezing, the nitrate-nitrogen content in the soil treated with biochar application before freezing decreased [44], and the porous structure of biochar changed [45], indirectly affecting the physical and chemical properties of biochar. Moreover, biochar application could improve the water holding capacity and reduce water migration from the soil during freeze-thaw [38] when the amount of biochar applied exceeded 60 t/ha (converted, 60 t/ha is about 0.66% of the soil mass fraction in this study). However, the three-phase equilibrium in the soil was affected, disrupting the soil structure [16]. Then inhibited cotton growth and decreased the dry matter accumulation of cotton plants.
Water stress is an essential factor in inhibiting cotton growth. Soil water shortage will reduce cotton leaf area [46]. In our study, soil water storage capacity increased after biochar was applied, and the effect was more significant in the budding and flower-bolling stages. When the amount of biochar application reached 0.66%, the soil water storage reached the maximum value. Corresponding to the maximum soil water storage, the leaf area index of A2 and B2 treatments was higher than that of other treatments. When the amount of biochar applied reached 1.33%, the excessive permeability of soil would lead to the decline of the water-holding capacity of biochar [47], which was not conducive to the growth of crops. This is similar to the research results of Li et al. [48]. In addition, the high biochar application amount led to the blockage of soil pores by small biochar particles, resulting in the imbalance of the soil’s three-phase ratio, which wrecked the soil structure [49]. In our study, the leaf area index of A4 and B4 treatments with 1.33% biochar application amount was lower than CK, which also showed that excessive biochar application in the soil had adverse effects on cotton growth. Compared with treatments A, the biochar of treatments B was affected by seasonal freeze-thaw, and its structure was damaged by freeze-thaw [45]. The water-holding capacity [16] and nutrient adsorption capacity [50] of biochar in treatments B decreased, thereby affecting the growth of cotton in treatment B. Therefore, the leaf area index of treatments B was slightly lower than treatments A’s under the same amount of biochar application in this study.
Biochar application increased the seed cotton yield of drip-irrigated cotton. The benefits of biochar application on suppression of soil ammonia volatilization and increased nitrogen uptake by cotton resulted in increasing cotton yield [51]. In our study, biochar application effectively increased soil hydrothermal accumulation and promoted cotton yield. Our results were similar to the study conducted by Shan et al. [52]. Biochar as a soil amendment could reform the soil and increase plant yield [53]. In addition, pyrolyzing cotton straw into biochar and applying it to cropland could increase and maintain seed cotton yield compared to other biomass reuse modes [22]. Biochar application increases yield and reduces the amount of fertilizer used. Wu et al. [54] showed that biochar could also reduce agro-environmental risks caused by chemical fertilizers. Several studies have also shown that biochar application in arid and semi-arid areas can improve ammonification as a viable strategy to reform soil conditions, thereby increasing nitrogen use efficiency and yields [55,56]. In our study, comparing two biochar applied timings, seed cotton yield was lower in B treatments than in treatments A. The difference in seed cotton yield happened because the aging of biochar after freeze-thaw might lead to the destruction of its structure. Tan et al. indicated that the specific surface area of biochar decreased, and the adsorption capacity decreased after freeze-thaw [50]. Yue et al. revealed that biochar was in the aging process, and the surface oxide layer increased with oxidation time [57]. Based on these factors, the seasonal freeze-thaw process in this study may lead to the destruction of biochar structure, thus weakening the beneficial effect of biochar on soil hydrothermal properties and indirectly reducing seed cotton yield. In addition, Fu et al. noted that excessive biochar application during freeze-thaw can affect the degradation of soil physicochemical properties [49]. In the present study, treatments with biochar application exceeding 0.66% of soil mass fraction would weaken its hydrothermal conditions, which could be responsible for the yield reduction.

4.3. Effects of Biochar Applied before and after Freeze-Thaw to Cotton Fiber Quality

Biochar application promoted the growth of cotton fibers. Qayyum et al. [58] stated that biochar application increased cotton fiber length by 4.32%, similar to our research. But the increase was insignificant because the amount of biochar applied was less than in the present study. This increase may be because biochar generally promoted cotton fiber quality optimization by enriching the soil’s potassium. Biochar was rich in potassium and could improve soil potassium deficiency [40,59]. This promotion may be due to the potassium provided by biochar sequentially. Some studies indicated similar conclusions. Yang et al. [60] showed that sufficient potassium ensured cotton fiber development, and adequate potassium improved cotton fiber development and fiber strength. Pervez et al. [61] indicated that providing sufficient potassium to developing fruit was an essential determinant of fiber parameters for producing quality cotton. In our study, B treatments were slightly inferior to A treatments in terms of quality traits. Compared to the A treatments, due to snow-thaw infiltration, some of the potassium was leached out [62] and was difficult to absorb by the cotton roots. Changes in nitrogen levels in the soil after biochar application affected cotton fiber quality. Some studies have shown that applying biochar to the soil can increase the crop’s nitrogen use efficiency [63] and soil N content [64]. An increase in soil N content has decreased the micronaire value of cotton fiber [65]. In our study, the micronaire values of all treatments with biochar applied were lower than that of the CK treatment. However, the reduction in micronaire value would prove to some extent that cotton fiber has better quality, according to the micronaire grading standard.
Through principal component analysis, we selected two principal components according to the principle that the eigenvalue should be larger than 1. The cumulative variance contribution rate is 92.016% (Table 6), reflecting the comprehensive impact of each treatment on cotton quality.
Among them, the variance contribution rate of the first principal component is 70.471%, and the contribution rates of each index from high to low are fiber length, reflectivity, elongation, micronaire value, and specific strength. The variance contribution rate of the second principal component is 21.545%, mainly affected by the positive impact of specific strength and the negative effect of elongation. The contribution rate of specific strength is greater than elongation. Based on the variance contribution rate of the two principal components, we obtained each treatment’s comprehensive evaluation linear function based on the above seven indicators: Y = 70.471Y1 + 21.545Y2, where Y is the comprehensive score of each treatment based on the cotton fiber quality index (Table 7).
Where Y1 is the comprehensive score of main component 1. Y2 is the comprehensive score of principal component 2. After standardizing the original data of each indicator, the formula is applied (Table 8) to obtain the comprehensive score and ranking of each process.
The comprehensive ranking is A2, A3, A4, B3, B1, B2, B4, A1, and CK. A2, A3, A4, and B3 treatments scored positive, and CK treatment scored the lowest, lower than all biochar-applied treatments, indicating that biochar application can improve cotton quality. In addition, except for B1, the score of biochar application before freezing was lower than that after freezing, which also showed that biochar application after freezing had a more significant effect on the improvement of cotton quality. The results of the principal component analysis showed that the quality of cotton fiber treated in treatments A than treatments B. Applying biochar after freeze-thaw with 0.66% of soil mass fraction is the suitable biochar application mode in northern Xinjiang.

5. Conclusions

We set two biochar application times and five biochar application quantities to conduct a field plot experiment. We explored the effects of biochar application before and after freeze-thaw on the SWS, soil temperature, cotton LAI, cotton dry matter accumulation, seed cotton yield, and cotton fiber quality. Furthermore, a comprehensive evaluation of cotton fiber based on principal component analysis was carried out. Our research has reached the following conclusions:
(1)
The biochar application increased the SWS, and the increasing effect was most significant in the budding stage. Applying biochar before and after the seasonal freeze-thaw increased SWS by 21.84–42.19% and 20.03–59.5%, respectively. The biochar application increased soil temperature, retarding the rising and falling of soil temperature. The heat preservation effect decreased with the increase of soil depth. At the same biochar application rate, applying biochar after freeze-thaw had a better thermal preservation effect.
(2)
The biochar application increased the LAI and biomass accumulation. The increasing effect was more significant in the post-freeze-thaw biochar applied treatments. The LAI increased mostly in A2 with 32.52% and decreased mostly in A4 with 10.82% than CK. The dry matter weight of cotton root, stem, leaf, and boll increased by 58.78%, 44.98%, 47.61%, and 95.96%, respectively. Applying biochar increased the seed cotton yield. Applying biochar after the seasonal freeze-thaw at the rate of 0.66% of soil mass fraction increased the seed cotton yield most significantly by 21.95%.
(3)
According to the comprehensive evaluation of cotton fiber quality based on principal component analysis, applying biochar at the soil mass fraction of 0.66% after the seasonal freeze-thaw can improve the cotton fiber quality most significantly.
Based on our results, after the seasonal freeze-thaw, applying biochar at the rate of 0.66% of soil mass fraction had the best improvement on the soil hydrothermal accumulation in drip-irrigated cotton fields and the growth of drip-irrigated cotton. This study can provide a feasible scheme for maintaining the soil health and sustainable cultivation of drip irrigation cotton fields in northern Xinjiang.

Author Contributions

Conceptualization, H.Q. and Z.W.; methodology, H.Q. and H.L.; software, H.Q.; validation, H.Q., R.C., H.L., L.S. and P.C.; formal analysis, H.Q.; investigation, H.Q. and Y.T.; resources, H.Q. and Z.W.; data curation, H.Q., Y.T.; writing—original draft preparation, H.Q.; writing—review and editing, H.Q., H.L., L.S. and P.C.; visualization, H.Q. and R.C.; supervision, Z.W.; project administration, Z.W.; funding acquisition, Z.W. All authors have read and agreed to the published version of the manuscript.

Funding

This work was funded by the National Natural Science Foundation of China (51869027).

Data Availability Statement

Not applicable.

Acknowledgments

We also thank Wenhao Li, Yam Dhital and Yue Wen from Shihezi University, China, for their valuable suggestions and inputs in our manuscript.

Conflicts of Interest

The authors declare no conflict of interest.

References

  1. Wen, Y.; Liu, J.; Dhital, Y.; Wu, X.; Song, L.; Zhu, Y.; Chen, P.; Li, W.; Wang, Z. Integrated effects of plastic film residues on cotton growth and field carbon sequestration under drip irrigation in arid oasis regions. Agric. Ecosyst. Environ. 2022, 339, 108131. [Google Scholar] [CrossRef]
  2. Gong, L.; He, G.X.; Liu, W.G. Long-Term Cropping Effects on Agricultural Sustainability in Alar Oasis of Xinjiang, China. Sustainability 2016, 8, 11. [Google Scholar] [CrossRef] [Green Version]
  3. Zhao, R.F.; Zhang, S.N.; Gao, W.; He, J.; Wang, J.; Jin, D.; Nan, B. Factors effecting the freeze thaw process in soils and reduction in damage due to frosting with reinforcement: A review. Bull. Eng. Geol. Environ. 2019, 78, 5001–5010. [Google Scholar] [CrossRef]
  4. Sun, B.Y.; Ren, F.P.; Ding, W.F.; Zhang, G.H.; Huang, J.Q.; Li, J.M.; Zhang, L. Effects of freeze-thaw on soil properties and water erosion. Soil Water Res. 2021, 16, 205–216. [Google Scholar] [CrossRef]
  5. Wan, H.L.; Bian, J.M.; Zhang, H.; Li, Y.H. Assessment of future climate change impacts on water-heat-salt migration in unsaturated frozen soil using CoupModel. Front. Environ. Sci. Eng. 2021, 15, 17. [Google Scholar] [CrossRef]
  6. Huang, J.L.; Li, H.L.; Yuan, H.X. Effect of organic amendments on Verticillium wilt of cotton. Crop Protect. 2006, 25, 1167–1173. [Google Scholar] [CrossRef]
  7. Zhu, L.Q.; Hu, N.J.; Zhang, Z.W.; Xu, J.L.; Tao, B.R.; Meng, Y.L. Short-term responses of soil organic carbon and carbon pool management index to different annual straw return rates in a rice-wheat cropping system. Catena 2015, 135, 283–289. [Google Scholar] [CrossRef]
  8. Wang, Q.J.; Liu, X.; Li, J.Y.; Yang, X.Y.; Guo, Z.H. Straw application and soil organic carbon change: A meta-analysis. Soil Water Res. 2021, 16, 112–120. [Google Scholar] [CrossRef]
  9. Su, Y.; Yu, M.; Xi, H.; Lv, J.L.; Ma, Z.H.; Kou, C.L.; Shen, A. Soil microbial community shifts with long-term of different straw return in wheat-corn rotation system. Sci. Rep. 2020, 10, 10. [Google Scholar] [CrossRef] [PubMed] [Green Version]
  10. Li, F.C.; Wang, Z.H.; Dai, J.; Li, Q.; Wang, X.; Xue, C.; Liu, H.; He, G. Fate of nitrogen from green manure, straw, and fertilizer applied to wheat under different summer fallow management strategies in dryland. Biol. Fertil. Soils 2015, 51, 769–780. [Google Scholar] [CrossRef]
  11. Yang, C.D.; Lu, S.G. Straw and straw biochar differently affect phosphorus availability, enzyme activity and microbial functional genes in an Ultisol. Sci. Total Environ. 2022, 805, 9. [Google Scholar] [CrossRef] [PubMed]
  12. Antal, M.J.; Mochidzuki, K.; Paredes, L.S. Flash carbonization of biomass. Ind. Eng. Chem. Res. 2003, 42, 3690–3699. [Google Scholar] [CrossRef]
  13. Cox, D.; Bezdicek, D.; Fauci, M. Effects of compost, coal ash, and straw amendments on restoring the quality of eroded Palouse soil. Biol. Fertil. Soils 2001, 33, 365–372. [Google Scholar] [CrossRef]
  14. Schmidt, M.W.I.; Noack, A.G. Black carbon in soils and sediments: Analysis, distribution, implications, and current challenges. Glob. Biogeochem. Cycles 2000, 14, 777–793. [Google Scholar] [CrossRef]
  15. Zuo, Y.T.; Meng, F.X.; Li, T.X.; Fu, Q.; Liu, D.; Hou, R.J.; Li, Q.L.; Li, M. Effect of biochar application on freezing-thawing deformation of farmland soil during freeze-thaw cycling. Geoderma 2022, 405, 13. [Google Scholar] [CrossRef]
  16. Fu, Q.; Zhao, H.; Li, H.; Li, T.X.; Hou, R.J.; Liu, D.; Ji, Y.; Gao, Y.; Yu, P.F. Effects of biochar application during different periods on soil structures and water retention in seasonally frozen soil areas. Sci. Total Environ. 2019, 694, 14. [Google Scholar] [CrossRef]
  17. Hou, R.J.; Qi, Z.Y.; Li, T.X.; Fu, Q.; Meng, F.X.; Liu, D.; Li, Q.L.; Zhao, H.; Yu, P.F. Mechanism of snowmelt infiltration coupled with salt transport in soil amended with carbon-based materials in seasonally frozen areas. Geoderma 2022, 420, 11. [Google Scholar] [CrossRef]
  18. Zuo, Y.T.; Fu, Q.; Li, T.X.; Liu, D.; Hou, R.J.; Li, Q.L.; Li, M.; Meng, F.X. Characteristics of snowmelt transport in farmland soil in cold regions: The regulatory mechanism of biochar. Hydrol. Process. 2022, 36, 17. [Google Scholar] [CrossRef]
  19. Kimetu, J.M.; Lehmann, J. Stability and stabilisation of biochar and green manure in soil with different organic carbon contents. Aust. J. Soil Res. 2010, 48, 577–585. [Google Scholar] [CrossRef]
  20. Tammeorg, P.; Simojoki, A.; Makela, P.; Stoddard, F.L.; Alakukku, L.; Helenius, J. Biochar application to a fertile sandy clay loam in boreal conditions: Effects on soil properties and yield formation of wheat, turnip rape and faba bean. Plant Soil 2014, 374, 89–107. [Google Scholar] [CrossRef]
  21. Dong, X.X.; Zhang, Z.Y.; Wang, S.M.; Shen, Z.H.; Cheng, X.J.; Lv, X.H.; Pu, X.Z. Soil properties, root morphology and physiological responses to cotton stalk biochar addition in two continuous cropping cotton field soils from Xinjiang, China. PeerJ 2022, 10, 24. [Google Scholar] [CrossRef] [PubMed]
  22. Ma, L.J.; Kong, F.X.; Wang, Z.; Luo, Y.; Lv, X.B.; Zhou, Z.G.; Meng, Y.L. Growth and yield of cotton as affected by different straw returning modes with an equivalent carbon input. Field Crops Res. 2019, 243, 10. [Google Scholar] [CrossRef]
  23. Jing, F.Q.; Liu, Y.Y.; Chen, J.W. Insights into effects of ageing processes on Cd-adsorbed biochar stability and subsequent sorption performance. Environ. Pollut. 2021, 291, 8. [Google Scholar] [CrossRef] [PubMed]
  24. Singh, M.; Saini, R.K.; Singh, S.; Sharma, S.P. Potential of Integrating Biochar and Deficit Irrigation Strategies for Sustaining Vegetable Production in Water-limited Regions: A Review. HortScience 2019, 54, 1872–1878. [Google Scholar] [CrossRef] [Green Version]
  25. Wu, D.; Zhang, W.M.; Xiu, L.Q.; Sun, Y.Y.; Gu, W.Q.; Wang, Y.N.; Zhang, H.G.; Chen, W.F. Soybean Yield Response of Biochar-Regulated Soil Properties and Root Growth Strategy. Agronomy 2022, 12, 13. [Google Scholar] [CrossRef]
  26. Antonangelo, J.A.; Sun, X.; Zhang, H.L. The roles of co-composted biochar (COMBI) in improving soil quality, crop productivity, and toxic metal amelioration. J. Environ. Manag. 2021, 277, 13. [Google Scholar] [CrossRef]
  27. Wu, L.P.; Zhang, S.R.; Wang, J.; Ding, X.D. Phosphorus retention using iron (II/III) modified biochar in saline-alkaline soils: Adsorption, column and field tests. Environ. Pollut. 2020, 261, 9. [Google Scholar] [CrossRef]
  28. Ali, S.; Jan, A.; Zhang, P.; Khan, M.N.; Cai, T.; Wei, T.; Ren, X.L.; Jia, Q.M.; Han, Q.F.; Jia, Z.K. Effects of ridge-covering mulches on soil water storage and maize production under simulated rainfall in semiarid regions of China. Agric. Water Manag. 2016, 178, 1–11. [Google Scholar] [CrossRef]
  29. Zong, R.; Wang, Z.H.; Zhang, J.Z.; Li, W.H. The response of photosynthetic capacity and yield of cotton to various mulching practices under drip irrigation in Northwest China. Agric. Water Manag. 2021, 249, 106814. [Google Scholar] [CrossRef]
  30. Glaser, B.; Asomah, A.A.A. Plant Growth and Chemical Properties of Commercial Biochar- versus Peat-Based Growing Media. Horticulturae 2022, 8, 13. [Google Scholar] [CrossRef]
  31. Alves, A.R.; Holthusen, D.; Reichert, J.M.; Sarfaraz, Q.; da Silva, L.S. Biochar Amendment Effects on Microstructure Resistance of a Sandy Loam Soil Under Oscillatory Stress. J. Soil Sci. Plant Nutr. 2021, 21, 967–977. [Google Scholar] [CrossRef]
  32. Gliniak, M.; Sikora, J.; Sadowska, U.; Klimek-Kopyra, A.; Latawiec, A.; Kubon, M. Impact of Biochar on Water Permeability in Soil. IOP Conf. Ser. Mater. Sci. Eng. 2020, 960, 042017. [Google Scholar]
  33. Laird, D.A.; Fleming, P.; Davis, D.D.; Horton, R.; Wang, B.Q.; Karlen, D.L. Impact of biochar amendments on the quality of a typical Midwestern agricultural soil. Geoderma 2010, 158, 443–449. [Google Scholar] [CrossRef] [Green Version]
  34. Zhao, J.; Ren, T.; Zhang, Q.; Du, Z.; Wang, Y. Effects of Biochar Amendment on Soil Thermal Properties in the North China Plain. Soil Sci. Soc. Am. J. 2016, 80, 1157–1166. [Google Scholar] [CrossRef]
  35. Zhang, Q.; Wang, Y.; Wu, Y.; Wang, X.; Du, Z.; Liu, X.; Song, J. Effects of Biochar Amendment on Soil Thermal Conductivity, Reflectance, and Temperature. Soil Sci. Soc. Am. J. 2013, 77, 1478–1487. [Google Scholar] [CrossRef]
  36. Reddy, V.R.; Reddy, K.R.; Baker, D.N. Temperature Effect on Growth and Development of Cotton During the Fruiting Period. Agron. J. 1991, 83, 211–217. [Google Scholar] [CrossRef]
  37. Li, H.; Lu, X.; Xu, Y.; Liu, H. How close is artificial biochar aging to natural biochar aging in fields? A meta-analysis. Geoderma 2019, 352, 96–103. [Google Scholar] [CrossRef]
  38. Cao, Y.; Jing, Y.; Hao, H.; Wang, X. Changes in the Physicochemical Characteristics of Peanut Straw Biochar after Freeze-Thaw and Dry-Wet Aging Treatments of the Biomass. Bioresources 2019, 14, 4329–4343. [Google Scholar] [CrossRef]
  39. Tokova, L.; Igaz, D.; Horak, J.; Aydin, E. Effect of Biochar Application and Re-Application on Soil Bulk Density, Porosity, Saturated Hydraulic Conductivity, Water Content and Soil Water Availability in a Silty Loam Haplic Luvisol. Agronomy 2020, 10, 17. [Google Scholar] [CrossRef]
  40. Zhang, Z.Y.; Dong, X.X.; Wang, S.M.; Pu, X.Z. Benefits of organic manure combined with biochar amendments to cotton root growth and yield under continuous cropping systems in Xinjiang, China. Sci. Rep. 2020, 10, 10. [Google Scholar] [CrossRef] [Green Version]
  41. Liang, J.P.; Li, Y.; Si, B.C.; Wang, Y.Z.; Chen, X.G.; Wang, X.F.; Chen, H.R.; Wang, H.R.; Zhang, F.C.; Bai, Y.G.; et al. Optimizing biochar application to improve soil physical and hydraulic properties in saline-alkali soils. Sci. Total Environ. 2021, 771, 15. [Google Scholar] [CrossRef]
  42. Raphael, J.P.A.; Gazola, B.; Nunes, J.G.S.; Macedo, G.C.; Rosolem, C.A. Cotton Germination and Emergence under High Diurnal Temperatures. Crop. Sci. 2017, 57, 2761–2769. [Google Scholar] [CrossRef]
  43. Miao, W.; Cheng, X.Y.; Meng, J.; Tang, L. Ageing of Rice Husk Biochar Along a Freeze-Thaw Cycles. In Proceedings of the International Conference on Mechatronic, Manufacturing and Materials Engineering (MMME), Hong Kong, China, 11–12 June 2016. [Google Scholar]
  44. Liu, X.; Wang, Q.; Qi, Z.; Han, J.; Li, L. Response of N2O emissions to biochar amendment in a cultivated sandy loam soil during freeze-thaw cycles. Sci. Rep. 2016, 6, 35411. [Google Scholar] [CrossRef] [PubMed] [Green Version]
  45. Fua, Q.; Yan, J.W.; Li, H.; Li, T.X.; Hou, R.J.; Liu, D.; Ji, Y. Effects of biochar amendment on nitrogen mineralization in black soil with different moisture contents under freeze-thaw cycles. Geoderma 2019, 353, 459–467. [Google Scholar] [CrossRef]
  46. Bunce, J.A.; Nasyrov, M. A new method of applying a controlled soil water stress, and its effect on the growth of cotton and soybean seedlings at ambient and elevated carbon dioxide. Environ. Exp. Bot. 2012, 77, 165–169. [Google Scholar] [CrossRef]
  47. Adhikari, S.; Timms, W.; Mahmud, M.A.P. Optimising water holding capacity and hydrophobicity of biochar for soil amendment—A review. Sci. Total Environ. 2022, 851, 158043. [Google Scholar] [CrossRef] [PubMed]
  48. Li, C.; Xiong, Y.; Qu, Z.; Xu, X.; Huang, Q.; Huang, G. Impact of biochar addition on soil properties and water-fertilizer productivity of tomato in semi-arid region of Inner Mongolia, China. Geoderma 2018, 331, 100–108. [Google Scholar] [CrossRef]
  49. Fu, Q.; Zhao, H.; Li, T.X.; Hou, R.J.; Liu, D.; Ji, Y.; Zhou, Z.Q.; Yang, L.Y. Effects of biochar addition on soil hydraulic properties before and after freezing-thawing. Catena 2019, 176, 112–124. [Google Scholar] [CrossRef]
  50. Tan, L.; Ma, Z.; Yang, K.; Cui, Q.; Wang, K.; Wang, T.; Wu, G.-L.; Zheng, J. Effect of three artificial aging techniques on physicochemical properties and Pb adsorption capacities of different biochars. Sci. Total Environ. 2020, 699, 134223. [Google Scholar] [CrossRef]
  51. Li, Q.; Liao, N.; Zhang, N.; Zhou, G.W.; Zhang, W.; Wei, X.; Ye, J.; Hou, Z.N. Effects of cotton (Gossypium hirsutum L.) straw and its biochar application on NH3 volatilization and N use efficiency in a drip-irrigated cotton field. Soil Sci. Plant Nutr. 2016, 62, 534–544. [Google Scholar] [CrossRef] [Green Version]
  52. Shan, Y.Y.; Li, G.; Bai, Y.G.; Liu, H.B.; Zhang, J.H.; Wei, K.; Wang, Q.J.; Cao, L. Effects of gypsum combined with different amounts of biochemical humic acid on soil improvement and cotton (Gossypium hirsutum L.) yield on saline-alkali land. Appl. Ecol. Environ. Res. 2022, 20, 841–854. [Google Scholar] [CrossRef]
  53. Singh, G.; Mavi, M.S.; Choudhary, O.P.; Gupta, N.; Singh, Y. Rice straw biochar application to soil irrigated with saline water in a cotton-wheat system improves crop performance and soil functionality in north-west India. J. Environ. Manag. 2021, 295, 15. [Google Scholar] [CrossRef]
  54. Wu, X.W.; Wang, D.; Riaz, M.; Zhang, L.; Jiang, C.C. Investigating the effect of biochar on the potential of increasing cotton yield, potassium efficiency and soil environment. Ecotoxicol. Environ. Saf. 2019, 182, 7. [Google Scholar] [CrossRef]
  55. Feng, F.Y.; Chen, X.L.; Wang, Q.; Xu, W.J.; Long, L.; El-Masry, G.N.; Wan, Q.; Yan, H.J.; Cheng, J.J.; Yu, X.Y. Use of Bacillus-siamensis-inoculated biochar to decrease uptake of dibutyl phthalate in leafy vegetables. J. Environ. Manag. 2020, 253, 8. [Google Scholar] [CrossRef] [PubMed]
  56. Bohara, H.; Dodla, S.; Wang, J.J.; Darapuneni, M.; Kongchum, M.; Fromme, D.D.; Harrell, D. Impacts of N-stabilizers and Biochar on Nitrogen Losses, Nitrogen Phytoavailability, and Cotton Yield in Poultry Litter-Fertilized Soils. Agron. J. 2018, 110, 2016–2024. [Google Scholar] [CrossRef]
  57. Yue, L.; He, C.; Hao, Z.P.; Wang, S.B.; Wang, H.L. Effects of metal and acidic sites on the reaction by-products of butyl acetate oxidation over palladium-based catalysts. J. Environ. Sci. 2014, 26, 702–707. [Google Scholar] [CrossRef]
  58. Qayyum, M.F.; Haider, G.; Raza, M.A.; Mohamed, A.; Rizwan, M.; El-Sheikh, M.A.; Alyemeni, M.N.; Ali, S. Straw-based biochar mediated potassium availability and increased growth and yield of cotton (Gossypium hirsutum L.). J. Saudi Chem. Soc. 2020, 24, 963–973. [Google Scholar] [CrossRef]
  59. Rasuli, F.; Owliaie, H.; Najafi-Ghiri, M.; Adhami, E. Effect of biochar on potassium fractions and plant-available P, Fe, Zn, Mn and Cu concentrations of calcareous soils. Arid Land Res. Manag. 2022, 36, 1–26. [Google Scholar] [CrossRef]
  60. Yang, J.S.; Hu, W.; Zhao, W.Q.; Meng, Y.L.; Chen, B.L.; Wang, Y.H.; Zhou, Z.G. Soil Potassium Deficiency Reduces Cotton Fiber Strength by Accelerating and Shortening Fiber Development. Sci. Rep. 2016, 6, 11. [Google Scholar] [CrossRef]
  61. Pervez, H.; Ashraf, M.; Makhdum, M.I. Effects of potassium rates and sources on fiber quality parameters in four cultivars of cotton grown in aridisols. J. Plant Nutr. 2004, 27, 2235–2257. [Google Scholar] [CrossRef]
  62. Yuan, H.R.; Lu, T.; Wang, Y.Z.; Chen, Y.; Lei, T.Z. Sewage sludge biochar: Nutrient composition and its effect on the leaching of soil nutrients. Geoderma 2016, 267, 17–23. [Google Scholar] [CrossRef]
  63. Dong, Y.B.; Wu, Z.; Zhang, X.; Feng, L.; Xiong, Z.Q. Dynamic responses of ammonia volatilization to different rates of fresh and field-aged biochar in a rice-wheat rotation system. Field Crops Res. 2019, 241, 11. [Google Scholar] [CrossRef]
  64. Luo, C.Y.; Yang, J.J.; Chen, W.; Han, F.P. Effect of biochar on soil properties on the Loess Plateau: Results from field experiments. Geoderma 2020, 369, 7. [Google Scholar] [CrossRef]
  65. Rochester, I.J.; Peoples, M.B.; Constable, G.A. Estimation of the N fertiliser requirement of cotton grown after legume crops. Field Crops Res. 2001, 70, 43–53. [Google Scholar] [CrossRef]
Figure 1. Daily air temperature and precipitation during the cotton growth period (from 17 April 2021 to 1 October 2021).
Water 14 03818 g001
Figure 2. Planting mode of tested cotton under mulched drip irrigation.
Water 14 03818 g002
Figure 3. Soil water storage in 0–60 cm soil layer at cotton seedling stage (a), budding stage (b), flower-bolling stage (c), boll-opening stage (d). Different small letters indicate that there are significant differences at the level of p < 0.05.
Water 14 03818 g003
Figure 4. Soil temperature of treatments A and CK in 0–60 cm during the cotton growth stage.
Water 14 03818 g004
Figure 5. Soil temperature of treatments B and CK in 0–60 cm during the cotton growth stage.
Water 14 03818 g005
Figure 6. Cotton leaf area index during the growth period in (a) treatments A (applying biochar after freeze-thaw) and (b) treatments B (applying biochar before freeze-thaw).
Water 14 03818 g006
Table 1. Properties of tested soil.
Soil Depth/cmTextureBulk Density /g·cm−3Ctot/g·kg−1Ntot/g·kg−1Soil Organic Matter/g·kg−1
0–20Silty loam1.540417.6321.2571.489
20–40Silty loam1.482613.4590.6802.503
Notes: Ctot—Total carbon; Ntot—Total nitrogen.
Table 2. Selected properties of tested biochar.
IndexAsh Content/%pHCEC/mmol·kg−1OC/%Ctot/%Ntot/%
Content16.54%9.3716.441.60%69.05%1.12%
Notes: CEC—Cation exchange capacity; OC—Organic carbon; Ctot—Total carbon; Ntot—Total nitrogen.
Table 3. Biochar applied timing and rate in each treatment.
TreatmentBiochar Applied TimeBiochar Applied Rate/%
A1After freeze-thaw0.33
A2After freeze-thaw0.66
A3After freeze-thaw1
A4After freeze-thaw1.33
B1Before freeze-thaw0.33
B2Before freeze-thaw0.66
B3Before freeze-thaw1
B4Before freeze-thaw1.33
CKNo biochar applied0
The biochar application rate was expressed as a percentage of soil mass fraction.
Table 4. Cotton biomass dry weight and seed cotton yield in the boll-opening stage.
TreatmentRoot/g·Plant−1Stem/g·Plant−1Leaf/g·Plant−1Boll/g·Plant−1Seed Cotton Yield/kg∙ha−1
Al34.9 ± 1.62 a,b58.69 ± 2.96 a45.84 ± 5.1 a94.41 ± 9.73 a5375.98 ± 87.21 b,c
A237.39 ± 6.31 a57.33 ± 10.43 a,b47.61 ± 9.01 a95.96 ± 10.9 a6264.32 ± 205.79 a
A327.39 ± 4.89 b,c45.14 ± 2.59 b,c,d47.47 ± 5.52 a84.86 ± 12.05 a5934.17 ± 241.85 a,b
A424.72 ± 5.53 c43.71 ± 2.5 c,d42.35 ± 4.48 a76.71 ± 13.53 a5702.77 ± 354.68 a,b,c
Bl30.45 ± 2.26 a,b,c49.16 ± 5.93 a,b,c,d42.16 ± 5.51 a88.34 ± 12.07 a5573.7 ± 277.81 b,c
B232.67 ± 4.63 a,b,c54.64 ± 5.32 a,b,c41.36 ± 5.24 a87.8 ± 17.2 a5947.32 ± 243.6 a,b
B325.92 ± 2.07 b,c41.95 ± 5.04 c,d37.43 ± 6.35 a79.04 ± 6.62 a5812.39 ± 412.99 a,b
B423.2 ± 1.76 c41.1 ± 8.37 c,d39.79 ± 5.68 a82.23 ± 11.65 a5336.08 ± 369.15 b,c
CK23.55 ± 5.02 c40.48 ± 3.55 d33.66 ± 5.32 a77.36 ± 7.82 a5136.85 ± 30.59 c
Note: Different letters in the same column indicate significant differences between different treatments (p < 0.05).
Table 5. Cotton fiber quality traits in different treatments.
TreatmentsFiber Length/mmElongation/%Specific Strength/cN∙tex−1Reflectivity/%Micronaire Value
Al31.41 ± 0.05 e5.8 ± 0.1 a,b29.74 ± 0.21 a82.51 ± 10.26 a3.5 ± 0.3 c
A233.15 ± 0.13 b5.9 ± 0 a,b31.9 ± 0.51 a83.76 ± 5.05 a4 ± 0.1 b,c
A333.93 ± 0.11 a6.4 ± 0.2 a30.49 ± 0.22 a84.93 ± 1.95 a4.6 ± 0.3 a,b
A433.26 ± 0.07 b6 ± 0.5 a,b29.85 ± 2.32 a84.03 ± 13.04 a4.4 ± 0 a,b
Bl32.76 ± 0.02 c6 ± 0.2 a,b29.11 ± 0.6 a83.12 ± 0.46 a4.9 ± 0.1 a
B231.48 ± 0.31 e5.9 ± 0.6 a,b29.29 ± 1.55 a83.98 ± 1.94 a4.9 ± 0.5 a
B331.89 ± 0.13 d6.1 ± 0.3 a,b29.97 ± 2.68 a84.11 ± 3.16 a4.5 ± 0.6 a,b
B431.05 ± 0.07 f5.7 ± 0.3 a,b30.28 ± 1.03 a82.84 ± 3.67 a4.8 ± 0 a
CK29.98 ± 0.04 g5.4 ± 0.2 b28.75 ± 0.36 a82.26 ± 3.9 a5 ± 0.2 a
Note: Different letters in the same column indicate significant differences between different treatments (p < 0.05).
Table 6. Principal component eigenvalue and variance contribution rate.
ComponentInitial Eigenvalues
Total% of VarianceCumulative %
13.52470.47170.471
21.07721.54592.016
30.214.20196.217
40.1442.88299.099
50.0450.901100
Table 7. Principal component load matrix.
IndexComponent
12
X10.921−0.181
X40.87−0.363
X30.851−0.486
X50.8010.545
X20.7440.617
Table 8. Comprehensive score and ranking of each treatment based on the principal component analysis of cotton fiber quality traits.
TreatmentY1Y2YRank
A1−1.290.28−84.978
A22.252.12204.511
A32.59−1.2156.722
A41.19−0.1580.553
B1−0.48−1.01−55.465
B2−0.61−0.9−61.966
B30.78−0.2549.64
B4−1.150.76−64.497
CK−3.290.34−224.519
Publisher’s Note: MDPI stays neutral with regard to jurisdictional claims in published maps and institutional affiliations.