Article

Economic Incentives in Stormwater Management: A Study of Practice Gaps in Poland

Faculty of Environmental Engineering and Energy, Politechnika Krakowska, 31-155 Kraków, Poland
Water 2022, 14(23), 3817; https://doi.org/10.3390/w14233817
Submission received: 21 September 2022 / Revised: 1 November 2022 / Accepted: 21 November 2022 / Published: 23 November 2022

Abstract

:
Sustainable rainwater management is made possible, among others, by nationwide and local policies and regulations that create economic incentives. This article analyzes how existing economic instruments in Poland motivate property owners to make investments that manage rainwater on their own properties. Two types of investments were analyzed: bioswales as one of the lowest-cost green infrastructure measures in construction and operation, and the rainwater harvesting solution that uses rainwater to irrigate greenery. Simulation of this type of investment was undertaken in response to existing economic incentives—obtainable discounts of national and municipal rainwater drainage fees and municipal subsidy programs for rainwater management from three cities of different sizes selected from the Greater Poland province. Analyses were carried out for three types of development: different intensity, sealing of the land, and number of residents. The financial profitability of the investment was evaluated by determining the payback period, NPV, and benefit–cost ratio, taking into account the possible discounts in fees and investment subsidies in the variant analyses. It was shown that the incentive function of national fees for rainwater drainage is low, and that the incentive function of municipal fees and subsidies is higher, depending on the design of the fee (rates and discounts) and subsidy (directions and level of subsidies) systems.

1. Introduction

Economic instruments are a tool used by national and local governments to guide property owners to sustainable stormwater management [1,2,3]. They are a tool classified as “carrots” and they have either an incentive or disincentive function [4]. The incentive function includes co-funding (subsidies, grants, cost shares) and various types of fee or tax reductions (stormwater fee credits, property tax, or impact fee reductions) [2,4,5,6]. They provide direct economic incentives for sustainable stormwater management on property. Fees (stormwater fee, impact fee), on the other hand, as a rule, have a disincentive function, as payment for change in development (impact fee) or for discharging stormwater into the sewer system (stormwater fee), which are supposed to discourage strong negative impacts (high sealing) [1,4,7,8]. Economic incentives in stormwater management also include trading mechanisms such as tradable allowances and tradable credits [1,9,10,11,12]. The literature provides the basics for creating such instruments [9,13,14,15] that are developed in the stormwater market project for Philadelphia [11], among others. Conducted research shows that in a situation where on-site retention is technically unfeasible or very expensive, it is rational to create the possibility of fulfilling the obligation by off-site retention by purchasing “credits” from others who have the opportunity to make an investment with a capacity greater than required [13,14,16]. A trading system allows the minimization of GI implementation costs and achievement of higher quantitative effects in terms of retention [14,17,18]. Stormwater trading markets are not yet fully developed in practice [9].
Fees have been widely introduced in many countries; a review study for the US and Canada [19] and an extended analysis based on this also covering Germany, Australia, and Brazil, which, among others, raises questions about the role of stormwater utilities as a more equitable tool for financing public services than funding from uniform fees or municipal budgets [20]. This issue (equity) in the US is also analyzed by Zhao et al., who review rate structures, credits, and discounts in terms of efficiency from the perspective of property owners. They report on divergent assessments of the impact of stormwater fees on their behaviors (making or not making investments in green infrastructure on their own property) [21]. In Poland, national fees for the discharge of rainwater into watercourses and fees for the loss of natural retention are commonly in place; their design has many flaws and do not provide an incentive for the development of rainwater retention, while municipal stormwater fees have been introduced in only a few cities, so they do not provide a commonly occurring incentive for rainwater retention [22,23,24].
The motivational role of rainwater fees on the development of green infrastructure has been the subject of research and review work (the main one or has been evaluated indirectly as a result of other economic analyses). The results of studies are divergent, the positive impact of fees on the decrease in impervious surfaces was shown by the German experience [25], a strong motivational role is presented by the conclusions of the work by Thurston et al. [26]. Research by Malinowski et al. on five municipal incentive schemes (existing utility subsidies and annual fee credits in: Philadelphia, Seattle, Nashville, Charlotte, and Prince George’s County) shows that both fee rates and credits are too low to be an incentive for the implementation of GI measures on private commercial property. An NPV method was used to assess cost-effectiveness by assuming various levels of capital investment and annual maintenance costs, and private benefits included potential revenues/benefits. A desirable fee structure and credit system were also indicated, as well as the level of refinancing of construction costs as a solution that could encourage investors to undertake investments [27]. Recommendation to introduce additional financial incentives for GI projects, such as subsidy programs and raising stormwater fees and/or credits can also be found in an analysis for Philadelphia [11]. This study was based on the determination of the unit costs of stormwater practices, the annual stormwater reductions, and the critical threshold values of the unit costs, ensuring reimbursement up to 10 years (analysis of the payback period and the net present value). It was shown that only some of the practices were attractive to property owners in the existing stormwater fee system [11]. Other authors also highlight possible problems arising from rates that are too low and therefore non-motivational [28], but nevertheless emphasize the motivational role of fees and the need for them to achieve sustainable stormwater management [7,8,28,29,30].
Calculating the financial viability of green infrastructure or rainwater harvesting (RWH) investments helps to determine the necessary levels of incentives that could increase the profitability of investments and encourage investors to undertake projects. Most analyses focus on the profitability of rainwater harvesting (RWH) systems, while other green infrastructure measures are rarely analyzed. The evaluation of the profitability of RWH using dynamic generation cost (DGC), payback period, and the NPV method was carried out taking into account the municipal stormwater fee [31], and it was shown that the introduction of a municipal fee significantly increases the profitability of investments and shortens the payback period. It was emphasized that, unfortunately, fees occur only in some cities in Poland; average rates from 11 selected cities were used. Additionally, municipal reimbursement programs for RWH systems functioning in the two cities selected for analysis were analyzed. The level of subsidy was assessed as insufficient to ensure the profitability of the RWH systems analyzed. Other Polish studies include an analysis of RHW effectiveness by NPV and discounted payback period, showing their unprofitability during a period of 30 years (stormwater fees were not considered because the city did not implement them in the location under consideration) [32], as well as a study of efficiency of RWH for eight cities including Warsaw by lifecycle cost (LLC) analysis, which also showed that implementation of several variants of water systems with RHW is financially unprofitable (the study did not analyze any economic incentives, but indicated co-financing as an indication of respondents to undertake such investments) [33]. Another study showed lower LCCs of RHW centralized systems than decentralized ones for an estate of 22 single-family houses, both types are unprofitable under current conditions, but centralized ones would require only 25–50% co-funding to become profitable [34]. A study of the cost-effectiveness of green infrastructure measures with the benefits of reducing stormwater fees in Poland shows that the introduction of municipal fees increases the attractiveness of such measures [35]. The study analyzed both national fees for discharging rainwater into watercourses. It recognized the problem of low rates and flawed design of discounts, and thus low benefits for investors and insufficient incentive to invest, pointing out that this may require the inclusion of other additional incentives (subsidies and municipal fees) [23,35].
The research objective of this article is to present and examine existing economic instruments in Poland that should support sustainable water management in urban areas. The incentive function of existing rainwater management fees and subsidy programs is evaluated using three selected cities and three sample types of housing developments as examples. The use of economic efficiency methods to assess the motivational role of the existing economic instruments was used in the abovementioned studies, e.g., [27]. In this study, the simultaneous use of simple indicators such as a simple payback period gives an estimate of profitability, which is taken into account by residents without economic knowledge, and discount methods (discounted payback period, net present value NPV, benefit–cost ratio B/C) that give a real picture of profitability that should be taken into account when establishing fee systems. Another innovation is the reference to quantitative thresholds (e.g., equipment capacity) required to obtain a discount in the fee rate, which in the Polish system of fees, both domestic and municipal, have not yet been tested. This work also shows errors and gaps in the existing incentive systems at the national and local levels and may be the basis for a revision of the adopted solutions in fees (rates, rate discounts, equipment capacity requirements).

2. Materials and Methods

2.1. Economic Instruments Existing at the National Level to Motivate Property Owners to Undertake Investments in the Field of Sustainable Rainwater Management

2.1.1. My Water Subsidy Program

In 2020, the My Water program for 2020–2024 was introduced. The program is aimed at individuals who own or co-own property on which a single-family residential building is located. Financial support is provided for expenditures on the purchase of elements for the retention and use of rainwater on the property [36]:
  • To collect rainwater from impervious surfaces of the property;
  • For retention of rainwater in containers (e.g., underground tanks, aboveground tanks, ponds);
  • For retention of rainwater in the ground (e.g., unsealing of impervious surfaces, absorption wells, drainage, rain gardens);
  • For rainwater retention on roofs—green roofs (drainage layer);
  • For the use of retained rainwater: e.g., pumps, filters, hoses, sprinklers, controllers, water distribution centers, and other installations that allow management of rainwater.
Funding comes in the form of a grant of up to 80% of eligible costs, but no more than EUR 1074 per project. The minimum amount of eligible costs is EUR 430, and the minimum total retention capacity is 2 m3 [36].
The support budget at the time of the program’s announcement on 1 June 2020 was EUR 21.5 million and envisaged supporting 20 thousand households. The program was very popular—by the end of October 2020 almost 25 thousand applications were submitted and the budget was increased to EUR 24.7 million [37]. In the second edition, the budget for 2021 was allocated another EUR 21.5 million; the call lasted two months (22 March 2021–10 June 2021) and once again the budget was completely exhausted.
In the following year 2022, no more new funds were allocated for subsidies; the total budget for 2020–2024 was about EUR 46 million, and it was exhausted in 2020–2021, in 2022 residents had no possibility of support, perhaps in the following years 2023–2024 it will be increased, but there are no announcements of any increase in funding for this program.
In summary, currently property owners are not supported by any subsidy program at the national level.

2.1.2. Fees Related to Rainwater Management

The Water Law of 2017 introduced two fees to improve rainwater management in Poland. These are [23,24]:
  • Fees for the discharge of rainwater and snowmelt water;
  • Charges for reduction in natural terrain retention.
These fees are typical economic instruments used in environmental management, which have two functions: incentive and funding. These functions consist of [4,21,38,39,40]:
  • Income-generating function (also called fund-raising or fiscal function) consists in the fact that funds derived from fees form a source of financing for current costs and investments, in this case constituting income for the State Water Holding Polish Waters (PSH Polish Waters)—a public entity responsible for the maintenance of rivers in Poland.
  • Motivational function—the introduction of the instrument induces users to undertake the desired actions—reducing the outflow of rainwater into the sewerage system, reducing the degree of sealing of the catchment area, and implementing rainwater retention investments.

Fees for Rainwater and Snowmelt Discharge

Fees for the discharge of rainwater and snowmelt are paid by all entities with water rights permits for the discharge into waters—rainwater or snowmelt, captured in open or closed stormwater drainage systems used for the discharge of precipitation or in combined sewer systems within the administrative boundaries of cities and towns.
Who bears the fees?—the fee is charged to the entity that discharges the collected rainwater to the watercourse; hence, in urbanized areas where there is a rainwater sewer system, the fee is paid by the owner/administrator of the sewer system, and not by the residents connected to the sewer system. The exception is when the owner of the sewer system is the residents, for example, when a developer, building a housing development located close to a watercourse, has at the same time built a rainwater drainage system (ditches), which discharges rainwater into that watercourse. The administrator of the estate, on behalf of the owners, pays this fee to PSH Polish Waters. However, most often in urban areas, rainwater drains are owned by municipalities and administered by municipal entities such as water supply companies, utility companies, or municipal road authorities. The fee for draining rainwater from the sewer system is therefore most often borne not by residents but by sewer administrators. Residents, on the other hand, pay municipal fees (outlined in the next section)—charges for discharging rainwater into the sewer system—if such fees have been established in the municipality.
The unit rate of the variable fee depends on the use of rainwater retention devices. The level of the fee rate depends on the capacity of the devices, which is related to the annual runoff. The fee rates are included in Table 1 [41]. The fee rates are the same from 2018, the moment the regulations came into force.

Fee for Reduction in Natural Retention

The fee for the reduction in natural terrain retention is complementary to the fee for the discharge of rainwater captured in sewer systems within the administrative boundaries of cities. In this way, the legislator included urban and suburban areas subject to intensive development and accompanying land sealing, where urban flooding has been occurring in recent years.
Who pays the fee?—the fee for loss of retention is paid if the property simultaneously meets three conditions:
  • Area is greater than 3500 m2;
  • More than 70% of the property’s biologically active area is excluded through development;
  • The property is located in an area not covered by an open or closed sewer system.
The fee is the product of the unit fee rate and the amount of biologically active area lost, expressed in m2. In terms of assessing the incentive nature of the loss fees, a mechanism has been introduced to incentivize the reduction in the outflow of these waters from the property. The design of the fee provides for a reduction in rates in the case of the use of rainwater retention facilities. The level of the fee rate depends on the capacity of the devices, which is related to the annual runoff (Table 2).
In summary, there are currently two types of fees in place at the national level to incentivize sustainable stormwater management. These fees are complementary, including both areas covered by sewer systems and areas not covered by sewer systems:
  • Fee for the discharge into watercourses of rainwater or snowmelt water contained in open or closed stormwater drainage systems for the disposal of precipitation or combined sewer systems within the administrative boundaries of towns and cities;
  • Fee for the reduction in natural terrain retention as a result of carrying out on a property with an area of more than 3500 m2 works or construction objects permanently connected to the land, which affect the reduction in this retention by excluding more than 70% of the area of the property from the biologically active area in locales not covered by open or closed sewage systems.
  • These fees are not general fees—they apply to:
  • Administrators of sewerage systems that collect rainwater from property owners and discharge it through sewers into rivers. Fees for discharging rainwater into rivers are not paid by property owners who put rainwater into sewers. Only if a property owner builds a sewer system (e.g., in the form of a ditch) and directly discharges rainwater into a river, does the owner pay this type of fee.
  • Large developments/properties that meet three criteria simultaneously: (1) an area of more than 3500 m2, (2) a biologically active area of less than 70% of the property’s area, and (3) the property is located in areas not covered by sewage systems. The owner of such a property pays a fee for reducing natural retention. According to the report of the Supreme Audit Office [42], very few properties are subject to this fee (estimated based on the 2019 fee amounts to about 300–500 hectares, or less than 0.1% of urbanized areas).

2.2. Economic Instruments Existing at the Local Level to Motivate Property Owners to Undertake Investments in the Field of Sustainable Rainwater Management

Local governments, having increasing problems with the occurrence of rainfall flooding, are trying to develop rainwater retention. Retention at the local scale is mainly implemented by local governments (or local government units established for these tasks), while retention at the microscale—which involves the management of rainwater from the property, is implemented and with "financed by property owners (individuals, developers, entrepreneurs, road managers, etc.). Investment financing by local governments is mainly carried out with funds from:
  • Municipal budgets;
  • Municipal fees for rainwater drainage (in some municipalities).
The lack of universal municipal fees is due to the abolition in 2018 of the legal basis for establishing fees for the discharge of rainwater into the sewer system based on the provisions of the Law on Collective Water Supply and Collective Sewage Disposal. In this situation, municipalities are left with the use of the provisions of the Law on Municipal Management, according to which fees may be charged for municipal services of a public utility nature and for the use of public utility facilities, or through a civil legal contract for the discharge of rainwater based on the provisions of the Civil Code [39].
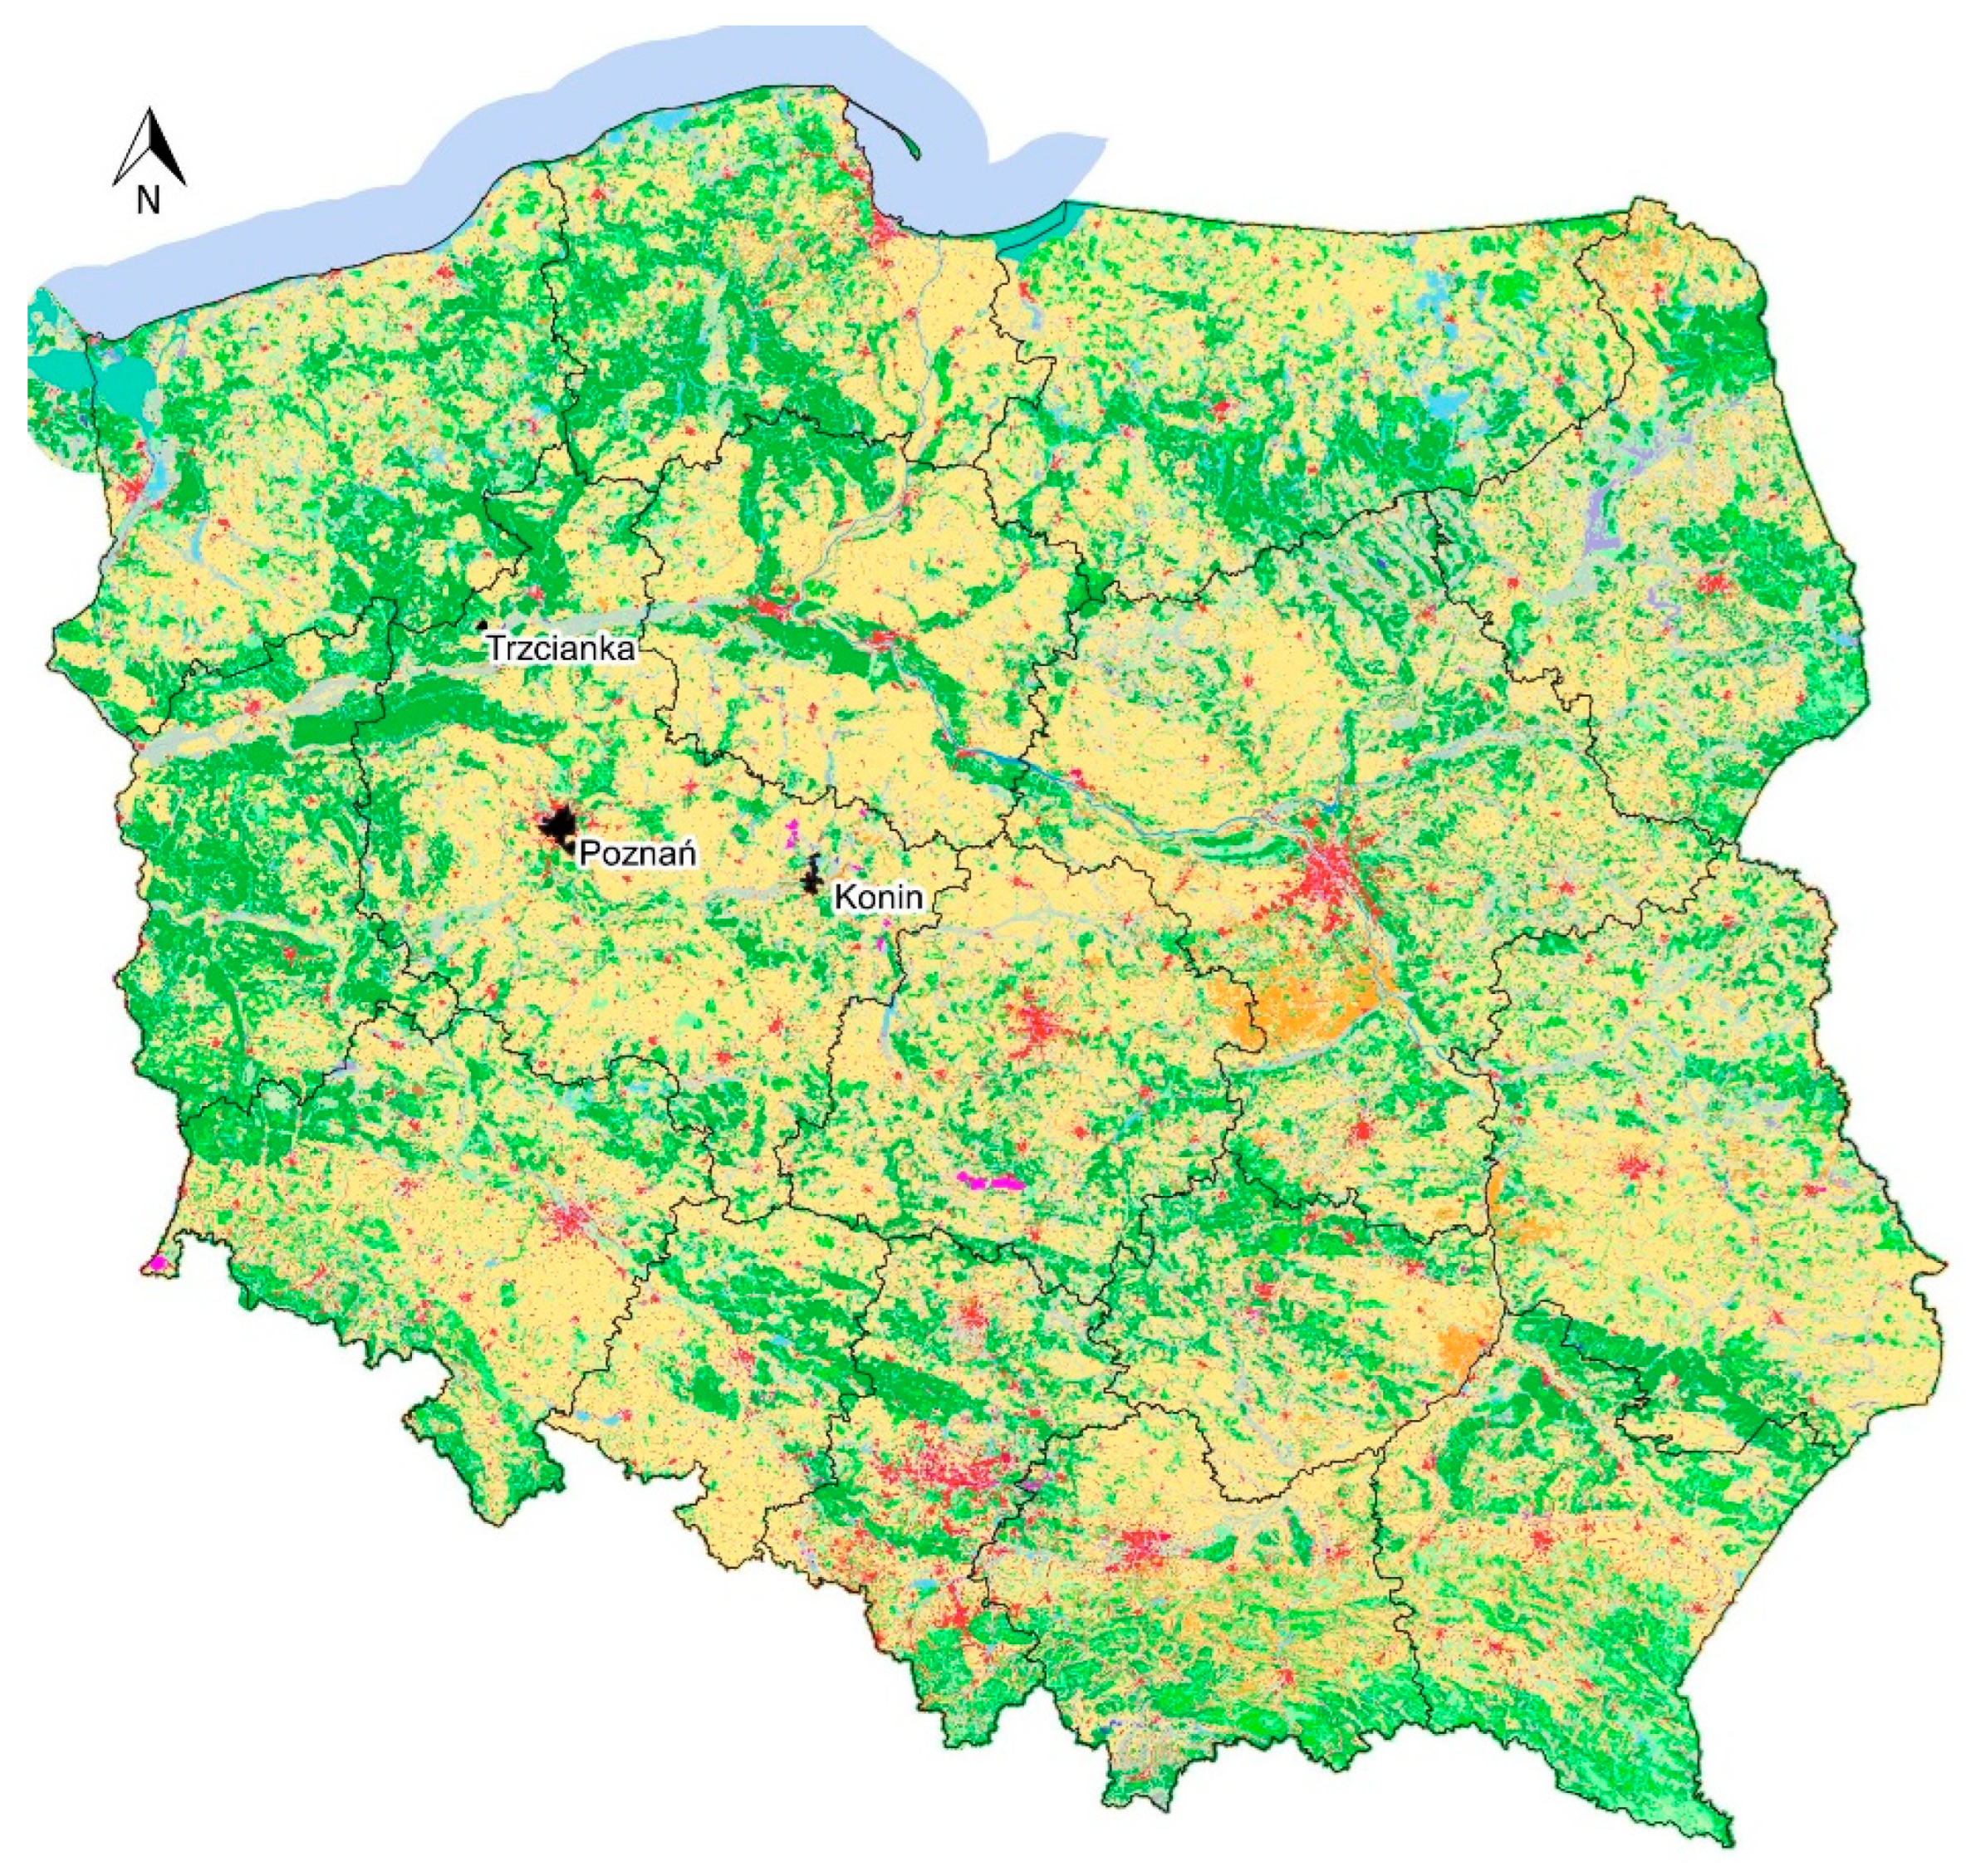
The lack of an obligation to introduce such fees and the strong public resistance to the introduction of new financial burdens means that many cities have not introduced such fees, including large cities such as Warsaw and Krakow. Prices for rainwater drainage in municipalities that have introduced such fees vary. The solutions adopted in three cities of different sizes in Greater Poland Province are presented below (data for 2021 according to [43]):
  • Poznań—the largest city in Greater Poland Province, the capital of the province, city area 262 km2, population 529,410;
  • Konin—medium-sized city, city area 82 km2, population 71,427;
  • Trzcianka—small city, city area 18 km2, population 16,842.
The location of the cities is shown in Figure 1.
Cities that have introduced municipal fees were mainly aimed at raising funds for the maintenance and expansion of sewer systems, but many have also introduced solutions to motivate residents to retain rainwater on their property, e.g., in the form of obtaining reductions in the fee rate after the implementation of rainwater retention investments.
Another instrument to motivate residents and other investors can be local municipal programs to subsidize rainwater management tasks on the property. The economic instruments introduced in the three cities presented above are discussed below.

2.2.1. Poznań

Poznań has introduced both fees and a subsidy program to support the development of rainwater retention.

Fees

Fees for the discharge of rainwater and snowmelt are charged for the discharge of this water into both the combined sewer system and the stormwater drainage system, and the rates of these fees have been differentiated, the fees for discharge into the combined sewer system being more expensive. The fees are billed and collected by the water and sewerage company operating in the city and surrounding communities. The rates are shown below in Table 3. The fee rates are differentiated according to the use of water retention facilities, the reduction in the rate depends on the capacity of these facilities in relation to the annual outflow of rainwater and snowmelt from permanent surfaces [44].
The fee is calculated as the product of the rate, the paved area (roof in projection, permanent surfaces—roads, driveways, parking lots, etc.), and the amount of average annual precipitation for the city of Poznań [44].

Subsidies

A resolution of the Poznań City Council introduced the “Small Retention” program for 2022, which provides for grants for the construction of rainwater systems to retain and use precipitation on-site. In particular, the subsidy may be granted for the following types of investments [45]:
  • Aboveground or underground rainwater storage tank;
  • Rain garden in the ground or in a container;
  • Dry well;
  • Absorption trough.
The use of collected rainwater [45]:
  • Watering lawn, garden, feeding rain garden;
  • Groundwater recharge (e.g., infiltration basins, dry wells, drainage, infiltration boxes, etc.);
  • Household purposes;
  • Others.
The subsidy can be held by individuals, communities and housing cooperatives, social housing initiatives, institutions, or entrepreneurs. The grant can cover up to 80% of the cost. Housing cooperatives and communities, and social housing initiatives, can count on assistance of up to 50 thousand PLN, and others, up to six thousand PLN [45].
The budget for the program in 2022 is PLN one million.

2.2.2. Konin

Konin, like Poznań described above, has introduced both fees and a subsidy program to support the development of rainwater retention.

Fees

Fees for the discharge of rainwater and snowmelt are charged for the discharge of such water into the stormwater drainage system. The fees are billed and collected by the municipal road authority operating within the city, which, in addition to its road management and maintenance tasks, manages the stormwater drainage system. The fee system provides discounts for those who apply water retention devices or ensure the functioning of biologically active surface and trees on a given property. The introduction of discounts is aimed at promoting the retention and management of rainwater and snowmelt within the boundaries of a given property, together with taking pro-environmental measures such as maintaining biologically active surfaces and planting trees. The rate and possible discounts are shown below in Table 4. Discounts are subject to aggregation [46].
The fee is calculated as the product of the rate (with a discount, if applicable), the paved area (roof in projection, permanent surfaces—roads, driveways, parking lots, etc.), the runoff coefficient, and the amount of average annual rainfall for the city of Konin [46].

Subsidies

A resolution of the Konin City Council introduced a program for 2022 to subsidize solutions aimed at retaining and reusing rainwater. The purpose of the subsidy is to increase natural retention in the City of Konin, maintain groundwater resources, and improve the microclimate through the construction of systems for rainwater and snowmelt management [47].
In particular, the subsidy may be granted for the following types of investments [47]:
  • Construction of an aboveground free-standing sealed tank for rainwater from the roof;
  • Construction of an underground sealed rainwater storage tank.
The grant can cover up to 70% of the cost, but no more than:
  • EUR 430—for the construction of an aboveground free-standing sealed tank;
  • EUR 1290—for the construction of an underground sealed tank with a capacity of up to 5 m3;
  • EUR 2150—for the construction of an underground sealed tank with a capacity of more than 5 to 10 m3;
  • EUR 3010—for the construction of an underground sealed tank with a capacity of more than 10 m3.
Subsidies are available to the following entities [47]:
  • Entities not included in the public finance sector, in particular:
    • Individual citizens;
    • Housing communities;
    • Legal entities;
    • Entrepreneurs.
  • Units of the public finance sector that are municipal or district legal entities.
The budget for the program in 2022 is EUR 32 thousand.

2.2.3. Trzcianka

Trzcianka is a small town with a population of about 16,000, the seat of an urban–rural municipality with a total population of about 24,000. The city of Trzcianka has a municipal company that provides collective water supply and collective sewage disposal services, along with rainwater collection and disposal services through a stormwater drainage system. The city council has introduced fees for rainwater discharge. The municipality does not run any subsidy program for rainwater retention.

Fees

Rainwater and snowmelt fees are charged for the discharge of rainwater into the stormwater drainage system. The rate is shown below in Table 5.
The fee is calculated as the product of the rate and the paved area. Fees for the discharge of rainwater and snowmelt are charged on contaminated surfaces with a permanent surface, included in stormwater drainage systems, which are, among others [48]:
  • Areas developed with residential, industrial and other buildings;
  • Industrial and storage areas and transport bases;
  • Roads and parking areas.
This fee is a flat rate and is charged in a monthly billing period (monthly rate of EUR 0.0172 per m2) and is independent of the amount of rainfall.

2.3. The Adopted Scheme for Assessing Economic Incentives by Simulating Selected Scenarios of Behavior of Property Owners

In order to assess the motivational role of economic instruments, simulations of possible probable behavior of property owners in response to the existing rules and incentives in fee and subsidy programs are carried out. The cost and benefits of the adopted investment strategies are estimated and the profitability of the investment is assessed by estimating profitability indicators: simple and discounted payback period (PP and DPP), net present value NPV, and benefit–cost ratio B/C.
The following probable behaviors of property owners were simulated:
  • Investors adopt a minimalistic strategy—the cheapest and the smallest investment that allows them to obtain a discount on the fee rate;
  • Investors adopt a rainwater harvesting strategy for rainwater tanks to water green areas as a strategy to obtain, in addition to a discount on the fee rate, additional benefits from lowering water bills;
  • Additionally, a simulation of disconnecting some of the roofs from the sewage system is carried out as a strategy for reducing the stormwater fee.
Each of these strategies is additionally analyzed in terms of its profitability, taking into account subsidy support (if such a program exists in the analyzed city).
Since the fees depend on the amount of rainwater discharged from the property, their amount is strictly dependent on the size of the property, the way it is developed, and the sealed area. The following analyses are carried out for three types of land use for residential purposes typical of urban development, each with a total area of 1 hectare (Table 6):
  • Dense housing estate (three blocks of 10-story buildings, 10 apartments per floor), number of households 300;
  • Housing estate with less intensive development preserving 40% of the green area (six blocks of five floors, six apartments per floor), number of households 180;
  • Estate with semi-detached single-family development (green areas 60%, 25 single-family houses).
It was assumed that the properties are located within the city and are covered by the rainwater drainage system.

2.3.1. Calculation of the Rainwater Fee Due and the Annual Benefits from Its Reduction

The national and municipal fees are calculated as:
  • As the product of the fee rate and the sealed area (the rainwater fee in Trzcianka):
F = f b · A ,
where:
  • F  annual stormwater fee (EUR),
  • A  sealed area (m2),
  • f b  basic fee rate (EUR/m2).
2.
As the product of the fee rate and the annual runoff (national and municipal fees in Poznań and Konin):
F = f b   · Q s p ,
where:
  • Q s p  annual runoff volume from a given area (m3),
  • f b  basic fee rate (EUR/m3),
  • and other variables as given above.
Annual runoff is calculated by using the rational method based on annual rainfall [35,49,50]:
Q s p = Ψ · A · P ,
where:
  • Ψ  runoff coefficient (-),
  • A  analyzed area (m2),
  • P  annual rainfall (mm),
  • and other variables as given above.
The product of rainfall and runoff coefficient expresses the runoff from the surface under consideration in the analyzed unit of time. The runoff coefficient, also called the imperviousness coefficient, is the ratio of the amount of runoff from a given surface to the amount of rainfall that fell on that surface. The value of Ψ strictly depends on the land use; in addition, the slope of the land also has an important influence on its magnitude. A runoff coefficient of 0.95 was assumed, which corresponds to roofs and asphalt surfaces [51].
The analyzed cities are located close to each other (distances Trzcianka–Konin 150 km, Trzcianka–Poznań 77 km, Poznań–Konin 92 km), and are characterized by similar precipitation conditions. According to the data of the state meteorological and hydrological service, the average annual precipitation from the multi-year period 1991–2020 is [52]:
  • Poznań, 539 mm;
  • Konin (measurement station Koło), 526 mm;
  • Trzcianka (measurement station Piła), 550 mm.
An average rainfall of 538 mm was assumed for further analysis.
Annual benefits of stormwater fee reduction were calculated based on the difference between the basic and the discounted fee rate:
R = ( f b f d )   · Q s p ,
where:
  • R  annual benefits of stormwater fee reduction (EUR);
  • f d  discounted fee rate (EUR/m3);
  • and other variables as given above.

2.3.2. Estimating Investment Costs and O&M Costs

The analyses are carried out for two types of investments undertaken by property owners in response to the existing economic incentives for rainwater management. It is assumed that property owners wishing to obtain a fee discount use the smallest and cheapest possible solution. According to the literature [53,54], a bioswale collecting rainwater from selected gutters or parking areas is assumed as the cheapest solution. The second type of investment includes underground rainwater tanks, which are a solution for collecting rainwater for watering greenery and permit additional benefits from reducing water bills.
Initial investment costs and annual O&M costs are calculated as the product of the storage capacity and unit capital costs based on the literature [54,55,56,57] and the quoted unit price indices in the construction sector in Poland. The unit capital costs and O&M costs are summarized below in Table 7.
The following rules for the dimensioning of retention devices (bioswales and underground tanks) in simulations are adopted:
  • Tank capacity for irrigation of green areas—in accordance with the standard DIN 1989-1: 2002-4;
  • The capacity of the bioswale in the minimalist scenario as the adoption of the minimum capacity required by the rainwater fee system giving the first rate discount;
  • The capacity of the bioswale in the scenario of disconnecting the roof from the drainage system as the capacity necessary for safe collection of rainwater—in accordance with the standard DWA-A 138, 2005.

Dimensioning of the Underground Tank

To calculate the required volume of tanks, the recommendations of DIN 1989-1: 2002-4 are adopted, which recommend a volume at the level of the 21-day supply of water required for watering, and sets the annual demand of green areas at 60 l/m2 [58]:
V r = 0.06 · B W a · A g r e e n ,
where:
  • V r  required volume of tank (m3);
  • B W a  annual requirements for garden watering per 1 m2 (l/m2);
  • A g r e e n  watered green area (m2);
  • 0.06 a conversion factor reflecting a 21-day supply in relation to the annual requirements, 0.06 21 / 365 .

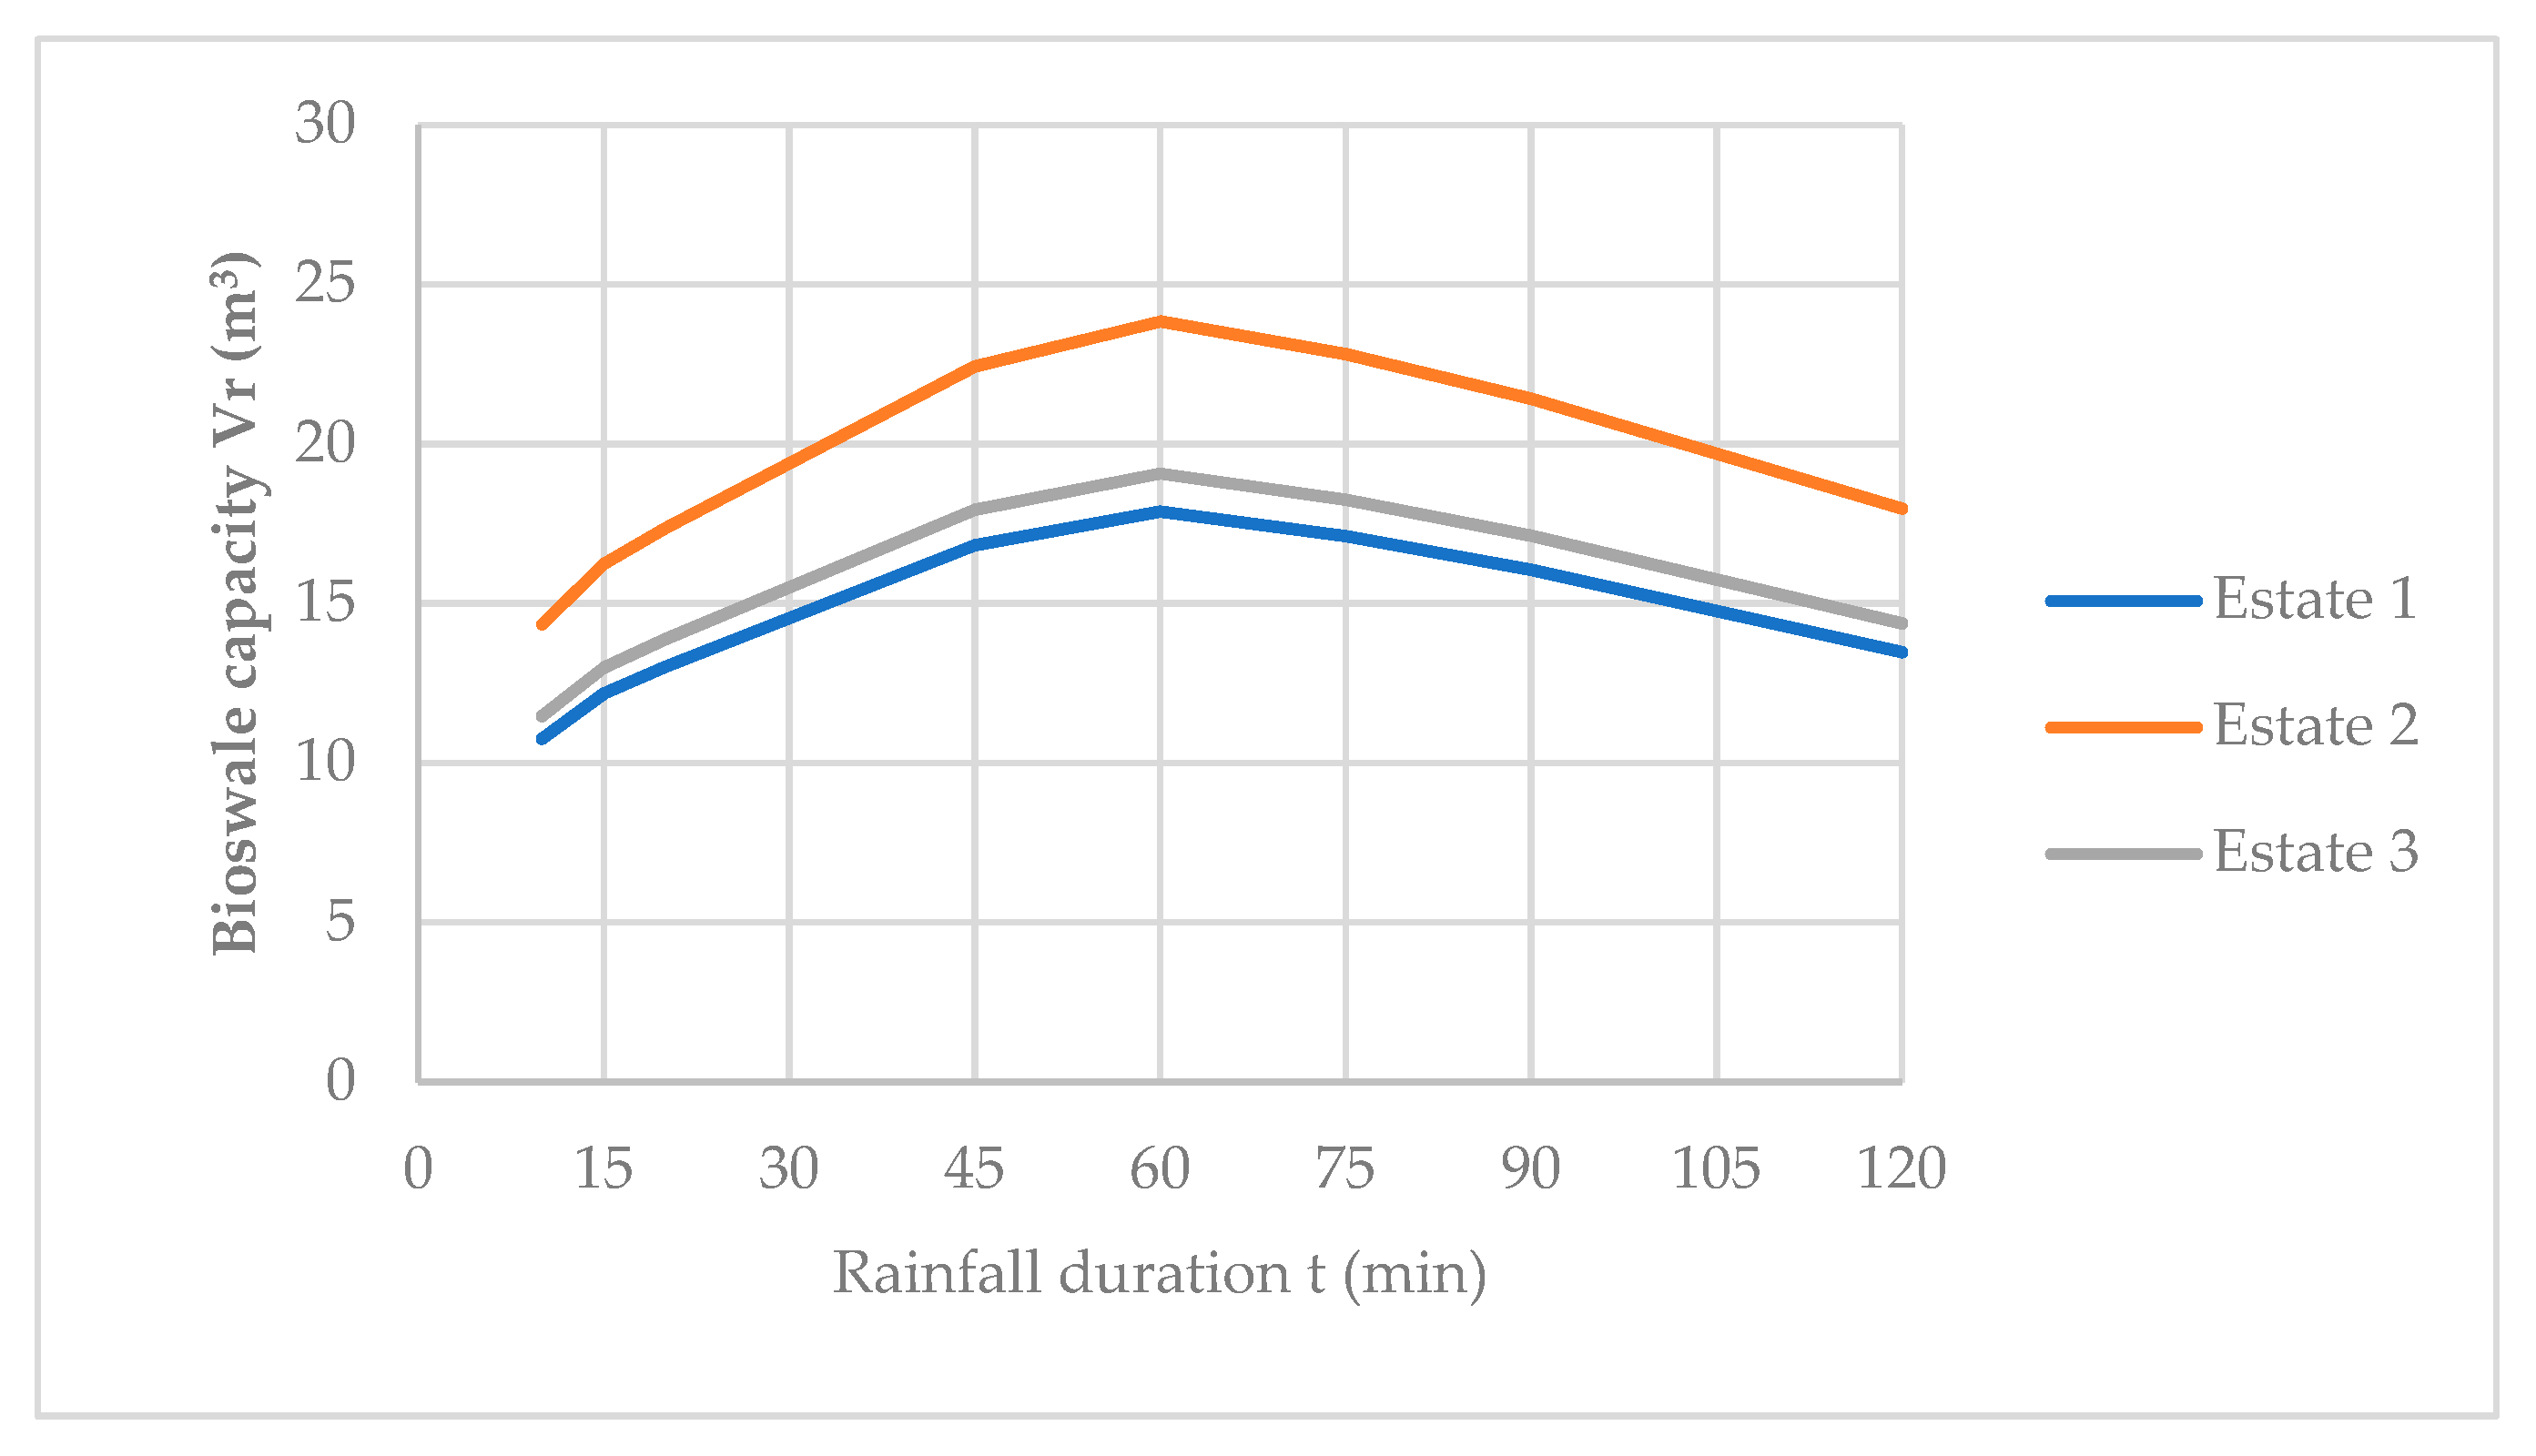
Dimensioning of the Bioswale

Dimensioning of the bioswale as a retention–infiltration device is carried out on the basis of rules defined by German regulation guidelines DWA-A 138, 2005 [58,59]. The design parameter of retention–infiltration systems is the retention capacity V r , which is determined by the relationship:
V r = [ ( A r e d + A f ) · 10 7 · q t , p k f 2 A f ] t · 60 · f z ,
where:
  • A r e d  effective drained area, as A r e d = Ψ a v · A (m2);
  • A f  infiltration area of the bioswale (m2);
  • q t , p  rainfall intensity (dm3/(s∙ha));
  • t rainfall duration (min);
  • p rainfall probability (-);
  • k f  water-saturated hydraulic conductivity of subsurface material (m/s);
  • f z  safety factor (-).
The rainfall is determined by applying the method of Bogdanowicz and Stachý, which allows for calculating the maximum rainfall depth in the territory of Poland. The method is commonly used in rainwater management analyses and recommended in guidelines for designers. In the Bogdanowicz–Stachy method, the rainfall depth P m a x ( t , p ) (mm) of a duration (t) and an occurrence probability (p) is calculated by the following formula [35,60,61,62]:
P m a x ( t , p ) = 1.42 · t 0.33 + α ( R , t ) ( l n p )   0.584
where:
  • P m a x ( t , p )  maximum rainfall depth (mm);
  • α(R,t) coefficient dependent on the region of Poland (R) and the rainfall duration (t);
  • and others as defined above.
The coefficient α(R,t) differentiates depth–duration–frequency (DDF) curves depending on the region and the rainfall duration, which corresponds to the country’s climate variation. Poland has been divided into three regions; the analyzed cities of Greater Poland voivodeship (Poznań, Konin, Trzcianka) belong to the northwestern region according to this method. For that region and rainfall duration ranging from 5 to 4320 min, the value of coefficient α was calculated using the following ratio [60,63,64]:
for: t = [5–30]: α = 3.920 ln(𝑡 + 1) − 1.662
for: t = (30–60): α = 9.160 ln(𝑡 + 1) − 19.600
for: t = [60–120): α = 4.693 ln(𝑡 + 1) − 1.249
for: t = [120–720): α = 2.223 ln(𝑡 + 1) + 10.639
for: t = [720–4320]: α = 9.472 ln(𝑡 + 1) − 37.032
Conversion of rainfall height to rainfall intensity according to the equation:
q t , p = 166.67 · P m a x ( t , p )
According to the recommendations of the Polish standard [65] for the design of drainage in residential areas, the frequency of design rainfall should be 1 in 5 years, but if there is a medium or high impact of potential flooding (and such a situation may occur if rainwater is directed to a drainless bioswale) then a higher design rainfall with a return period of c = 10 years and probability p = 10% should be adopted [63]. Precipitation with such parameters was calculated based on Formulas (7)–(9) and summarized in Table 8.
of different event durations t for a 10-year event (p = 10%).

2.3.3. Calculation of Annual Benefits of Water Bill Reduction

Annual benefits of water bill reduction are calculated as the product of the amount of retained rainwater and the price of tap water in the analyzed cities. It is assumed that the adopted volume for tanks with 21-day reserve allows for the complete coverage of the annual watering requirements for green areas (with repeated filling and emptying of the tanks during the year).
W = p · B W a · A g r e e n ,
where:
  • W annual benefits of water bills reduction (EUR);
  • p  price of tap water (EUR/m3);
  • and other variables as given above.
The price of tap water for the purpose of calculating possible benefits from the use of rainwater according to tariffs in the analyzed cities: Poznań 2.67, Konin 3.76, and Trzcianka 2.71 EUR per 1 m3 water and sewage combined [44,48,66].

2.3.4. Methods of Assessing of Economic Efficiency of Investment

Four methods were used to assess the incentive function of the fees:
  • Simple payback period (PP);
  • Discounted payback period (DPP);
  • Net present value (NPV);
  • Benefit–cost ratio (B/C).
Simple payback period was chosen for cost-effectiveness evaluation because of its simplicity and widespread use by investors in early assessments when making investment decisions. It is very common for investors to preliminarily estimate the profitability of rainwater harvesting or systems for using rainwater for green watering to compare investment costs and the expected benefits of reduced tap water fees and fees for discharging rainwater into the sewer system. Estimation of the PP index shows, therefore, how investors such as residents—without special economic knowledge—evaluate the profitability of investments.
However, the simple payback period does not take into account the change in money over time, and does not take into account that the benefits obtained in the future actually have less value than their current value. Therefore, to properly estimate the profitability of rainwater management measures, three indicators are also used: discounted payback period, net present value NPV, and financial benefit–cost ratio, where an estimate is made that takes into account the factor of money loss over time through the use of discounting calculus.
The following assumptions are made for the calculation:
  • The discount rate was assumed at 8%, based on the preferential loans offered for rainwater management by a large bank granting such loans (Bank Ochrony Środowiska S.A.) and by the regional environmental funds (WFOSiGW) [67,68,69];
  • The analysis period was assumed to be 25 years.

Simple Payback Period (PP)

Simple payback period (PP) is the time required for the sum of annual net cash flows to be equal to the initial investment. PP is calculated by dividing capital investment costs spent on implementing the green infrastructure elements by obtaining annual net cash flow, which is the difference between financial annual benefits and costs. In the case of rainwater retention investments, the analysis estimates two basic costs: capital expenditures and operating costs, as well as two possible sources of benefits: benefits from reduced retention fees and possible benefits from reduced tap water bills that may occur if rainwater is used for domestic purposes (watering green spaces, flushing toilets, etc.). PP is calculated from the formula [31]:
PP   = I N C F ,
where:
N C F = ( R + W ) O ,
  • PP payback period (years);
  • I  initial investment costs (EUR);
  • N C F  net cash flow (EUR);
  • R  annual benefits of stormwater fee reduction (EUR);
  • W  annual benefits of water bills reduction (EUR);
  • O annual O&M costs (EUR).

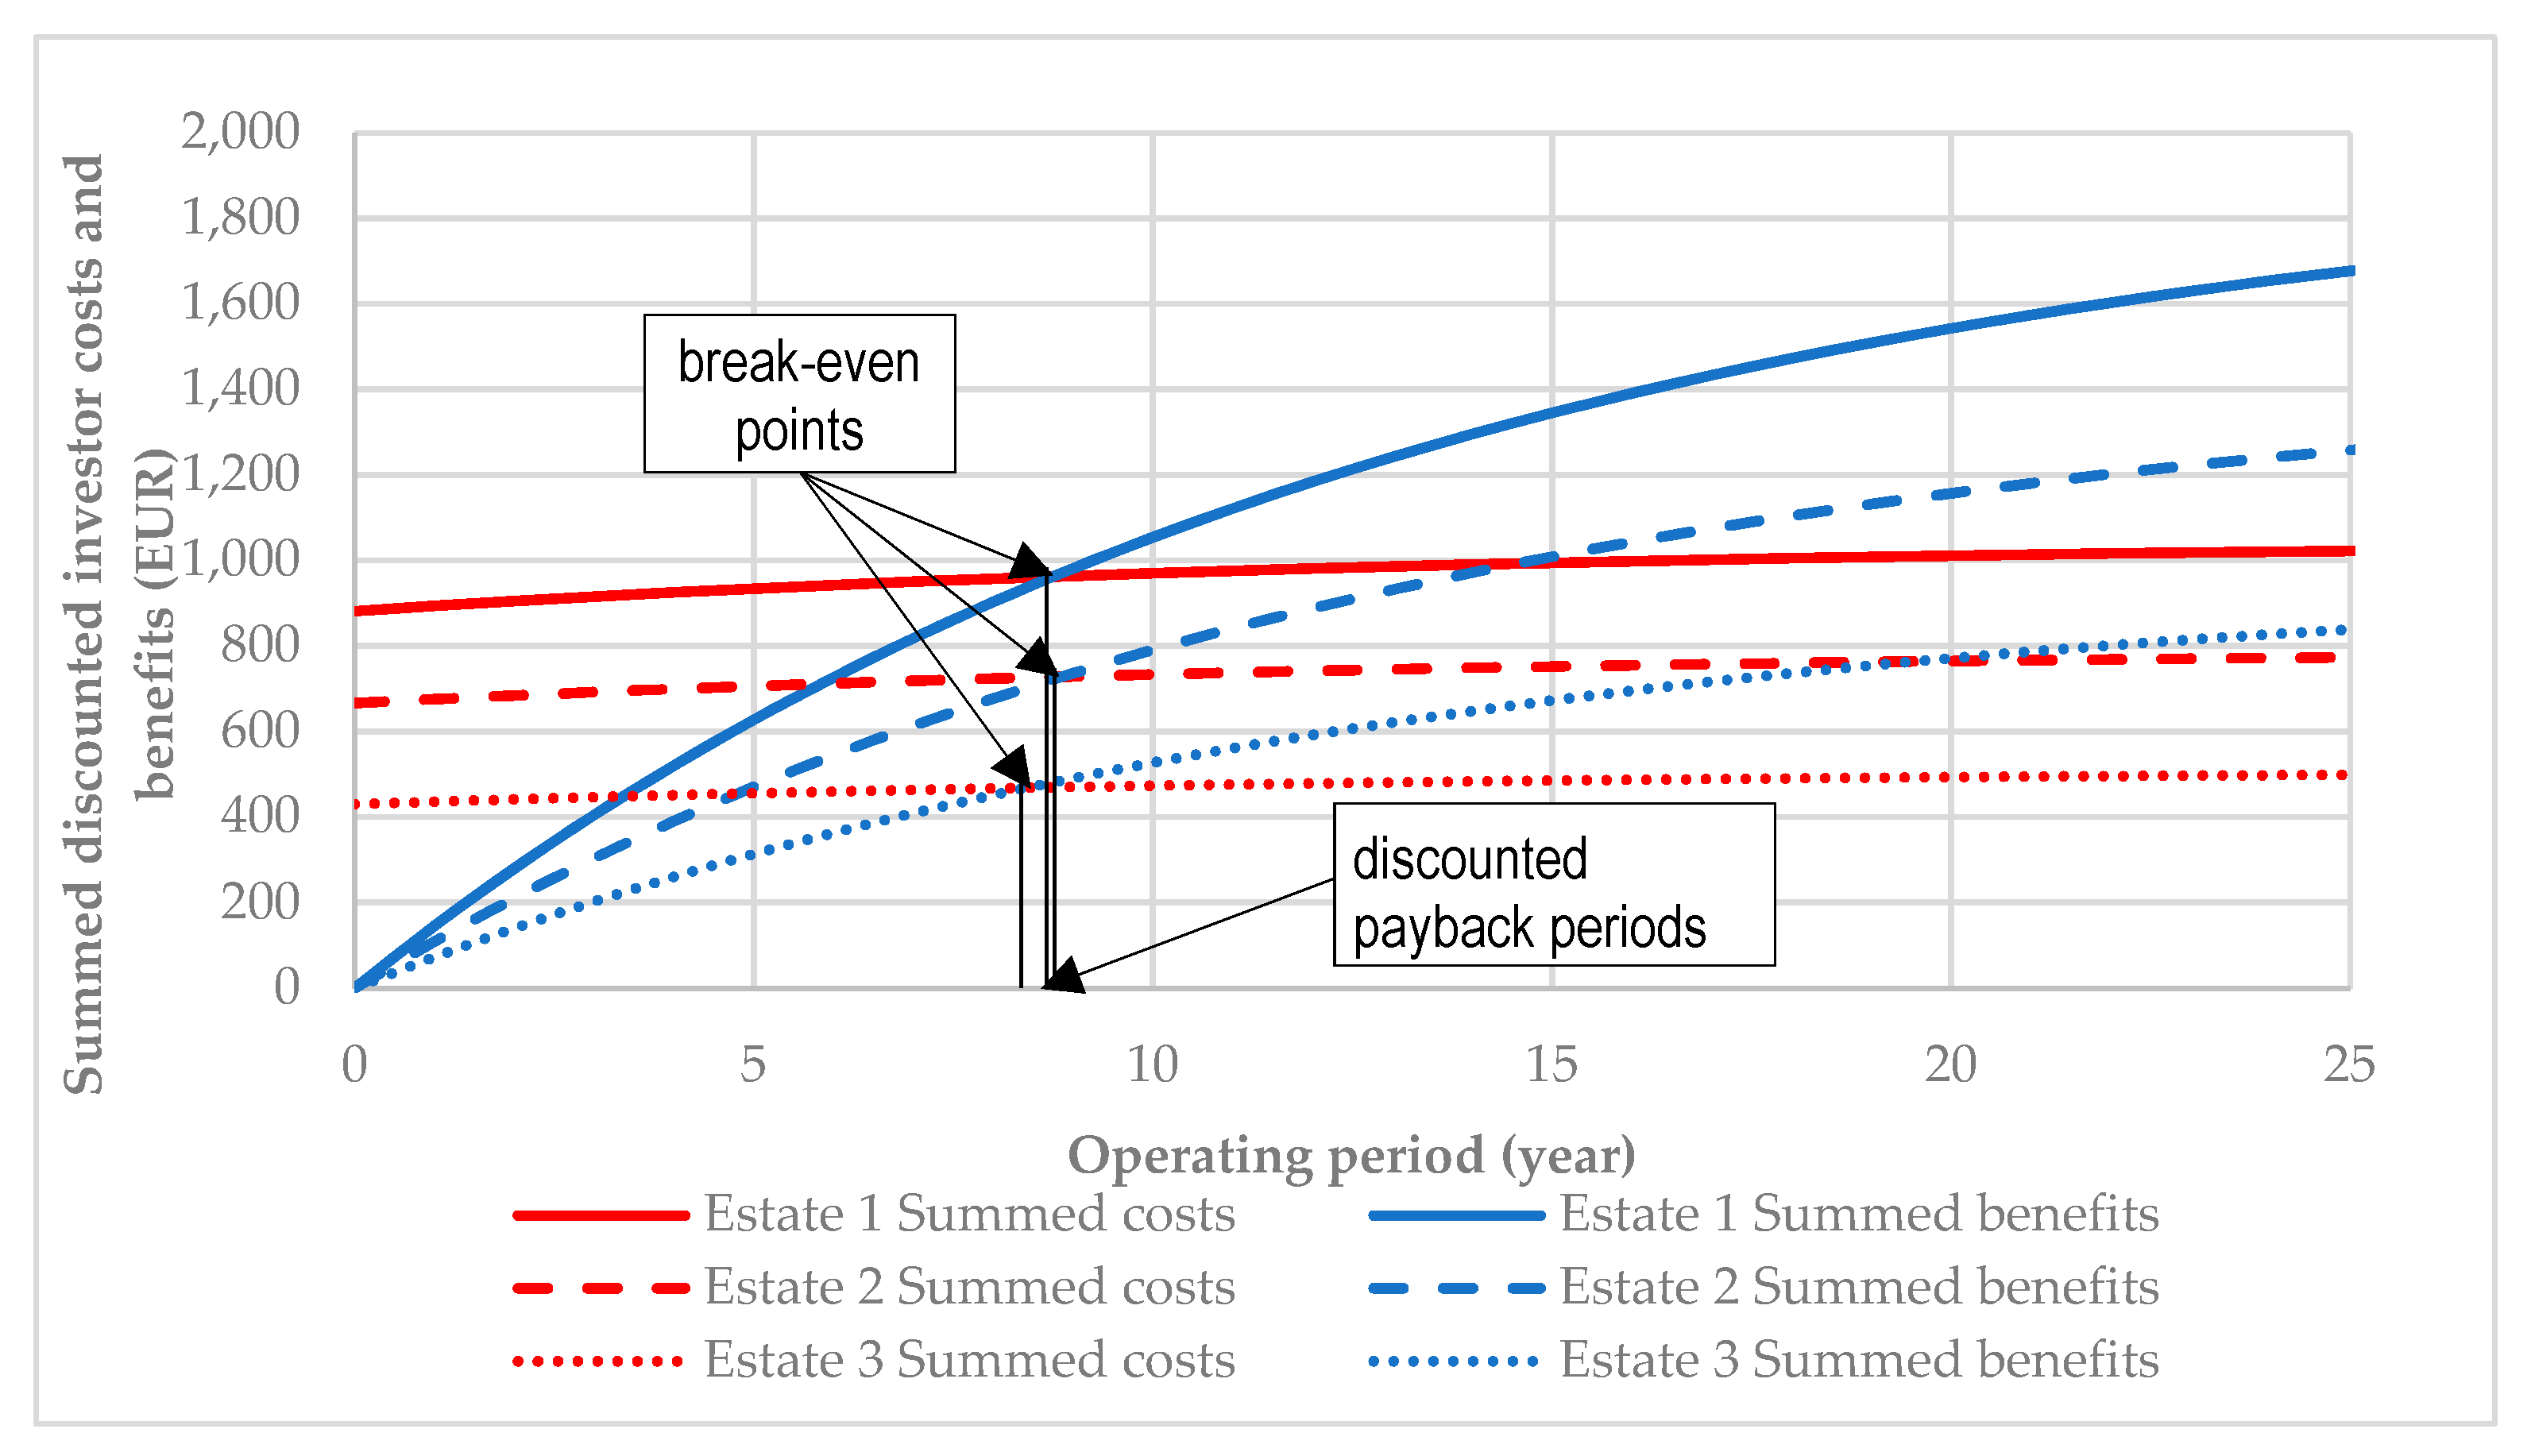
Discounted Payback Period (DPP)

The discounted payback period is calculated based on an analysis of the sum of discounted costs and benefits. It sets the time after which the discounted investment inflows offset the investments incurred for the project. The DPP value was determined as [32]:
DPP = 1 + n y n p ,
where:
  • DPP is discounted payback period (years);
  • n y  number of years after the initial investment at which the last negative value of cumulative cash flow occurs;
  • n value of cumulative cash flow at which the last negative value of cumulative cash flow occurs (EUR);
  • p  value of cash flow at which the first positive value of cumulative cash flow occurs (EUR).

Net Present Value (NPV)

NPV is a discount method that determines the summed net benefits of an investor [70]. An investment is profitable if the NPV is greater than zero. The NPV is expressed by the formula [27,32,71,72]:
NPV = t = 1 n N C F t ( 1 + r ) t I 0 ,
where:
  • I0 initial investment costs (EUR);
  • r discount rate (-);
  • t time in years from 0 to n;
  • n analysis period,
  • and other variables as given above.

Benefit–Cost Ratio (B/C)

In the original method, a benefit–cost ratio (B/C ratio) is calculated based on a full analysis of all benefits and costs, not only financial from the investor’s point of view, but also environmental and social benefits and costs. Such an analysis makes it possible to determine the economic viability of an investment. In this work, only the financial profitability of the investment is determined, and the ratio of financial benefits to financial costs of the investor is calculated. According to the ratio calculated in this way, the investment is financially profitable for the investor if the B/C is higher than zero. The B/C ratio is expressed by the formula [72,73]:
B / C = t = 1 n B t ( 1 + r ) t t = 1 n C t ( 1 + r ) t ,
where:
  • B t total financial benefits in year t;
  • C t total financial costs in year t;
  • and other variables as given above.

2.4. Assumed Investment Scenarios

For the purpose of evaluating the incentive function of economic instruments existing in Poland, the following calculations are made (the results are presented in individual subsections of the Results section):
  • Evaluation of the impact of national fees on property owners’ approach to investment by assessing the profitability of investment scenarios:
    • Minimalistic investment ensuring reduction in fee (low volume bioswale);
    • Investment in rainwater harvesting system (use of rainwater for watering greenery) providing fee reduction and savings on drinking water bills (underground tanks).
  • Evaluation of the impact of municipal economic incentives on the approach of real estate owners to investment by assessing the profitability of investment scenarios:
    • Minimalistic investment ensuring reduction in fee (low volume bioswale);
    • Investment consisting in disconnecting 20% of the roof surfaces (selected rainwater gutters) and direct runoff to the bioswale ensuring reduction in fee;
    • Investment in rainwater harvesting system (use of rainwater for watering greenery) providing fee reduction and savings on drinking water bills (underground tanks).
Each of these strategies is additionally analyzed in terms of its profitability, taking into account subsidy support (if such a program exists in the analyzed city).

3. Results

3.1. Simulation of the Impact of National Fees on Property Owners’ Approach to Investment

Property owners or, on their behalf, administrators of the sample estates analyzed are not subject to the fee for discharging rainwater into waterways, due to the assumption made above that they are located in areas covered by the stormwater drainage system and these properties discharge rainwater into the drainage system rather than into a watercourse. This situation is most common in urban areas.
Estates could theoretically be subject to such a fee if they were built in areas not yet equipped with sewer systems, such as new areas designated for development, and developers also had to implement as part of the development a system for draining rainwater from the estate into a watercourse occurring in close proximity. Table 9 below shows the calculation of such a fee.
The calculated fees are not high, especially in multi-family housing estates; for comparison, the average annual water bills for a three-person household with an average daily water consumption of 100 l/(d∙person) [43] and the price of tap water in Poznań 2.67 EUR/m3 (total price of water and sewage) is EUR 292.

3.1.1. Minimalistic Investment Scenario Ensuring Reduction in Fee

Simulations are carried out for property owners to undertake investments limiting rainwater drainage from their property to determine if the possible fee discounts would ensure the profitability of such investments. As mentioned in Section 2.3.2, it is assumed that property owners who wish to obtain a discount on fees will use the smallest and cheapest possible solution, which is a bioswale. Calculations are carried out for the capacity of the bioswale:
  • Minimalistic investment capacity scenario: 0.1% of the annual outflow;
  • Capacity scenario: 1% of the annual outflow.
The calculations carried out show that the benefits of the fee reduction are low compared to capital and O&M costs, making them a non-incentive for investment. Only investments with small retention capacities (0.1% of outflow capacity) have a simple payback period of less than 10 years that is attractive to investors (the actual discounted payback period is more than 16 years) (Table 10). Additionally, the NPV and B/C ratios show that the benefits to the investor during a period of 25 years are higher than the assumed costs (by about 14–17%, as evidenced by a B/C ratio higher than 1.0), so investments are profitable. Larger investments—at 1% of the outflow are unprofitable, NPV is negative during a period of 25 years, B/C reaches 0.11–0.12, indicating that benefits are only 11–12% of costs. The actual discounted payback period does not exist; investments are not repayable. In the case of the investment for estate 1 (bioswale with a capacity of 0.1% of the outflow), the total benefits offset the total costs in year 17—reaching the so-called break-even point (Figure 2a), and in the case of larger investments with a capacity of 1% of the outflow, the benefits from the fee reduction do not cover the O&M costs, the costs are not recoverable (Figure 2b).

3.1.2. RWH Scenario

Investing in RWH gives, in addition to lowering rainwater fees, a reduction in tap water bills. This scenario assumes:
  • Estate 1 and 2—one underground tank for the entire estate is implemented;
  • Estate 3—property owners individually realize small tanks on each of the 25 properties;
  • Required volume of tanks is calculated according to Formula (5);
  • Savings on drinking water bills are calculated according to Formula (10).
The results in Table 11 show that investments in Poznań and Trzcianka are not cost-effective. The investment and O&M costs of the underground tank are much higher than for the bioswale solution, and the additional benefits of savings from reduced tap water bills do not cover these costs. The benefits obtained for the large lower-cost systems for estates 1 and 2 are at the level of 87–93% of costs (value of B/C ratios), and for the decentralized small systems for estate 3 at the level of only 75–76%. The results for the cities of Poznań and Trzcianka are similar and less favorable than for Konin, which is explained by the fact that in this city the price of tap water is about 40% higher.
Domestic stormwater drainage fees are therefore not a significant incentive for investors to decide to retain rainwater on their property. This is due to the low base rate of the fee, as well as the rate discounts that can be obtained. The construction of the fee is also an important problem: fee rates are based on rainwater retention (Table 1), but the thresholds required for discounts are defined incorrectly. The construction of rate discounts was intended to promote the development of rainwater retention, but the following issues pose a serious problem:
  • The minimum retention level that entitles one to benefit from the first rate reduction of 10% has not been defined; this entitlement is gained by owning any device with a retention capacity of up to 10% of the annual outflow. Therefore, a 10% fee reduction can be gained by owning any rain retention device, such as a small rain barrel. The 10% discount can be obtained with both 0.1% retention and 9% annual outflow.
  • The second level of fee discount (a 20% reduction from the fee without retention facilities) can be achieved if the capacity of retention facilities exceeds 10% of the annual outflow from sealed surfaces—this requirement, on the other hand, seems highly inflated. Obtaining the second level of fee discount requires designing retention facilities with very large capacity, which, due to investment costs and design principles, does not happen in practice [23],
  • The basic problem is also how to determine the capacity of the devices in relation to the volume of annual outflow. In practice, this is because the capacity of a device can be used many times a year and allows it to retrieve more water than their nominal capacity. Determining the capacity of devices that use infiltration is also a problem. The general provisions of the law are, unfortunately, not accompanied by any guidelines for calculating the capacity of such devices.

3.2. Simulation of the Impact of Municipal Incentives on Property Owners’ Approach to Investment

The analyzed cities have introduced local fees for discharging stormwater into sewer systems. The fee rates and the discounts to which residents are entitled are presented above in Section 2.2.1, Section 2.2.2, Section 2.2.3. Below, Table 12 contains the fees calculated in accordance with the applicable rules. When calculating the fee for the example estates in Konin, discounts were applied due to the existence of biologically active areas for estate 1: 5% discount (biologically active area of 20%), for estate 2: 10% discount (biologically active area of 40%), and for estate 3: 15% discount (biologically active area of 60%).
As the data in Table 12 shows, city fees vary widely, the highest fees are charged in Poznan and are almost two times higher than in Konin and three times higher than in Trzcianka in all the analyzed estates. Comparing the amounts of fees to the annual water bills (EUR 292), it should be noted that the stormwater fees charged are between 2% and 37% of the annual water bill, so they can be high. The highest fees are incurred for single-family properties, the highest being in Poznań.
It should also be remembered that most Polish cities have not introduced such fees. This raises, of course, on a national scale, the problem of high inequality in fees for public services.

3.2.1. Minimalistic Investment Scenario Ensuring Reduction in Municipal Rainwater Fee

An analysis of the possible minimalist strategies of property owners to enable them to obtain a discount on the fee, which are the result of the adopted rules for granting discounts in the analyzed cities, is performed below:
  • Poznań—property owners can obtain a reduction in the fee rate from 1.25 to 1.22 EUR/m3 if they install devices with a capacity of up to 10% of annual outflow (see Table 3). There is no minimum threshold defined for the required capacity (as in the case of national fees), so there is a simulation of investments with a small capacity of 0.1%, with low construction and operating costs, a bioswale.
  • Konin—property owners can obtain a discount on the fee rate by 10% if they install devices with a capacity of more than 5% of annual outflow (see Table 4), capacities at 5% for estates 1, 2, and 3 are very high values of the magnitude of: 204, 153, and 102 m3, respectively. The location of such large bioswales, particularly in heavily built-up estates 1 and 2, may be difficult or even impossible to implement, but a simulation of their profitability was carried out (capacities of 1 m3 more than 5% of the outflow were used, so as to exceed the 5% threshold).
  • Trzcianka—the fee system does not provide for any discounts (see Table 5), so no action was simulated, as this is what property owners most often do when reading the billing rules for rainwater drainage, which do not provide for any reduction in the fee.
Minimalist strategies in Konin are unprofitable (Table 13); such large investments are not paid off for property owners, as evidenced by negative NPVs and B/C values below 1 (B/C of 0.07 shows that aggregate benefits represent only 7% of aggregate costs).
Minimalist strategies have a chance to be implemented in Poznań, where a discount is possible once any retention facilities are installed. The simulated construction of bioswales with a capacity of 0.1% of the outflow from the estate can pay off for investors; the simple payback period is only about 6 years, the actual discounted payback period at the assumed discount rate is higher at 8–9 years (Figure 3), but still remains attractive. Profitability is also evidenced by other indicators, NPV is positive—cumulative discounted returns during a period of 25 years are from EUR 340 to EUR 655, and financial benefits are 63–68% higher than costs (B/C ratio values).
Two of the analyzed cities (Poznań and Konin) offer subsidy programs for rainwater management, but Konin only supports the construction of sealed tanks, so in this strategy only property owners in Poznań could count on a subsidy. According to the information presented in Section 2.2.1, the subsidy is at the level of 80% of the investment cost, which significantly increases the profitability of the analyzed investments by shortening payback periods (investments pay for themselves as early as the second year of use) and significantly increasing the values of NPV and B/C ratios. The inclusion of subsidies is shown in Table 14.

3.2.2. Investment Scenario Consisting in Disconnecting 20% of the Roof Surfaces

As mentioned above, the rules for calculating fees list—in Poznań and Konin—the possible discounts after installing devices with a certain retention capacity (or, in the case of Konin, additionally—discounts for biologically active area and the presence of an adequate number of large trees on the plot). In Trzcianka, it is not possible to obtain a fee discount. However, in each of these cities, one pays for the impervious surface from which runoff into the sewer system occurs. Thus, another strategy to reduce the fee is therefore to disconnect the impervious surface from the sewer system, which, unfortunately, the fee regulations for discharging rainwater into the sewer system do not clearly inform about.
The simulation of such a strategy—property owners disconnect 20% of the roof surfaces (selected rainwater gutters) and direct runoff to the bioswale instead of the sewer system—is presented below. The fee will not be charged on these surfaces. For individual estates, this is the disconnection of the following surfaces:
  • Estate 1, roof surfaces 3000 m2, disconnection 600 m2;
  • Estate 2, roof surfaces 4000 m2, disconnection 800 m2;
  • Estate 3, roof surfaces 3200 m2, disconnection 640 m2.
For the purpose of sizing bioswales, the assumptions required for their sizing were made and shown in Table 15.
According to Formula (6), the required volume of the bioswale was calculated as the maximum accumulated volume of rainwater between 5 and 4320 min (rainfall intensities in Table 2). The infiltration area was selected at 15% of the drainage area, which ensures maximum filling of the basin up to 20 cm. The curve of the dependence of the volume of rainwater stored in the basin as a function of rainfall duration has a convex shape with respect to the time axis and has a local maximum corresponding to the duration of critical rain and the required capacity of the bioswale [59].
The maximum volumes of bioswales required to collect runoff that occurred from a rainfall of 60 min duration and intensity of 96.81 l/(s∙ha) are, for individual estates 1, 2, and 3: 18, 24, and 19 m3, respectively (Figure 4).
A calculation of the cost-effectiveness of their construction is carried out below (Table 16).
Disconnection strategies are also unprofitable (Table 16), the most favorable are in the case of Poznan, but the payback can only be after about 30 years; B/C of 0.96–0.97 shows that the benefits are at 96–97% of the cost; NPV is negative, but the level of loss from EUR 137 to EUR 234 is low compared to the negative NPV for other cities.
Property owners in Poznań can count on co-financing at the level of 80% of the investment. The consideration of subsidies is presented in Table 17.
The results in Table 17 show that support at 80% of investment costs is very high and results in a large reduction in the payback period to 2.5 years, providing investors with a high NPV and a high three times excess of benefits over costs over a 25-year period.

3.2.3. RWH Scenario

In this scenario, investments were assumed analogous to those in Section 3.1.2.
Such a strategy allows for obtaining a reduction in the municipal fee only in Poznan; in Konin the reductions begin after exceeding 5% of the outflow, and the calculated required volumes of tanks are smaller; in Trzcianka no reduction in the fee is envisaged (Table 18).
The cost-effectiveness analysis was also carried out taking into account subsidy programs for rainwater management. In the case of Poznan, the subsidy has a much higher level than in Konin. The results are shown in Table 19.
The inclusion of subsidy programs in Table 19 shows the achievement of high profitability for all investments.

4. Discussion

This work shows how existing economic instruments in Poland motivate property owners to invest in rainwater management on their own properties. Two types of investments were analyzed: bioswale as one of the lowest cost in construction and its operation is a green-infrastructure measure, and rainwater harvesting solution using rainwater for green irrigation. This type of investment was simulated to determine the response to existing economic incentives—possible discounts on national and municipal rainwater drainage fees and municipal subsidy programs for rainwater management from three cities of different sizes selected from the Greater Poland region. Analyses were carried out for three types of development with different intensity, sealing of land, and number of residents.
An analysis of the national fees for discharging rainwater into watercourses highlights that these are not typical common user fees paid by property owners, as they usually discharge rainwater into sewers rather than watercourses. Such a fee is therefore rather paid by sewerage system administrators, although such a situation may arise when the area is not covered by a sewerage system, and if a watercourse flows in the vicinity of a residential area then rainwater can be discharged into it (with the appropriate water permit). Simulation of such fees showed that the rates of such fees are low (0.16 EUR/m3); annual fees per household for estates with an area of 1 hectare are 2–13 EUR (depending on the type of development—lower for multi-family housing). This level of fee does not represent a significant payment in the household budget and does not motivate investment. A possible fee reduction of 0.016 EUR/m3 (for a single household, a savings of 0.37 to 2.20 EUR) for realizing retention facilities with a capacity of up to 10% of annual outflow is also not motivating. However, it has been shown that since no minimum required capacity has been established, it is profitable to realize small investments (bioswales with a capacity of 0.1% of annual outflow were analyzed), but larger investments do not pay off for investors. The problem of low rates and discounts and the lack of minimum requirements was analyzed in earlier works [23,35,39]. The possible profitability of investments in light of the benefits of reducing such fees was also shown, but only in combination with savings in tap water fees, which was the main factor determining the scale of benefits [74].
Municipal fees for discharging rainwater into the sewer system are not mandatory in Poland; selected cities have introduced them. For the purposes of this study, the fee systems introduced in Poznan, Konin, and Trzcianka were analyzed. Their motivational function is firstly deterrent—through the basic fee rate, the cities adopt rates at different levels—among the three analyzed, the highest are in Poznań and the basic fee calculated per one household, in the case of single-family housing, is significant, amounting to more than 108 EUR; in comparison, the annual water bill for a three-person household is at the level of 292 EUR. In Konin, the calculated fee was twice less, and in Trzcianka, three times less. When setting rates, analyses of household affordability of stormwater fees in a municipality should be carried out [75].
The second aspect of the fee system is the discounts that can be obtained; here also the solutions varied, Trzcianka does not offer any discounts—incentives for property owners to manage rainwater on their own land. The discount system in Konin is extensive, clearly promoting the maintenance of biologically active areas and large trees on the property, but the discount system for the construction of rainwater retention devices only allows a discount when the devices have a capacity of more than 5% of the property’s annual outflow. This is a very high requirement if by capacity of the devices one means their nominal capacity, and this is what the instructions for declaring a property for connection to the sewer system indicate. For this reason, the investments that property owners would make to obtain such a fee discount are uneconomic; such large investments require large capital outlays and are not recouped from the fee discounts even during a period of 25 years. In Poznan, the discount system does not put a threshold on the minimum required capacity, so small investments show profitability and can be undertaken by investors. RWH systems with greenery watering were also analyzed, simulating the additional benefits of reducing tap water bills; the scale of solutions adopted included capacities in line with the greenery watering requirements found in the housing estates analyzed. At this scale, RWH systems were not cost-effective. Although municipal fee rates and discounts differentiate the results obtained, the decisive influence in this case is the benefit of reduced water bills. Other studies of the cost-effectiveness of RWH systems (mainly using rainwater for toilet flushing) for Polish conditions also showed the impact of the municipal fee on increasing cost-effectiveness [31]. Other RWH studies show: (1) for single-family and multi-family developments in Poland—not cost-effective for single-family developments [34,74] and cost-effective for multi-family developments, but also mainly depend on the price of tap water in a city [74]; (2) cost effectiveness for large water recovery systems for office buildings with a recovery period of 7 years [76]. Some studies have also raised issues of investment subsidies, showing that support of 25–50% makes investments feasible [34]. Analyses made in this work also accounted for subsidy programs; the rules of municipal subsidy programs are very different, those that Poznań and Konin have introduced also differ. Poznań provides support for almost all types of rainwater management investments, Konin only for sealed tanks, which greatly limits the development of green infrastructure in this city. The programs also differ in the level of support (% share of costs incurred) and the maximum possible subsidy. As shown, subsidies strongly affect the profitability of investments. Of course, their strength of impact depends on their design. Their strong motivating function is also evidenced by the popularity of the exhausted My Water national program, and surveys of residents’ expectations of how to support their investments show that this is the most desirable type of economic incentives [77,78].
The economic instruments discussed in the paper are not the only instruments that motivate property owners to manage rainwater in a sustainable way. Their introduction should be supported in particular by broad campaigns promoting appropriate behavior: explaining the individual, social, and environmental benefits of retaining and using rainwater for the purpose of watering greenery and its other uses such as flushing toilets, cleaning and washing, and use as drinking water or for hygienic purposes. Research even proves that educational campaigns without the support of economic instruments give positive results and motivate the owners to undertake investments (e.g., installing rain barrels) [26,79], while their lack may result in ineffective use of the existing subsidy programs [80]. The current geopolitical situation, the energy crisis and the dynamic increase in prices, which may contribute to a significant increase in the price of tap water (calculated in Poland together with the cost of wastewater), may be another reason to pay attention to the real benefits of retaining and using free water resources, rainwater in particular, in terms of ensuring access to water in crisis conditions.

5. Conclusions

Sustainable management of rainwater is possible, among others, thanks to national and local strategies and regulations that create economic incentives [81,82,83,84]. The analyses carried out on the motivational function of existing economic instruments in Poland lead to the following general conclusions proving the existence of significant gaps in the stormwater management policy:
  • National fees for rainwater discharge have rates that are too low and improperly structured discount systems (no minimum capacity for the first discount, high second discount, and subsequent thresholds for the next levels of discount) to be a real incentive to undertake investments.
  • National grant programs: Although the program My Water was supposed to be 5 years old, its budget was exhausted in the first 2 years and not renewed for subsequent years; the budget should be renewed annually. The strength of this program was also education and promotion of sustainable rainwater management, so it should be continued.
  • Municipal fees for stormwater discharge to the sewer system: These are not common in Poland; cities are not obliged to introduce them, their absence results in drainage systems being financed from the municipal budget, or in the case of combined sewers, from water and sewage fees. Municipal fees are a more socially equitable solution for charging for such services, encouraging the reduction in impervious areas, and disconnection from municipal stormwater drainage systems [20]. Municipal fees are a strong economic incentive, as shown for the example rates in Poznan. The higher the rate, the stronger the incentive, but of course, when setting household-level affordability rates should be considered [75]. In addition to the rate, the incentive is a system of discounts that provides a stimulus to undertake investments that retain rainwater on the property, but their design must take into account the actual possibility of carrying out such investments (negative example of excessively high capacity thresholds in Konin, and a lack of minimum requirements in Poznan). In all analyzed charging rules, there is no information about the possibility of disconnection from the sewerage system, although this is an obvious way to reduce fees. Such information should be included.
  • Municipal grant programs are a response to an identified significant barrier to the development of sustainable stormwater management, which is a lack of funding [77,78,82,83,85]. Programs tend to operate in large cities; small municipalities are unlikely to have the resources to set them up, creating an obvious situation of inequity on a broader national scale. Subsidy programs, a share of the cost of investment is a strong incentive to increase cost-effectiveness, but of course dependent on the level of funding. As the analyses have shown, these programs can be aimed at supporting only selected types of investments (the Konin example), not necessarily bringing the greatest economic and environmental benefits.

Funding

This research received no external funding.

Institutional Review Board Statement

Not applicable.

Informed Consent Statement

Not applicable.

Data Availability Statement

Not applicable.

Conflicts of Interest

The author declares no conflict of interest.

References

  1. Parikh, P.; Taylor, M.A.; Hoagland, T.; Thurston, H.; Shuster, W. Application of market mechanisms and incentives to reduce stormwater runoff. An integrated hydrologic, economic and legal approach. Environ. Sci. Policy 2005, 8, 133–144. [Google Scholar] [CrossRef]
  2. US EPA. Managing Wet Weather with Green Infrastructure-Incentive Mechanisms: Municipal Handbook. Incentive Mechanisms; United States Environmental Protection Agency: Washington, WA, USA, 2009.
  3. Buurman, J.J.G.; Lee, T.K.; Iftekhar, M.S.; Yu, S.M. Strategies to promote the adoption of sustainable drainage by private developers: A case study from Singapore. Urban Water J. 2020, 18, 61–67. [Google Scholar] [CrossRef]
  4. Lieberherr, E.; Green, O. Green Infrastructure through Citizen Stormwater Management: Policy Instruments, Participation and Engagement. Sustainability 2018, 10, 2099. [Google Scholar] [CrossRef] [Green Version]
  5. Bąk, J.; Barjenbruch, M. Benefits, Inconveniences, and Facilities of the Application of Rain Gardens in Urban Spaces from the Perspective of Climate Change&mdash-A Review. Water 2022, 14, 1153. [Google Scholar]
  6. Fontecha, J.E.; Nikolaev, A.; Walteros, J.L.; Zhu, Z. Scientists wanted? A literature review on incentive programs that promote pro-environmental consumer behavior: Energy, waste, and water. Socioecon. Plann. Sci. 2022, 82, 101251. [Google Scholar] [CrossRef]
  7. Liberalesso, T.; Oliveira Cruz, C.; Matos Silva, C.; Manso, M. Green infrastructure and public policies: An international review of green roofs and green walls incentives. Land Use Policy 2020, 96, 104693. [Google Scholar] [CrossRef]
  8. Lu, Z.; Noonan, D.; Crittenden, J.; Jeong, H.; Wang, D. Use of Impact Fees To Incentivize Low-Impact Development and Promote Compact Growth. Environ. Sci. Technol. 2013, 47, 10744–10752. [Google Scholar] [CrossRef] [Green Version]
  9. Fu, X.; Hopton, M.E.; Wang, X.; Goddard, H.; Liu, H. A runoff trading system to meet watershed-level stormwater reduction goals with parcel-level green infrastructure installation. Sci. Total Environ. 2019, 689, 1149–1159. [Google Scholar] [CrossRef]
  10. Pappalardo, V.; La Rosa, D. Policies for sustainable drainage systems in urban contexts within performance-based planning approaches. Sustain. Cities Soc. 2020, 52, 101830. [Google Scholar] [CrossRef]
  11. Valderrama, A.; Levine, L.; Bloomgarden, E.; Bayon, R.; Wachowicz, K.; Kaiser, C. Creating Clean Water Cash Flows Developing Private Markets for Green Stormwater Infrastructure in Philadelphia. Available online: https://www.nrdc.org/resources/creating-clean-water-cash-flows-developing-private-markets-green-stormwater-infrastructure (accessed on 22 August 2022).
  12. Dougherty, S.; Hammer, R.; Valderrama, A. How to: Stormwater Credit Trading Programs. Available online: https://www.nrdc.org/resources/stormwater-credit-trading-programs (accessed on 22 August 2022).
  13. Goddard, H.C. Cap-and-Trade for Stormwater Management. In Economic Incentives for Stormwater Control; Thurston, H.W., Ed.; CRC Press: Boca Raton, FL, USA, 2011; pp. 221–242. ISBN 9780429106194. [Google Scholar]
  14. Thurston, H.W.; Goddard, H.C.; Szlag, D.; Lemberg, B. Controlling Storm-Water Runoff with Tradable Allowances for Impervious Surfaces. J. Water Resour. Plan. Manag. 2003, 129, 409–418. [Google Scholar] [CrossRef]
  15. Parikh, P.; Taylor, M.A.; Hoagland, T.; Thurston, H.W.; Shuster, W. At the intersection of hydrology, economics, and law: Application of market mechanisms and incentives to reduce stormwater runoff. In Economic Incentives for Stormwater Control; CRC Press: Boca Raton, FL, USA, 2011; pp. 167–192. ISBN 9781439845615. [Google Scholar]
  16. Bassi, A.; Cuéllar, A.; Pallaske, G.; Wuennenberg, L. Stormwater Markets: Concepts and Applications. 2017. Available online: https://www.iisd.org/publications/report/stormwater-markets-concepts-and-applications (accessed on 22 August 2022).
  17. Jia, Z.; Xu, C.; Luo, W. Optimizing Green Infrastructure Implementation with a Land Parcel-Based Credit Trading Approach on Different Spatial Scales. Water Resour. Manag. 2020, 34, 1709–1723. [Google Scholar] [CrossRef]
  18. Xu, Q.; Jia, Z.; Tang, S.; Luo, W.; Xu, C. Achieving Urban Stormwater Mitigation Goals on Different Land Parcels with a Capacity Trading Approach. Water 2019, 11, 1091. [Google Scholar] [CrossRef] [Green Version]
  19. Campbell, W.; Bradshaw, J. Western Kentucky University Stormwater Utility Survey 2021. SEAS Fac. Publ. 2021, 6, 1506–1513. [Google Scholar]
  20. Novaes, C.; Marques, R. Stormwater Utilities: A Sustainable Answer to Many Questions. Sustainability 2022, 14, 6179. [Google Scholar] [CrossRef]
  21. Zhao, J.Z.; Fonseca, C.; Zeerak, R. Stormwater Utility Fees and Credits: A Funding Strategy for Sustainability. Sustainability 2019, 11, 1913. [Google Scholar] [CrossRef] [Green Version]
  22. Jawecki, B.; Sobota, M.; Burszta-Adamiak, E. The influence of new legal regulations on the method of determining the amount of fees for discharging rain water and snow water to water. Ekon. I Sr. Econ. Environ. 2019, 1, 37–56. [Google Scholar]
  23. Godyń, I.; Muszyński, K.; Grela, A. Assessment of the Impact of Loss-of-Retention Fees on Green Infrastructure Investments. Water 2022, 14, 560. [Google Scholar] [CrossRef]
  24. Mrozik, K. Problems of Local Flooding in Functional Urban Areas in Poland. Water 2022, 14, 2453. [Google Scholar] [CrossRef]
  25. Cook, S.; Van Roon, M.; Ehrenfried, L.; Lagro, J.; Yu, Q. WSUD “Best in Class”—Case Studies from Australia, New Zealand, United States, Europe, and Asia. In Approaches to Water Sensitive Urban Design; Sharma, A.K., Gardner, T., Begbie, D., Eds.; Elsevier: Amsterdam, The Netherlands, 2019; pp. 561–585. [Google Scholar]
  26. Thurston, H.W.; Taylor, M.A.; Shuster, W.D.; Roy, A.H.; Morrison, M.A. Using a reverse auction to promote household level stormwater control. Environ. Sci. Policy 2010, 13, 405–414. [Google Scholar] [CrossRef]
  27. Malinowski, P.A.; Schwarz, P.M.; Wu, J.S. Fee Credits as an Economic Incentive for Green Infrastructure Retrofits in Stormwater-Impaired Urban Watersheds. J. Sustain. Water Built Environ. 2020, 6, 04020015. [Google Scholar] [CrossRef]
  28. Tasca, F.A.; Assunção, L.B.; Finotti, A.R. International experiences in stormwater fee. Water Sci. Technol. 2018, 2017, 287–299. [Google Scholar] [CrossRef]
  29. Qiao, X.-J.; Kristoffersson, A.; Randrup, T.B. Challenges to implementing urban sustainable stormwater management from a governance perspective: A literature review. J. Clean. Prod. 2018, 196, 943–952. [Google Scholar] [CrossRef]
  30. Qiao, X.-J.; Liu, L.; Kristoffersson, A.; Randrup, T.B. Governance factors of sustainable stormwater management: A study of case cities in China and Sweden. J. Environ. Manag. 2019, 248, 109249. [Google Scholar] [CrossRef]
  31. Musz-Pomorska, A.; Widomski, M.K.; Gołebiowska, J. Financial Sustainability of Selected Rain Water Harvesting Systems for Single-Family House under Conditions of Eastern Poland. Sustainability 2020, 12, 4853. [Google Scholar] [CrossRef]
  32. Stec, A.; Zeleňáková, M. An Analysis of the Effectiveness of Two Rainwater Harvesting Systems Located in Central Eastern Europe. Water 2019, 11, 458. [Google Scholar] [CrossRef] [Green Version]
  33. Stec, A.; Słyś, D. Financial and Social Factors Influencing the Use of Unconventional Water Systems in Single-Family Houses in Eight European Countries. Resources 2022, 11, 16. [Google Scholar] [CrossRef]
  34. Słyś, D.; Stec, A. Centralized or decentralized rainwater harvesting systems: A case study. Resources 2020, 9, 5. [Google Scholar] [CrossRef] [Green Version]
  35. Godyń, I.; Grela, A.; Stajno, D.; Tokarska, P. Sustainable Rainwater Management Concept in a Housing Estate with a Financial Feasibility Assessment and Motivational Rainwater Fee System Efficiency Analysis. Water 2020, 12, 151. [Google Scholar] [CrossRef] [Green Version]
  36. Ministerstwo Klimatu I Środowiska. Priority Program “My Water”. Available online: https://www.gov.pl/web/susza/program-priorytetowy-moja-woda (accessed on 22 August 2022).
  37. Ministerstwo Klimatu I Środowiska-Portal. Sukces Programu “Moja Woda” W Edycji 2020. Available online: https://www.gov.pl/web/klimat/sukces-programu-moja-woda-w-edycji-2020 (accessed on 22 August 2022).
  38. Sinha, S.K.; Ridgway, J.W.; Edstrom, J.E.; Andersen, J.; Mulvaney, P.; Quigley, M.; Rothstein, E. A Business Model Framework for Market-Based Private Financing of Green Infrastructure; Environmental Consulting & Technology, Inc.: Gainesville, FL, USA, 2014; 46p. [Google Scholar]
  39. Godyń, I. Opłaty za wody opadowe a finansowanie kanalizacji deszczowej i zielonej infrastruktury. In Współczesne Problemy Gospodarki Wodnej w Kontekście Zagospodarowania Przestrzennego; Walczykiewicz, T., Ed.; IMGW-PIB: Warszawa, Poland, 2020; pp. 101–110. ISBN 9788364979378. [Google Scholar]
  40. Evaluating Stormwater Infrastructure Funding and Financing. A Report Form the Stromwater Infrastructure Finance Task Force Workgroup of the Environmental Financial Advisory Board. Available online: https://www.epa.gov/waterfinancecenter/evaluating-stormwater-infrastructure-funding-and-financing-task-force (accessed on 22 August 2022).
  41. Rozporządzenie Rady Ministrów z Dnia 22 Grudnia 2017 r. w Sprawie Jednostkowych Stawek Opłat Za Usługi Wodne (Dz. U. z 2017r. poz. 2502) (The Coucil of Ministers’ Decree of 22 December 2017 Regarding Unit Rates of Fees for Water Services). Available online: https://isap.sejm.gov.pl/isap.nsf/download.xsp/WDU20170002502/O/D20172502.pdf (accessed on 22 August 2022).
  42. NIK about Rain and Stormwater Management-Supreme Audit Office. Available online: https://www.nik.gov.pl/en/news/nik-about-rain-and-stormwater-management.html (accessed on 23 November 2021).
  43. Statistics Poland-Local Data Bank. Available online: https://bdl.stat.gov.pl/bdl/start (accessed on 13 September 2022).
  44. Aquanet. Taryfy/Cennik. Available online: https://www.aquanet.pl/dla-klienta/taryfy-cennik/ (accessed on 1 November 2022).
  45. Urząd Miasta Poznania. Mała Retencja-Program Dotacyjny|Poznan.pl. Available online: https://www.poznan.pl/mim/main/-,p,46898,58474.html (accessed on 1 November 2022).
  46. ZDM Koninie. Opłaty. Available online: https://zdm-konin.pl/oplaty/ (accessed on 1 November 2022).
  47. Urząd Miejski w Koninie. Dofinansowanie Do Małej Retencji. Available online: https://www.konin.pl/index.php/jeden-news-1432/dofinansowanie-do-malej-retencji.html (accessed on 1 November 2022).
  48. Zakład Inżynierii Komunalnej Sp. z o.o. Taryfy Dla Zbiorowego Zaopotarzenia W Wodę I Zbiorowego Odprowadzania Ścieków-ZIK TRZCIANKA. Available online: http://zik.trzcianka.com.pl/cennik-wody-od-2021/ (accessed on 1 November 2022).
  49. Dhakal, N.; Fang, X.; Cleveland, T.G.; Thompson, D.B.; Asquith, W.H.; Marzen, L.J. Estimation of Volumetric Runoff Coefficients for Texas Watersheds Using Land-Use and Rainfall-Runoff Data. J. Irrig. Drain. Eng. 2012, 138, 43–54. [Google Scholar] [CrossRef] [Green Version]
  50. Zhou, H.; Wang, Z.; Wu, X.; Chen, Y.; Zhong, Y.; Li, Z.; Chen, J.; Li, J.; Guo, S.; Chen, X. Spatiotemporal Variation of Annual Runoff and Sediment Load in the Pearl River during 1953–2017. Sustainability 2019, 11, 5007. [Google Scholar] [CrossRef] [Green Version]
  51. Edel, R. Odwodnienie Dróg, 4th ed.; Wydawnictwa Komunikacji i Łączności: Warszawa, Poland, 2017; ISBN 978-83-206-1987-4. [Google Scholar]
  52. Instytut Meteorologii i Gospodarki Wodnej Państwowy Instytut Badawczy. Normy Klimatyczne 1991–2020. Available online: https://klimat.imgw.pl/pl/climate-normals/OPAD_SUMA (accessed on 1 November 2022).
  53. Houle, J.J.; Roseen, R.M.; Ballestero, T.P.; Puls, T.A.; Sherrard, J. Comparison of Maintenance Cost, Labor Demands, and System Performance for LID and Conventional Stormwater Management. J. Environ. Eng. 2013, 139, 932–938. [Google Scholar] [CrossRef] [Green Version]
  54. Lejcuś, K.; Burszta-Adamiak, E.; Wróblewska, K.; Orzeszyna, H.; Śpitalniak, M.; Marczak, D.; Misiewicz, J.; Dobrzańska, J. Zasady Zrównoważonego Gospodarowania Wodami Opadowymi Na Obszarze Zabudowanym; Urząd Miejski Wrocławia: Wrocław, Poland, 2021. [Google Scholar]
  55. The Green Values® Stormwater Management Calculator Methods. Available online: https://greenvalues.cnt.org/Green-Values-Calculator-Methodology.pdf (accessed on 12 September 2022).
  56. SEKOCENBUD. Biuletyn Cen Obiektów Budowlanych BCO Cz. II 2 Kw. 2022 (Price Bulletin of Buildings BCO Part II 2rd Q 2022). Available online: https://www.sekocenbud.pl/sklep/sprzedaz-wysylkowa/sekocenbud-informacje-cenowe/biuletyny-zagregowane/biuletyn-cen-obiektow-budowlanych-bco-cz-iii-2-kw-2021.html (accessed on 1 August 2022).
  57. Underground Rainwater Tanks-For Every Ground Conditions. Available online: https://aquatechnika.com.pl/gb/rainwater-tanks/underground-rainwater-tanks (accessed on 23 July 2022).
  58. Suchanek-Gabzdyl, E. Methodology for determining the tank capacity for collecting rainwater for irrigation of green areas based on DIN 1989-1:2002-04. Ecol. Eng. Environ. Technol. 2020, 21, 12–16. [Google Scholar] [CrossRef]
  59. Händel, F.; Engelmann, C.; Klotzsch, S.; Fichtner, T.; Binder, M.; Graeber, P.W. Evaluation of Decentralized, Closely-Spaced Precipitation Water and Treated Wastewater Infiltration. Water 2018, 10, 1460. [Google Scholar] [CrossRef]
  60. Bogdanowicz, E.; Stachy, J. Maximum rainfall in Poland-a design approach. In Extremes of the Extremes: Extraordinary Floods; Snorrason, A., Finnsdóttir, H.P., Moss, M.E., Eds.; IAHS: Wallingford, UK, 2002; pp. 15–18. [Google Scholar]
  61. Barszcz, M. Analysis of freshets caused by heavy rainfall in small urbanized drainage basin of Służewiecki Stream. Stud. Geotech. Mech. 2009, 31, 3–15. [Google Scholar]
  62. Wałęga, A.; Radecki Pawlik, A.; Cupak, A.; Hathaway, J.; Pukowiec, M. Influence of Changes of Catchment Permeability and Frequency of Rainfall on Critical Storm Duration in an Urbanized Catchment—A Case Study, Cracow, Poland. Water 2019, 11, 2557. [Google Scholar] [CrossRef] [Green Version]
  63. Kotowski, A. Podstawy Bezpiecznego Wymiarowania Odwodnień Terenów-Tom I-Sieci Kanalizacyjne (Kotowski) [Wyd. II] Wydawnictwo Seidel-Przywecki # Biblioteka Inżynierii Środowiska # Woda, Ścieki, Osady. Available online: https://seidel-przywecki.pl/pl/p/Podstawy-bezpiecznego-wymiarowania-odwodnien-terenow-Tom-I-Sieci-Kanalizacyjne-Kotowski-wyd.-II/428 (accessed on 16 October 2019).
  64. Szpakowski, W.; Szydłowski, M. Extraordinary Rainfalls in Gdansk (Northern Poland) in the 21st. In Proceedings of the 15th International Symposium on Water Management and Hydraulic Engineering, Primošten, Croatia, 6–8 September 2017. [Google Scholar]
  65. PN-EN 752: 2017; Drain and Sewer Systems Outside Buildings-Sewer System Management. Polish Committee for Standardization: Warszawa, Poland, 2017.
  66. Przedsiębiorstwo Wodociągów i Kanalizacji Sp. z o.o. Taryfy Za Wodę I Ścieki. Available online: https://pwik-konin.com.pl/taryfa/ (accessed on 1 November 2022).
  67. Bank Ochrony Środowiska. EKOpożyczka “Nasza Woda”. Available online: https://www.bosbank.pl/klient-indywidualny/pozyczki-i-kredyty/eko-inwestycje/pozyczka-nasza-woda (accessed on 31 August 2022).
  68. Bank Ochrony Środowiska. EKOkredyt Z Dopłatami. Available online: https://www.bosbank.pl/klient-indywidualny/pozyczki-i-kredyty/eko-inwestycje/wfos-bgk (accessed on 31 August 2022).
  69. Wody Opadowe I Roztopowe 2022-WFOŚiGW Poznań. Available online: https://www.wfosgw.poznan.pl/programy/wody-opadowe-i-roztopowe-2022/ (accessed on 31 August 2022).
  70. Valderrama, A.; Levine, L.; Yeh, S.; Bloomgarden, E. Financing Stormwater Retrofits in Philadelphia and Beyond. Nat. Resour. Def. Counc. 2012, 1, 34. [Google Scholar]
  71. Morales-Pinzón, T.; Lurueña, R.; Rieradevall, J.; Gasol, C.M.; Gabarrell, X. Financial feasibility and environmental analysis of potential rainwater harvesting systems: A case study in Spain. Resour. Conserv. Recycl. 2012, 69, 130–140. [Google Scholar] [CrossRef]
  72. Amos, C.C.; Rahman, A.; Gathenya, J.M. Economic Analysis and Feasibility of Rainwater Harvesting Systems in Urban and Peri-Urban Environments: A Review of the Global Situation with a Special Focus on Australia and Kenya. Water 2016, 8, 149. [Google Scholar] [CrossRef]
  73. Leiva, E.; Rodríguez, C.; Sánchez, R.; Serrano, J. Light or Dark Greywater for Water Reuse? Economic Assessment of On-Site Greywater Treatment Systems in Rural Areas. Water 2021, 13, 3637. [Google Scholar] [CrossRef]
  74. Sakson, G. Cost analysis of a rainwater harvesting system in Poland. In E3S Web of Conferences; EDP Sciences: Les Ulis, France, 2018; Volume 45, p. 00078. [Google Scholar] [CrossRef]
  75. Porse, E.; Kerner, M.; Shinneman, J.; Kaplan, J.; Stone, S.; Cadenasso, M.L. Stormwater utility fees and household affordability of urban water services. Water Policy 2022, 24, 998–1013. [Google Scholar] [CrossRef]
  76. Bator, M.; Piechurski, F. Analiza kosztów systemu odzysku wody deszczowej dla budynku biurowego. Instal 2019, nr 3, 24–27. [Google Scholar]
  77. Mantey, D. Changes in the approach to rainwater and meltwater management in the suburban area from a resident perspective. Pr. I Stud. Geogr. 2022, 67, 131–150. [Google Scholar]
  78. Stec, A. Rainwater harvesting and greywater recycling as alternative water resources: A survey of public opinion. E3S Web Conf. 2018, 45, 00090. [Google Scholar] [CrossRef] [Green Version]
  79. Mayer, A.L.; Shuster, W.D.; Beaulieu, J.J.; Hopton, M.E.; Rhea, L.K.; Roy, A.H.; Thurston, H.W. Environmental Reviews and Case Studies: Building Green Infrastructure via Citizen Participation: A Six-Year Study in the Shepherd Creek (Ohio). Environ. Pract. 2017, 14, 57–67. [Google Scholar] [CrossRef] [Green Version]
  80. Burszta-Adamiak, E. The financial mechanisms of urban stormwater management. In Sustainable Development 5. Applications. Water in the City; Bergier, T., Kronenberg, J., Wagner, I., Eds.; The Sendzimir Foundation: Kraków, Poland, 2014; pp. 57–70. ISBN 978-83-62168-05-7. [Google Scholar]
  81. Porse, E.C. Stormwater Governance and Future Cities. Water 2013, 5, 29–52. [Google Scholar] [CrossRef] [Green Version]
  82. Wihlborg, M.; Sörensen, J.; Alkan Olsson, J. Assessment of barriers and drivers for implementation of blue-green solutions in Swedish municipalities. J. Environ. Manag. 2019, 233, 706–718. [Google Scholar] [CrossRef] [PubMed]
  83. Dhakal, K.P.; Chevalier, L.R. Managing urban stormwater for urban sustainability: Barriers and policy solutions for green infrastructure application. J. Environ. Manag. 2017, 203, 171–181. [Google Scholar] [CrossRef]
  84. Geyler, S.; Bedtke, N.; Gawel, E. Sustainable Stormwater Management in Existing Settlements-Municipal Strategies and Current Governance Trends in Germany. Sustainability 2019, 11, 5510. [Google Scholar] [CrossRef] [Green Version]
  85. Li, C.; Peng, C.; Chiang, P.C.; Cai, Y.; Wang, X.; Yang, Z. Mechanisms and applications of green infrastructure practices for stormwater control: A review. J. Hydrol. 2019, 568, 626–637. [Google Scholar] [CrossRef]
Figure 1. Location of cities included in the analysis.
Water 14 03817 g001
Figure 2. Summed discounted investor costs and benefits for estate 1: (a) for minimalistic investment—bioswale with a capacity of 0.1% of the annual outflow; (b) for investment—bioswale with a capacity of 1% of the annual outflow.
Water 14 03817 g002
Figure 3. Summary discounted costs and benefits of minimalistic scenario for estate 1, 2, and 3 in Poznań.
Water 14 03817 g003
Figure 4. Results of calculations for determining the required volume of bioswale for estates 1, 2, and 3.
Water 14 03817 g004
Table 1. The level of fee rates in 2022 depending on the capacity of the facilities related to annual runoff [41].
CategoryFee Rate (EUR /m3)
Without water retention facilities from impervious areas0.1611
With water retention facilities with a capacity ofup to 10% of the annual outflow0.1342
above 10% of the annual outflow0.1074
above 20% of the annual outflow0.0805
above 30% of the annual outflow0.0161
Note(s): average EUR/PLN exchange rate in January–July 2022: 1 EUR = 4.6562 PLN.
Table 2. The level of fee rates in 2022 depending on the capacity of the facilities related to the annual outflow [41].
CategoryFee Rate (EUR/m2)
Without water retention facilities from sealed surfaces permanently connected to the ground0.1074
With water retention facilities with a capacity of:up to 10% of the annual outflow0.0644
from 10 to 30% of the annual outflow0.0322
Table 3. Rates of fees for rainwater discharge into the sewer system in Poznań [44].
CategoryCombined Sewer System
(EUR/m3)
Stormwater Sewer System
(EUR/m3)
Without water retention facilities from sealed surfaces permanently connected to the ground1.361.25
With water retention facilities with a capacity of:up to 10% of the annual outflow1.321.22
from 10 to 20% of the annual outflow1.281.18
from 20 to 30% of the annual outflow1.241.14
above 30% of the annual outflow1.151.05
Table 4. Rates of fees for the discharge of rainwater into the sewer system in Konin [46].
CategoryRate
(EUR/m3)
Without water retention facilities from sealed surfaces permanently connected to the ground0.86
Rate discounts associated with the use of retention devicesDiscount
(%)
Capacity of water retention facilities:above 5% of the annual outflow10%
above 10% of the annual outflow20%
above 20% of the annual outflow30%
above 30% of the annual outflow40%
Rate discounts related to biologically active areaDiscount
(%)
Biologically active area:above 20% of the property area5%
above 40% of the property area10%
above 60% of the property area15%
above 80% of the property area20%
Discount for locating on the property a minimum of one tree whose trunk circumference measured at a height of 130 cm exceeds 100 cm per each 800 m2 of property area10%
Table 5. Rate of fee for discharge of rainwater into the sewer system in Trzcianka [48].
CategoryRate
(EUR/m2)
Fee rate for the discharge of rainwater and snowmelt into the stormwater drainage system from 1 m2 of contaminated area0.21
Table 6. Assumed example: three estates typical of urban development.
Estate 1Estate 2Estate 3
SpecificationIntensive multi-family developmentMulti-family developmentSingle-family semi-detached development
Water 14 03817 i001Water 14 03817 i002Water 14 03817 i003
Share of sealed areas(%)80%60%40%
Sealed surface(m2)800060004000
Green space area(m2)200040006000
Number of households(-)30018025
Table 7. Capital and O&M costs assumed in the analysis [54,55,56,57].
SpecificationUnit Capital CostO&M Cost
(% of Capital Costs)
Bioswale(EUR/m3)2151.5%
Underground tank (above 1 m3)(EUR/m3)4305%
Underground tank (above 10 m3)(EUR/m3)3655%
Note(s): Source: [54,55,56,57].
Table 8. Rainfall intensities q t , p of different event durations t for a 10-year event (p = 10%).
Duration t(min)5101530456090120
q t , p (l/(s∙ha))371.39260.49205.05130.92112.7796.8171.6557.72
Table 9. National fees for rainwater discharge to the sewer system.
SpecificationEstate 1Estate 2Estate 3
Total annual precipitation on paved surfaces(m3/year)430432282152
Runoff from sealed surfaces(m3/year)408930672044
Fee for rainwater discharge from the estate(EUR/year)659494329
Fee per household(EUR/year)2.202.7413.17
Table 10. Cost-effectiveness of rainwater management using retention through bioswales with capacities of 0.1% and 1% of the annual outflow.
SpecificationMinimalistic
Capacity Scenario: 0.1% of the Annual Outflow
Capacity Scenario: 1% of the Annual Outflow
Estate 1Estate 2Estate 3Estate 1Estate 2Estate 3
Capacity of bioswale(m3)4.13.12.0413120
Fee (EUR/year)549412274549412274
Fee per household(EUR/year)1.832.2910.981.832.2910.98
Investment cost(EUR)882667430881566654300
O&M costs(EUR/year)1310613210065
Benefits of fee reduction(EUR/year)511383256511383256
PP(years)9.1 9.2 8.9 ***
DPP(years)16.917.316.1******
NPV(EUR)149 106 87 −9055 −6853 −4403
B/C 1.151.141.170.110.110.12
Note(s): *—costs are higher than benefits; in no year does the investor make a profit. **—costs are not recovered due to the decreasing present value of the net benefit over time at the assumed discount rate, even for a period of 40 years NPV remains negative.
Table 11. Cost-effectiveness of the RWH scenario.
SpecificationEstate 1Estate 2Estate 3
Tank capacity(m3)8.015.022.0
Retention capacity as % of annual outflow(%)0.4%1.0%2.3%
Investment cost(EUR)344054759460
O&M costs(EUR/year)172274473
Benefits of fee reduction(EUR/year)1108255
Benefits of reducing water billsPoznań(EUR/year)320641961
Konin(EUR/year)4519021354
Trzcianka(EUR/year)325650976
PPPoznań(years)13.312.217.4
Konin8.87.710.1
Trzcianka13.011.916.9
DPPPoznań(years)***
Konin15.712.321.3
Trzcianka***
NPVPoznań(EUR)−684−678−3663
Konin7122115526
Trzcianka−633−576−3509
B/CPoznań(-)0.870.920.75
Konin1.141.251.04
Trzcianka0.880.930.76
Note(s): *—costs are not recovered due to the decreasing present value of the net benefit over time at the assumed discount rate, even for a period of 40 years NPV remains negative.
Table 12. Fees for rainwater discharge in the analyzed cities.
SpecificationEstate 1Estate 2Estate 3
Local fee for discharging rainwater into the sewer systemPoznań(EUR/year)538940422695
Konin(EUR/year)333723711493
Trzcianka(EUR/year)16491237825
Fee per householdPoznań(EUR/year)1822108
Konin(EUR/year)111360
Trzcianka(EUR/year)5733
Table 13. Evaluation of the profitability of using minimalist investment strategies that provide municipal rainwater fee discounts.
SpecificationEstate 1Estate 2Estate 3
Investment ensuring that the minimum fee discount is obtainedPoznań(m3)4.13.12.0
Konin(m3)205154103
Investment costPoznań(EUR)882667430
Konin(EUR)43,86032,89521,930
O&M costsPoznań(EUR)13106
Konin(EUR)658493329
Benefits of fee reductionPoznań(EUR)15711879
Konin(EUR)351263176
PPPoznań(years)6.16.26.0
Konin***
DPPPoznań(years)8.78.88.4
Konin***
NPVPoznań(EUR)655485340
Konin−47,133−35,350−23,567
B/CPoznań(-)1.641.631.68
Konin0.070.070.07
Note(s): *—costs are higher than benefits; in no year does the investor make a profit.
Table 14. Evaluation of the profitability of using minimalist investment strategies that provide municipal rainwater fee discounts by taking into account municipal subsidies in Poznań.
SpecificationEstate 1Estate 2Estate 3
Investment ensuring that the minimum fee discount is obtained(m3)4.13.12.0
Investment cost(EUR)882667430
Subsidies(EUR)704533344
O&M costs(EUR)13106
Benefits of fee reduction(EUR)15711879
PP(years)1.21.21.2
DPP(years)1.31.31.3
NPV(EUR)13591017683
B/C(-)5.295.255.42
Table 15. Input data adopted for bioswale sizing.
Estate 1Estate 2Estate 3
Disconnected roof area A(m2)600800640
Runoff coefficient ψ(-)0.95
Effective drained area A r e d (m2)570760608
Infiltration area A f (m2)9012096
Maximum filling(m)0.20
Water-saturated hydraulic conductivity of subsurface material k f (m/s)5 × 10−5
Safety factor f z (-)1.2
Table 16. Evaluation of the profitability for disconnecting 20% of the roof area.
SpecificationEstate 1Estate 2Estate 3
InvestmentDisconnected roof area(m2)600800640
Bioswale capacity(m3)182419
Investment cost(EUR)387051604085
O&M costs(EUR)587761
Benefits of fee reductionPoznań(EUR)404539431
Konin(EUR)250316239
Trzcianka(EUR)124165132
PPPoznań(years)11.211.211.0
Konin20.121.623.0
Trzcianka58.858.857.7
DPPPoznań(years)29.129.127.8
Konin***
Trzcianka***
NPVPoznań(EUR)−175−234−137
Konin−1818−2612−2189
Trzcianka−3169−4226−3331
B/CPoznań(-)0.960.960.97
Konin0.600.560.54
Trzcianka0.290.290.30
Note(s): *—costs are not recovered due to the decreasing present value of the net benefit over time at the assumed discount rate, even for a period of 40 years NPV remains negative.
Table 17. Evaluation of the profitability for disconnecting 20% of the roof area including co-financing offered in Poznań.
SpecificationEstate 1Estate 2Estate 3
InvestmentDisconnected roof area(m2)600800640
Bioswale capacity(m3)182419
Investment cost(EUR)387051604085
Subsidies(EUR)309641283268
O&M costs(EUR)587761
Benefits of fee reduction(EUR)404539431
PP(years)2.22.22.2
DPP(years)2.52.52.5
NPV(EUR)292138943131
B/C 3.103.103.13
Table 18. Evaluation of the profitability of RWH strategy.
SpecificationEstate 1Estate 2Estate 3
Tank capacity(m3)8.015.022.0
Retention capacity as % of annual outflow(%)0.4%1.0%2.3%
Investment costs(EUR)344054759460
O&M costs(EUR/year)172274473
Benefits of municipal fee reductionPoznań(EUR/year)15711879
Konin(EUR/year)000
Trzcianka(EUR/year)000
Benefits of reducing water billsPoznań(EUR/year)320641961
Konin(EUR/year)4519021354
Trzcianka(EUR/year)325650976
PPPoznań(years)11.311.316.7
Konin12.38.710.7
Trzcianka22.314.518.7
DPPPoznań(years)***
Konin*15.1*
Trzcianka***
NPVPoznań(EUR)−178−299−3410
Konin−4601236−60
Trzcianka−1805−1454−4095
B/CPoznań(-)0.970.960.77
Konin0.911.151.00
Trzcianka0.660.830.72
Note(s): *—costs are not recovered due to the decreasing present value of the net benefit over time at the assumed discount rate, even for a period of 40 years NPV remains negative.
Table 19. Evaluation of the profitability of RWH strategy by taking into account subsidy programs.
SpecificationEstate 1Estate 2Estate 3
Tank capacity(m3)8.015.022.0
Retention capacity as % of annual outflow(%)0.4%1.0%2.3%
Investment costs(EUR)344054759460
O&M costs(EUR/year)172274473
SubsidiesPoznań(EUR/year)275243807568
Konin(EUR/year)240838336615
Benefits of municipal fee reductionPoznań(EUR/year)15711879
Konin(EUR/year)000
Benefits of reducing water billsPoznań(EUR/year)320641961
Konin(EUR/year)4519021354
PPPoznań(years)2.32.33.3
Konin4.63.93.2
DPPPoznań(years)2.42.44.0
Konin5.64.63.6
NPVPoznań(EUR)257440814158
Konin194850686555
B/CPoznań(-)2.022.011.60
Konin1.541.781.83
Publisher’s Note: MDPI stays neutral with regard to jurisdictional claims in published maps and institutional affiliations.

