
Anti-Clogging Performance Optimization for Shunt-Hedging Drip Irrigation Emitters Based on Water–Sand Motion Characteristics


 , and
, and
Abstract
1. Introduction
2. Materials and Methods
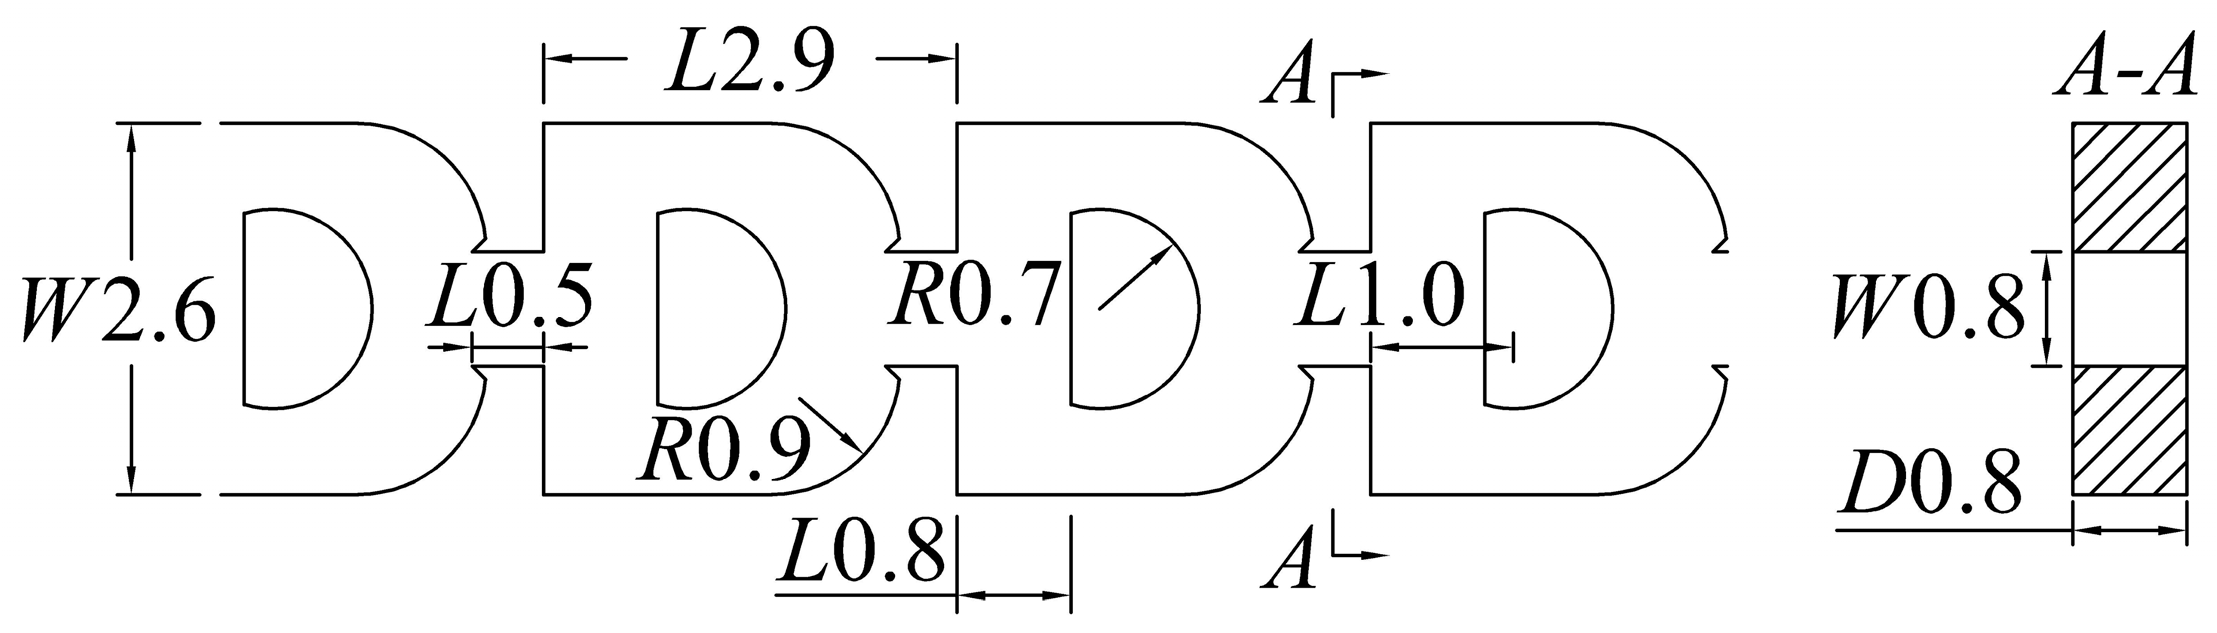
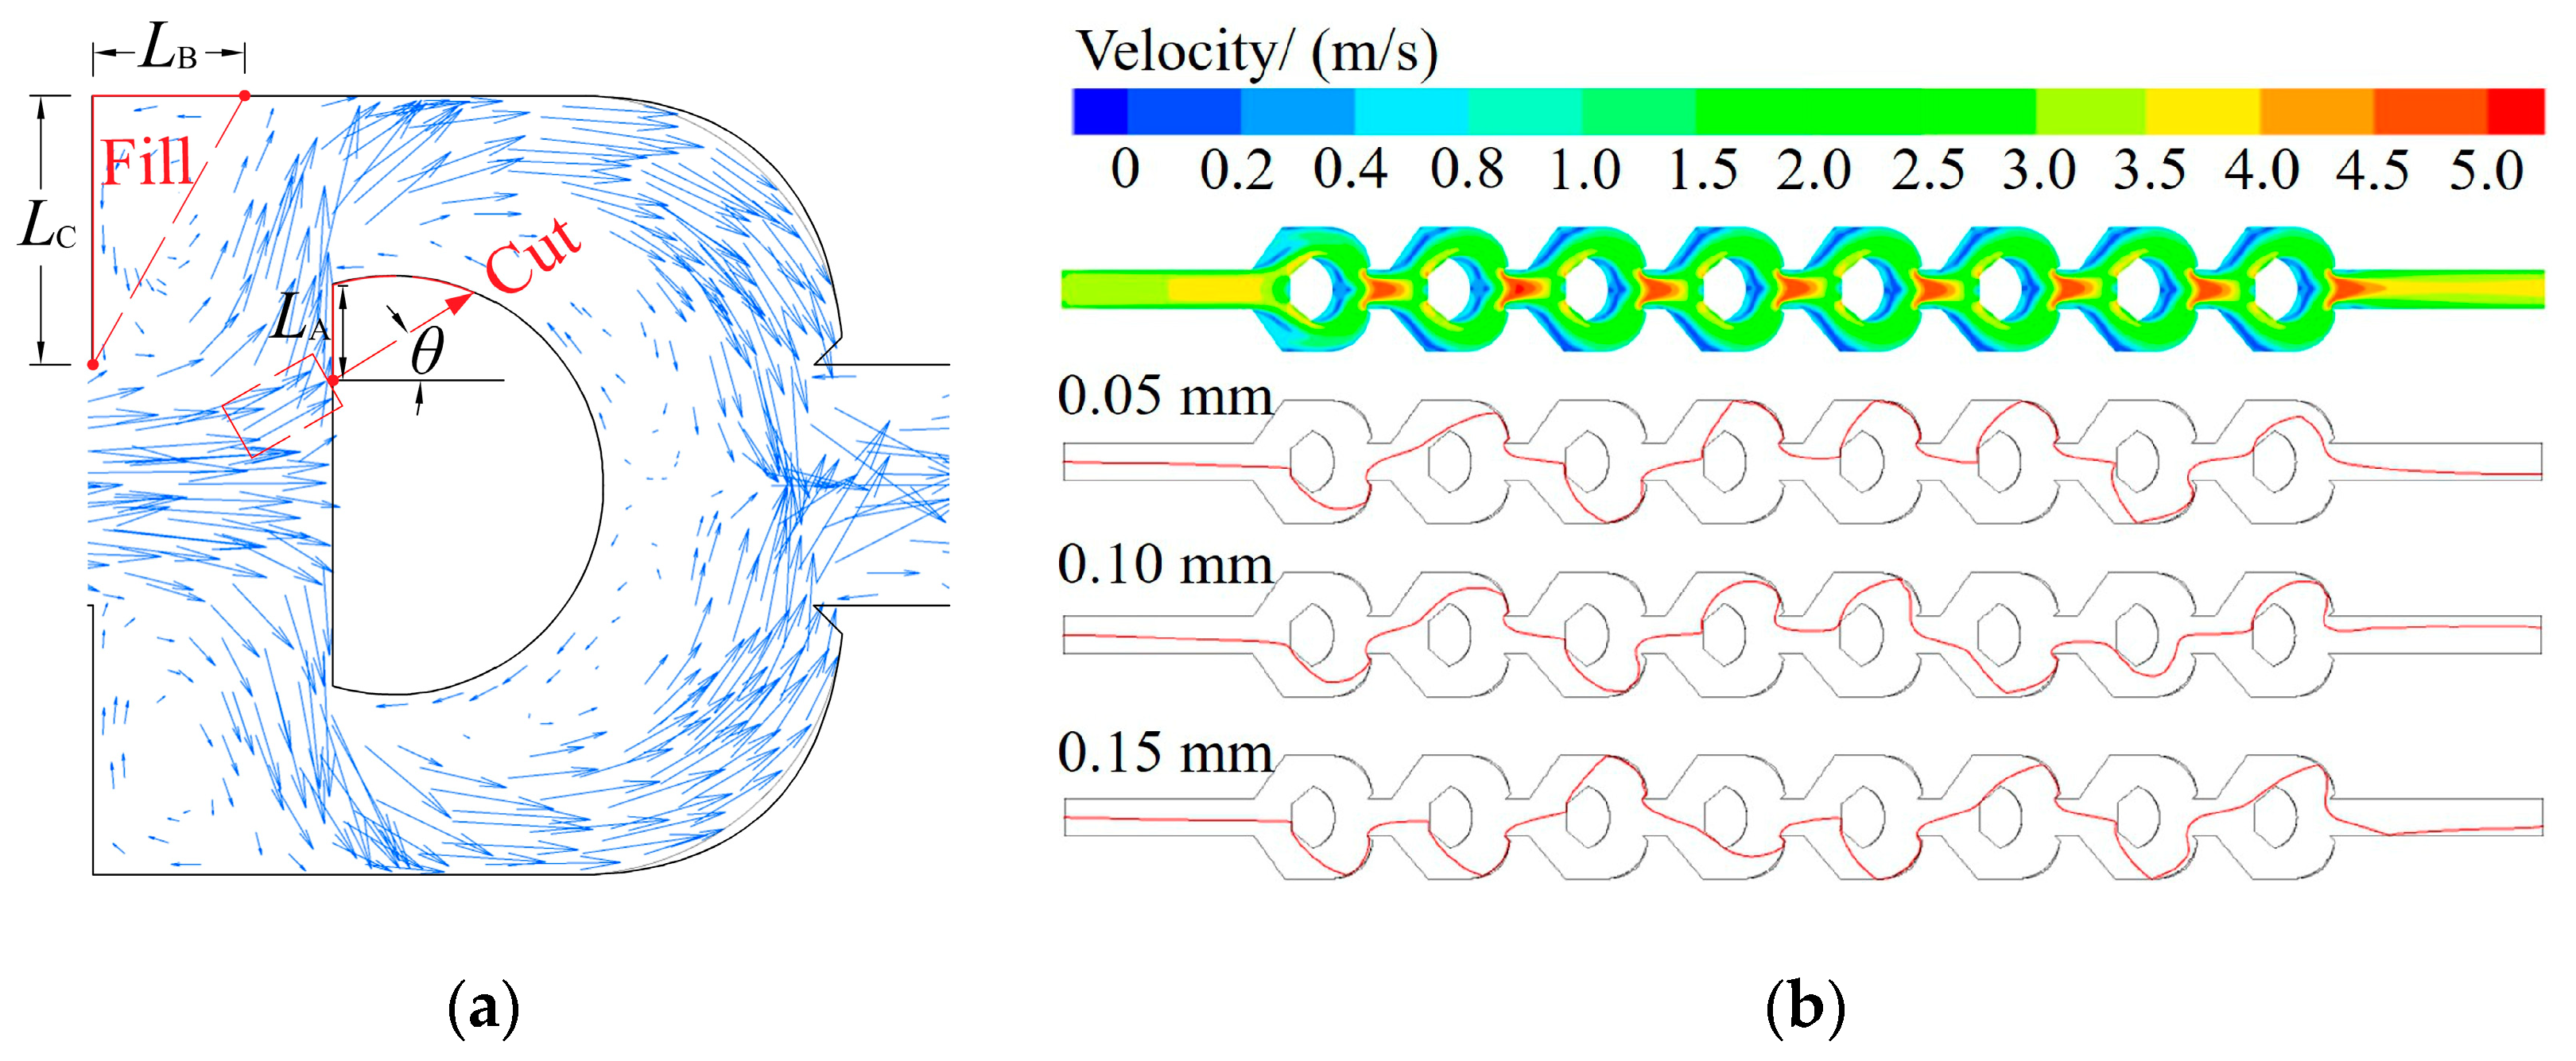
2.1. Physical Model
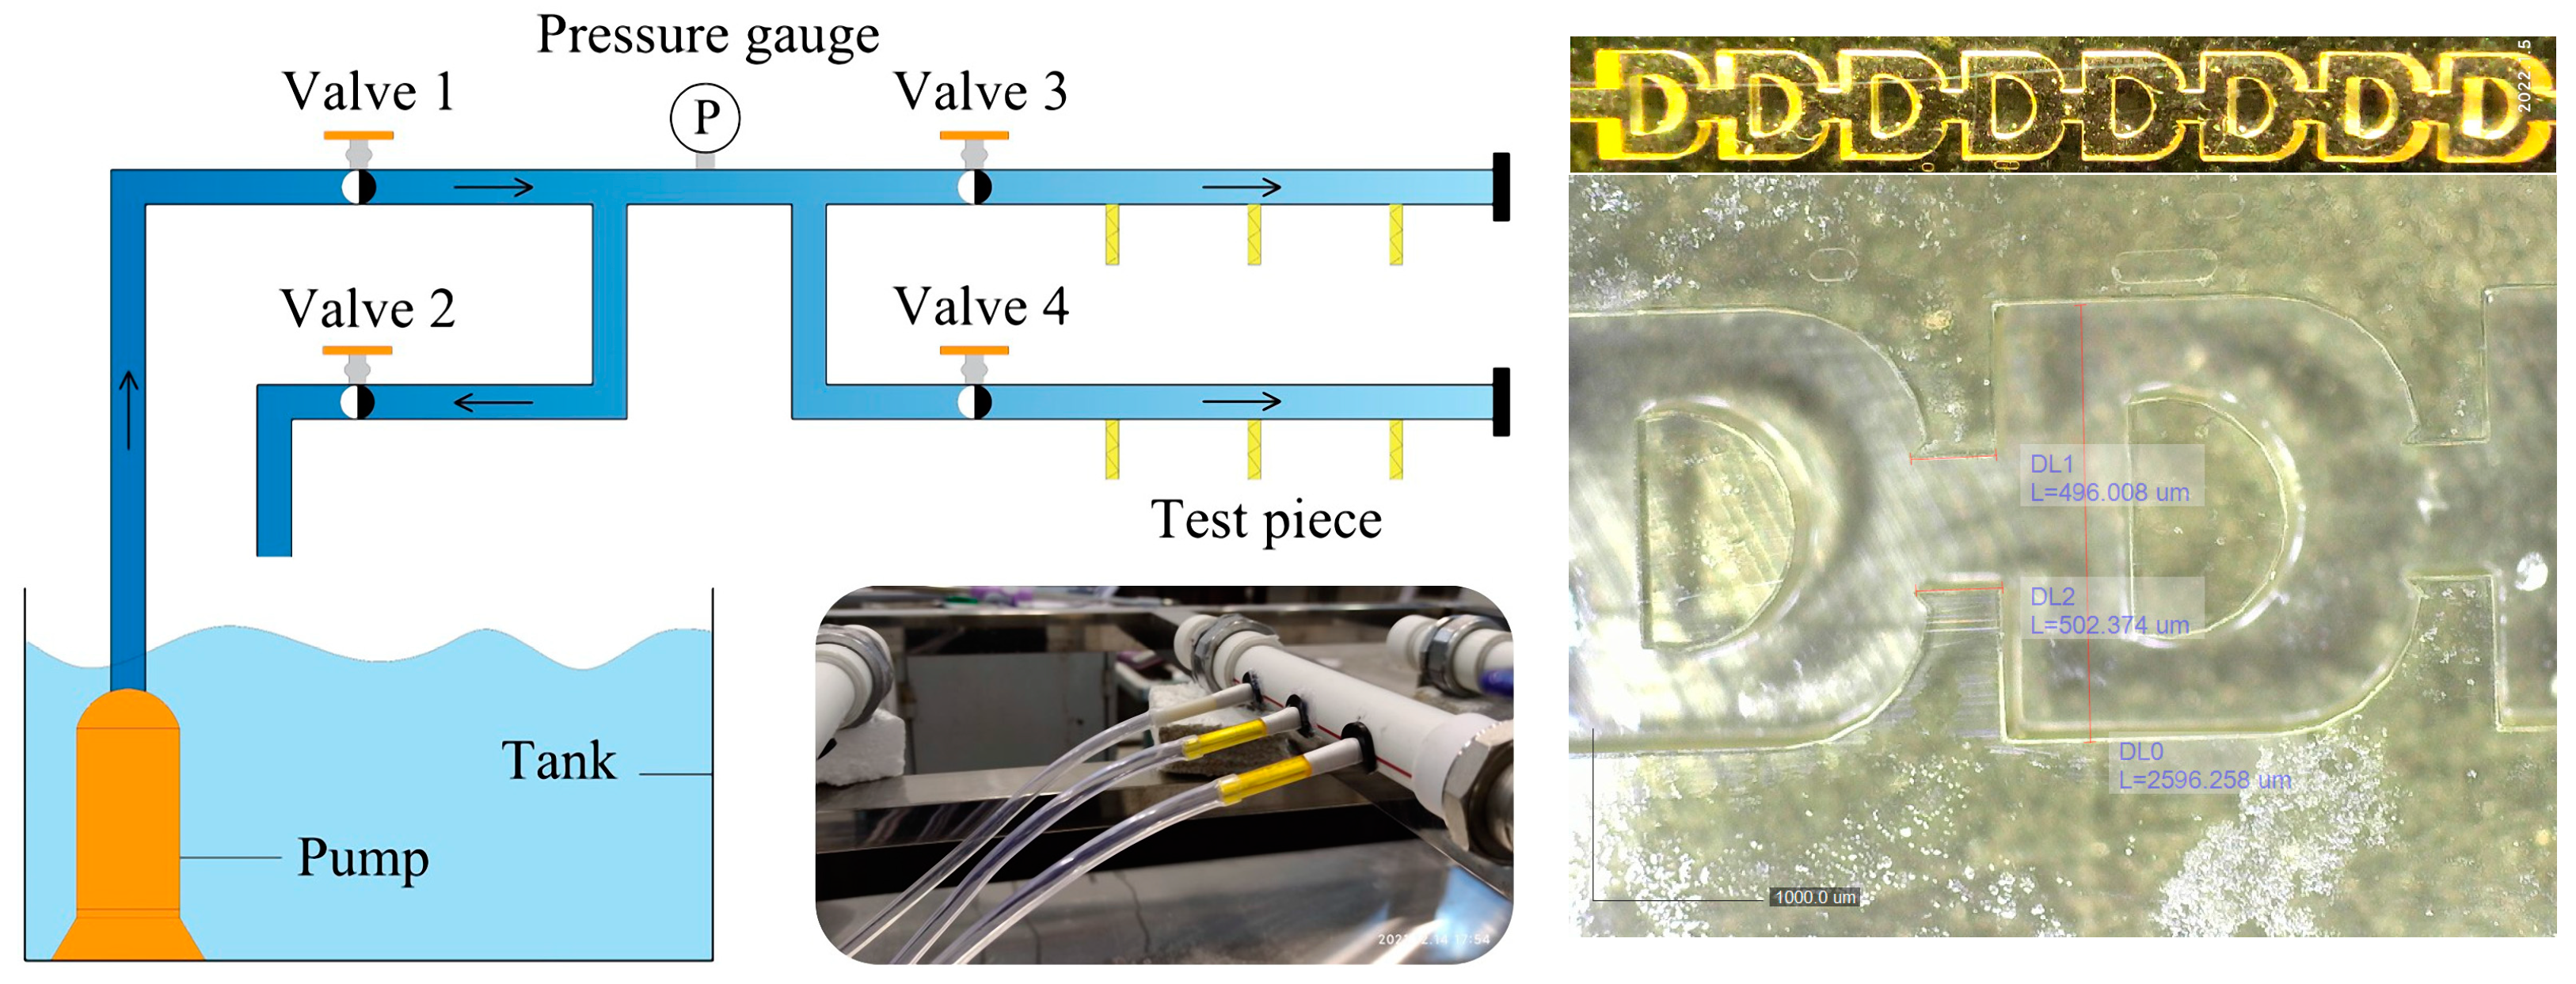
2.2. Field Test
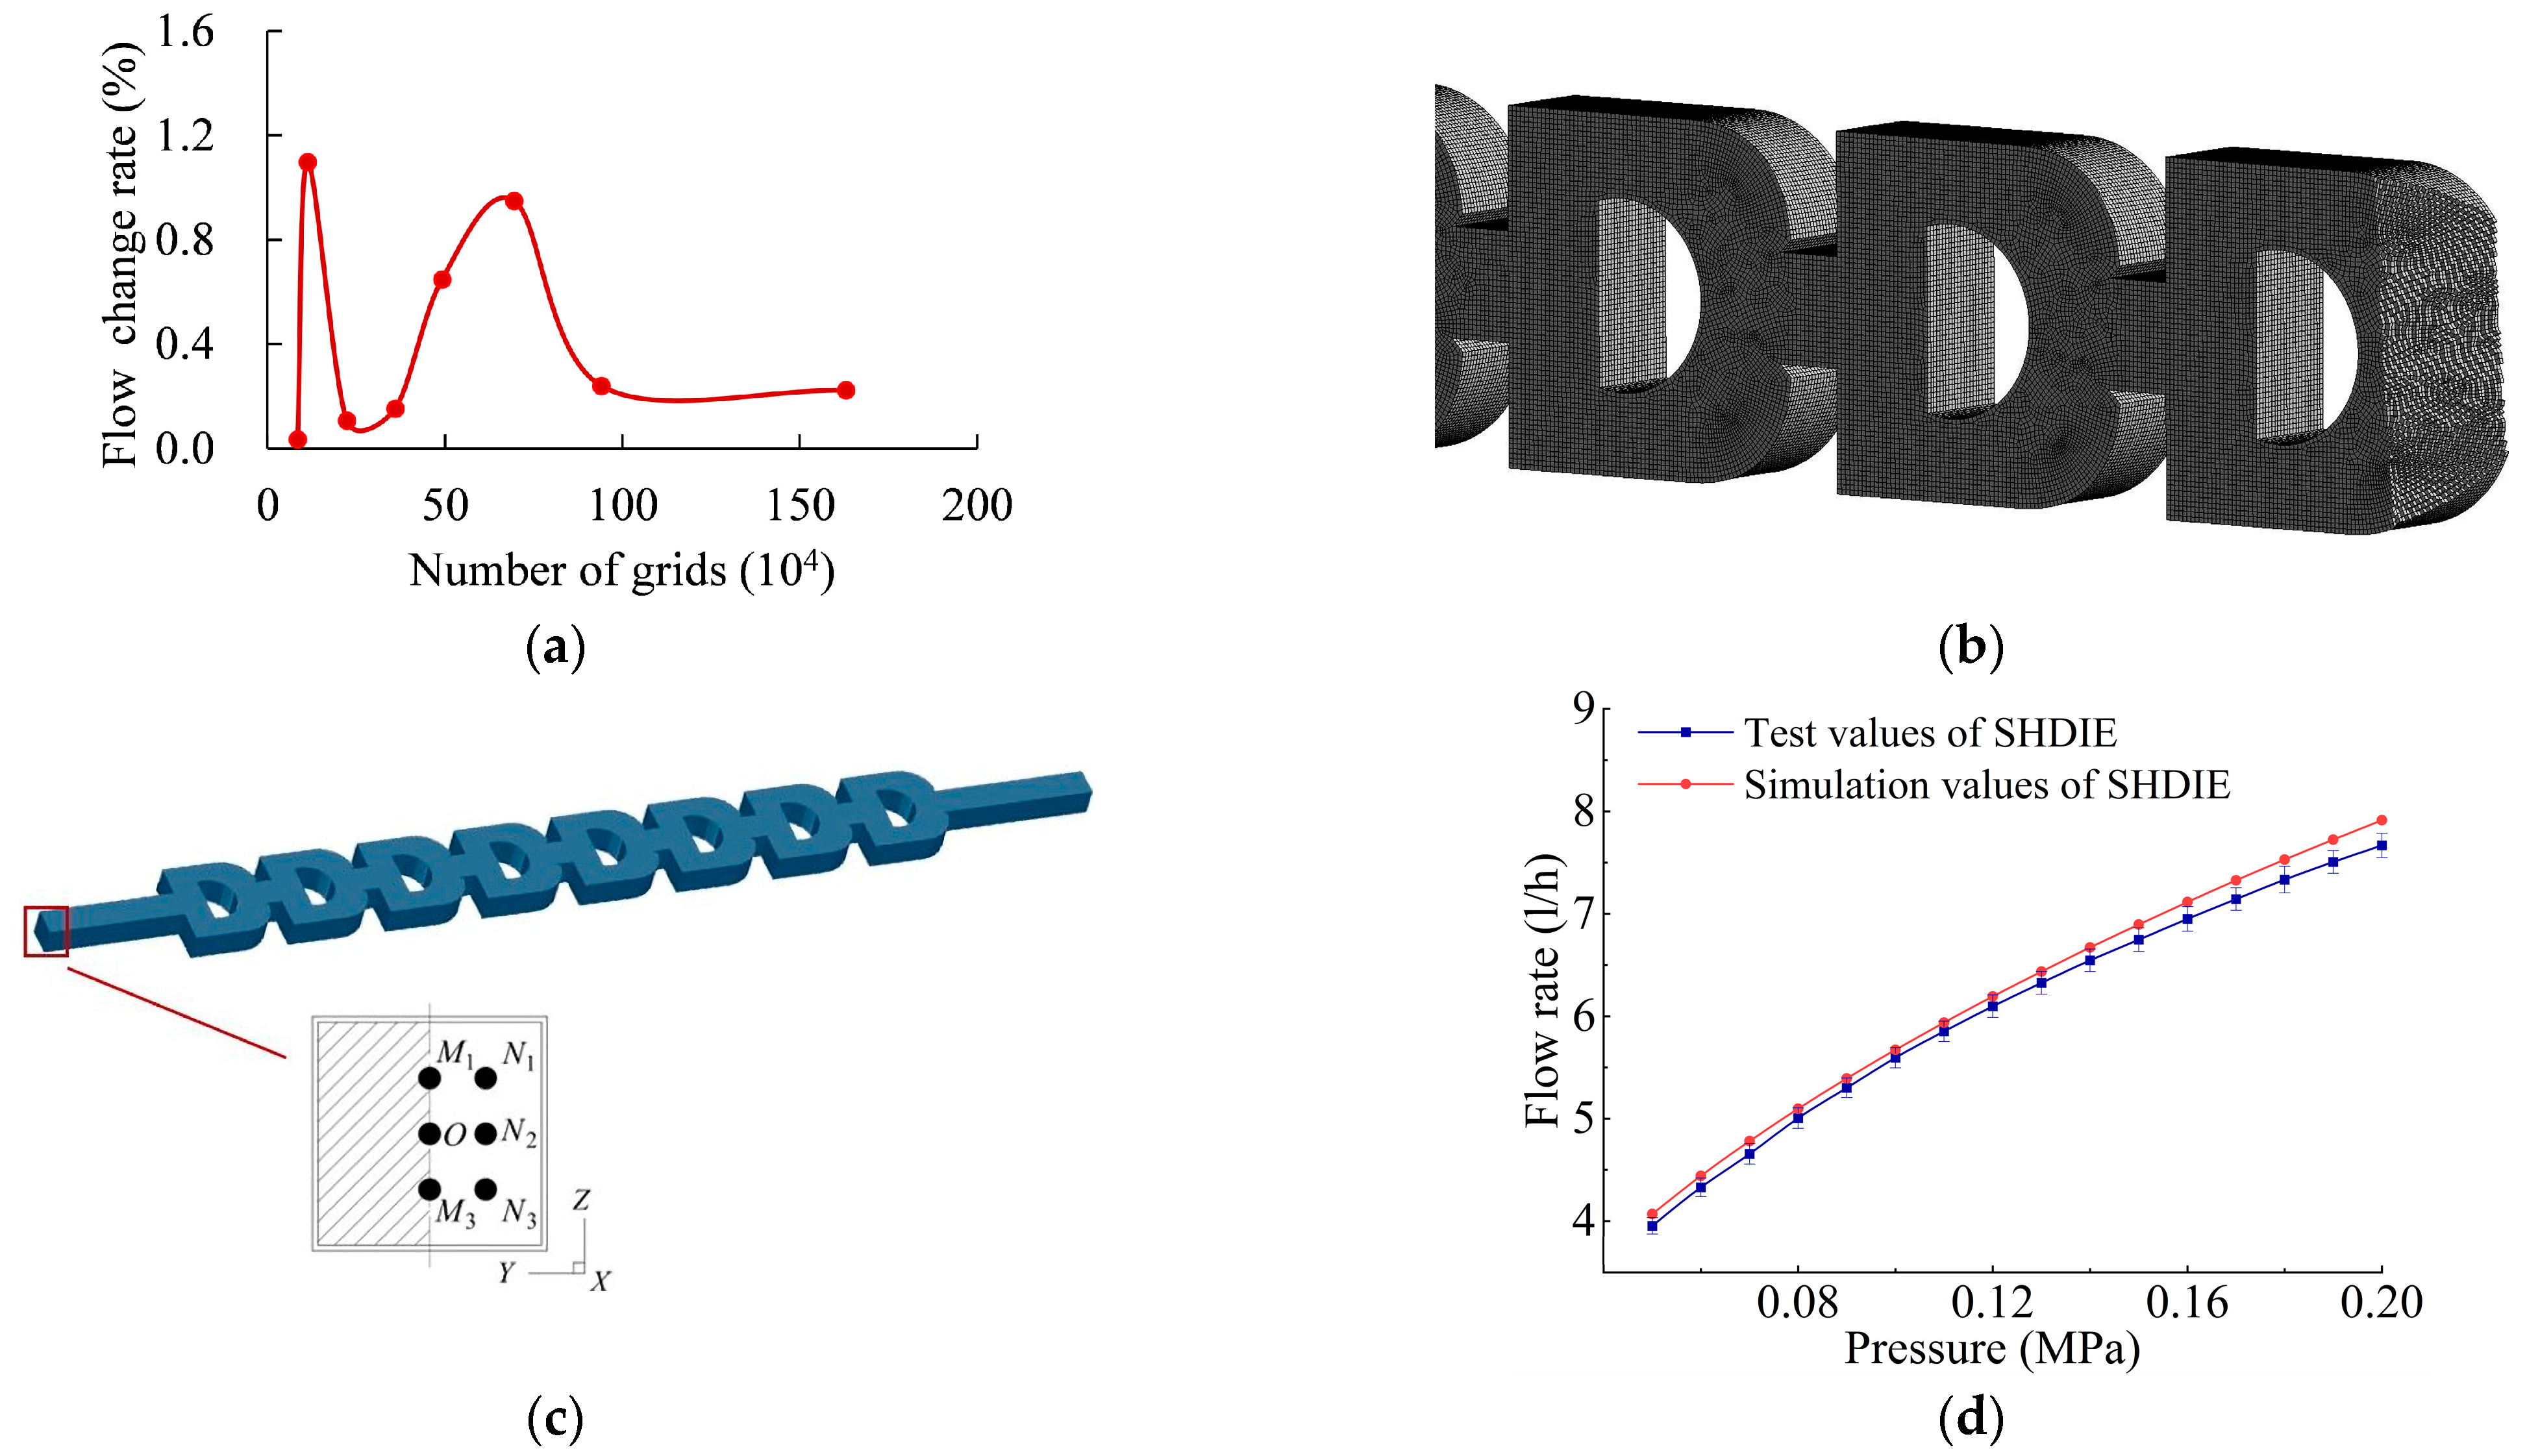
2.3. Numerical Methods
2.4. Evaluation Indicators
3. Results
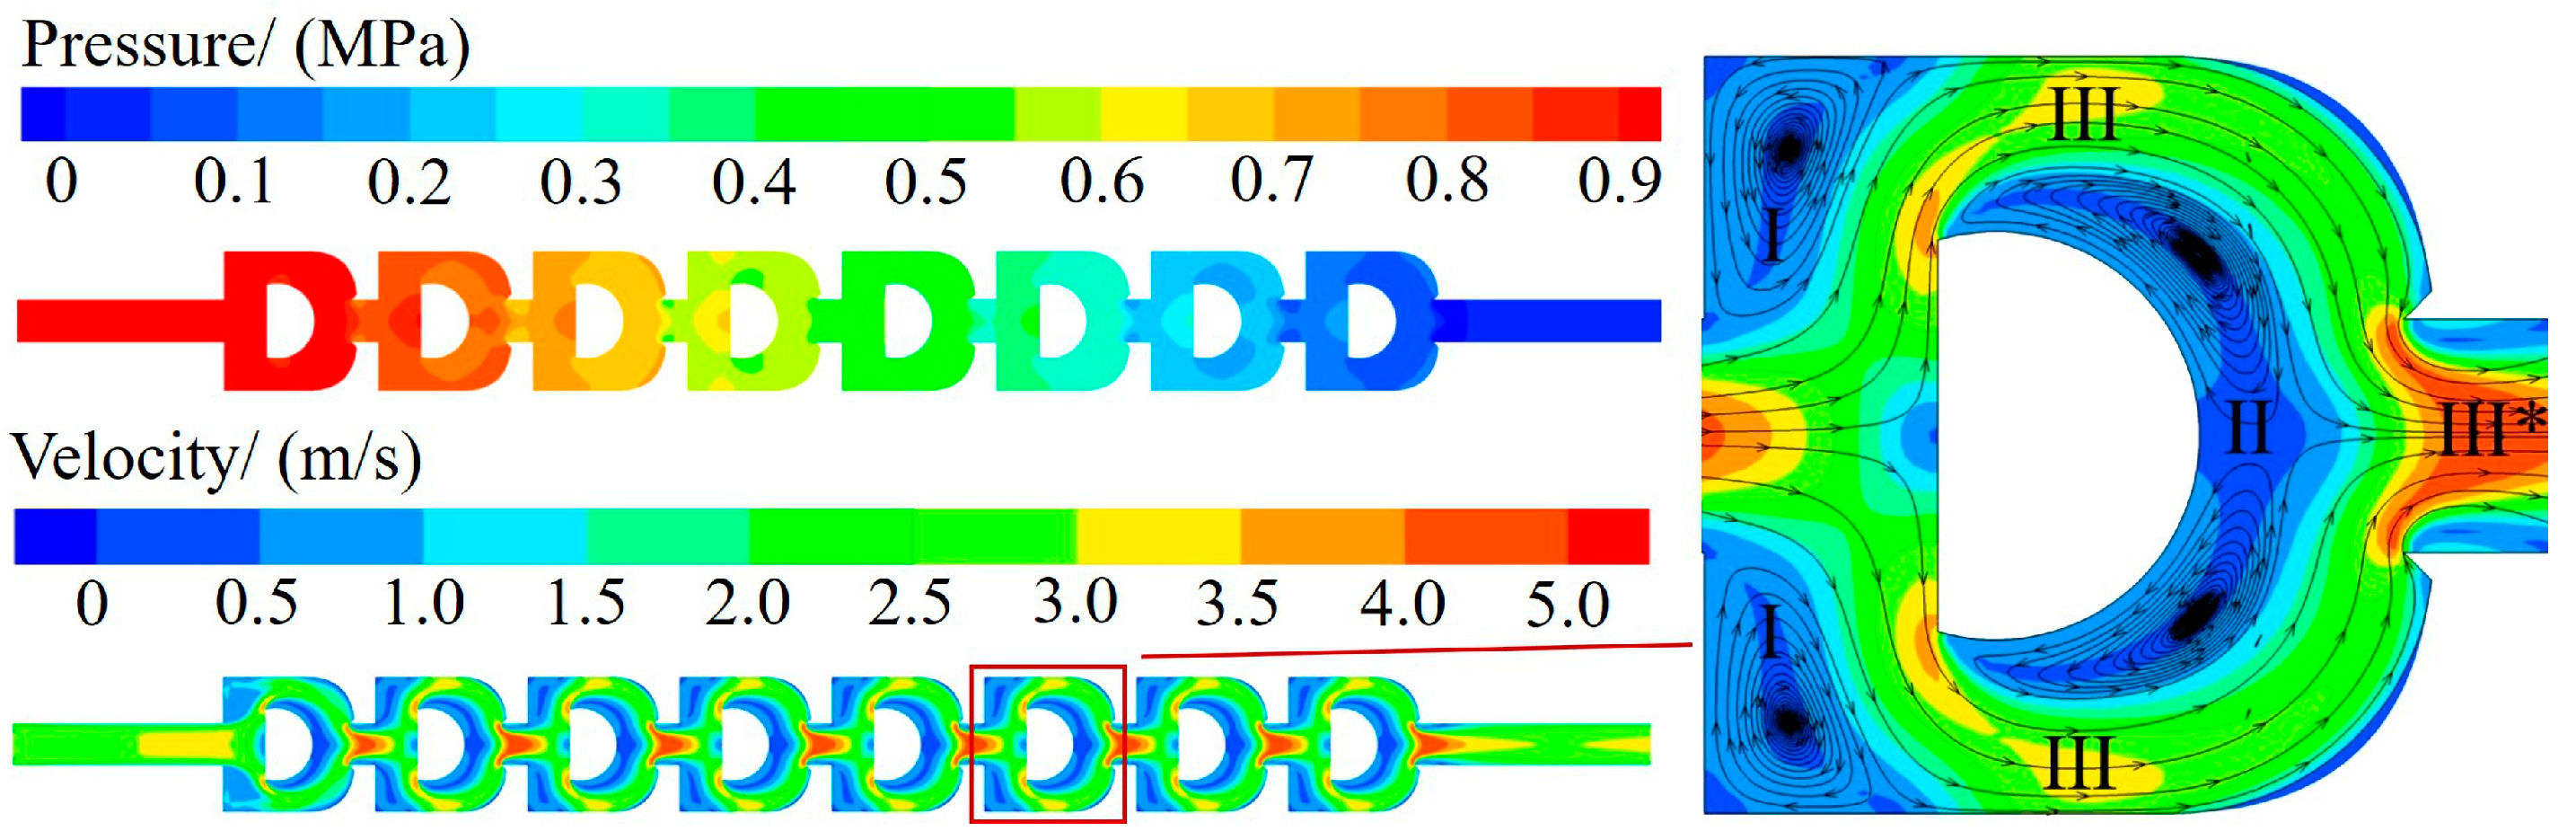
3.1. Hydraulic Characteristics of SHDIE1
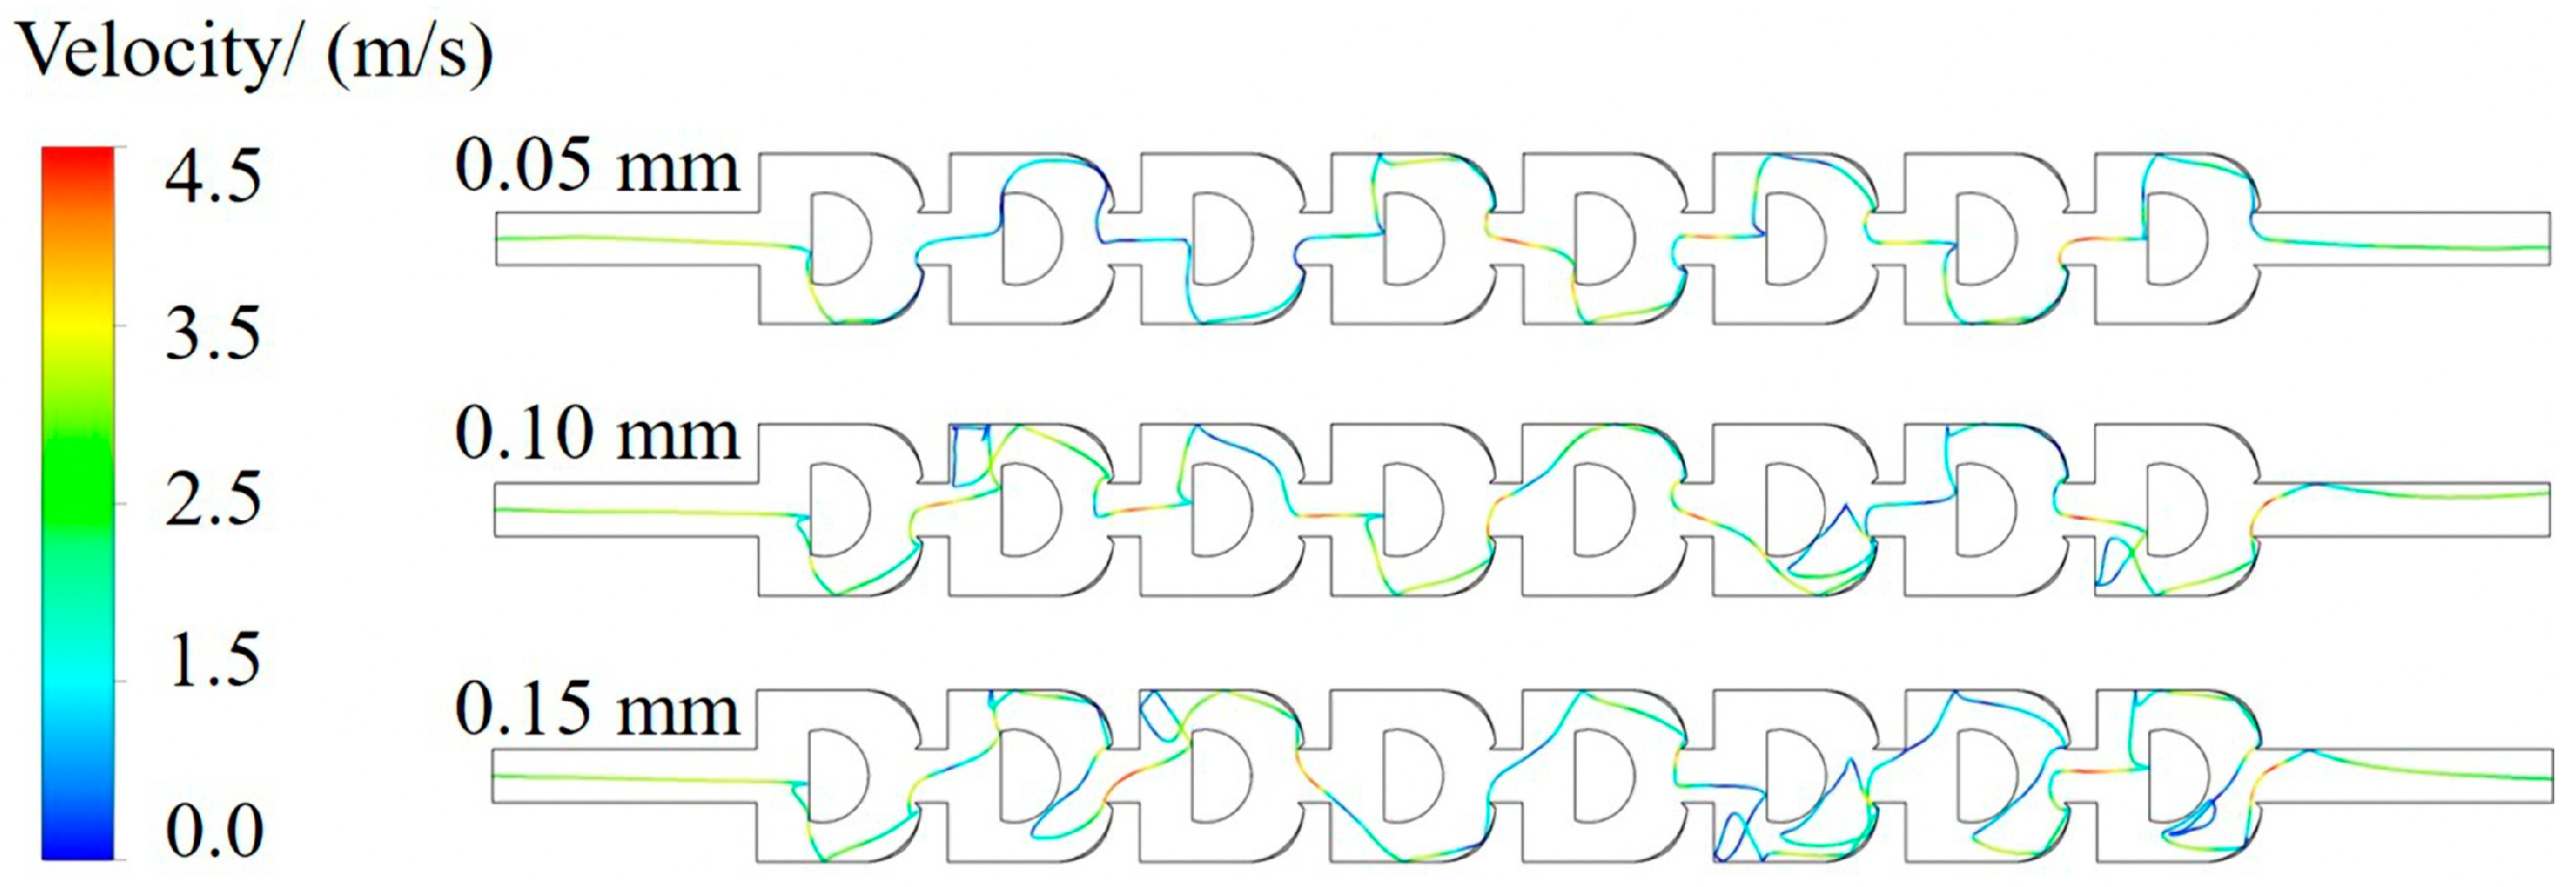
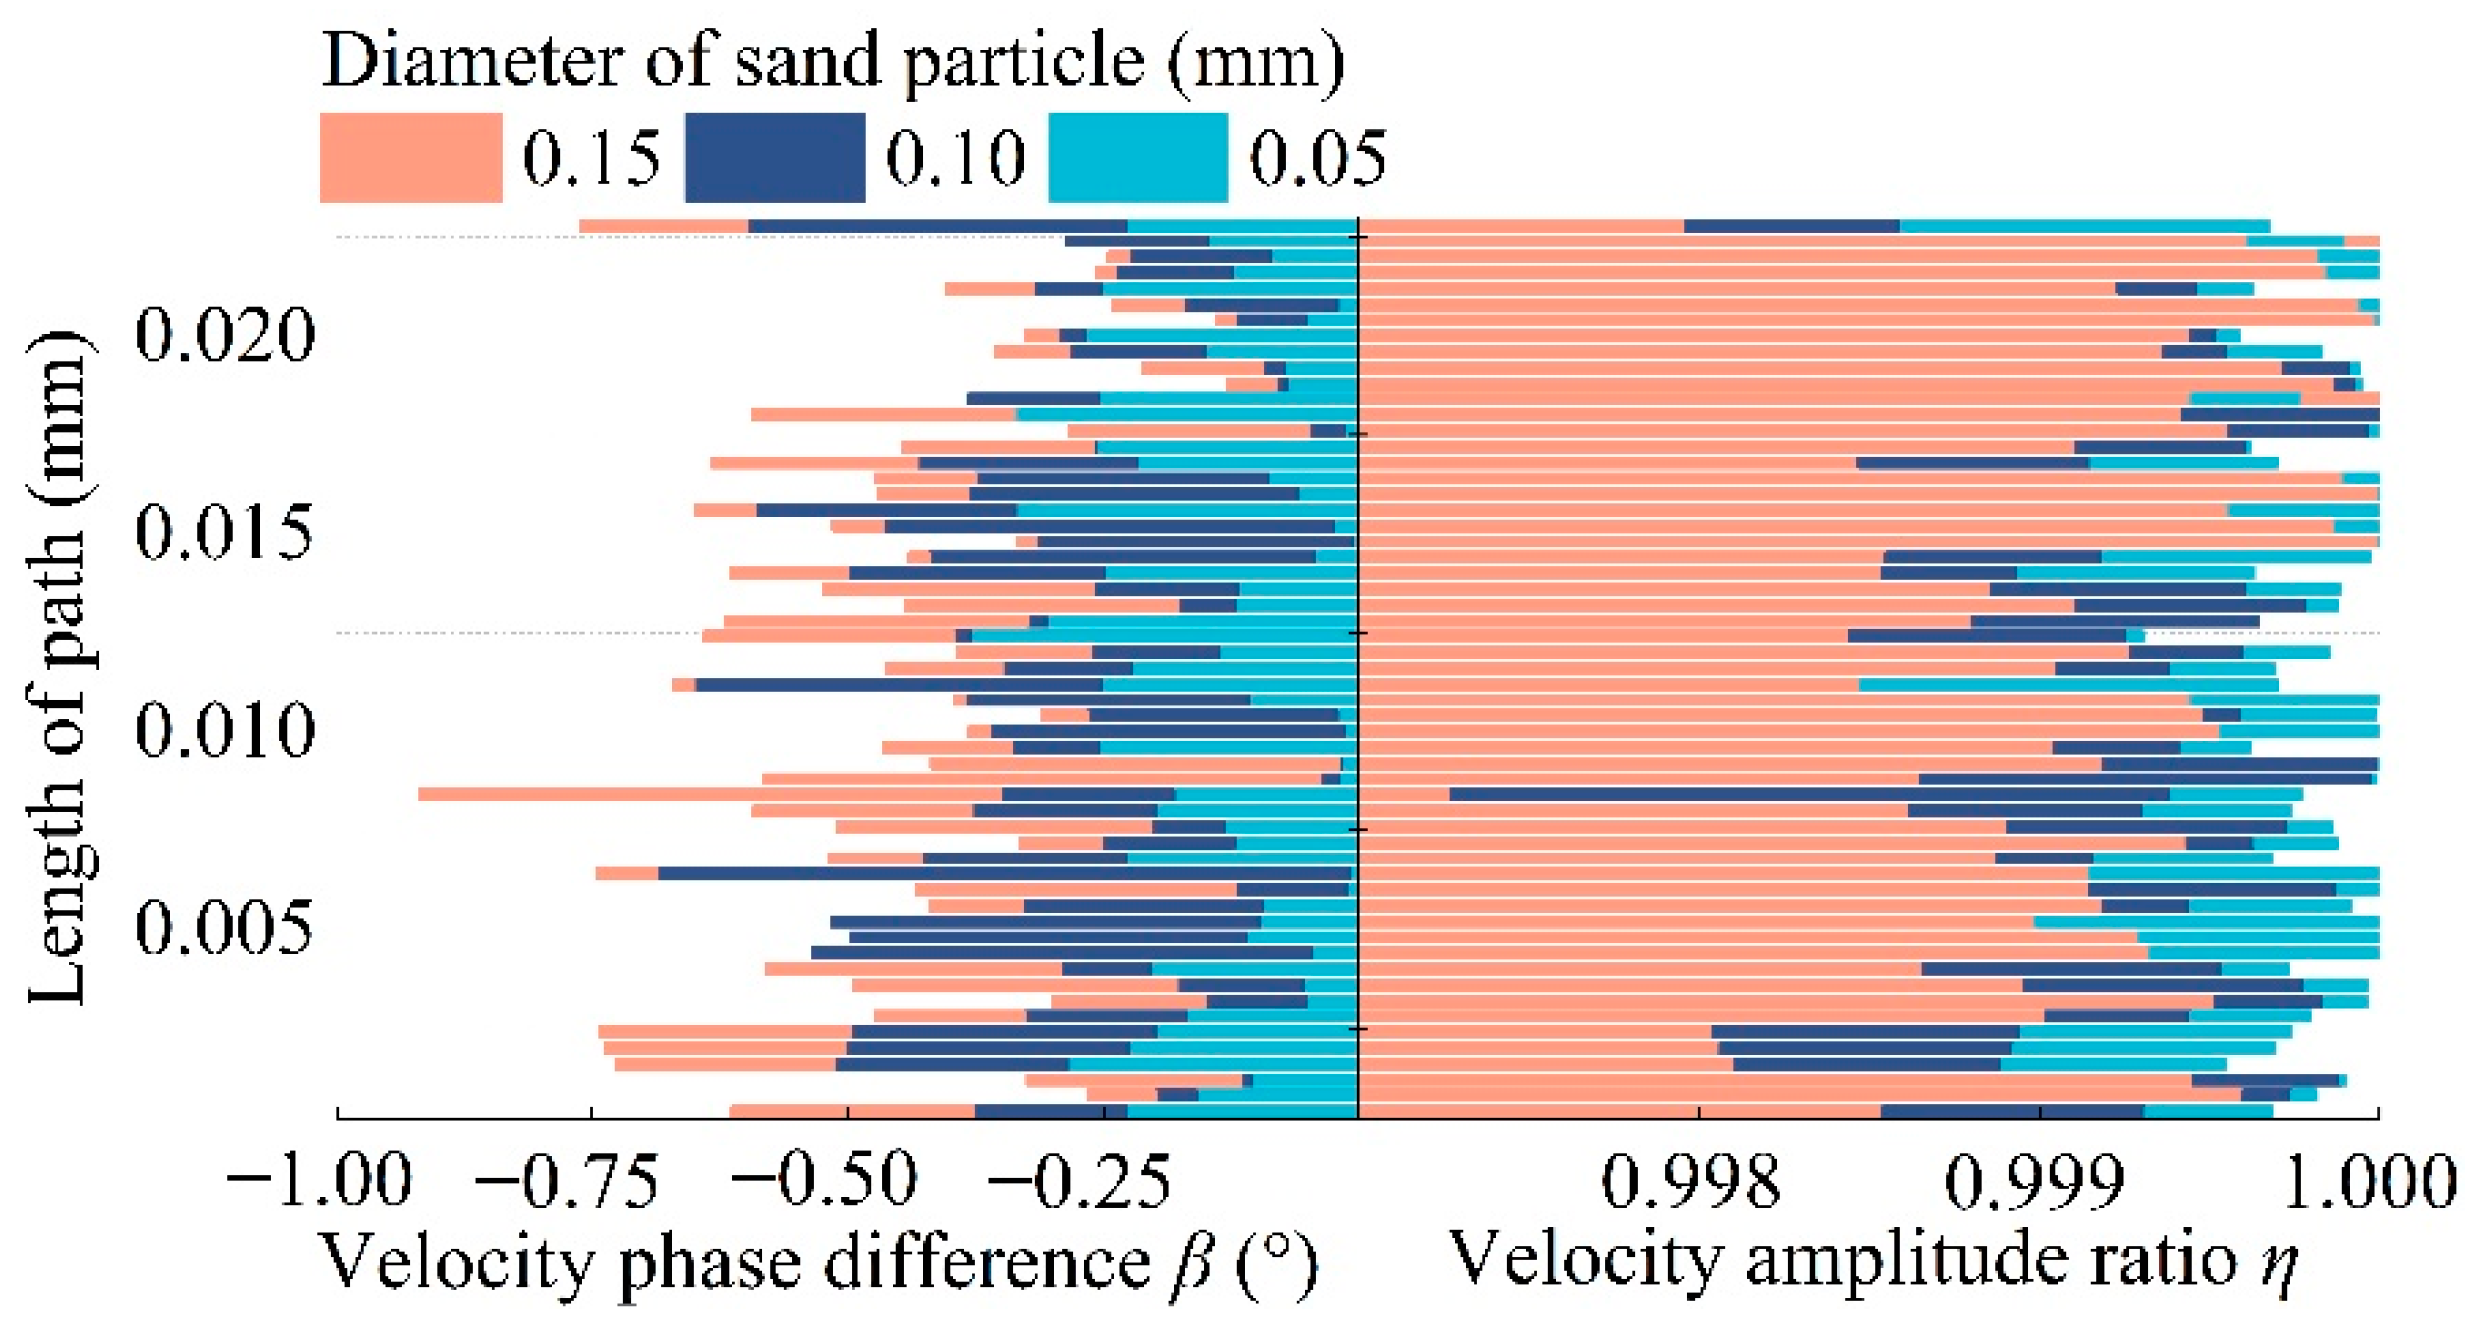
3.2. Motion Characteristics of Sand Particles
3.3. Optimization of the Flow Channel Structure
4. Discussion
5. Conclusions
Author Contributions
Funding
Institutional Review Board Statement
Informed Consent Statement
Data Availability Statement
Acknowledgments
Conflicts of Interest
References
- Wei, Z.Y.; Cao, M.; Liu, X.; Tang, Y.P.; Lu, B.H. Flow behaviour analysis and experimental investigation for emitter micro-channels. Chin. J. Mech. Eng. 2012, 25, 729–737. [Google Scholar] [CrossRef]
- Madramootoo, C.A.; Morrison, J. Advances and challenges with micro-irrigation. Irrig. Drain. 2013, 62, 255–261. [Google Scholar] [CrossRef]
- Lin, Z.; Gary, P.M. Relationships between common irrigation application uniformity indicators. Irrig. Sci. 2012, 30, 83–88. [Google Scholar]
- Wang, C.C.; Li, Z.Q.; Ma, J.J. Influence of Emitter Structure on Its Hydraulic Performance Based on the Vortex. Agriculture 2021, 11, 508. [Google Scholar] [CrossRef]
- Li, Y.K.; Yang, P.; Ren, S.M.; Lei, X.L.; Wu, X.B.; Guan, X.Y. Effects of fractal flow path designing and its parameters on emitter hydraulic performance. J. Mech. Eng. 2007, 43, 109–114, (In Chinese with English abstract). [Google Scholar] [CrossRef]
- Tian, J.Y.; Bai, D.; Ren, C.J.; Wang, X.D. Analysis on hydraulic performance of bidirectional flow channel of drip irrigation emitter. Trans. Chin. Soc. Agric. Eng. 2013, 29, 89–94, (In Chinese with English abstract). [Google Scholar]
- Xing, S.B.; Wang, Z.H.; Zhang, J.Z.; Liu, N.N.; Zhou, B. Simulation and verification of hydraulic performance and energy dissipation mechanism of perforated drip irrigation emitters. Water 2021, 13, 171. [Google Scholar] [CrossRef]
- Sun, H.S.; Li, Y.K.; Feng, J.; Liu, H.S.; Liu, Y.Z. Effects of flow path boundary optimizations on particle transport in drip irrigation emitters. Irrig. Drain. 2016, 65, 417–425. [Google Scholar]
- Li, Z.Y.; Yu, L.M.; Li, N.; Chang, L.H.; Cui, N.B. Influence of Flushing Velocity and Flushing Frequency on the Service Life of Labyrinth-Channel Emitters. Water 2018, 10, 1630. [Google Scholar] [CrossRef]
- Yu, L.M.; Yu, X.J.; Li, N.; Zhang, G.L.; Han, D.; Cui, N.B. Sediment Distribution Mechanism of Labyrinth-channel Emitters under Different Flushing Measures. Trans. Chin. Soc. Agric. Mach. 2021, 7, 304–312. [Google Scholar]
- Yu, L.M.; Li, N.; Liu, X.G.; Yang, Q.L.; Li, Z.Y.; Long, J. Influence of dentation angle of labyrinth channel of drip emitters on hydraulic and anti-clogging performance. Irrig. Drain. 2019, 68, 256–267. [Google Scholar] [CrossRef]
- Zhou, B.; Hou, P.; Yang, X.; Song, P.; Xie, E.; Li, Y.K. Visualizing, quantifying, and controlling local hydrodynamic effects on biofilm accumulation in complex flow paths. J. Hazard. Mater. 2021, 416, 125937. [Google Scholar] [CrossRef] [PubMed]
- Wei, Z.Y.; Zhao, W.H.; Tang, Y.P.; Lu, B.H.; Zhang, M.Y. Anti-clogging design method for the labyrinth channels of drip irrigation emitters. Trans. Chin. Soc. Agric. Eng. 2005, 21, 1–7, (In Chinese with English abstract). [Google Scholar]
- Niu, W.Q.; Wu, P.T.; Yu, L.M. Anti-clogging experimental investigation and optimized design of micro-channels of emitter based on isoline of sand content. Trans. Chin. Soc. Agric. Eng. 2010, 26, 14–20, (In Chinese with English abstract). [Google Scholar]
- Yang, B.; Wang, J.D.; Zhang, Y.Q.; Wang, H.T.; Ma, X.P.; Mo, Y. Anti-clogging performance optimization for dentiform labyrinth emitters. Irrig. Sci. 2020, 38, 275–285. [Google Scholar] [CrossRef]
- Wu, D.; Li, Y.K.; Liu, H.S.; Yang, P.L.; Sun, H.S.; Liu, Y.Z. Simulation of the flow characteristics of a drip irrigation emitter with large eddy methods. Math. Comput. Model. 2013, 58, 497–506. [Google Scholar] [CrossRef]
- Zhao, N. Sediment treatment measures for the reservoirs of muddy river in Xinjiang. Water Resources Planning and Design. 2020, 1, 147–151, (In Chinese with English abstract). [Google Scholar]
- Xu, T.Y.; Zhang, L.X. Influence and analysis of structure design and optimization on the performance of a pit drip irrigation emitter*. Irrig. Drain. 2020, 69, 633–645. [Google Scholar] [CrossRef]
- Cao, W.; Liu, J.; Zhu, Y.T.; Wei, Q.S. Numerical simulation of vibration pressure on the hydraulic performance of round-flow emitter. Adv. Mater. Res. 2014, 22, 1073–1076. [Google Scholar] [CrossRef]
- Li, Y.K.; Yang, P.L.; Xu, T.W.; Ren, S.M.; Lin, X.C.; Wei, R.J.; Xu, H.B. CFD and digital particle tracking to assess flow characteristics in the labyrinth flow path of a drip irrigation emitter. Irrig. Sci. 2008, 26, 427–438. [Google Scholar] [CrossRef]
- Tang, X.L.; Zhao, X.H.; Li, Y.K.; Li, X.Q. Numerical simulation of flow fields and particle movement characteristics in labyrinth channel emitter using different turbulence models. Trans. Chin. Soc. Agric. Eng. 2018, 34, 120–128, (In Chinese with English abstract). [Google Scholar]
- Yu, L.M.; Li, N.; Liu, X.G.; Yang, Q.L.; Long, J. Influence of flushing pressure, flushing frequency and flushing time on the service life of a labyrinth channel emitter. Biosyst. Eng. 2018, 172, 154–164. [Google Scholar] [CrossRef]
- Zhang, Y.Z.; Li, J.; Zhao, W.Q. Dependence of suspended particle’s following behaviors on its diameter and density in turbulent flow. Sichuan Water Power. 1997, 16, 83–88, (In Chinese with English abstract). [Google Scholar]
- Liu, H.S.; Sun, H.S.; Li, Y.K.; Feng, J.; Song, P.; Zhang, M.D. Visualizing particle movement in flat drip Irrigation emitters with digital particle image velocimetry. Irrig. Drain. 2016, 65, 390–403. [Google Scholar] [CrossRef]
- Wei, Q.S.; Lu, G.; Wang, L.; Zheng, J.C.; Liu, J.; Shi, Y.S. Experimental Study on the Multisegment Regime of the Water Flow in Drip Emitters. J. Irrig. Drain. Eng. ASCE. 2010, 136, 254–260. [Google Scholar]
- Yu, L.M.; Li, N.; Long, J.; Liu, X.G.; Yang, Q.L. The mechanism of emitter clogging analyzed by CFD–DEM simulation and PTV experiment. Adv. Mech. Eng. 2018, 10, 1–10. [Google Scholar] [CrossRef]
- Li, Y.K.; Feng, J.; Xue, S.; Muhammad, T.; Chen, X.Z.; Wu, N.Y.; Li, W.S.; Zhou, B. Formation mechanism for emitter composite-clogging in drip irrigation system. Irrig. Sci. 2019, 37, 169–181. [Google Scholar] [CrossRef]
- Feng, J.; Li, Y.K.; Wang, W.N.; Xue, S. Effect of optimization forms of flow path on emitter hydraulic and anti-clogging performance in drip irrigation system. Irrig. Sci. 2018, 36, 37–47. [Google Scholar] [CrossRef]


| Diameter (mm) | Transportation Distance (mm) | ||||||
|---|---|---|---|---|---|---|---|
| M1 | O | M2 | N1 | N2 | N3 | Average | |
| 0.05 | 52.46 | 45.57 | 49.11 | 47.18 | 46.37 | 45.61 | 47.72 |
| 0.10 | 62.58 | 54.96 | 59.43 | 56.94 | 47.24 | 56.80 | 56.32 |
| 0.15 | 63.19 | 62.26 | 58.18 | 67.58 | 62.82 | 63.32 | 62.89 |
| Collision Situation | |||||
|---|---|---|---|---|---|
 | |||||
| Diameter (mm) | Probability | ||||
| 0 ≤ LA ≤ 0.58 mm | 0.58 ≤ LA mm | 0 ≤ LB ≤ 0.64 mm | 0.64 ≤ LB mm | 0 ≤ LC ≤ 0.90 mm | |
| 50 | 9.1 | 0 | 100 | 0 | 100 |
| 100 | 72.2 | 0 | 100 | 0 | 100 |
| 150 | 87.5 | 0 | 100 | 0 | 100 |
Publisher’s Note: MDPI stays neutral with regard to jurisdictional claims in published maps and institutional affiliations. |
© 2022 by the authors. Licensee MDPI, Basel, Switzerland. This article is an open access article distributed under the terms and conditions of the Creative Commons Attribution (CC BY) license (https://creativecommons.org/licenses/by/4.0/).
Share and Cite
Qin, C.; Zhang, J.; Wang, Z.; Lyu, D.; Liu, N.; Xing, S.; Wang, F. Anti-Clogging Performance Optimization for Shunt-Hedging Drip Irrigation Emitters Based on Water–Sand Motion Characteristics. Water 2022, 14, 3901. https://doi.org/10.3390/w14233901
Qin C, Zhang J, Wang Z, Lyu D, Liu N, Xing S, Wang F. Anti-Clogging Performance Optimization for Shunt-Hedging Drip Irrigation Emitters Based on Water–Sand Motion Characteristics. Water. 2022; 14(23):3901. https://doi.org/10.3390/w14233901
Chicago/Turabian StyleQin, Cheng, Jinzhu Zhang, Zhenhua Wang, Desheng Lyu, Ningning Liu, Shaobo Xing, and Fei Wang. 2022. "Anti-Clogging Performance Optimization for Shunt-Hedging Drip Irrigation Emitters Based on Water–Sand Motion Characteristics" Water 14, no. 23: 3901. https://doi.org/10.3390/w14233901
APA StyleQin, C., Zhang, J., Wang, Z., Lyu, D., Liu, N., Xing, S., & Wang, F. (2022). Anti-Clogging Performance Optimization for Shunt-Hedging Drip Irrigation Emitters Based on Water–Sand Motion Characteristics. Water, 14(23), 3901. https://doi.org/10.3390/w14233901