Article

Modeling Investigation of Thermal Circulations of a Large and Shallow Subtropical Lake

1
NUIST Center on Atmospheric Environment, Nanjing University of Information Science and Technology, Nanjing 210044, China
2
School of Atmospheric Physics, Nanjing University of Information Science and Technology, Nanjing 210044, China
*
Author to whom correspondence should be addressed.
Water 2022, 14(22), 3719; https://doi.org/10.3390/w14223719
Submission received: 26 September 2022 / Revised: 5 November 2022 / Accepted: 7 November 2022 / Published: 17 November 2022
(This article belongs to the Section Hydraulics and Hydrodynamics)

Abstract

:
Lake Taihu, a typical shallow lake in eastern China, was selected for study in this paper. Methods: Considering that the accurate parameterization scheme is the key to a lake breeze simulation, then based on Lake Taihu’s characteristics, the setting of parameters of the lakes’ scheme was adjusted in the WRF (Weather Research and Forecasting Model) lake model. Results: By comparing the observed values of the mesoscale flux platform of Lake Taihu from June to August 2012, the results showed that the model significantly improved the simulation. The root-mean-square error of the simulated and observed comparison of the latent heat fluxes over the lake improved from 42.77 to 89.00. The adjusted WRF-Lake model better presents the characteristics of Lake Taihu’s lake wind. The different lake depth cases showed that the maximum difference in surface temperature between the shallow lake case and the deep lake case reached 9.9 °C, and the average was about 3 °C. Conclusion: Compared with the deep lake case, the shallow lake case stimulated less lake breeze circulation with a shorter time and smaller range in the horizontal and vertical directions. The lake breeze frequency, simulated by the shallow lake case, was 18.5%, while for the deep lake case, it reached 38%. These simulations of lake breeze contribute to understanding the influence of a lake’s depth on lake breeze characteristics and the accurate parameterization scheme of the inland shallow lakes.

1. Introduction

The Taihu Lake Basin is the most economically developed region in China, with a total area of 36,900 km2 and about 62 districts and counties in four provinces and cities, including Shanghai, Jiangsu, Zhejiang and Anhui. The Taihu Lake Basin is one of the fastest growing and urbanizing regions in China; at the same time, the Taihu Lake Basin is the most densely populated area, with a population density of 978/m2. The first goal of this study is to investigate the dynamics of lake breeze circulation in the Lake Taihu Basin to address local environmental issues. Adequate water resource management is essential for fulfilling ecosystem and human needs [1]. Several authors have studied the impact of the lake on local climate and pollution dispersion. The high concentration of cities is shown to generate strong urban heat islands [2,3]. Using a fine-mesh regional meteorological model, Zhang et al. [4] suggested that the interaction of the lake’s thermal circulation with the urban heat island may enhance the surface wind convergence in the eastern part of the lake, resulting in changes in precipitation patterns. In addition, the lake’s physical state exerts a strong influence on the lake’s pollution-carrying capacity. Since the severe outbreak of algal bloom in 2007, Lake Taihu has become a hot spot for ecological restoration and water resource management [5]. Accurate predictions of the onset, cessation and penetration distance of the lake breeze circulation are critically important for air quality forecasts and management and may also inform studies on the lake’s biogeochemical processes.
A second factor that motivates this study is the paucity of published studies on the thermal circulations associated with shallow lake systems. Lake breezes and sea breezes are a class of local circulations driven by a difference in heating between land and water. They are known to influence local weather phenomena, such as cloud formation [6,7,8,9], the formation of precipitation [10,11] and snowstorms [12,13,14], tornado climatology [15], and air pollution dispersion [16,17,18,19,20]. The intensity, spatial extent and duration of the circulation depend on the latitude [21,22,23,24], season [25,26,27], terrain topography [28] and different land surface types, such as urban areas [29,30,31]. The prevailing atmospheric states, such as geostrophic wind and air stability, also play a role. Some researchers have investigated how a lake’s size [30] and shape influence circulation strength [32]. All of these studies have been reviewed [33,34], yet few have paid attention to water depth. Most of the studies cited here focus on deep lakes [26,35]. The study by Zumpfe and Horel [25], one of the few that have investigated shallow lakes (depth 4.9 m), shows that the lake breeze of the Great Salt Lake occurs only a few times a month (6–15%), much less frequently than near a deep lake. The lake breeze of Lake Manitoba (with a maximum depth of 7 m) is about 37% of the days in the warm season [36], and the lake breeze of Lake Taihu was about 12–30% [27]. However, for the Great Lakes, the lake breeze frequency in summer is basically around 90% [26]. It is not known if the depth of the lake is a key factor in the characteristics of a lake breeze.
Numerical models are a powerful tool for investigating lake–air exchange and breeze circulations [37,38,39,40,41,42]. The numerical model deployed in this study is the Weather Research and Forecasting (WRF) model, a high-resolution meso-scale numerical model that has been used widely for sea and lake breeze research [39,40]. We hypothesize that the accurate parameterizations of the surface fluxes of energy and momentum are a prerequisite for obtaining accurate model simulations of the thermal circulations for shallow lakes. Compared with deep lakes, the lake-land surface process has some challenging problems to be solved in shallow lakes [43,44]. Shallow lakes are more sensitive to atmospheric conditions, and the water temperature will change greatly in both spatial and temporal scales [45]. For shallow lakes such as Lake Taihu, due to the influence of human activities, the ecosystem of the lake body is altered, the albedo, extinction coefficient and other optical properties of the lake body are changed, and then the radiation energy balance and heat transfer of the lake body are changed [46]. The thermal conductivity of a shallow lake is also different from that of a deep lake. The interaction of the wind and waves makes the thermal conductivity of natural water larger than the molecular value; thus, the influence of a fluid eddy on thermal conductivity should be considered [46]. The eddy diffusion coefficient of Lake Taihu is far less than that of the deep lake due to two aspects, the dense submerged plants in the lake body and a very small depth-to-size ratio, and the water in the lake is subject to a strong drag force [47]. Furthermore, the surface roughness of the parameterization scheme is vital for the calculation of the flux exchange, while the interaction of the winds and waves are important factors for roughness, and the surface roughness characteristic in the model needs to adjust roughness according to the observations. After version 3.6 of the WRF was used, the lake scheme of CLM4 was introduced, as these factors still need to be considered when simulating the characteristics of a lake–air exchange in Lake Taihu.
This study aims to address these two scientific questions: (1) Can the adjusted WRF/lake model adequately simulate the lake–air exchanges and capture the observed characteristics of the lake breeze circulation? (2) How frequent is the lake breeze? What is the average spatial extent and time duration of the circulation? Do these statistics differ from those reported for deep lakes, and if so, why?

2. Study Area and Observation Data

2.1. Study Area

Lake Taihu is located in the Yangtze River Delta in eastern China. The lake, characterized by its shallowness (mean depth of 1.9 m), is the third largest freshwater lake (surface area of 2400 km2) in China, with a width of (from east to west) ~60 km and a length of (from north to south) ~70 km [48]. The lake basin overlaps with one of the three city agglomeration regions in China and has high levels of industrial development and population density. Even though it occupies only 0.4% of China’s land area, in 2019, its gross domestic product accounted for 9.8% of the country’s economy (http://www.tba.gov.cn/ (accessed on 8 November 2022)). In the vicinity of the lake, there are eight cities with a population of more than one million, including three mega-cities (Shanghai, Hangzhou and Suzhou) having a population of greater than ten million.

2.2. Data

The observational data used for the model’s validation consisted of those from the standard surface weather stations on the lake and the surrounding land and from the Lake Taihu Eddy Covariance Mesonet [49,50]. In all, there were 16 measurement locations on land and 3 on the lake (Figure 1, Table 1). All the land stations were located near the lake, with seven within a 2 km distance (onshore), four within 10 km (near shore) and the rest within 30 km from the shoreline (far shore). Common to all the 19 stations were the hourly measurements of the 10 m wind speed and direction, 2 m air temperature and specific humidity, and precipitation. Three of the land stations were China’s national basic reference stations (58443, 58450, 58346); at these stations, cloud cover was also measured at hourly intervals.
During this study period, data were available from four of the Eddy Covariance Mesonet stations, including three in the lake (Meiliangwan, MLW; Dapukou, DPK; Bifenggang, BFG) and one on land (Dongshan, DS). In addition to the general meteorological variables, half-hourly measurements were made on the four components of surface radiation balance, turbulent fluxes of momentum, sensible heat and latent heat, and water temperature. The details of the experiment are given by Lee et al. [49]. Briefly, the MLW site was situated on the north side of Lake Taihu, and the measurement took place at a height of 3.5 m above the water surface and 150 m away from the shore. DPK is in the west part of the lake, about 3 km from the shore, and the turbulent fluxes were measured at 8.5 m above the water. BFG is in the east part of the lake, about 4 km from the shore, whose flux measurement height was 8.5 m. The DS site was located in the Dongshan Peninsula, the east part of Lake Taihu, in a landscape covered with lush subtropical shrub vegetation. At DS, the turbulent fluxes were measured at the height of 20 m above the ground.

3. Model Simulations

3.1. Simulation Domains

The model was set up with four nested domains, shown in Figure 1. The innermost domain comprised mainly the Yangtze River Delta and the Lake Taihu Basin. There were, in order from the outmost to the innermost domain, 60 × 60, 103 × 91, 205 × 178, and 295 × 286 grid points and a grid spacing of 27, 9, 3, and 1 km. The vertical dimension was divided into 52 layers, with the layer thickness stretching from ~100 m near the lowest model grid height (at 5–10 m above the ground level) to ~1 km at the top grid height of 50 hPa. The simulation started at 12 UTC, 31 May and ended 00 UTC, 1 September 2012. The model was integrated every 60 h. The first 12 h of the 60 h period was the spin-up not used for analysis, and the outputs of the remaining 48 h were archived for analysis. The initial condition and the 6 h lateral boundary conditions were provided by the National Centers for Environmental Prediction (NCEP) and Environmental 0.5° × 0.5° CFSR (Climate Forecast System Reanalysis) data.

3.2. Model Description

The Weather Research and Forecasting model [51] is a non-static compressible mesoscale weather forecasting model. The model has a reasonable dynamic frame structure and a variety of parameterization schemes suitable for different weather conditions. The horizontal resolution can support the variation range from a few meters to a few thousand kilometers. Chen and Zhang [52] showed that in the Lake Taihu Basin, the unified Noah land surface model [53,54], with a single-layer urban canopy model [55] and MYJ [56] boundary layer schemes, provided a good simulation performance and, therefore, these schemes are used in this study. The rapid radiative transfer model (RRTM) was selected for both long and short-wave radiation schemes in the model [57]. The WRF double-moment six-class (WDM6) microphysics scheme [58] and Kain–Fritsch cumulus scheme [59] were used only for d01 and d02.
The simulations were performed with two types of land surface parameterization. In one set of simulations, referred to as D-Lake, the lower boundary conditions for the WRF were provided with the NOAH land surface scheme. On land, the Noah LSM (Noah land surface model) was used. Based on the model with a daily variation penman evaporation method, four layers of soil parameterization schemes, vegetation resistance calculations, and snow cover and frozen soil parameterization schemes can be simultaneously land–air energy balanced and water balanced in the simulation, which provided land to the bottom of the atmospheric grid sensible heat flux and latent heat flux as a boundary condition. For the lake grids, the water surface temperature is interpolated from the sea surface temperature and ignores the sub-grid scale lakes. The lake–air flux of momentum, sensible heat and water vapor are parameterized with the bulk schemes with a roughness length of 0.01 cm and a surface albedo of 0.08. This set of simulations represents the conditions of a deep lake.
The second set of simulations was labeled S-Lake-Default. For the lake grids, NCAR’s (National Center for Atmospheric Research) lake model, the CLM4-LISSS of Lake, Ice, Snow and Sediment Simulator [47], was selected in the WRF model and used, and the lake depth was set to 2 m as a default shallow lake case. The CLM4-LISSS divides the water column and the sediment into 10 layers each. The heat exchange between the adjacent layers is described by a one-dimensional heat diffusion equation. The eddy diffusivity in the water column is parameterized according to the friction velocity, gradient Richardson number and latitudinally dependent parameter of the Ekman profile [60]. Gu et al. used observation data from the Great Lakes to calibrate the WRF/CLM4-LISSS model and adjust the eddy diffusivity for the parameterization schemes with depths greater than 15 m and less than 15 m.
The third set of simulations, which are labeled S-Lake, improved the accuracy of the calculations of the lake surface temperature and lake–air fluxes. The following changes were made to the lake model: (1) The lake albedo was set to a constant value equal to the mean albedo (0.055) observed from June to August 2012 at Lake Taihu; (2) the surface momentum, heat and water vapor roughness length were set to be the constants (Zom = 3.3 × 10⁻⁴ m; Zoh = 1.9 × 10⁻⁶ m; Zoq = 3.9 × 10⁻⁸ m); and (3) the thermal diffusivity of the lake water was reduced to 2% of that calculated by the Henderson–Sellers [61] formulation embedded in the lake model. (4) Considering the lake is shallow and turbid, we related β according to Beer’s law, such that the energy balance was conserved in vertical:   β = 1 e Z a   η , Za was set to 0.2, and η was set to 5 m−1. These adjustments were necessary for the model to accurately reproduce the diurnal variations of the observed surface temperature at Lake Taihu [47]. Furthermore, the observed lake water and sediment temperature were used to initiate the model calculations for every two-day run. The accurate initial surface temperature distribution is also very important for offshore surface fluxes and simulated local thermodynamics circulation [62]. This calibrated set of simulations represents the conditions of a shallow lake.

4. Determining Lake Breeze Occurrence from Observational Data and Model Output

4.1. From Observational Data

Biggs and Graves [63] developed a Lake Breeze Index for forecasting the lake breeze by using station observation data. In the empirical formula, the LBI (Lake Breeze Index) is a function of the average wind speed during the day at the inland site and the difference between the water surface temperature and maximum inland air temperature. The LBI has been used successfully by Comer and Mckendry [64]. Some studies use the data of site observations to determine the development and end of the sea or lake breezes by judging the shear of the near-surface wind direction and the subsequent changes in the temperature and humidity on the shore [65,66]. With the combined use of satellite, radar and sounding data, the criteria for measuring a lake breeze by means of synoptic analysis show more accurate and refined results [25,67,68,69]. In this paper, observation data are used to judge the beginning, ending and duration of a lake wind according to the standards of Wang et al. in 2017.

4.2. From Model Output

The fine-scale numerical simulation provides data support for quantifying the horizontal penetration distance of the lake breeze. The statistical method used in this paper for the breeze characteristic quantity is as follows: (1) the center point of Lake Taihu (120.1° E, 31.2° N) is tangent along the longitude and latitude, and the four points intersecting with the lakeshore are defined as the reference points on the east, west, south and north shores; (2) the Lombardo et al. (2018) method is referred to calculate the lake breeze penetration distance, namely using the 50-m level wind data to calculate the wind field convergence ( Vh = ( U x + V y ) Rate   of   change   of   horizontal   area   per   unit   time ); (3) starting from the reference point and along the longitude and latitude directions to judge, respectively, the distance between the four reference points and the maximum convergence of the wind field is the horizontal penetration distance. Because most of the observed sites are on the shore, in order to compare the observations, the starting and ending times of the lake breeze are respectively determined as the time when the wind speed convergence zone reaches the shore and the time when the wind speed convergence zone disappears. The duration is from the beginning time to the end time. When the duration is not 0, the day is judged to be a lake breeze day.

5. Model Evaluation

5.1. Surface Fluxes

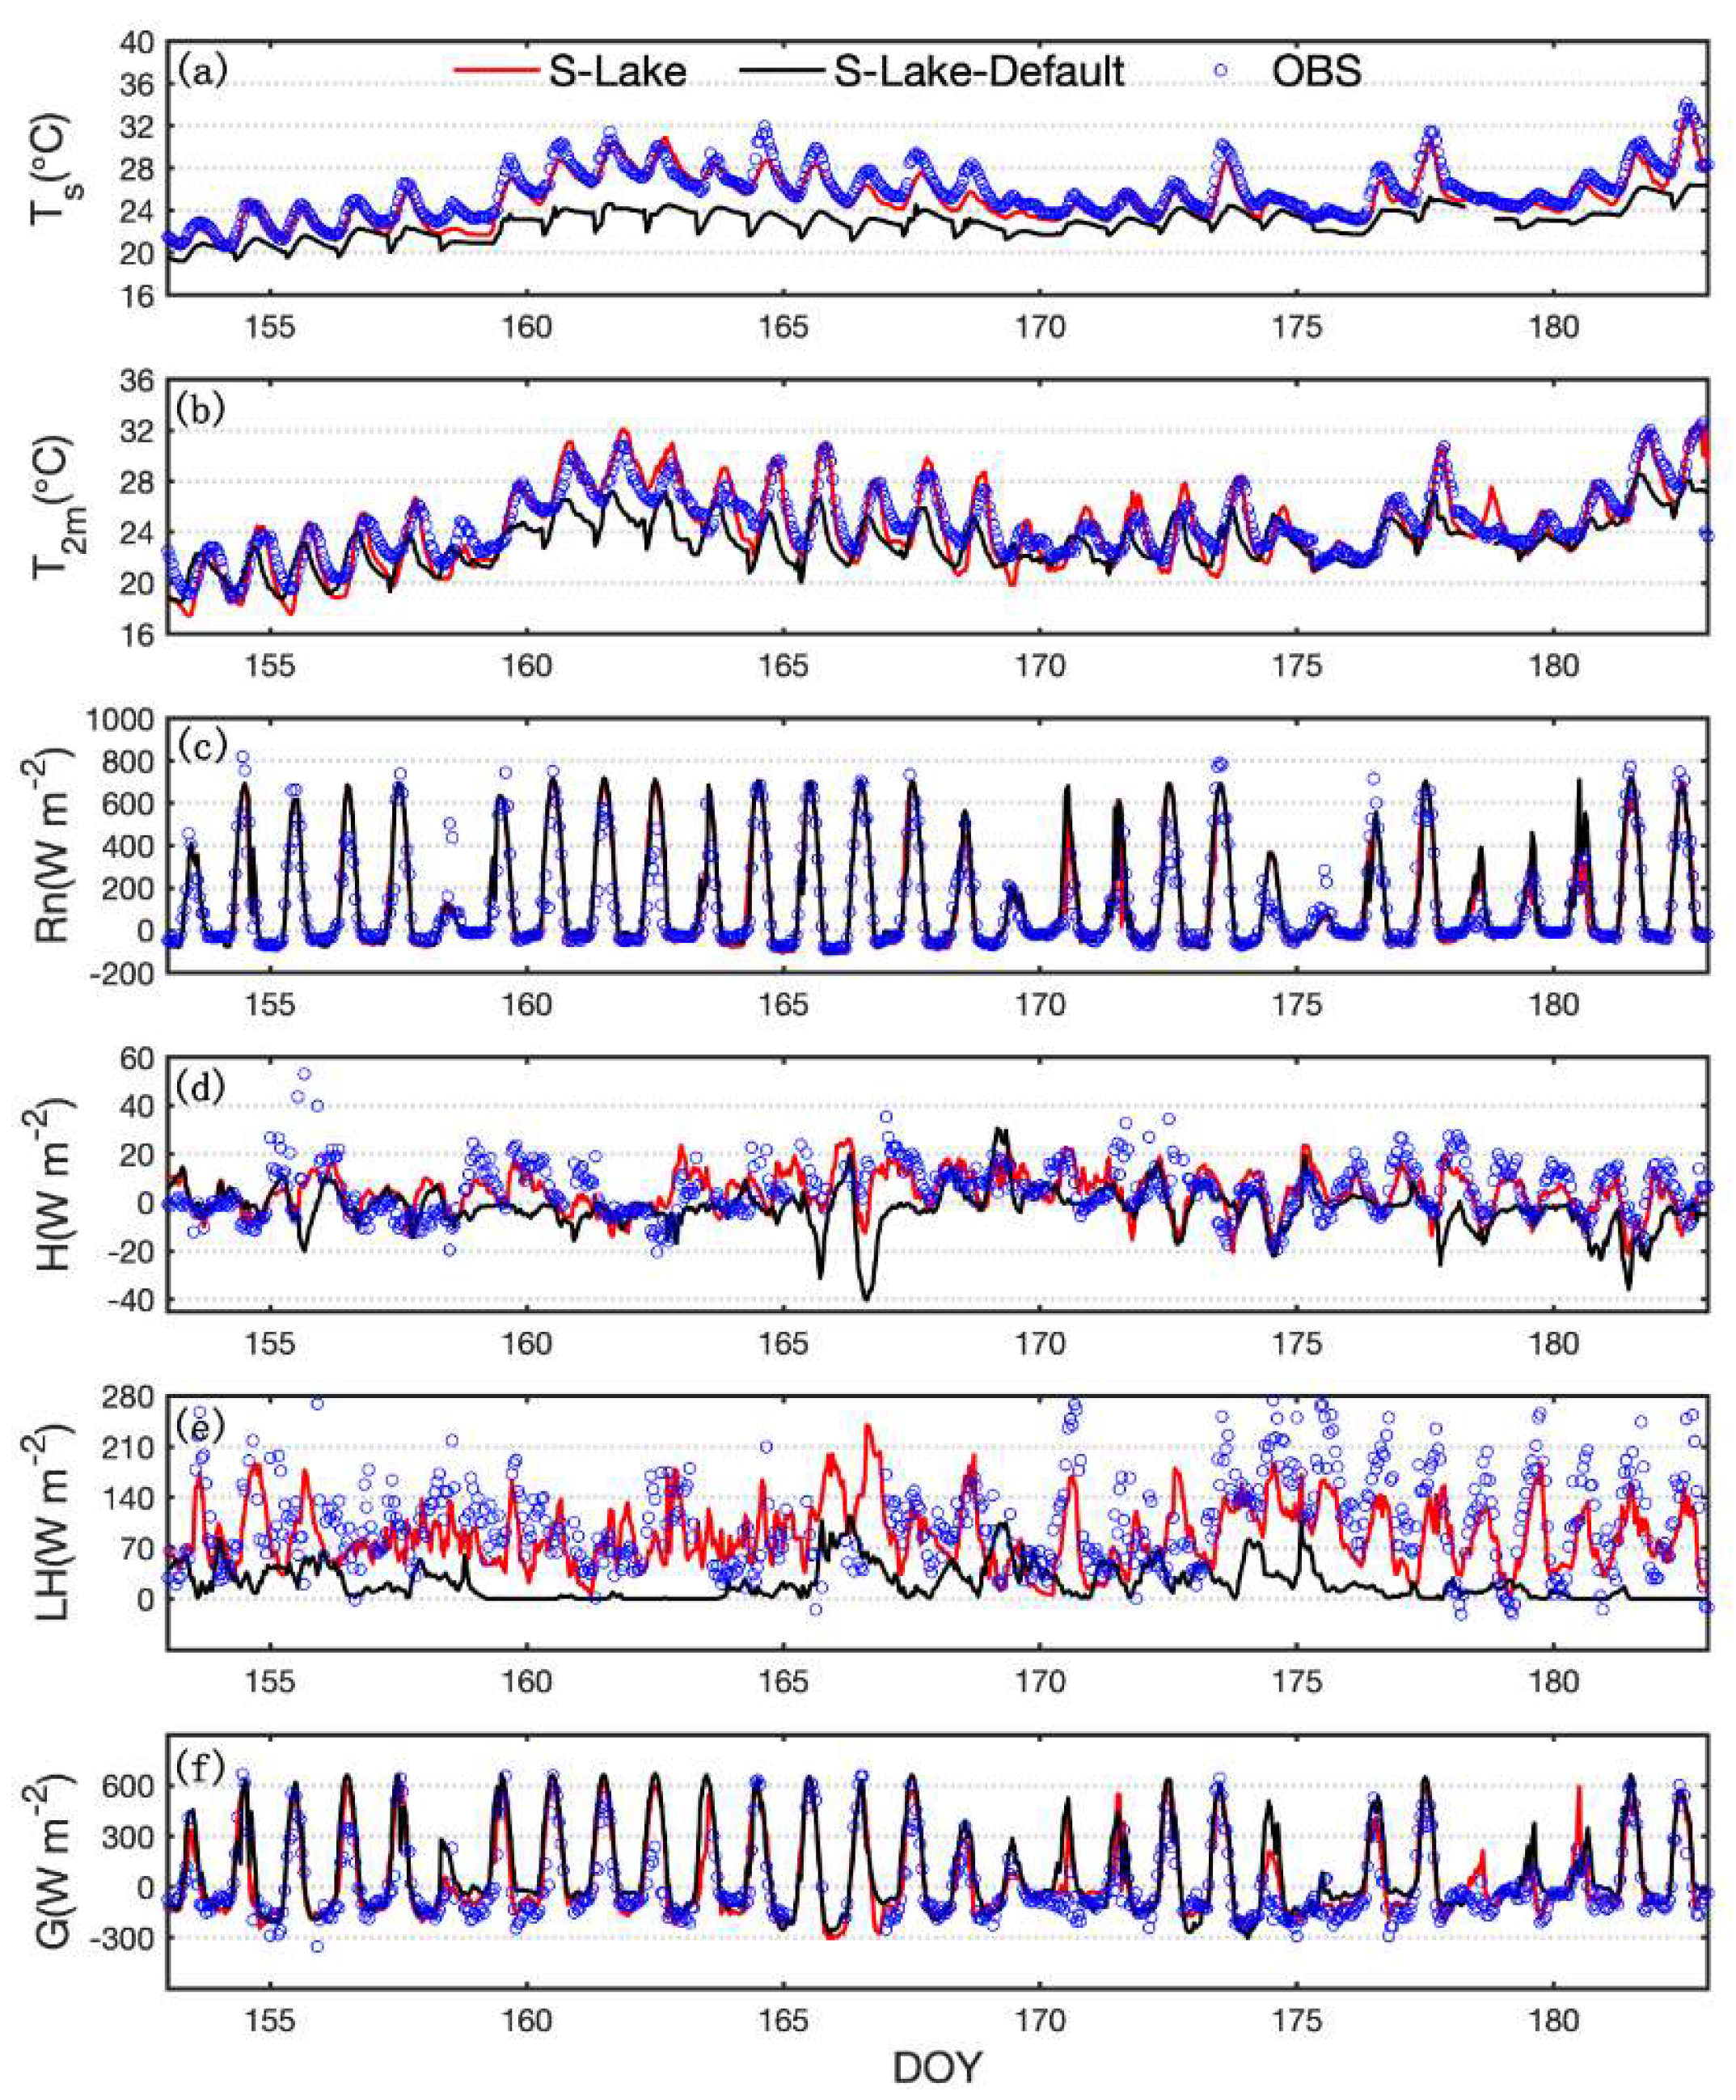
Accurate predictions of the surface fluxes are necessary for realistic simulations of the lake breeze dynamics. In Figure 2, the simulated lake skin temperature, 2 m air temperature and four components of the lake-surface energy balance are compared with their observed counterparts at the in-lake eddy covariance site, BFG (Figure 2), in June 2012. Table 2 provides detailed statistics for the whole simulation period (June–August 2012) for each of the four eddy covariance sites (BFG, MLW, DPK and DS). The S-Lake case has reasonably reproduced the observed surface temperature, 2 m air temperate over the lake, sensible heat flux and latent heat flux. Compared to the S-Lake-Default case, an improvement is obvious in the diurnal courses of these quantities. As pointed out above, due to a very small depth-to-size ratio, and the dense submerged plants in the lake body, the turbulent heat exchange effect of Lake Taihu is very small in summer, and the turnover of lake water shows a significant diurnal variety. The S-Lake simulations, by adjusting the thermal eddy diffusivity, albedo, roughness length and the ratio of radiation entering the water, all these calibrations result in a better simulation of the lake–air exchange, and the modeled Ts matches the observed value quite well (Figure 2a). The S-Lake-Default Ts can have large deviations: on June 9 (DOY 161, a clear day), the default prediction of Ts is biased by as much as 8 °C, and the corresponding prediction of T2m is biased by similar amounts (Figure 2b). Both the S-Lake-Default and S-Lake simulations have reasonably captured the diurnal and day-to-day variations in Rn (Figure 2c). However, S-Lake has smaller root-mean-square errors (RMSE) and larger correlation coefficients (RC) than the calibrate because S-Lake has produced more accurate and outgoing long-wave radiation, as indicated by a better simulation of the skin temperature. In the cases of H and λE, the S-Lake values are greater than the S-Lake-Default, and have a better match with the observed diurnal variations, especially on fair weather days (e.g., 172–183; Figure 2d,e). S-Lake has also achieved good agreement for the heat storage term. In Figure 2e, the latent heat exchange at the lake surface is related to the wind speed at the lake surface, thus, the turbulent exchange coefficient and the difference in water vapor at the lake’s surface. Of these, the turbulent exchange of the lake surface fluxes is, in turn, influenced by wind and wave interactions. Whereas the lake in this study remains static, and no physical mechanism for the wind and wave interaction exists, thus for the latent heat exchange, the simulated values are smaller than the observed values.
Generally, S-Lake has shown superior performance over S-Lake-Default for the three lake sites (FGF, MLW, DPK), as measured by the RMSE and RC (Table 2). Having different distances to the shore, these sites were subject to different degrees of land influence. BFG is furthest from the shore (4 km) and is the best site representing the open water. At this site, S-Lake has a much-improved performance over S-Lake-Default. The RMSE of Tskin is reduced from 3.24 °C to 1.59 °C, and the RC improved from 0.81 to 0.92. Similarly, the RMSE for the latent heat flux improved from 89.5 to 44.8 W m−2 and the RC from −0.04 to 0.71. Because MLW and DPK are closer to the shore (a distance of 150 m for MLW and 2 km for DPK), the measurements were subject to some land influence, and as a result, the agreement between the S-Lake simulations and the observations is not as good as for BFG. At the DS land site, the strong diurnal variations in H and LE have been captured by both the S-Lake and S-Lake-Default. The reader is reminded that the same NOAH scheme was used for this land grid in the two simulations. However, S-Lake performs slightly better since the lake’s influence on the driving variables is better simulated.

5.2. Surface Air Temperature and Wind

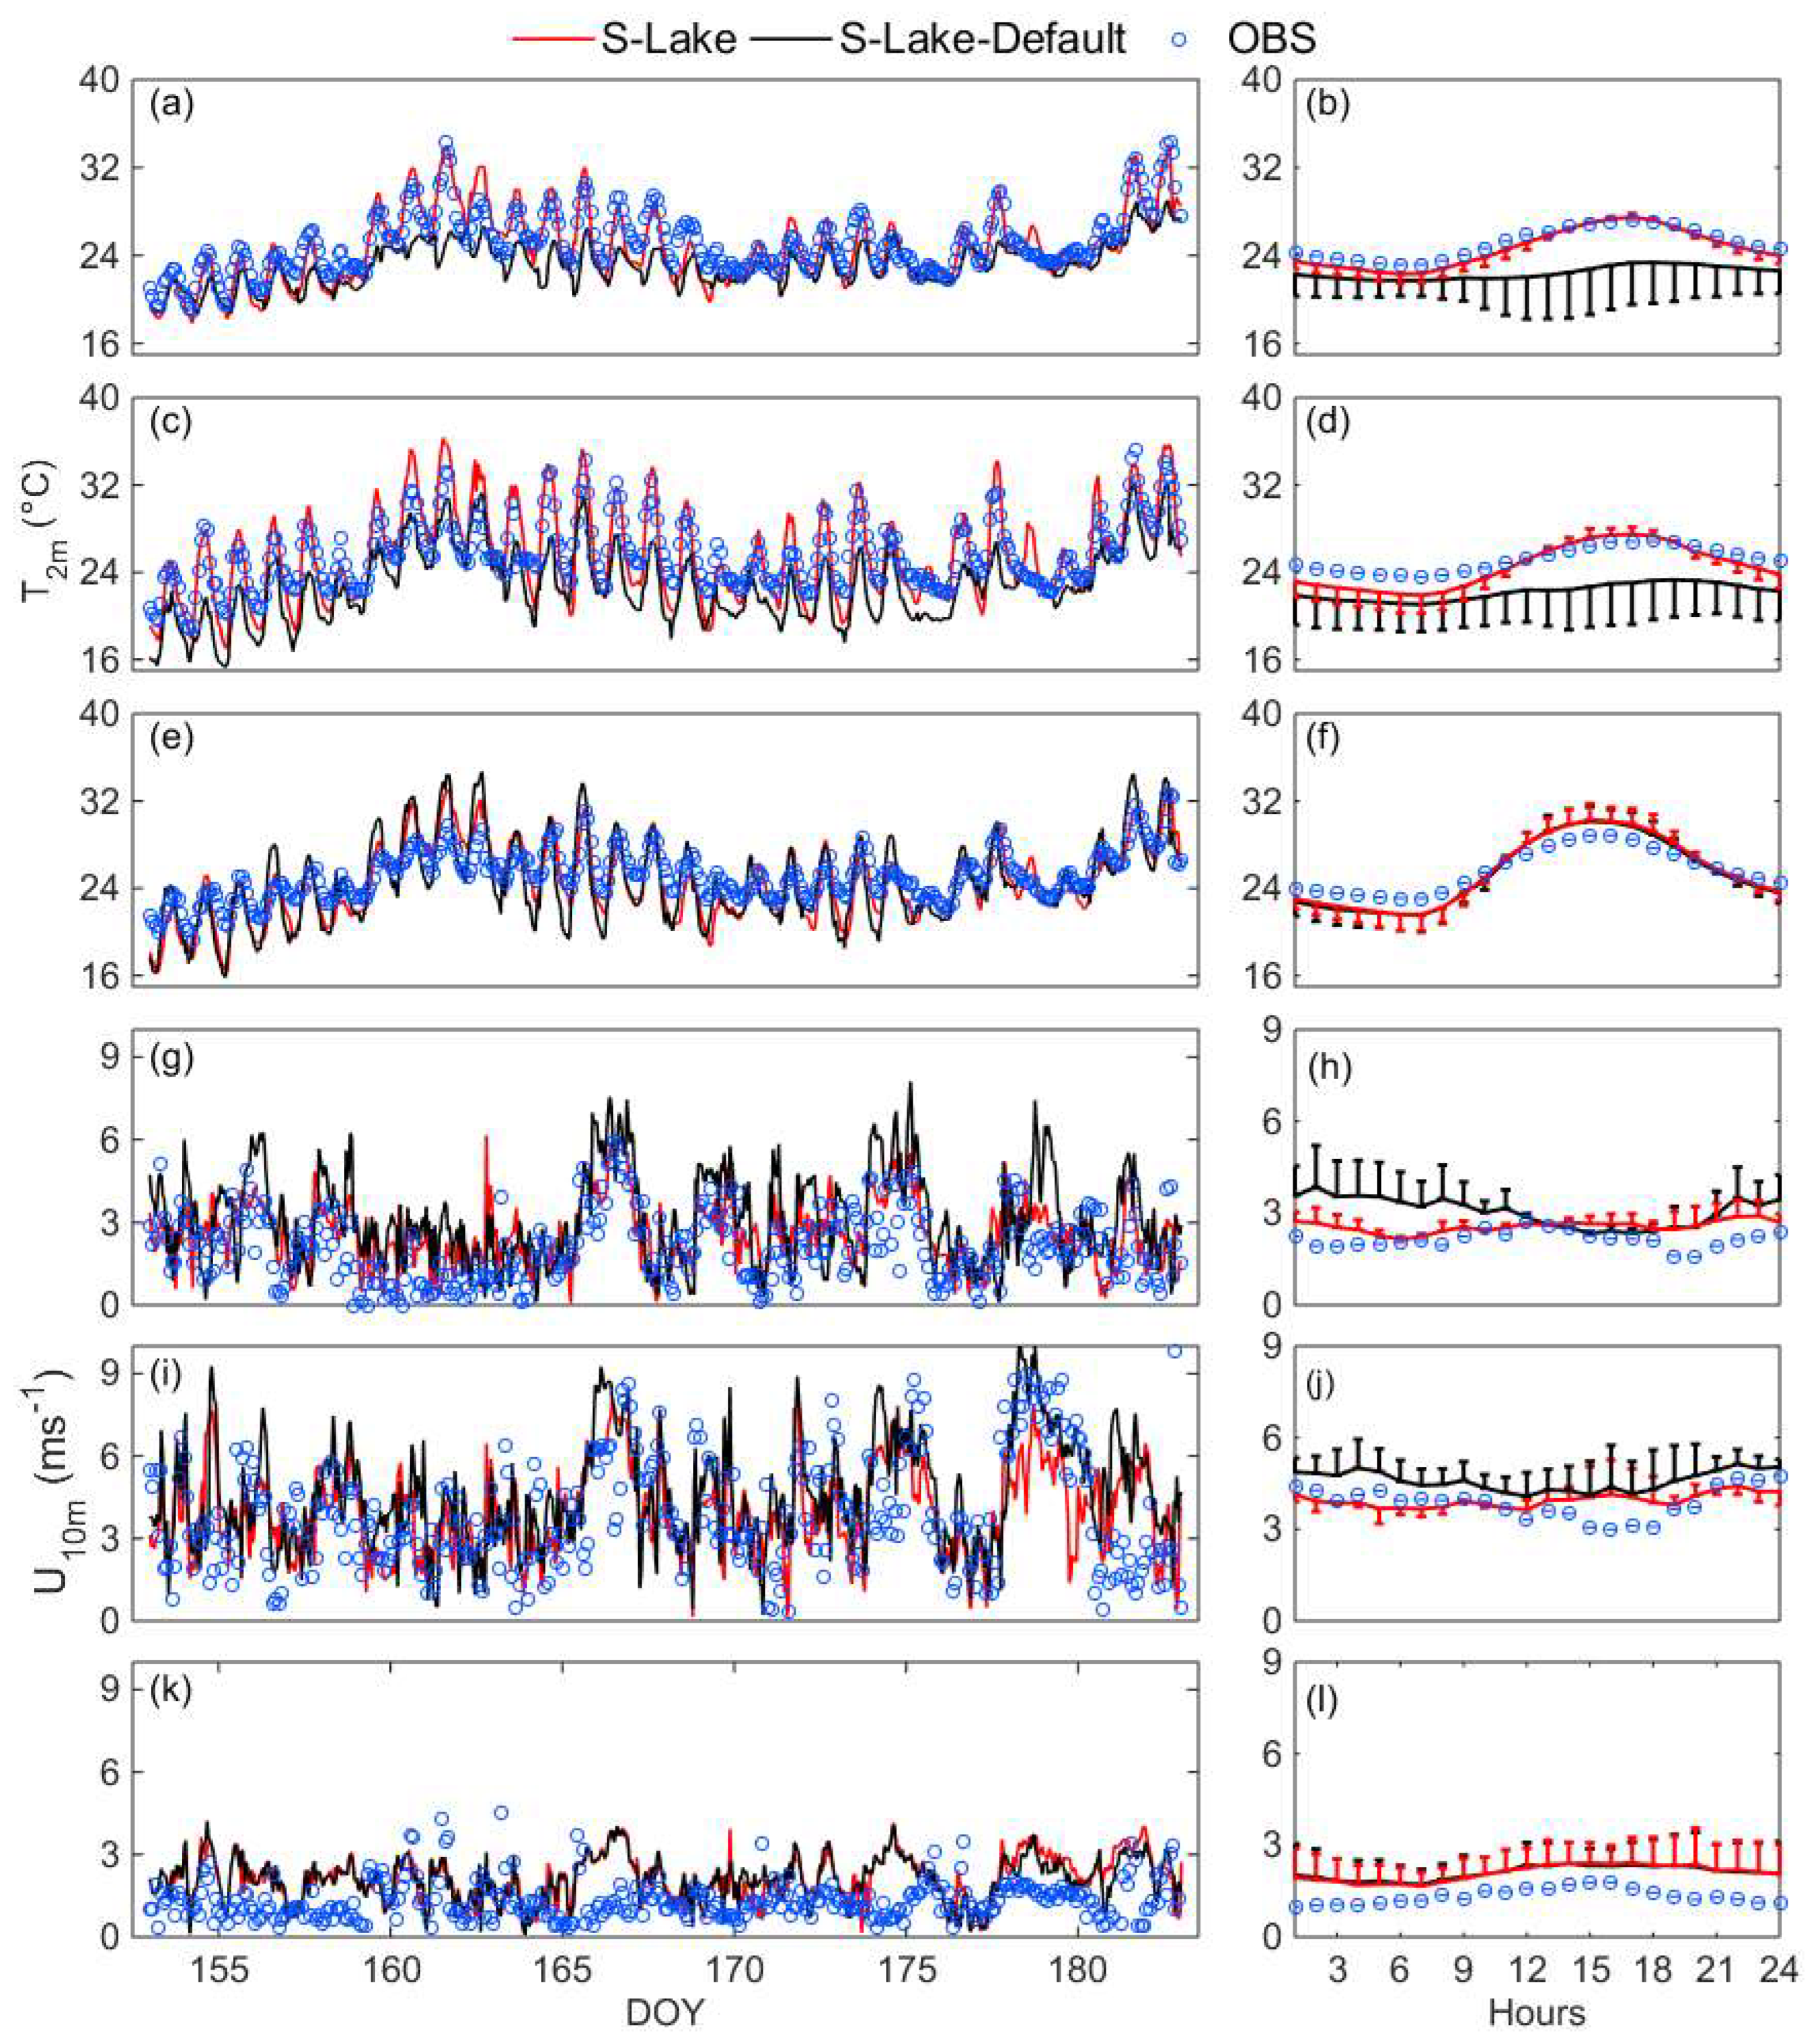
The above analysis demonstrates that S-Lake has captured the temporal dynamics of the surface air temperature observed over the lake very well. We now show that it has also improved the prediction of the surface air temperature over the surrounding land. Here, three stations were selected for a comparative analysis (Figure 3). Station K5002, K5060 and 58443 are automatic stations located on the southwest bank of Lake Taihu and are 2 km, 6 km, and 21 km away from the shore, respectively. Similar to the results shown in Figure 2b, the 2 m air temperature calculated by S-Lake matches that observed at K5002 very well, whereas the T2m calculated by S-Lake-Default is too low (Figure 3a). The S-Lake-Default low biases are especially large in the midday hours (10:00–14:00) of clear days, reaching about 5 °C (Figure 3b). Low biases are also seen for S-Lake-Default at K5060. Unlike the onshore station, where good agreement has been achieved on the diurnal temperature range (Figure 3c), at K5006, the diurnal amplitude of the S-Lake T2m is larger than the observed amplitude (Figure 3c): the modeled diurnal temperature range is on average, 4.6 °C in June, and the observed value is 3.8 °C (Figure 3d). One possible reason for this discrepancy may have been that the soil moisture at this grid point is too low, and the simulated temperature has a larger daily range. At a distance of 21 km from the shore (station 58443), both S-Lake and S-Lake-Default have produced very accurate diurnal variations, although the former has a slightly better performance (Figure 3f).
Turning attention to the 10 m wind speed, S-Lake has improved the 10 m wind speed prediction. In S-Lake-Default, the 2 m air temperature is too low over the water, causing a too strong thermal contrast and the pressure gradient between the water and the land. Consequently, its surface wind is greater than the observed values (Figure 3g,h, Table 3). This problem disappeared in the S-Lake simulation. The improvement is obvious at the onshore station, K5002 (Figure 3g), and the land station near shore, K5060 (Figure 3i). At the station further away from shore, 58443, both S-Lake and S-Lake-Default have simulated the wind speed reasonably well, and the difference between the two simulations is small (Figure 3k,l).
Generally, S-Lake provides a markedly improved prediction in low background wind and clear sky conditions. Under these conditions, the surface has a strong forcing influence on the lower atmospheric boundary layer. From 7 June to 12 June (DOY 159–164), there is little cloud cover with strong radiation (Figure 2c), and the wind speed is low (Figure 3g). In this period, the 2 m air temperature at station K5002 increases progressively over time (Figure 3a), reaching 36.3 °C, the highest of the month, at 14:00 on 9 June (DOY 161). S-Lake reproduced this maximum temperature of 36.0 °C (Figure 3a) and the low wind speed condition (3–4 m s−1; Figure 3h) quite well. In comparison, the S-Lake-Default wind speed is too high (5–6 m s−1; Figure 3h).
The surface climate is less sensitive to the choice of land surface schemes at increasing distances from the shore. Table 3 provides a summary of the RMSE and RC of the predicted wind speed and air temperature for all the stations. These stations are numbered sequentially according to their locations. Stations 1–3 are on the lake, 4–10 are within 2 km from the shoreline, 11–14 are within 10 km from the shoreline, and 15–19 are within 30 km from the shoreline. The average RMSE of the S-Lake-Default air temperature is 2.97 °C, and the RC is 0.79 for the lake stations. The corresponding values for S-Lake are 1.62 °C and 0.91. The sites closer to Lake Taihu (within 5 km) are with greater improvement in the simulation result, while the stations with a 30 km distance (Stations 19–23) and the S-Lake and S-Lake-Default results are basically indistinguishable.

6. Results and Discussion

6.1. Lake Breeze Frequency

Table 4 tallies the percentage of the days of lake breeze occurrence according to the observations and the D-lake and S-Lake cases for the four lake shores. According to the observational data, the frequency of occurrence is highest in June (26.7%) and then drops to 9.67% in July and 19.4% in August. The lower frequency in July and August is related to the unfavorable synoptic perturbations associated with a series of four tropical cyclones. On average, the frequency of occurrence for June–August is 20.7%. The frequency is slightly higher (22.8%) on the east and north coasts than on the west and south coasts, suggesting that the daytime urban heat islands of the cities on the east and north coasts are a factor enforcing the lake circulation.
The overall occurrence frequency in S-Lake is 18.5% in June–August, which is in excellent agreement with the observations. In this period, the observations indicated 17 days with a lake breeze occurrence on the four shores. The S-Lake simulation successfully predicted 14 of these events, yielding an accuracy of 82.4%.
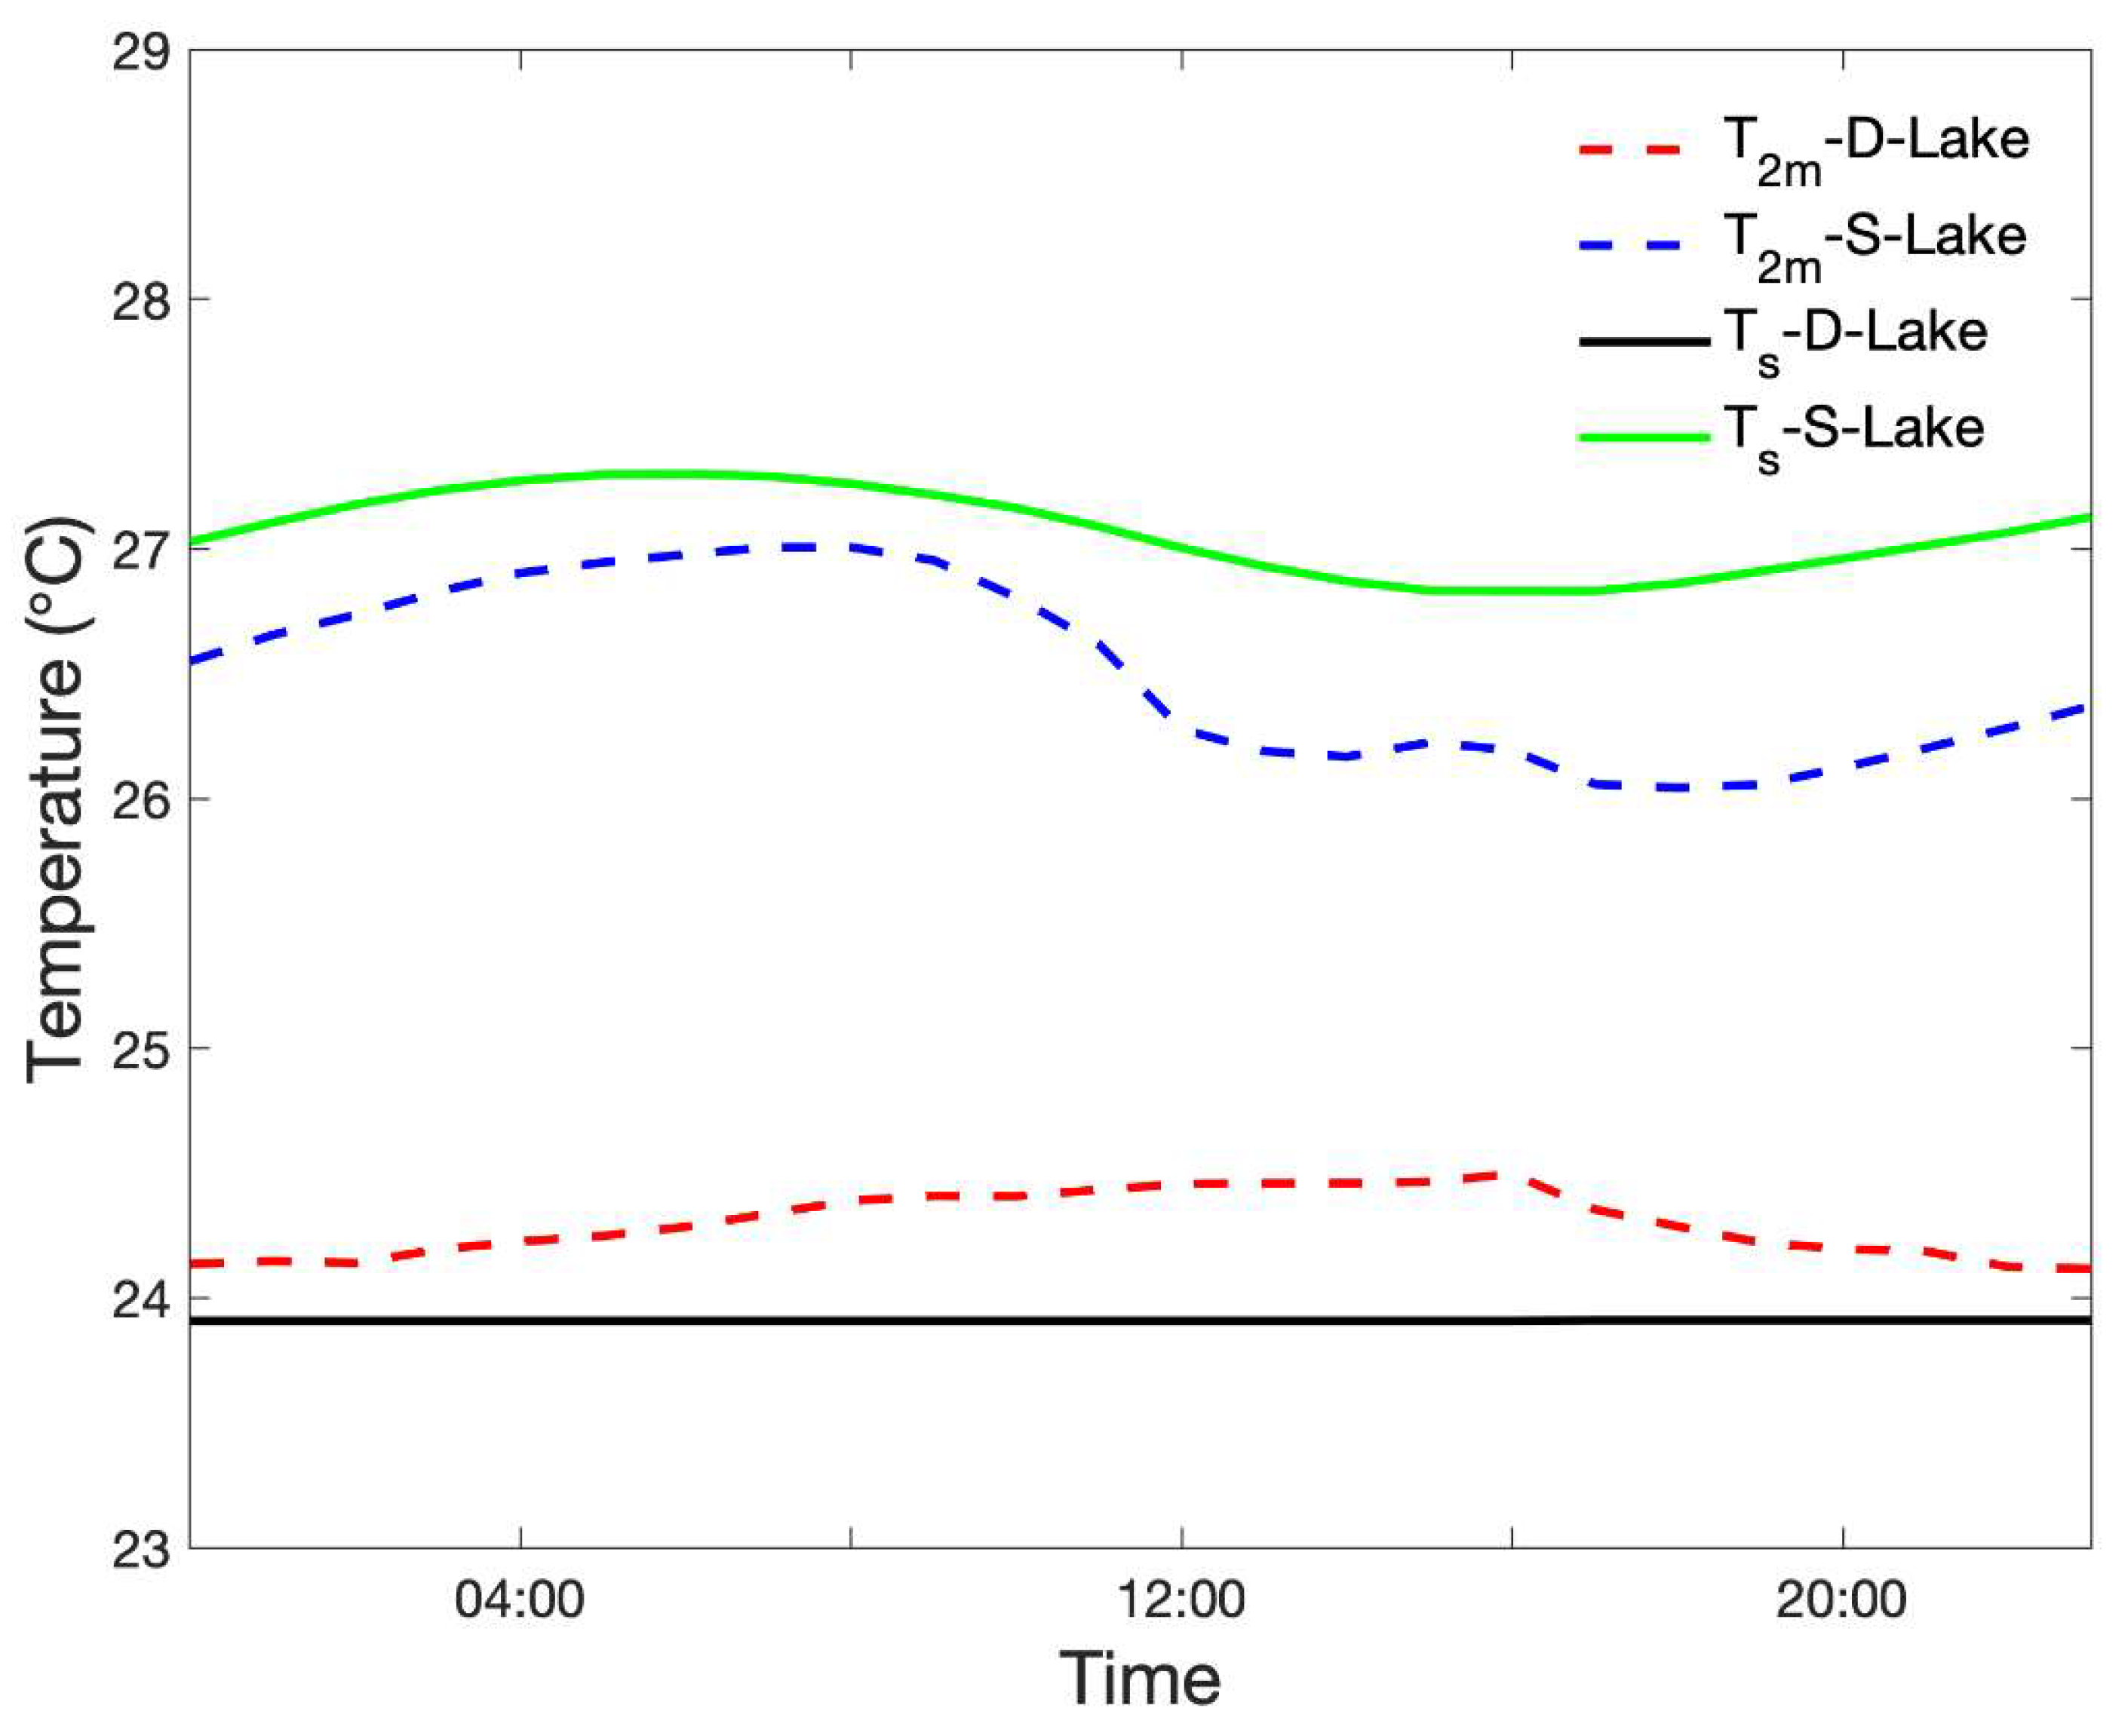
The occurrence frequency, according to D-Lake, is much higher, at 38% for June to August. The direct cause of this bias is the fact that D-Lake has too low a lake surface temperature and near-surface air temperature, resulting in a too strong thermal contrast between the lake and the land. The low-temperature bias can be as large as 9.9 °C for the surface and 8.7 °C for the air temperature at 2 m, and the average values were about 3.1 °C and 2.2 °C (Figure 4). Even on days of strong geostrophic wind (6 m s−1, 23 June and 20 July) with no observational evidence of a thermal circulation, the thermal contrast is strong enough in D-Lake so that the model would predict a moderate lake breeze (duration of 8 h). In this case, the model has not missed any of the observed events but has predicted twice as many.
The occurrence frequency for Lake Taihu is much lower than that reported for the southern Great Lakes region. According to Sills et al. [26], the frequency of days with a simultaneous lake breeze near Lake Huron, Lake Erie and Lake St. Clair is 83% for the summer (June–August) of 2007. The difference can be explained in several ways. First, the water depth is quite different. The average depth of the three northern lakes is 27 m, whereas the average depth of Lake Taihu is only 1.9 m. Zumpfe et al. [26] showed that from 1948 to 2003, the number of lake breeze fronts detected near the shore of the Great Salt Lake varied with water depth, showing a positive linear correlation of 0.75. When Lake Taihu was simulated as a deep lake similar to the ocean, the surface temperature of the lake was almost constant and did not respond to external weather conditions. Compared with the shallow lake, the frequency of Lake Taihu’s breeze increased from 28.3% to 52.2%.
Secondly, the background synoptic conditions at Lake Taihu are less favorable for lake breeze formation than in the Great Lakes region. The summer months are the peak monsoon season of the Yangtze River Delta. Although the climate bulletin of Jiangsu Province showed that this year was a little drier and warmer and had lower precipitation than the climate norm in the Lake Taihu basin, the east Asian summer monsoon still had a significant negative impact on the formation of a lake breeze. As explained earlier, during the study period, there experienced at least five cyclonic disturbances, producing a total amount of 492.5 mm of precipitation. According to the statistics of three months of NCEP reanalysis data and obversion data from the sites, only 17 days in these three months are sunny, with solar radiation reaching more than 80% of the climate mean, and the geostrophic wind speed is less than 5 m s−1. Therefore, the actual lake breeze frequency of all the shores in Lake Taihu is only 18.5% during the summer of 2012. The unfavorable synoptic conditions at Lake Taihu explain why the frequency of occurrence in the D-Lake simulations, which essentially assume that Lake Taihu is a deeper lake, is also lower than the occurrence frequency for the Great Lakes. Even in the coastal regions of Jiangsu province, which is 150 km east of Lake Taihu, Huang et al. [70] showed that the frequency of sea breeze was only 52% in the summer of 2011, and it was larger than the deep lake case in this paper.
Furthermore, the temporal and spatial resolutions of the observational networks can affect lake breeze statistics. The occurrence frequency observed at Lake Taihu is higher than reported by Zumpfe [25] for the Great Salt Lake. The Great Salt Lake is also shallow (depth 4.5 m) and is larger in size (area 4400 km2) than Lake Taihu (area 2400 km2). Zumpfe’s study was based on observations made at a single weather station 10 km away from the shore. He detected an occurrence frequency of only 10% with the lake breeze from June to August; events with a penetration distance of less than 10 km may have evaded his detection. Lake Manitoba (with a maximum depth of 7 m and an area of 4624 km2) was equal in size to the Great Salt Lake; perhaps because there were more observations of different shores, and the lake breeze was about 37% on any lake shore in the warm season [36], and the lake breeze frequency at any shore of Lake Taihu can also be 38%. Furthermore, for a dense network of observations, the lake breeze of the Great Lake reached 73% (Lake Ontario) [69] and 90% (Lake Huron, Lake Eire) [26] in summer.

6.2. Onset Time, Ending Time and Duration of Lake Breeze

According to the observational data, the mean onset time is 10:30 (Figure 5). On mornings with a clear sky and low synoptic wind speed (DOY 165, DOY212 and DOY229), the circulation can start as early as 09:00. If there is cloud cover in the morning (DOY155, DOY173 and DOY243), the onset time would be delayed until 12:00. The average end time is 16:00. Sometimes the circulation is terminated early by the invasion of a cold air mass from the north (end time 13:00, DOY 234). On days of persistent clear skies (DOY154, 157, 159, 160, 198, 202 and 226), the circulation would last until 17:00. The lifetime of the circulation varies from 2 h to 8 h, with an average value of 5.5 h. For comparison, the lake breeze circulation in the southern Great Lakes region starts at about the same time as Lake Taihu but lasts longer (9 h) [26].
The observed start time varies slightly among the four shores. Generally, the circulation starts about 1 h sooner on the east and north, and on days with a low background wind, it lasts ~1 h longer than on the west and south shores. We interpret this as evidence of enhancement by the thermal circulations induced by urban heat islands.
The start and end times of the S-Lake simulated lake breeze are in very good agreement with the observations (Figure 5). The lake breeze in D-Lake starts, on average, 1.5 h earlier and lasts 2 h longer than the observation. The D-Lake lake breeze starts before 9:00 on DOY160, 162, 183 and 217 and ends very late at 20:00 on DOY 170 and 182, with a lifetime as long as 10 h (DOY 162, 182 and 217).
It is not surprising that the breeze in the Great Lakes in June and July 2007 lasted longer than that for Lake Taihu, which means the start was earlier and the end was later (Figure 5) because the water was deeper and the weather was more favorable. In addition, since the latitude is 10 degrees to the north of Lake Taihu, the Coriolis force may also cause the lake breeze deflection to start earlier.

6.3. Penetration Distance

The horizontal length is an important characteristic value of the lake breeze. A classic lake circulation cell, which formed on the west shore of Lake Michigan, and the characteristic values of the horizontal (l) and vertical (h) length and the horizontal (u) and vertical (w) speed scales have been described by Keen and Lyons [71].
Owing to the topographic and land use variations, some variations in the penetration distance are seen in both S-Lake and D-Lake among the four sides of the lake (Table 5). There are a total of 17 lake breeze events in S-Lake. The average penetration distance at 14:00 is about 10 km in the more urbanized north and east shores and is 6 km and 7 km in the rural south and west shores. Not surprisingly, the penetration distance is dependent on synoptic winds. The maximum value is 33 km, detected on the east shore on DOY154 with a weak geostrophic wind (3.1 m s−1). Sometimes, when the background wind is strong, the lake breeze presents in the form of high deform, and the deflection of the breeze appears only on two or three shores, and the minimum value is 0 km, detected on the south shore and west shore on DOY 183, 192 and 246, with a geostrophic wind of about 4.2–4.6 m s−1.
Lake depth is the most important factor, leading to the penetration distance of the lake breeze. There are 35 (38%) lake breeze events in D-Lake. These events are much stronger than in S-Lake. The mean penetration distance is 14 km, and the maximum is 35 km. The observational network in our work is too sporadic in spatial coverage to allow the determination of penetration distance.
For comparison, Lake Ontario, with its deeper depth and larger area (average depth 86 m, area of 19,000 km2), has an average land penetration distance of about 22 km and a maximum of 63 km in the summer of 2015 (Mariani et al. 2018). However, Lake St. Clair (area of 1114 km2, depth of 3.35 m) is similar in depth to Lake Taihu and has a smaller area, and the mean penetration distance is 27 km with a maximum of 125 km [29]. In addition to the area and the depth of the lake, there are many factors affecting the land penetration distance, including the curvature of the shoreline, the surrounding topography, and the geostrophic wind. Different latitudes lead to different geostrophic wind components. Lake St. Clair’s latitude is 10 °N s higher than that of Lake Taihu. The geostrophic deflection force was one of the possible reasons.

6.4. A Case Analysis

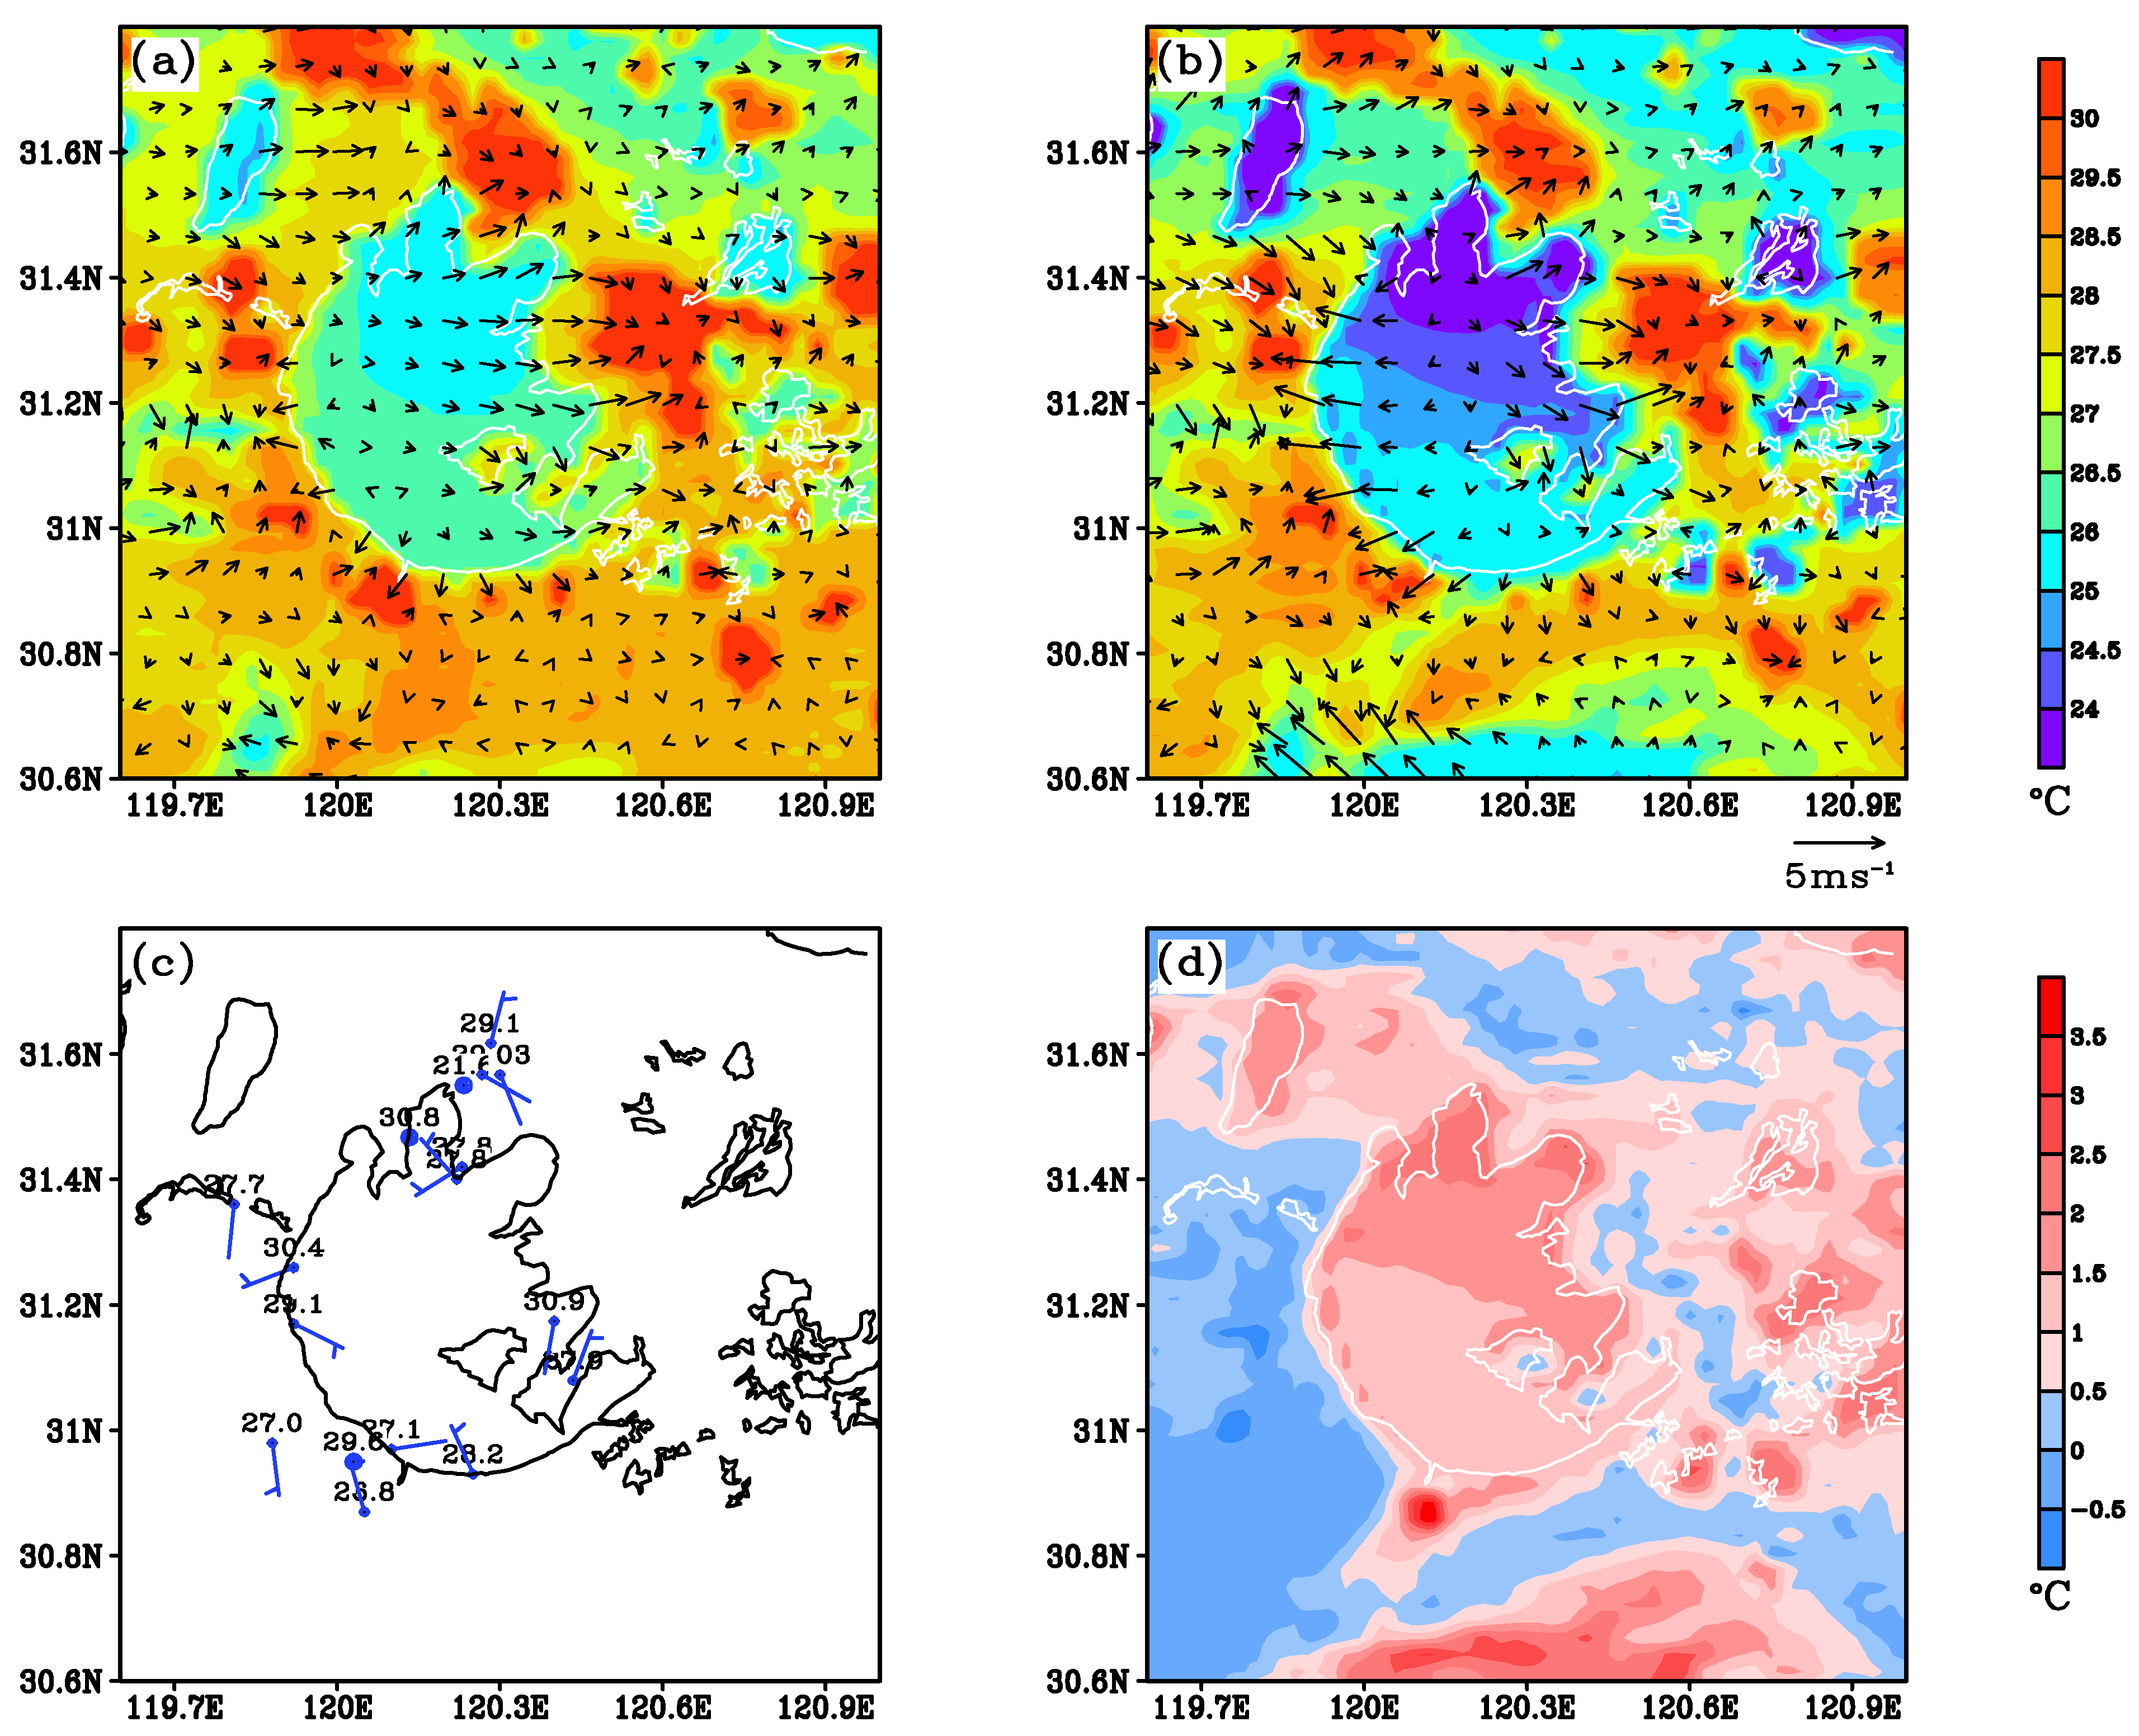
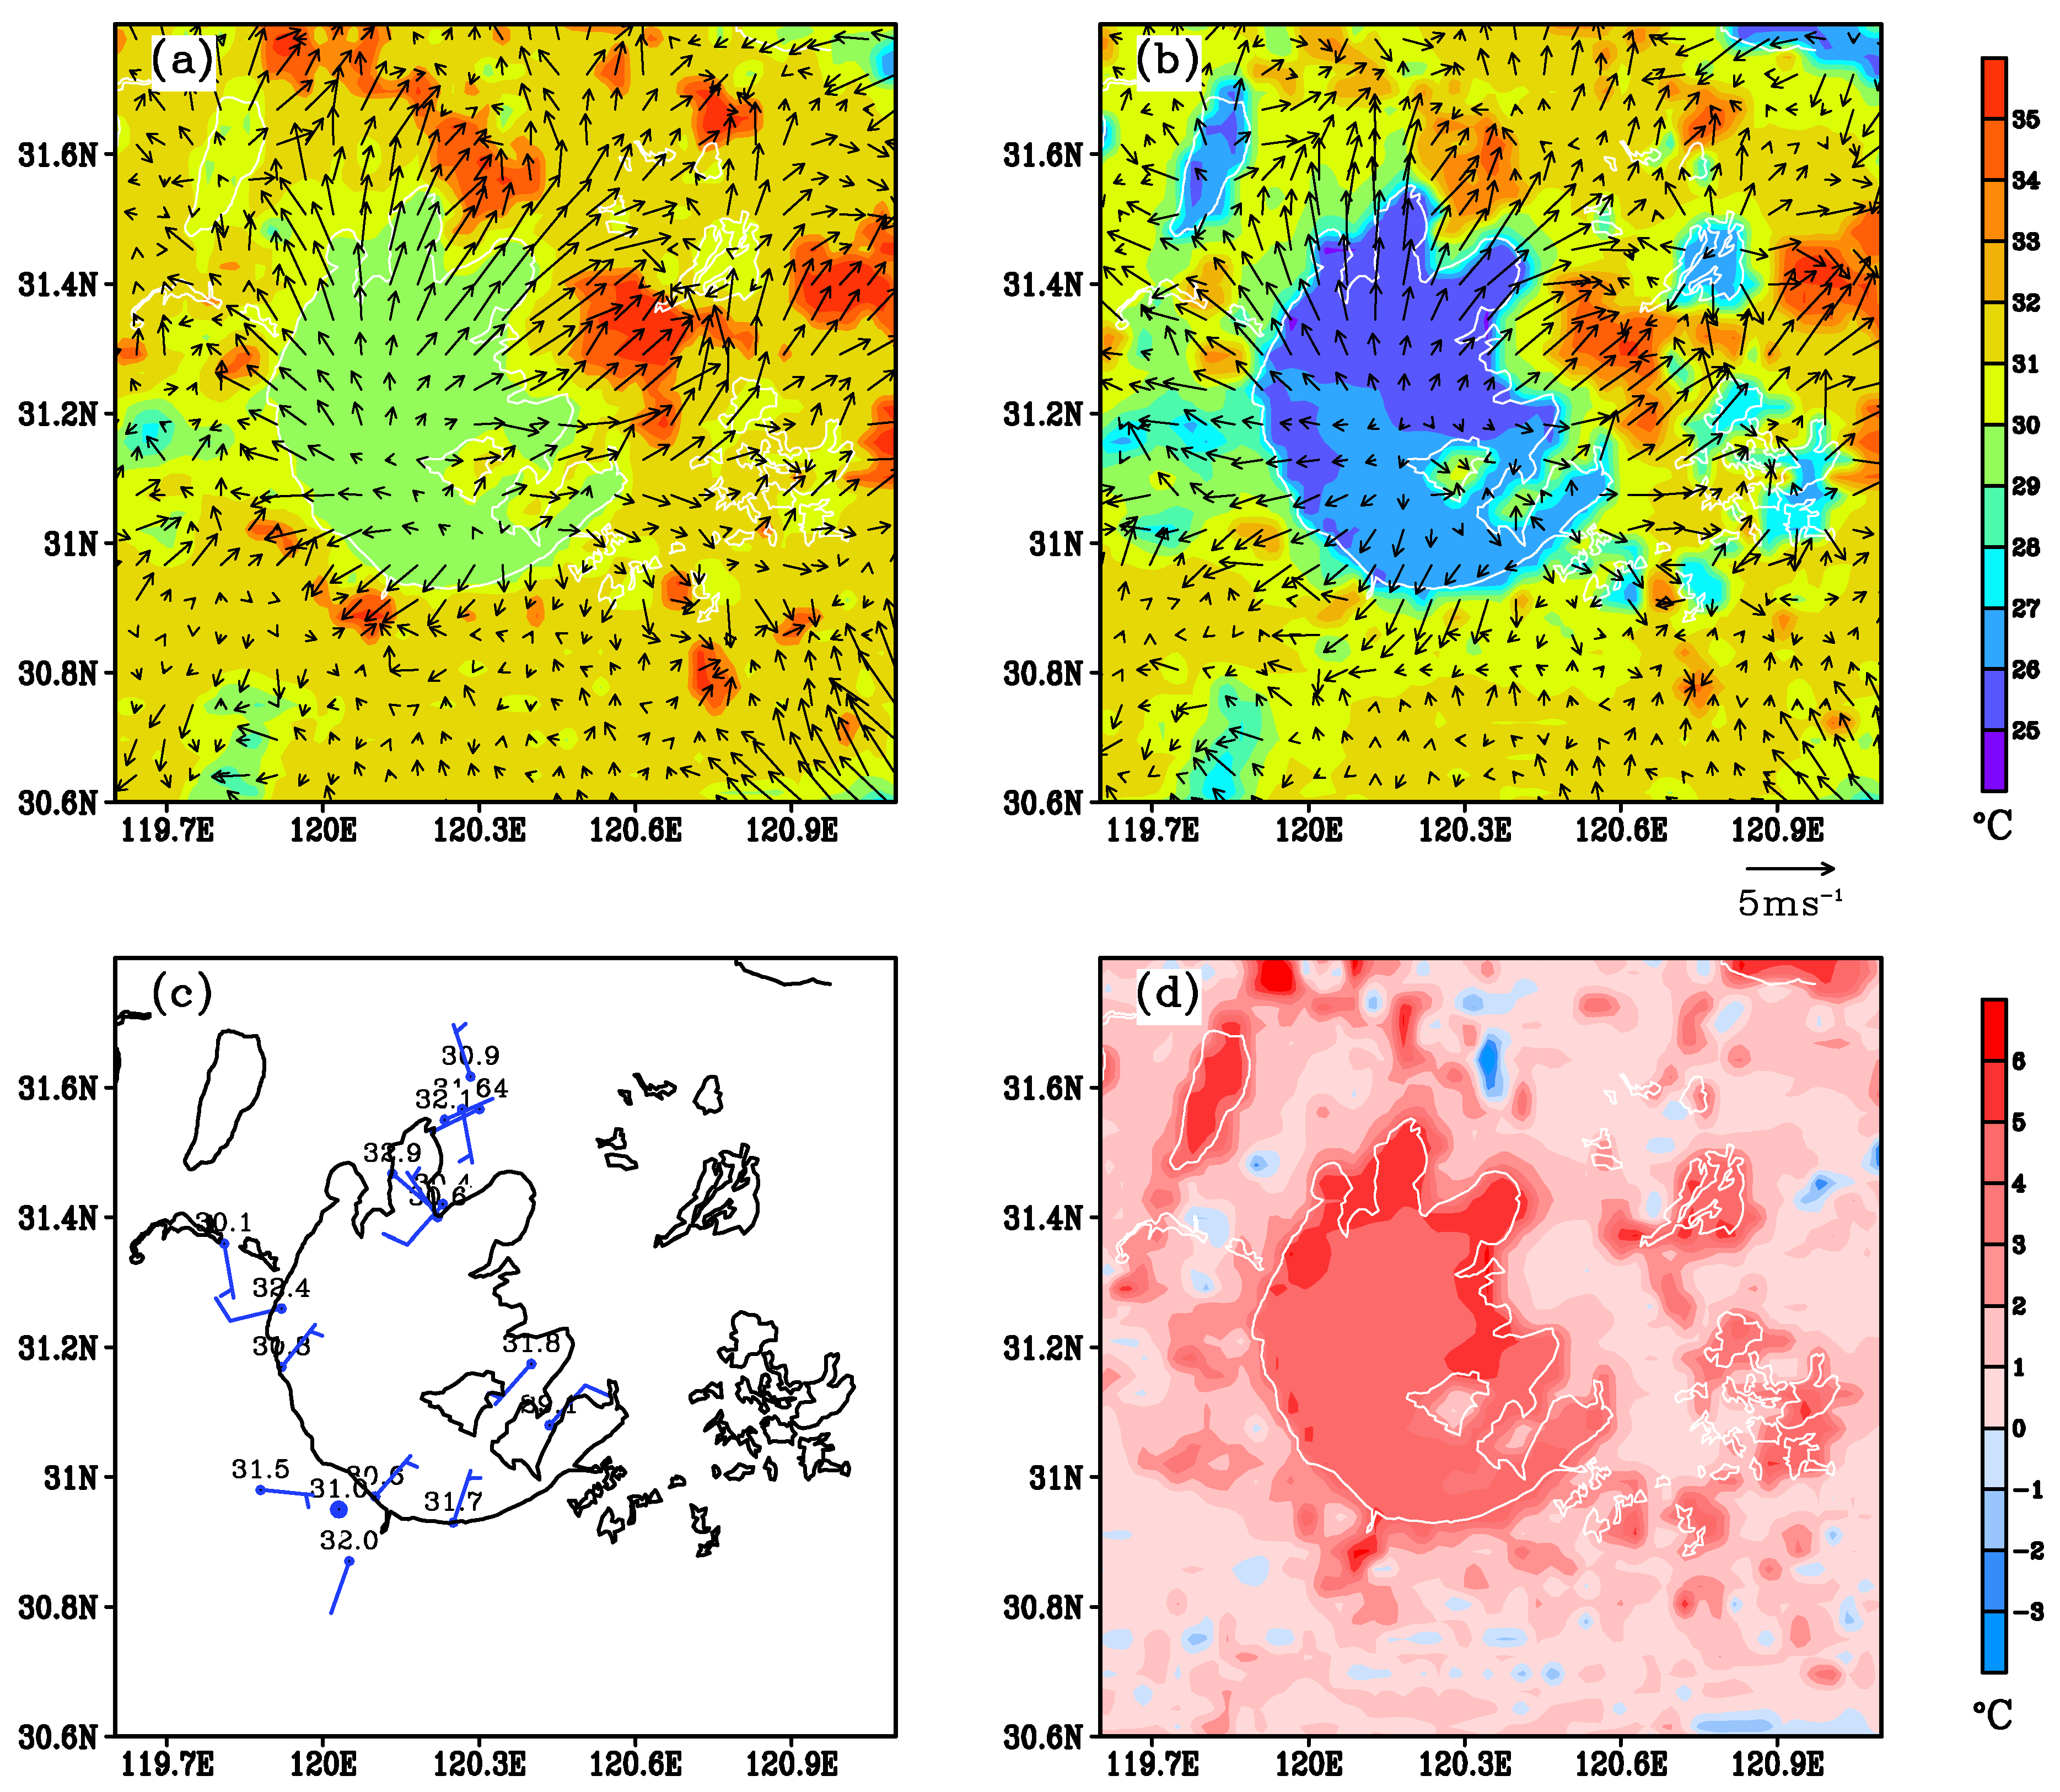
Here, we present a detailed analysis of the lake breeze simulated for DOY 201 to show how the lake depth and surface parameterization affect the formation and development of the lake breeze circulation. On this day, the lake catchment was influenced by a high-pressure system, with the center of the system (surface pressure 1009 hPa) located at 30.2° N, 119° E and 60 km from the lake center. The sky was clear throughout the day, as indicated by the smoothness of the observed incoming solar radiation in the daytime and persistently negative net radiation at night. The geostrophic wind speed varied between 0.7–2.1 m s−1 according to the NCEP reanalysis. The results were presented in a series of plots for 9:00, 14:00 and 18:00 (Figure 6, Figure 7, Figure 8 and Figure 9). Each plot comprises the 2 m air temperature and 10-min velocity field simulated by S-Lake (panel a) and D-Lake (panel b), as well as the observed 10 m wind (panel c) and the difference in the 2 m air temperature between the two simulations (S-Lake minus D-Lake, panel d).
In the S-Lake simulation, at 09:00, the urban land is already noticeably warmer than the rural land and the lake (Figure 6a). This thermal contrast triggered local thermal circulations, and flow convergence and divergence started in the urban land (on the east and north shore) and in the lake, respectively. The lake breeze is also evident on the south and west shores, but the penetration distance is less than 2 km. For comparison, the penetration distance is greater (10 km) on the east shore due to the positive enforcement by urban heating. The simulated wind speed on the land and the lake is about 1–2 m s−1, very comparable to the observed values (Figure 6c)
The surface air temperature in D-Lake was 2–3 °C lower than in S-Lake (Figure 6d). The larger lake-land temperature contrast has resulted in a stronger lake breeze in D-Lake, as shown by the greater penetration distance (15 km on the east shore and 7 km on the south shore) and stronger surface wind (4–5 m s−1).
There is observational evidence that along the smooth west coast, the wind has started to veer from the geostrophic direction to the direction of the lake breeze. This tendency was not obvious in the east, where the coastline shape is more complex. These observed patterns were in good agreement with the S-Lake simulation. In contrast, in D-Lake, the lake breeze overwhelmed the geostrophic flow on all four shores.
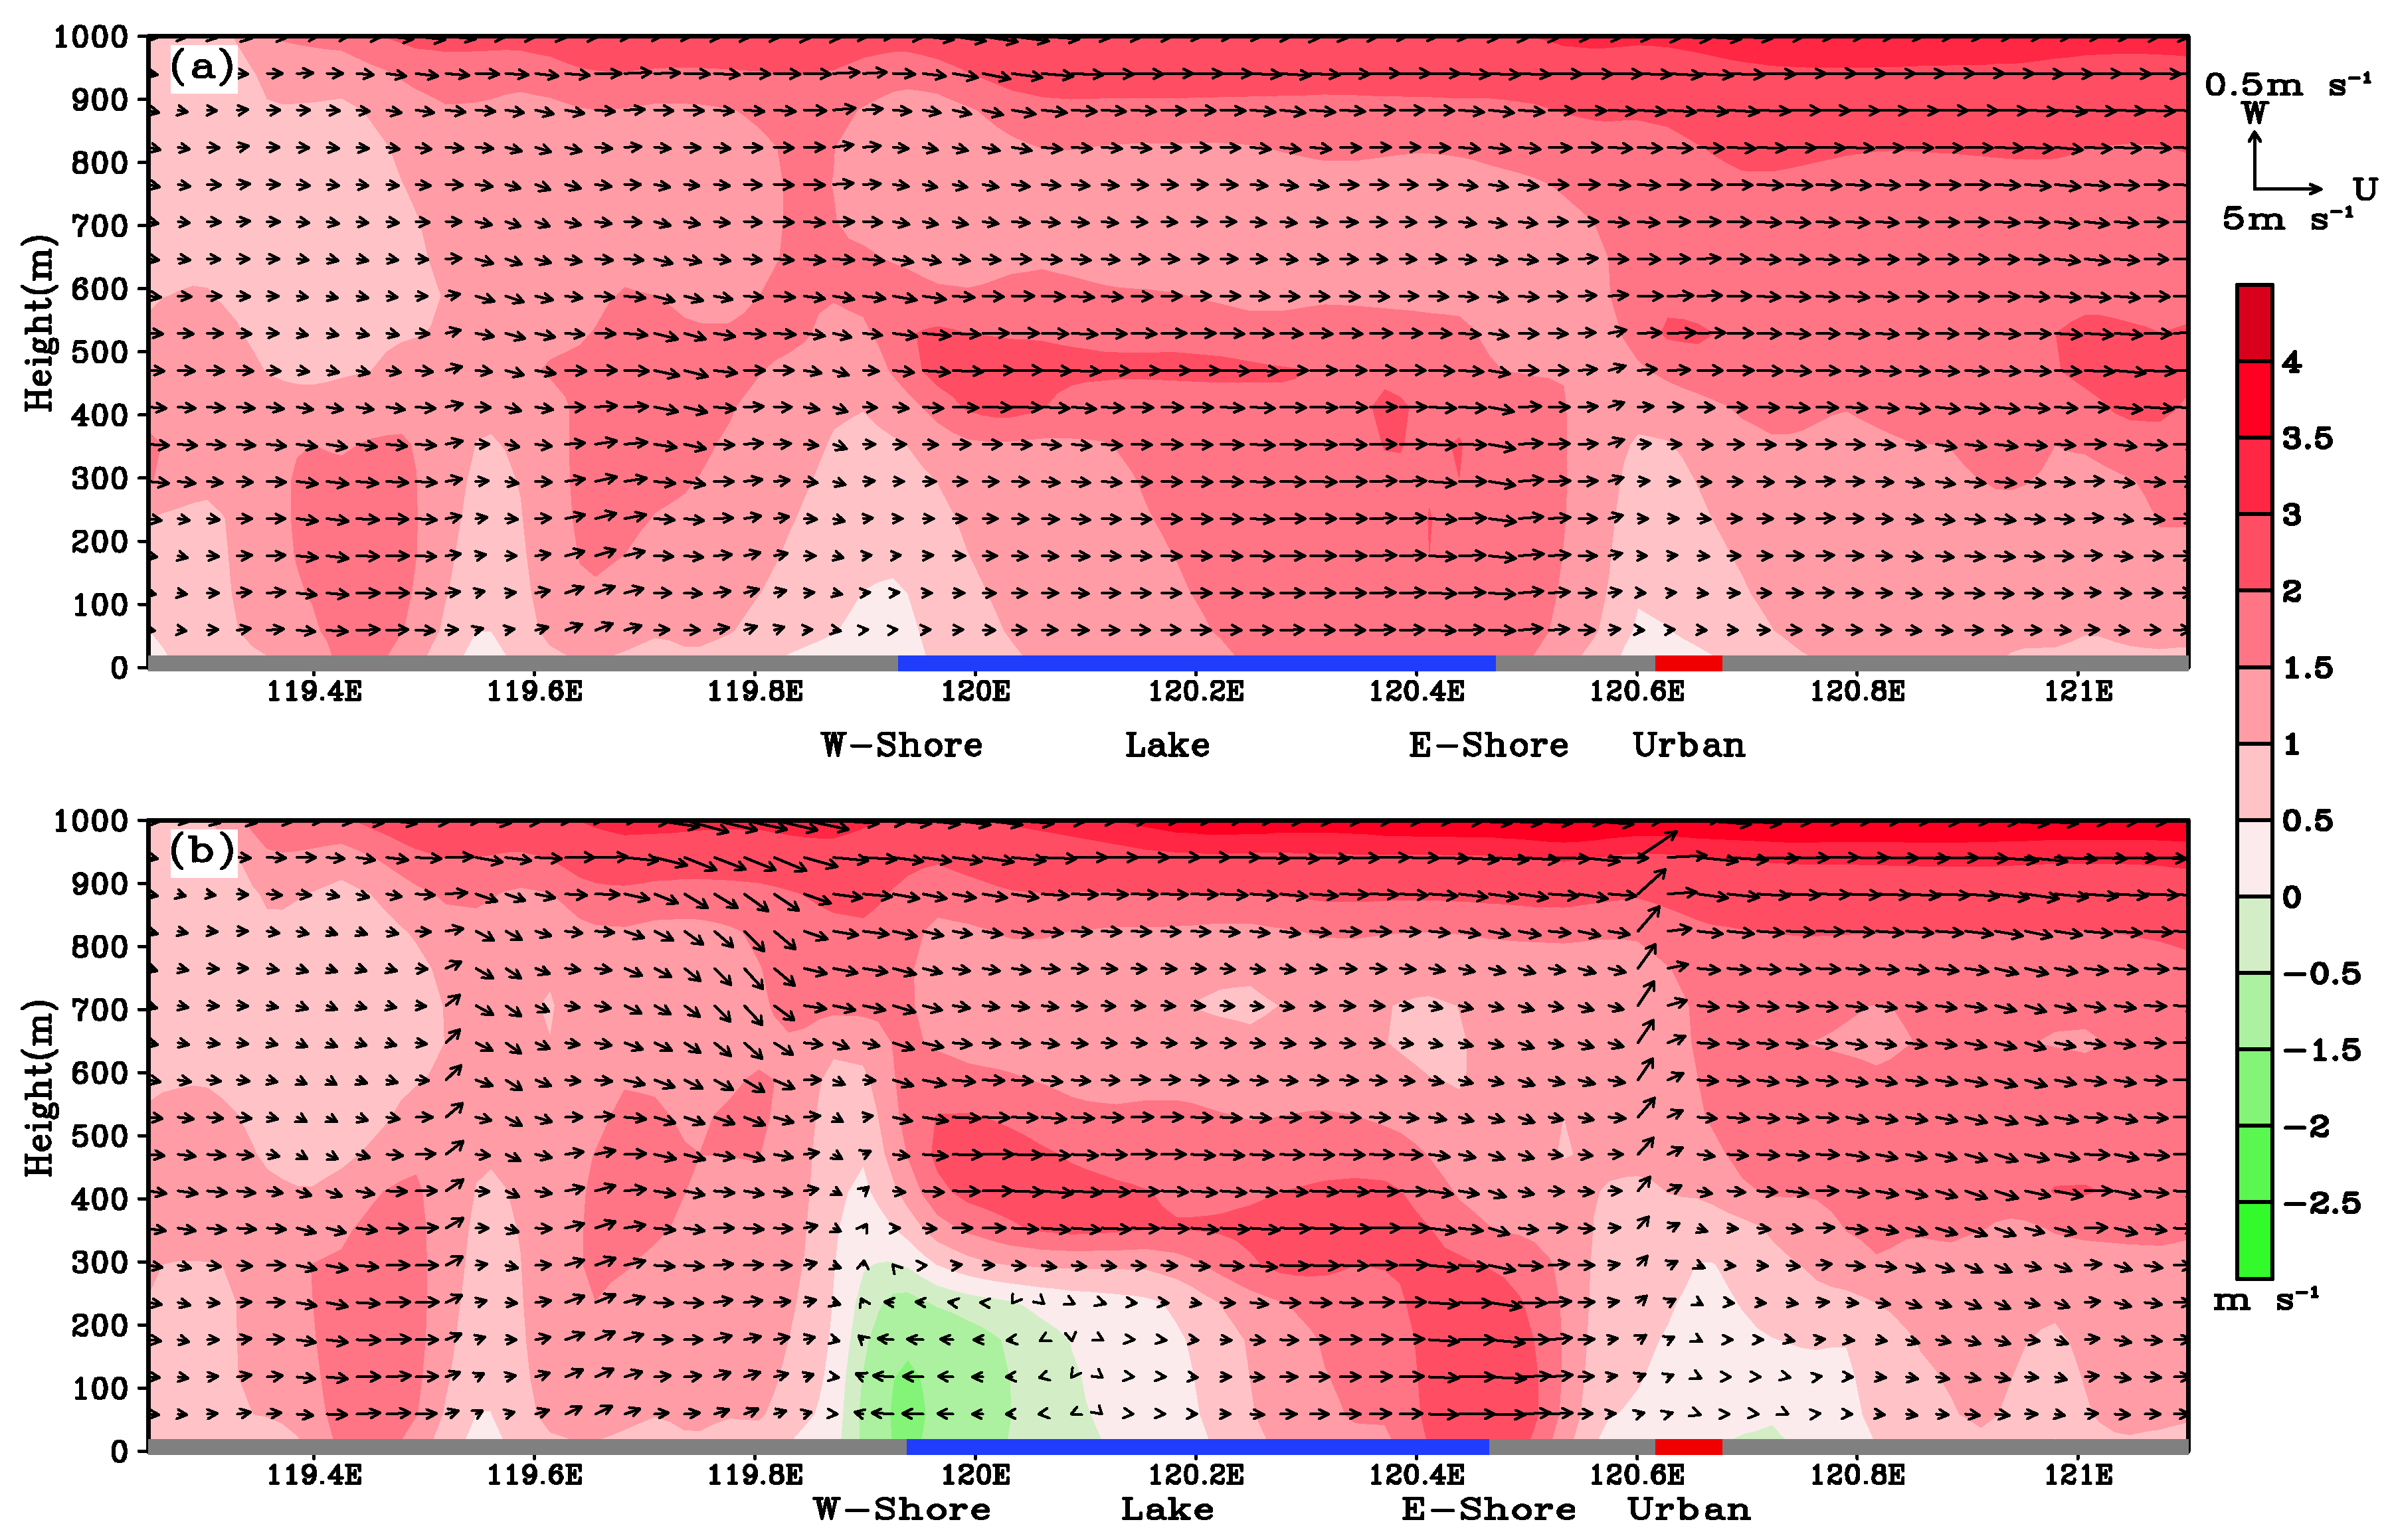
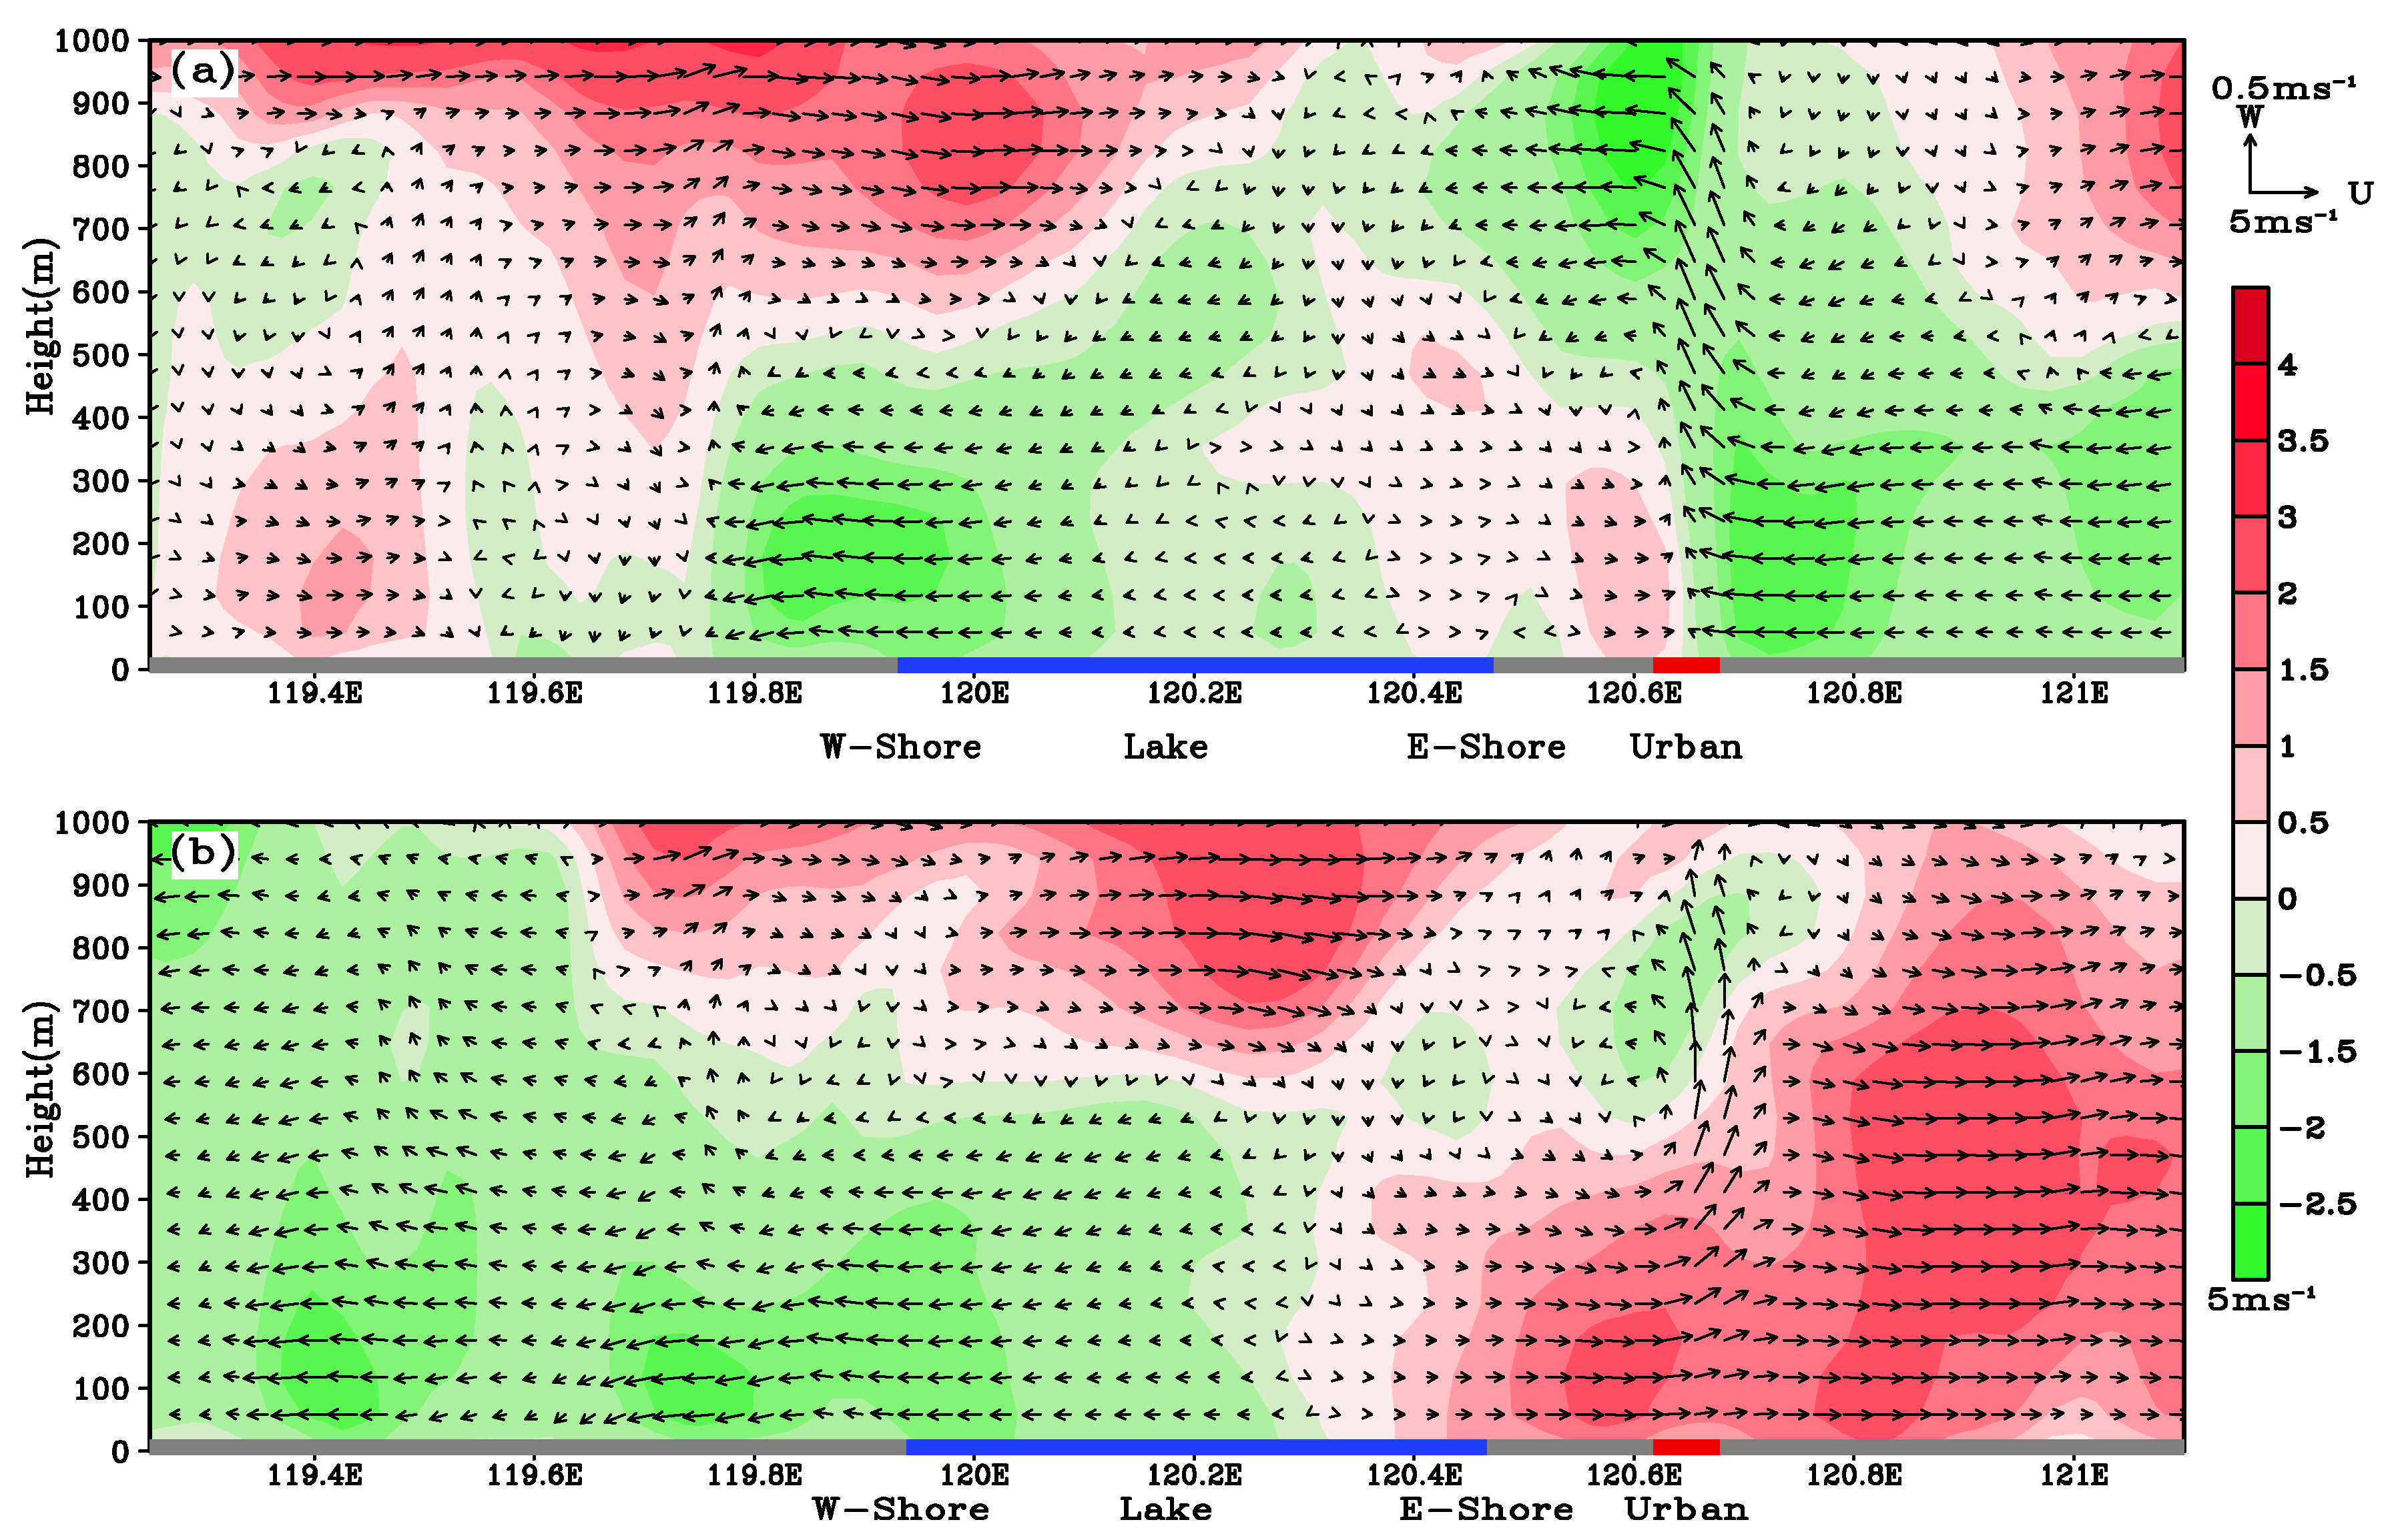
Differences are also seen in the vertical cross-section of the circulation (Figure 9). For example, in S-Lake, a weak return flow can be detected in the vicinity (1 km) of the west coast at the height of 100 m. At the same location, the return flow pattern in D-Lake extends further inland to a depth of 4 km and deeper vertically to a height of 300 m.
The lake breeze reached its peak strength at 14:00 (Figure 7). In S-Lake, the lake breeze flow divergence co-exists with the urban flow convergence. The penetration distance in the north and east shores are 23 and 27 km, respectively, and is limited to the edge of the two major cities, Wuxi in the north and Suzhou in the east, due to the blockage effect of the urban thermal circulation. The lake breeze is weaker on the west and south shores, with a penetration distance of 15 and 8 km, respectively. The observed wind field clearly indicates the flow from the lake (Figure 7c) at moderate wind speeds of 2–4 m s−1. The S-Lake simulated wind field matches the observations reasonably well on the south, north and west coasts but has some deviations on the east coast due to the fact that the 1 km model grids do not resolve small-scale terrain complexity.
At 14:00, the lake air temperature differs by as much as 7 °C between S-Lake and D-Lake (Figure 7d). In fact, the air temperature in S-Lake is higher than in D-Lake almost everywhere in the inner simulation domain. The average air temperature difference is 4.7 °C among the lake grids and 0.6 °C among the land grids. The 10 m wind in D-Lake is too strong (Figure 7b) compared to the observation.
An east–west vertical cross-section of the flow reveals small land circulation cells embedded in the lake breeze (Figure 10). These cells are several km in size and extend to 1 km in height. In S-Lake, the lake breeze vertical extent is 650 m (on the west shore), and the maximum wind speed is 2 m s−1. In D-Lake, the vertical extent is 850 m, and the maximum wind is slightly higher, at 2.5 m s−1. Another difference is that in S-Lake, the lake breeze is limited to the west edge of the city of Suzhou, whereas in D-Lake, the breeze is able to penetrate the whole city.
At 19:00, in S-Lake, the lake air is warmer than the air in the non-urban land; the lake breeze has vanished and is consistent with the observation (Figure 8c), and the wind over the lake is now geostrophic (Figure 8a). However, in D-Lake, the lake air is still cooler than the land air, and the lake breeze is still present (Figure 8b and Figure 11b). Only at 20:00–21:00 has the lake breeze completely vanished in D-Lake.

7. Conclusions

The main purpose of this study is to improve the simulation performance of the WRF-Lake model in a large, shallow lake. A set of parameters in the WRF-Lake model have been modified, including the lake albedo, surface momentum, heat and water vapor roughness length, the thermal diffusivity of the lake and water light extinction coefficient. Compared with the observations at the flux observation plat on the lake, the WRF-Lake model with adjusted parameters improved the simulation of lake–air exchange flux notably. The simulations of near-surface temperature, humidity and wind speed were more consistent with the observation. The sites on the land close to the lake improved more significantly. Furthermore, the adjusted model can better simulate the frequency and duration of the lake breeze. Therefore, it can be considered that the current set of parameters is suitable for the simulation of shallow lakes such as Lake Taihu. However, it is important to mention here that this study is based on the framework of the original WRF-Lake model with parameter optimization, which, in turn, improves the simulation performance of the model. Analyzing the uncertainty of the mechanism of the model, for the simulation of inland lakes, WRF-Lake uses the assumption of a single-column model. In recent years, models have been developed that directly simulate the turbulent exchange in the water column, and even models with more accurate physical mechanisms that directly solve the 3D flow field [72,73] have been developed. Moreover, from the point of view of the uncertainty in the observed data, the heat storage was calculated using the assumption of energy closure in the observed data used in this paper. However, in the actual atmosphere, the turbulent flux data observed in the lake are only about 70% closed. Therefore, the direct use of observations with energy-closure assumptions for model validation also leads to a certain degree of uncertainty in the model results.
Secondly, the influence of lake depth on the characteristics of the lake breeze was discussed. Due to frequent strong convective weather, the observed lake breeze frequency of Lake Taihu was only 17 days (18.5%) in the summer of 2012. The result of the shallow lake case was consistent with observations for 17 days. When Taihu Lake is simulated as a deep lake, the diurnal variation in the lake’s surface temperature is small, and the water temperature is low during the day. The maximum difference in lake surface temperatures between S-lake and D-lake is 9.9 °C. The lower surface temperature triggered a stronger lake breeze, and the frequency of the lake breeze in the D-lake case increased significantly, reaching 35 days (38%). The depth of the lake also affected the onset, cessation time and duration of the lake breeze. In the summer of 2012, the average lake breeze duration of the shallow lake was 5.5 h, which was similar to the observation. The deep lake case reached 8 h. The average land penetration distance between the shallow lake and deep lake cases was 5 km.
The case analysis of the lake breeze better shows the process of the lake breeze formation, development and extinction when the lake depth is different, and the interaction between the lake wind circulation and the urban heat island circulation is occurring. In contrast to the deep lake’s case, lake breeze in shallow lakes occurred later, reached cities more slowly, and land extension distances were shorter in sunny weather conditions on 19 July 2012. The wind in the deep lake still continued, and the wind in the shallow lake began to dissipate at 19:00. When the lake depth was different, the vertical distance of the lake extended up to 200 m.
The WRF-Lake model’s performance was improved by adjusting the physical parameters in this paper. Lake Taihu is one of the regions with the most developed economy and the largest industrial output value in China. It has many high-temperature, heavy rain and other weather disasters in summer. Further research can be carried out on the effects of Lake Taihu’s breeze on pollutant transport and chemical reactions, as well as on the impact of local high temperatures, heavy rain and other disaster-like weather. In addition, the current supercomputer technology is rapidly developing. The 3D lake model can consider the flow of a lake’s water and introduce spatial changes in the lake’s depth. The coupling of the 3D lake model with the weather and climate model is worthwhile for future studies.

Author Contributions

Y.W.: conceptualization, methodology, software, formal analysis, writing—original draft, project administration, writing—review and editing, funding acquisition. M.Z.: formal analysis, software, validation, writing—original draft. All authors have read and agreed to the published version of the manuscript.

Funding

This study was supported by the National Natural Science Foundation of China (Grants 41675016 and 41275024).

Institutional Review Board Statement

Not applicable.

Informed Consent Statement

Not applicable.

Data Availability Statement

The wind speed and wind direction data can be requested from the China Meteorological Administration and the radiation fluxes data of lake Taihu can be requested from the website https://yncenter.sites.yale.edu/data-access (accessed on 8 November 2022).

Conflicts of Interest

The authors declare no conflict of interest.

References

  1. Deoli, V.; Kumar, D.; Kuriqi, A. Detection of Water Spread Area Changes in Eutrophic Lake Using Landsat Data. Sensors 2022, 22, 6827. [Google Scholar] [CrossRef] [PubMed]
  2. Zhang, N.; Gao, Z.; Wang, X.; Chen, Y. Modeling the impact of urbanization on the local and regional climate in Yangtze River Delta, China. J. Theor. Appl. Climatol. 2010, 102, 331–342. [Google Scholar] [CrossRef]
  3. Zhang, N.; Zhu, L.; Zhu, Y. Urban heat island and boundary layer structures under hot weather synoptic conditions: A case study of Suzhou City, China. J. Adv. Atmos. Sci. 2011, 28, 855. [Google Scholar] [CrossRef]
  4. Zhang, L.; Zhu, B.; Gao, J.; Kang, H. Impact of Taihu Lake on city ozone in the Yangtze River Delta. J. Adv. Atmos. Sci. 2017, 34, 226–234. [Google Scholar] [CrossRef]
  5. Yang, M.; Yu, J.; Li, Z.; Guo, Z.; Burch, M.; Lin, T.-F. Taihu Lake Not to Blame for Wuxi’s Woes. J. Sci. 2008, 319, 158. [Google Scholar] [CrossRef]
  6. Kristovich, D.A.R.; Laird, N.F. Observations of widespread lake-effect cloudiness: Influences of lake surface temperature and upwind conditions. J. Weather Forecast. 1998, 13, 1029–1045. [Google Scholar] [CrossRef]
  7. Kristovich, D.A.R.; Steve, R.A., III. A satellite study of cloud-band frequencies over the Great Lakes. J. Appl. Meteor. 1995, 34, 2083–2090. [Google Scholar] [CrossRef]
  8. Laird, N.F.; Metz, N.D.; Gaudet, L.; Grasmick, C.; Higgins, L.; Loeser, C.; Zelinsky, D.A. Climatology of cold season lake-effect cloud bands for the North American Great Lakes. J. Int. J. Clim. 2016, 37, 2111–2121. [Google Scholar] [CrossRef]
  9. Rodriguez, Y.; Kristovich, D.A.R.; Hjelmfelt, M.R. Lake-to-Lake Cloud Bands: Frequencies and Locations. J. Mon. Weather Rev. 2007, 135, 4202–4213. [Google Scholar] [CrossRef]
  10. Laird, N.; Bentley, A.M.; Ganetis, S.A.; Stieneke, A.; Tushaus, S.A. Climatology of Lake-Effect Precipitation Events over Lake Tahoe and Pyramid Lake. J. Appl. Meteorol. Clim. 2016, 55, 297–312. [Google Scholar] [CrossRef]
  11. Laird, N.; Sobash, R.; Hodas, N. The Frequency and Characteristics of Lake-Effect Precipitation Events Associated with the New York State Finger Lakes. J. Appl. Meteorol. Clim. 2009, 48, 873–886. [Google Scholar] [CrossRef] [Green Version]
  12. Bergmaier, P.T.; Geerts, B.; Campbell, L.S.; Steenburgh, W.J. The OWLeS IOP2b Lake-Effect Snowstorm: Dynamics of the Secondary Circulation. J. Mon. Weather Rev. 2017, 145, 2437–2459. [Google Scholar] [CrossRef]
  13. Kristovich, D.A.R.; Clark, R.D.; Frame, J.; Geerts, B.; Knupp, K.R.; Kosiba, K.A.; Laird, N.F.; Metz, N.D.; Minder, J.R.; Sikora, T.D.; et al. The Ontario Winter Lake-Effect Systems Field Campaign: Scientific and Educational Adventures to Further Our Knowledge and Prediction of Lake-Effect Storms. J. Bull. Am. Meteorol. Soc. 2017, 98, 315–332. [Google Scholar] [CrossRef]
  14. Owens, N.D.; Rauber, R.M.; Jewett, B.F.; McFarquhar, G.M. The Contribution of Lake Enhancement to Extreme Snowfall within the Chicago–Milwaukee Urban Corridor during the 2011 Groundhog Day Blizzard. J. Mon. Weather Rev. 2017, 145, 2405–2420. [Google Scholar] [CrossRef]
  15. King, P.W.S.; LeDuc, M.J.; Sills, D.M.L.; Donaldson, N.R.; Hudak, D.R.; Joe, P.; Murphy, B.P. Lake Breezes in Southern Ontario and Their Relation to Tornado Climatology. J. Weather Forecast. 2003, 18, 795–807. [Google Scholar] [CrossRef]
  16. Levy, I.; Makar, P.A.; Sills, D.; Zhang, J.; Hayden, K.L.; Mihele, C.; Narayan, J.; Moran, M.D.; Sjostedt, S.; Brook, J. Unraveling the complex local-scale flows influencing ozone patterns in the southern Great Lakes of North America. J. Atmos. Chem. Phys. 2010, 10, 10895–10915. [Google Scholar] [CrossRef] [Green Version]
  17. Makar, P.A.; Zhang, J.; Gong, W.; Stroud, C.; Sills, D.; Hayden, K.L.; Brook, J.; Levy, I.; Mihele, C.; Moran, M.D.; et al. Mass tracking for chemical analysis: The causes of ozone formation in southern Ontario during BAQS-Met 2007. J. Atmos. Chem. Phys. 2010, 10, 11151–11173. [Google Scholar] [CrossRef] [Green Version]
  18. Hayden, K.L.; Sills, D.M.L.; Brook, J.R.; Li, S.-M.; Makar, P.A.; Markovic, M.Z.; Liu, P.; Anlauf, K.G.; O’Brien, J.M.; Li, Q.; et al. Aircraft study of the impact of lake-breeze circulations on trace gases and particles during BAQS-Met 2007. J. Atmos. Chem. Phys. 2011, 11, 10173–10192. [Google Scholar] [CrossRef] [Green Version]
  19. Ellis, R.A.; Murphy, J.G.; Markovic, M.Z.; VandenBoer, T.C.; Makar, P.A.; Brook, J.; Mihele, C. The influence of gas-particle partitioning and surface-atmosphere exchange on ammonia during BAQS-Met. J. Atmos. Chem. Phys. 2011, 11, 133–145. [Google Scholar] [CrossRef] [Green Version]
  20. Wentworth, G.; Murphy, J.; Sills, D. Impact of lake breezes on ozone and nitrogen oxides in the Greater Toronto Area. J. Atmos. Environ. 2015, 109, 52–60. [Google Scholar] [CrossRef]
  21. Garratt, J.R.; Physick, W.L. The inland boundary layer at low latitudes: II Sea-breeze influences. J. Bound. Layer Meteorol. 1985, 33, 209–231. [Google Scholar] [CrossRef]
  22. Yan, H.; Anthes, R.A. The Effect of Latitude on the Sea Breeze. J. Mon. Weather Rev. 1987, 115, 936–956. [Google Scholar] [CrossRef]
  23. Antonelli, M.; Rotunno, R. Large-Eddy Simulation of the Onset of the Sea Breeze. J. Atmos. Sci. 2007, 64, 4445–4457. [Google Scholar] [CrossRef] [Green Version]
  24. Tsujimoto, K.; Koike, T. Land-lake breezes at low latitudes: The case of Tonle Sap Lake in Cambodia. J. Geophys. Res. Atmos. 2013, 118, 6970–6980. [Google Scholar] [CrossRef]
  25. Zumpfe, D.E.; Horel, J.D. Lake-Breeze Fronts in the Salt Lake Valley. J. Appl. Meteorol. Clim. 2007, 46, 196–211. [Google Scholar] [CrossRef]
  26. Sills, D.M.L.; Brook, J.R.; Levy, I.; Makar, P.A.; Zhang, J.; Taylor, P.A. Lake breezes in the southern Great Lakes region and their influence during BAQS-Met 2007. J. Atmos. Chem. Phys. 2011, 11, 7955–7973. [Google Scholar] [CrossRef] [Green Version]
  27. Wang, Y.; Gao, Y.; Qin, H.; Huang, J.; Liu, C.; Hu, C.; Wang, W.; Liu, S.; Lee, X. Spatiotemporal Characteristics of Lake Breezes over Lake Taihu, China. J. Appl. Meteorol. Clim. 2017, 56, 2053–2065. [Google Scholar] [CrossRef]
  28. Porson, A.; Steyn, D.G.; Schayes, G. Sea-breeze scaling from numerical model simulations, part II: Interaction between the sea breeze and slope flows. Bound. Layer Meteorol. 2007, 122, 31–41. Available online: https://rdcu.be/cH3Cw (accessed on 8 November 2022). [CrossRef]
  29. Freitas, E.D.; Rozoff, C.M.; Cotton, W.R.; Dias, P.L.S. Interactions of an urban heat island and sea-breeze circulations during winter over the metropolitan area of São Paulo, Brazil. J. Bound. Layer Meteorol. 2007, 122, 43–65. [Google Scholar] [CrossRef]
  30. Crosman, E.T.; Horel, J.D. Idealized large-eddy simulations of sea and lake breezes: Sensitivity to lake diameter, heat flux and stability. Bound. Layer Meteorol. 2012, 144, 309–328. Available online: https://rdcu.be/cH3yb (accessed on 8 November 2022). [CrossRef]
  31. Yamato, H.; Mikami, T.; Takahashi, H. Impact of sea breeze penetration over urban areas on midsummer temperature distributions in the Tokyo Metropolitan area. J. Int. J. Clim. 2017, 37, 5154–5169. [Google Scholar] [CrossRef]
  32. Segal, M.; Leuthold, M.; Arritt, R.W.; Anderson, C.; Shen, J. Small Lake Daytime Breezes: Some Observational and Conceptual Evaluations. J. Bull. Am. Meteorol. Soc. 1997, 78, 1135–1147. [Google Scholar] [CrossRef]
  33. Miller, S.T.K.; Keim, B.D.; Talbot, R.W.; Mao, H. Sea breeze: Structure, forecasting, and impacts. J. Rev. Geophys. 2003, 41, 124. [Google Scholar] [CrossRef] [Green Version]
  34. Crosman, E.T.; Horel, J.D. Sea and Lake Breezes: A Review of Numerical Studies. Bound. Layer Meteorol. 2010, 137, 1–29. Available online: https://rdcu.be/cH3yv (accessed on 8 November 2022). [CrossRef] [Green Version]
  35. Xiao, C.; Lofgren, B.M.; Wang, J.; Chu, P.Y. Improving the lake scheme within a coupled WRF-lake model in the Laurentian Great Lakes. J. Adv. Model. Earth Syst. 2016, 8, 1969–1985. [Google Scholar] [CrossRef]
  36. Curry, M.; Hanesiak, J.; Sills, D. A Radar-Based Investigation of Lake Breezes in Southern Manitoba, Canada. J. Atmos. Ocean 2015, 53, 237–250. [Google Scholar] [CrossRef]
  37. Lombardo, K.; Sinsky, E.; Jia, Y.; Whitney, M.M.; Edson, J. Sensitivity of Simulated Sea Breezes to Initial Conditions in Complex Coastal Regions. J. Mon. Weather Rev. 2016, 144, 1299–1320. [Google Scholar] [CrossRef]
  38. Xu, L.; Liu, H.; Du, Q.; Wang, L. Evaluation of the WRF-lake model over a highland freshwater lake in southwest China. J. Geophys. Res. Atmos. 2017, 121, 13989–14005. [Google Scholar] [CrossRef]
  39. Lombardo, K.; Sinsky, E.; Edson, J.; Whitney, M.M.; Jia, Y. Sensitivity of Offshore Surface Fluxes and Sea Breezes to the Spatial Distribution of Sea-Surface Temperature. J. Bound. Layer Meteorol. 2018, 166, 475–502. [Google Scholar] [CrossRef]
  40. Wang, Y.; Ma, Q.; Gao, Y.; Hao, X.; Liu, S. Simulation of the Surface Energy Flux and Thermal Stratification of Lake Taihu with Three 1-D Models. Water 2019, 11, 1026. [Google Scholar] [CrossRef]
  41. Wu, T.; Qin, B.; Huang, A.; Sheng, Y.; Feng, S.; Casenave, C. Reconsideration of wind stress, wind waves, and turbulence in simulating wind-driven currents of shallow lakes in the Wave and Current Coupled Model (WCCM) version 1.0. Geosci. Model Dev. 2022, 15, 745–769. [Google Scholar] [CrossRef]
  42. Wu, Y.; Huang, A.; Lu, Y.; Lazhu; Yang, X.; Qiu, B.; Zhang, Z.; Zhang, X. Numerical Study of the Thermal Structure and Circulation in a Large and Deep Dimictic Lake Over Tibetan Plateau. J. Geophys. Res. Oceans 2021, 126, e2021JC017517. [Google Scholar] [CrossRef]
  43. Zhang, X.; Huang, J.; Li, G.; Wang, Y.; Liu, C.; Zhao, K.; Tao, X.; Hu, X.-M.; Lee, X. Improving Lake-Breeze Simulation with WRF Nested LES and Lake Model over a Large Shallow Lake. J. Appl. Meteorol. Clim. 2019, 58, 1689–1708. [Google Scholar] [CrossRef]
  44. Wang, F.; Li, Q.; Wang, Y. Lake-atmosphere exchange impacts ozone simulation around a large shallow lake with large cities. Atmos. Environ. 2021, 246, 118086. [Google Scholar] [CrossRef]
  45. Subin, Z.M.; Murphy, L.N.; Li, F.; Bonfils, C.; Riley, W.J. Boreal lakes moderate seasonal and diurnal temperature variation and perturb atmospheric circulation: Analyses in the Community Earth System Model 1 (CESM1). J. Tellus A Dyn. Meteorol. Oceanogr. 2012, 64, 15639. [Google Scholar] [CrossRef]
  46. Deng, B.; Liu, S.; Xiao, W.; Wang, W.; Jin, J.; Lee, X. Evaluation of the CLM4 Lake Model at a Large and Shallow Freshwater Lake. J. Hydrometeorol. 2013, 14, 636–649. [Google Scholar] [CrossRef] [Green Version]
  47. Skamarock, W.C.; Klemp, J.B. A time-split nonhydrostatic atmospheric model for weather research and forecasting applications. J. Comput. Phys. 2008, 227, 3465–3485. [Google Scholar] [CrossRef]
  48. Qin, B.; Xu, P.; Wu, Q.; Luo, L.; Zhang, Y. Environmental issues of Lake Taihu, China. J. Hydrobiol. 2007, 581, 3–14. [Google Scholar] [CrossRef]
  49. Lee, X.; Liu, S.; Xiao, W.; Wang, W.; Gao, Z.; Cao, C.; Hu, C.; Hu, Z.; Shen, S.; Wang, Y.; et al. The Taihu Eddy Flux Network: An Observational Program on Energy, Water, and Greenhouse Gas Fluxes of a Large Freshwater Lake. J. Bull. Am. Meteorol. Soc. 2014, 95, 1583–1594. [Google Scholar] [CrossRef]
  50. Wang, W.; Xiao, W.; Cao, C.; Gao, Z.; Hu, Z.; Liu, S.; Shen, S.; Wang, L.; Xiao, Q.; Xu, J.; et al. Temporal and spatial variations in radiation and energy balance across a large freshwater lake in China. J. Hydrol. 2014, 511, 811–824. [Google Scholar] [CrossRef]
  51. Chen, Y.; Zhang, N. Urban Heat Island Mitigation Effectiveness under Extreme Heat Conditions in the Suzhou–Wuxi–Changzhou Metropolitan Area, China. J. Appl. Meteorol. Clim. 2018, 57, 235–253. [Google Scholar] [CrossRef]
  52. Chen, F.; Mitchell, K.; Schaake, J.; Xue, Y.; Pan, H.-L.; Koren, V.; Duan, Q.; Ek, M.; Betts, A. Modeling of land surface evaporation by four schemes and comparison with FIFE observations. J. Geophys. Res. Earth Surf. 1996, 101, 7251–7268. [Google Scholar] [CrossRef] [Green Version]
  53. Chen, F.; Dudhia, J. Coupling an advanced land surface–hydrology model with the Penn State–NCAR MM5 modeling system. Part I: Model implementation and sensitivity. J. Mon. Weather. Rev. 2001, 129, 569–585. [Google Scholar] [CrossRef]
  54. Kusaka, H.; Kondo, H.; Kikegawa, Y.; Kimura, F. A Simple Single-Layer Urban Canopy Model For Atmospheric Models: Comparison with Multi-Layer And Slab Models. J. Bound. Layer Meteorol. 2001, 101, 329–358. [Google Scholar] [CrossRef]
  55. Chen, F.; Kusaka, H.; Bornstein, R.; Ching, J.; Grimmond, S.; Grossman-Clarke, S.; Loridan, T.; Manning, K.W.; Martilli, A.; Miao, S.; et al. The integrated WRF/urban modelling system: Development, evaluation, and applications to urban environmental problems. J. Int. J. Clim. 2011, 31, 273–288. [Google Scholar] [CrossRef]
  56. Iacono, M.J.; Delamere, J.S.; Mlawer, E.J.; Shephard, M.W.; Clough, S.A.; Collins, W.D. Radiative forcing by long-lived greenhouse gases: Calculations with the AER radiative transfer models. J. Geophys. Res. Atmos. 2008, 113, D13103. [Google Scholar] [CrossRef]
  57. Lim, K.-S.S.; Hong, S.-Y. Development of an Effective Double-Moment Cloud Microphysics Scheme with Prognostic Cloud Condensation Nuclei (CCN) for Weather and Climate Models. J. Mon. Weather Rev. 2010, 138, 1587–1612. [Google Scholar] [CrossRef] [Green Version]
  58. Kain, J.S. The Kain–Fritsch convective parameterization: An update. J. Appl. Meteorol. 2004, 43, 170–181. [Google Scholar] [CrossRef]
  59. Subin, Z.M.; Riley, W.J.; Mironov, D. An improved lake model for climate simulations: Model structure, evaluation, and sensitivity analyses in CESM1. J. Adv. Model. Earth Syst. 2012, 4, M02001. [Google Scholar] [CrossRef]
  60. Gu, H.; Jin, J.; Wu, Y.; Ek, M.B.; Subin, Z.M. Calibration and validation of lake surface temperature simulations with the coupled WRF-lake model. J. Clim. Chang. 2015, 129, 471–483. [Google Scholar] [CrossRef]
  61. Henderson-Sellers, B. New formulation of eddy diffusion thermocline models. J. Appl. Math. Model. 1985, 9, 441–446. [Google Scholar] [CrossRef]
  62. Yang, Y.; Wang, Y.; Zhang, Z.; Wang, W.; Ren, X.; Gao, Y.; Liu, S.; Lee, X. Diurnal and Seasonal Variations of Thermal Stratification and Vertical Mixing in a Shallow Fresh Water Lake. J. Meteorol. Res. 2018, 32, 219–232. [Google Scholar] [CrossRef]
  63. Biggs, W.G.; Graves, M.E. A Lake breeze index. J. Appl. Meteorol. Climatol. 1962, 1, 474–480. [Google Scholar] [CrossRef]
  64. Comer, N.T.; McKendry, I.G. Observations and numerical modelling of Lake Ontario breezes. J. Atmos. Ocean. 1993, 31, 481–499. [Google Scholar] [CrossRef]
  65. Borne, K.; Chen, D.; Nunez, M. A method for finding sea breeze days under stable synoptic conditions and its application to the Swedish west coast. J. Int. J. Climatol. 1998, 18, 901–914. [Google Scholar] [CrossRef]
  66. Laird, N.F.; Kristovich, D.A.R.; Liang, X.Z. Lake michigan lake breezes: Climatology, local forcing, and synoptic environment. J. Appl. Meteorol. 2001, 40, 409–424. [Google Scholar] [CrossRef]
  67. Keeler, J.M.; Kristovich, D.A.R. Observations of Urban Heat Island Influence on Lake-Breeze Frontal Movement. J. Appl. Meteorol. Clim. 2012, 51, 702–710. [Google Scholar] [CrossRef]
  68. Curry, M.; Hanesiak, J.; Kehler, S.; Sills, D.M.L.; Taylor, N.M. Ground-Based Observations of the Thermodynamic and Kinematic Properties of Lake-Breeze Fronts in Southern Manitoba, Canada. J. Bound. Layer Meteorol. 2017, 163, 143–159. [Google Scholar] [CrossRef]
  69. Mariani, Z.; Dehghan, A.; Joe, P.; Sills, D. Observations of Lake-Breeze Events During the Toronto 2015 Pan-American Games. J. Bound. Layer Meteorol. 2018, 166, 113–135. [Google Scholar] [CrossRef]
  70. Huang, M.; Gao, Z.; Miao, S.; Xu, X. Characteristics of sea breezes over the Jiangsu coastal area, China. J. Int. J. Clim. 2016, 36, 3908–3916. [Google Scholar] [CrossRef]
  71. Keen, C.S.; Lyons, W.A. Lake/Land Breeze Circulations on the Western Shore of Lake Michigan. J. Appl. Meteorol. 1978, 17, 1843–1855. [Google Scholar] [CrossRef]
  72. Dimou, K. 3-D Hybrid Eulerian-Lagrangian/Particle Tracking Model for Simulating Mass Transport in Coastal Water Bodies. Ph.D. Dissertation, Massachusetts Institute of Technology, Cambridge, MA, USA, 1992. Available online: http://dspace.mit.edu/handle/1721.1/28011 (accessed on 8 November 2022).
  73. Deoli, V.; Kumar, D.; Kumar, M.; Kuriqi, A.; Elbeltagi, A. Water spread mapping of multiple lakes using remote sensing and satellite data. Arab. J. Geosci. 2021, 14, 2213. [Google Scholar] [CrossRef]
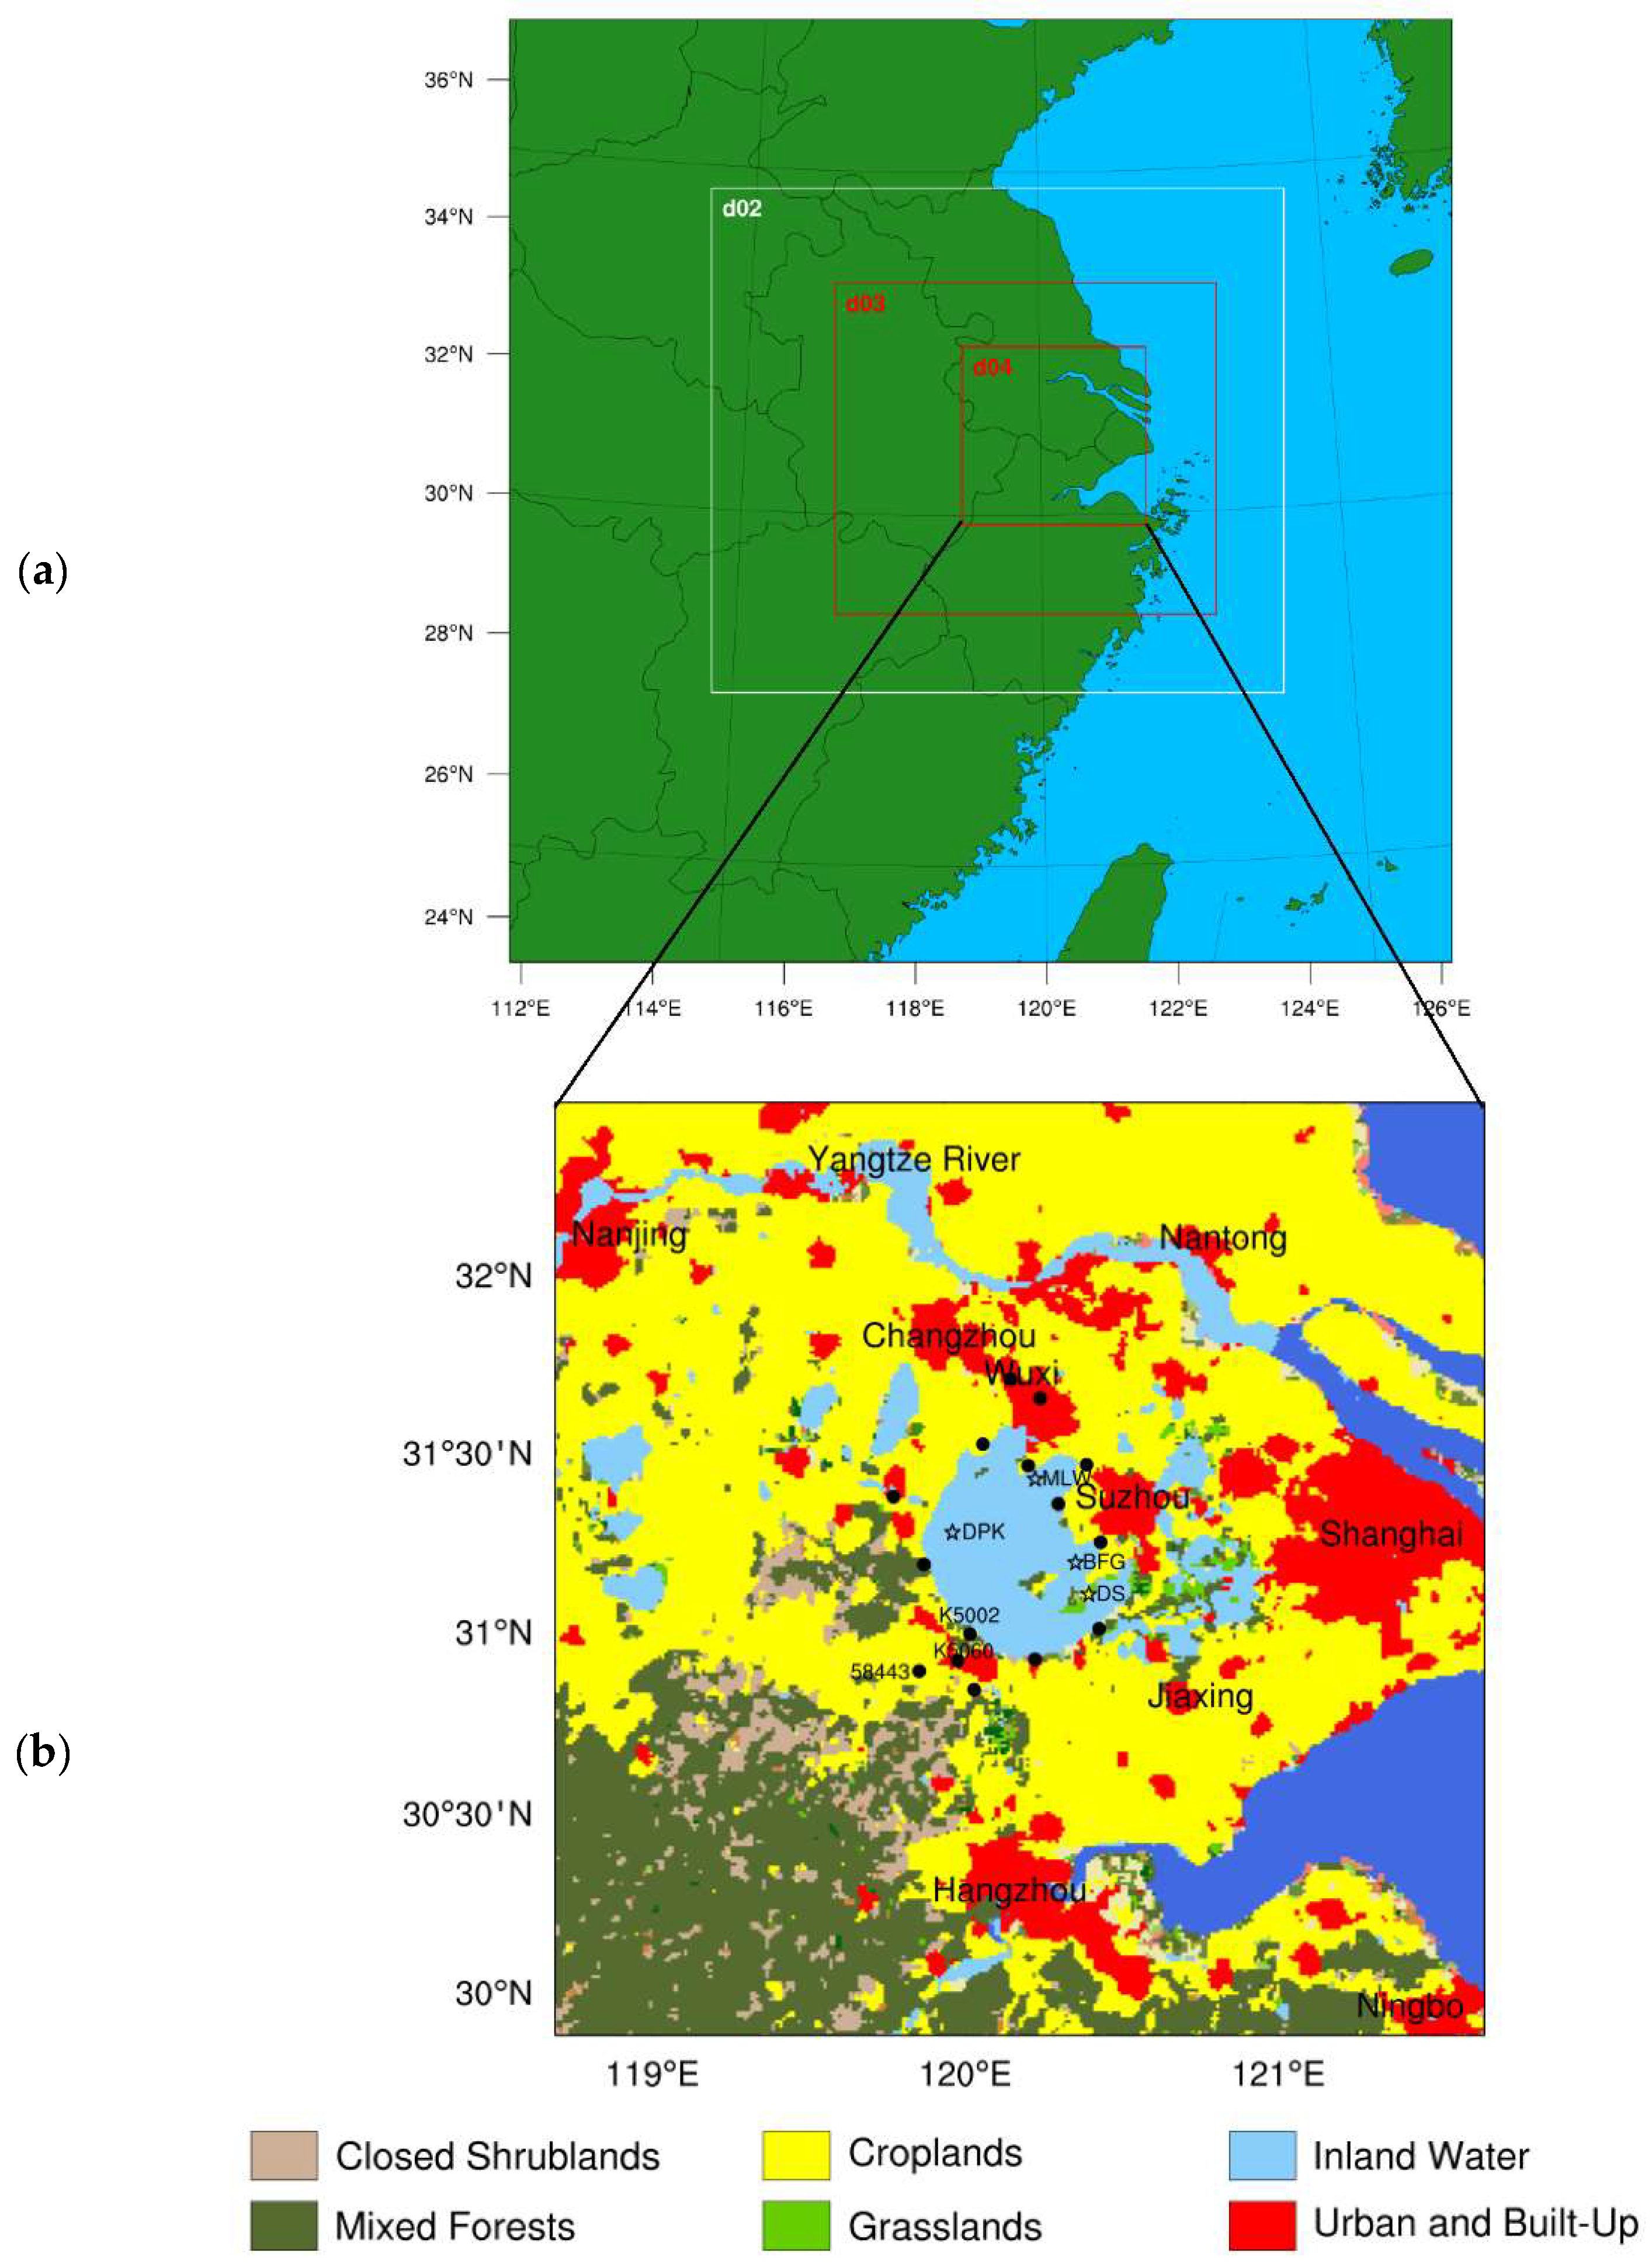
Figure 1. (a) is a map showing the study domain, (b) land use category of the third simulation domains. (meteorological observing stations; ☆ flux observing stations).
Water 14 03719 g001
Figure 2. Modeled and observed temporal evolution of (a) skin temperature (°C), (b) air temperature at 2 m (°C), (c) net radiation (W·m−2), (d) sensible heat flux (W·m−2), (e) latent heat flux (W·m−2), (f) heat storage (W·m−2) at BFG flux station from 1 June 2012 to 30 June 2012.
Water 14 03719 g002
Figure 3. Modeled and observed temporal evolution of (a) air temperature at 2 m for K5002 station (°C); (b) daily average value and error bar (°C); (c) air temperature at 2 m for K5060 station (°C); (d) daily average value and error bar (°C); (e) air temperature at 2 m for 58443 station (°C); (f) daily average value and error bar (°C); (g) wind speed at 10 m for K5002 station (m·s−1); (h) daily average value and error bar (m·s−1); (i) wind speed at 10 m for K5060 station (m·s−1); (j) daily average value and error bar (m·s−1); (k) wind speed at 10 m for 58443 station (m·s−1); (l) daily average value and error bar (m·s−1); from 1 June to 30 June 2012.
Water 14 03719 g003
Figure 4. The average lake surface temperature and the 2 m air temperature on the lake over 17 lake breeze days. The solid green line and solid black line were surface temperatures for S-Lake and D-Lake, and the blue and red dotted lines were 2 m air temperatures for S-Lake and D-Lake, respectively.
Water 14 03719 g004
Figure 5. Modeled and observed mean and range of lake breeze onset time, cessation time and duration time for the three-month study period.
Water 14 03719 g005
Figure 6. Modeled wind vector and air temperature at 2 m at 09:00 19 July 2012 (a) of S-Lake; (b) of D-Lake; (c) observed by meteorology station. (c) Observation by sites: the long pole is 4 m s−1, and the short pole is 2 m s−1; (d) difference between S-Lake and D-Lake.
Water 14 03719 g006
Figure 7. Modelled the wind vector, and the air temperature at 2 m at 14:00 19 July 2012 (a) by S-Lake; (b) by D-Lake; (c) observed by meteorology station; (c) Observation by sites. The long pole is 4 m s−1, and the short pole is 2 m s−1; (d) difference between S-Lake and D-Lake.
Water 14 03719 g007
Figure 8. Modelled the wind vector, and the air temperature at 2 m at 19:00 19 July 2012 (a) by S-Lake; (b) by D-Lake; (c) observed by meteorology station; (c) Observation by sites. The long pole is 4 m s−1, and the short pole is 2 m s−1; (d) difference between S-Lake and D-Lake.
Water 14 03719 g008
Figure 9. Cross-section of wind vector along the center latitude (31.2 °N) at 09:00 19 July 2012 by (a) S-Lake; (b) D-Lake.
Water 14 03719 g009
Figure 10. Cross section of wind vector along the center latitude (31.2° N) at 14:00 19 July 2012 by (a) S_lake; (b) D-Lake.
Water 14 03719 g010
Figure 11. Cross section of wind vector along the center latitude (31.2° N) at 19:00 19 July 2012 by (a) S_lake; (b) D-Lake.
Water 14 03719 g011
Table 1. 19 site information: 16 measurement points on land and 3 on the lake.
StationLongitudeLatitudeDistance
1. BFG31.40120.22on lake
2. DPK31.26119.92on lake
3. MLW31.17120.40on lake
4. K502731.17119.92onshore
5. K500230.97120.10onshore
6. K500130.93120.25onshore
7. M384831.42120.23onshore
8. M385231.47120.13onshore
9. M390831.22120.46onshore
10. M391131.33120.33onshore
11. M392130.98120.47near shore
12. DS31.08120.43near shore
13. K506030.95120.03near shore
14. M390331.44120.44near shore
15. 5844330.98119.88far shore
16. 5845030.87120.05far shore
17. M385031.57120.30far shore
18. M385531.62120.28far shore
19. 5834631.36119.81far shore
Table 2. Statistical indices (RMSE and RC) associated with hourly variables provided by the meteorological sites (☆) in Figure 1. Observed and modeled wind speed and 2 m air temperature from the nearest grid point from 1 June to 31 August 2012.
Tskin (°C)Sense Heat Flux (W·m−2)Latent Heat Flux (W·m−2)
S-Lake-DefaultS-LakeS-Lake-DefaultS-LakeS-Lake-DefaultS-Lake
RMSERCRMSERCRMSERCRMSERCRMSERCRMSERC
1. BFG3.240.811.590.9215.710.2810.120.6790.87−0.0444.810.71
2. MLW3.630.781.930.8818.270.2214.370.6296.350.1753.840.68
3. DPK3.460.801.810.9119.230.2713.210.64114.670.1450.970.69
4. DS2.720.902.620.9271.420.8043.620.8354.140.8921.490.92
Average3.260.821.980.9031.150.3920.330.6989.000.2942.770.75
Table 3. Statistical indices (RMSE and RC) associated with hourly variables provided by the flux sites (●) in Figure 1. Observed and modeled skin temperature, sense heat flux and latent heat flux from 1 June to 31 August 2012.
Air Temperature (°C)Wind Speed (m‧s−1)
S-Lake-DefaultS-LakeS-Lake-DefaultS-Lake
StationRMSERCRMSERCRMSERCRMSERC
1. BFG4.890.581.340.942.580.481.570.71
2. DPK4.750.591.520.932.250.511.530.70
3. MLW4.830.641.480.921.980.681.400.75
4. K50273.270.791.390.931.750.511.540.70
5. K50022.990.771.370.931.760.621.120.69
6. K50013.180.801.450.941.850.451.820.68
7. M38483.320.771.830.911.790.521.710.71
8. M38523.530.751.500.922.560.381.670.62
9. M39083.370.711.330.931.560.431.470.63
10. M39113.290.701.330.911.380.461.550.64
11. M39213.540.691.280.901.290.551.680.67
12. DS1.680.911.540.921.480.511.420.68
13. K50601.940.921.860.932.800.591.620.64
14. M39032.020.902.010.901.330.621.550.62
15. 584432.170.892.060.891.460.671.670.67
16. 584501.940.911.840.911.290.741.510.73
17. M38501.970.901.950.912.080.631.420.62
18. M38551.910.911.870.910.880.641.250.64
19. 583461.880.901.870.900.990.631.810.65
Average2.970.791.620.911.730.561.510.67
Table 4. The percentage (%) of days per month with lake breeze.
JuneJulyAugustTotal
D-LakeS-LakeOBSD-LakeS-LakeOBSD-LakeS-LakeOBSD-LakeS-LakeOBS
East Shore56.733.326.748.412.912.945.232.322.6502620.7
West Shore46.730.033.341.912.99.6741.929.025.844.623.922.8
South Shore46.726.730.054.812.912.941.925.825.847.821.722.8
North Shore56.730.040.048.416.19.6745.235.528.65027.126
Any of Shore56.733.340.054.816.112.945.235.528.652.228.338
All of Shore46.726.726.735.59.679.6732.319.419.43818.518.5
Table 5. Inland penetration distance (km) of lake breeze front at local time 14:00.
East ShoreWest ShoreSouth ShoreNorth Shore
S-LakeD-LakeS-LakeD-LakeS-LakeD-LakeS-LakeD-Lake
Maxi distance3335232621303233
Mini distance 680406812
Mean distance10146117121016
Publisher’s Note: MDPI stays neutral with regard to jurisdictional claims in published maps and institutional affiliations.