Article

Inverse Estimation of Soil Hydraulic Parameters in a Landslide Deposit Based on a DE-MC Approach

1
Key Laboratory of Hydrometeorological Disaster Mechanism and Warning of Ministry of Water Resources, School of Hydrology and Water Resources, Nanjing University of Information Science and Technology, Nanjing 210044, China
2
Institute of Mountain Hazards and Environment, Chinese Academy of Sciences, Chengdu 610041, China
3
Department of Physical Geography and Geoecology, Faculty of Science, Charles University, Albertov 6, 128 43 Prague, Czech Republic
4
Department of Physical Geography, Stockholm University, SE-106 91 Stockholm, Sweden
5
State Key Laboratory of Simulation and Regulation of Water Cycle in River Basin, China Institute of Water Resources and Hydropower Research, Research Center on Flood and Drought Disaster Reduction of the Ministry of Water Resources, Beijing 100038, China
6
Qinghai Meteorological Disaster Prevention Technology Center, Xining 810000, China
*
Authors to whom correspondence should be addressed.
Water 2022, 14(22), 3693; https://doi.org/10.3390/w14223693
Submission received: 4 November 2022 / Revised: 10 November 2022 / Accepted: 11 November 2022 / Published: 15 November 2022

Abstract

:
Extreme rainfall is a common triggering factor of landslide disasters, for infiltration and pore water pressure propagation can reduce suction stress and shear strength at the slip surface. The subsurface hydrological model is an essential component in the early-warning system of rainfall-triggered landslides, whereas soil moisture and pore water pressure simulated by the Darcy–Richards equation could be significantly affected by uncertainties in soil hydraulic parameters. This study conducted an inverse analysis of in situ measured soil moisture in an earthquake-induced landslide deposit, and the soil hydraulic parameters were optimized with the Differential Evolution Markov chain Monte Carlo method (DE-MC). The DE-MC approach was initially validated with a synthetic numerical experiment to demonstrate its effectiveness in finding the true soil hydraulic parameters. Besides, the soil water characteristic curve (SWCC) and hydraulic conductivity function (HCF) described with optimized soil hydraulic parameter sets had similar shapes despite the fact that soil hydraulic parameters may be different. Such equifinality phenomenon in inversely estimated soil hydraulic parameters, however, did not affect the performance of simulated soil moisture dynamics in the synthetic numerical experiment. The application of DE-MC to a real case study of a landslide deposit also indicated satisfying model performance in terms of accurate match between the in situ measured soil moisture content and ensemble of simulations. In conclusion, based on the satisfying performance of simulated soil moisture and the posterior probability density function (PDF) of parameter sets, the DE-MC approach can significantly reduce uncertainties in specified prior soil hydraulic parameters. This study suggested the integration of the DE-MC approach with the Darcy–Richards equation for an accurate quantification of unsaturated soil hydrology, which can be an essential modeling strategy to support the early-warning of rainfall-triggered landslides.

1. Introduction

Landslide deposit usually has coarse soil texture containing a high fraction of sand and gravel, which creates a loose structure [1,2,3]. Therefore, the landslide deposit is often featured with high permeability and low shear strength, in which the slope instability can be triggered by an extreme rainfall [4,5]. A rainfall-triggered landslide may cause destructive economic and social losses [6,7,8]. Therefore, the landslide early-warning system is vital to a region that has a higher probability of a rainfall-triggered landslide [9,10].
The landslide early-warning system often employs a hydro-mechanical model coupling soil mechanics with the critical hydrological conditions of instable states under heavy rainfall [11,12,13]. Specifically, subsurface hydrology models provide simulations of soil moisture content and pore water pressure for soil mechanics analysis. Modeling unsaturated soil hydrology strongly relies on parameterization of soil hydraulic properties, including the soil water characteristic curve (SWCC) and unsaturated hydraulic conductivity function (HCF) [14,15]. SWCC describes the relationship between soil moisture content and pore water pressure, and this water storage behavior is affected by soil texture, pore structure, etc. [16,17,18]. Meanwhile, HCF describes the capability of soil water transport under different saturation conditions. Natural soil commonly shows complex heterogeneous behavior caused by spatially varied soil hydraulic properties. Therefore, various SWCC and HCF methods were proposed to meet different needs for describing soil hydraulic properties, e.g., Brooks–Corey model, van Genuchten model, Campbell model, Gardner–Russo model, etc. [19,20]. The remaining question is how to correctly parameterize the current SWCC and HCF models for appropriate descriptions of hydraulic properties for natural soils.
Existing experimental approaches for quantifying soil hydraulic properties are often time-consuming and expensive, and some even require conducting under laboratory conditions. The inverse modeling approach can alternatively obtain the soil hydraulic parameter by integrating the parameter optimization algorithm with the vadose zone model [17,21,22]. In unsaturated soil hydrology, the model performance of soil moisture content can be evaluated by defining an objective function to assess the likelihood of simulations in comparison with the measurement. The parameter sets can be selected by parameter optimization methods, e.g., the genetic algorithm [23], Particle Swarm Optimization method [24], and Shuffled Complex Evolution algorithm [25], etc. Mostly, the optimization algorithm is deterministic, i.e., the output of the parameter set brings the best-fitted simulation according to a single-objective function.
In fact, two different parameter sets can make the objective function of the model achieve nearly an equivalent magnitude of accuracies, known as “equifinality phenomenon”, which makes the selection of the optimum parameters for the model remain highly uncertain. Conventional parameter optimization algorithms neglect the equifinality phenomenon, and the obtained best-fitted parameter set may not provide sufficient information on posterior parameter values. Beven and Freer [26] proposed the generalized likelihood uncertainty estimation (GLUE) method for evaluating the uncertainty of model parameters, which analyzed the statistical characteristics of the posterior probability distribution of the parameter sets with an equal acceptance [27,28,29]. However, in the GLUE method, the posterior probability distribution of the inferred parameters may not have significant statistical characteristics [21,22,23].
The Markov chain Monte Carlo (MCMC) method, as a formal Bayesian method, is widely used to obtain a posterior probabilistic distribution of the inversely estimated parameter [30,31,32]. In particular, the MCMC method, based on the adaptive difference evolution algorithm [33], can effectively explore the parameter space toward the higher probability density region, which has become a commonly-used approach to analyze uncertainties of parameterization in hydrological models. In the MCMC approach, a Markov chain is established to completely explore the parameter space [30]. After a continuous updating of the sample of the parameter set, the parameters may be expected to converge to the higher probability density region [30,34]. The differential evolution Markov chain (DE-MC) adopts multiple Markov chains for a more efficiency updating of parameter sets, which may be more suitable for parallel computation [35,36]. The MCMC method has been widely used in meteorology, geology, physics, and other fields. For example, Smith and Marshall [37] proposed three MCMC methods for hydrological models and compared the simulation results between three methods. Carsel et al. [38] used the MCMC approach to characterize input parameters for the pesticide root zone model, which then simulated the leaching potential of pesticides. Methodologically, the DE-MC has its advantages in terms of simplicity, speed of calculation, and convergence. However, the integration of the MCMC algorithm for the soil hydraulic parameter in the van Genuchten model is not sufficiently explored, which hampers the application of the MCMC method to the early warning system of rainfall-triggered landslides.
This study focused on validation and implementation of the DE-MC algorithm for optimizing the soil hydraulic parameters for both the synthetic numerical experiment and real case study. Firstly, we conducted a synthetic numerical experiment to compare the effectiveness of DE-MC and MCMC in finding the pre-defined true soil hydraulic parameters in the van Genuchten model. Then, the validated DE-MC was further implemented to simulate the measurement of soil moisture content in a landslide deposit in Yindongzi gully, Dujiangyan Country, Chengdu City, Sichuan Province, China. The effectiveness of DE-MC was evaluated based on the performance of simulated soil moisture and the posterior probability density function (PDF) of parameter sets.

2. Materials and Methods

The method adopted in this study was illustrated in terms of the descriptions of the mathematical model and parameter optimization strategies. The mathematical model described in Section 2.1 adopted the Richards equation as a governing equation to simulate soil moisture dynamics, and the soil hydraulic properties were described with the van Genuchten model. Section 2.2 provided detailed formulation of DE-MC, and explained the rules of iteration for the multiple chains to obtain the posterior parameters. The following content described how the above-mentioned method was implemented in both the synthetic and real case experiment. Section 2.3 introduces the basic information and instrumentation of the typical landslide deposit in our study area, including geomorphological, hydrological, and meteorological conditions. In Section 2.4, we briefly introduce how the mathematical model (Section 2.1) was numerically solved, and how the DE-MC (with 80 and 20 Markov chains) and MCMC (with only 1 Markov chain) were used in the inverse modeling. Besides, in this section, the prior ranges of soil hydraulic parameters for inverse modeling in both the synthetic and real case experiment are also provided.

2.1. Unsaturated Soil Hydrology in Hydro-Mechanical Model

A modified Richards’ equation was used to simulate unsaturated flow at the vertical direction in a slope [2]:
C h t = z K 1 c o s 2 β h z + 1
where t T is time; z L is depth positive upward; h L is pore water pressure; C L 1 is soil water capacity defined as d θ / d h ; and K LT 1 is unsaturated hydraulic conductivity function; and β (deg) is slope angle.
The soil water retention curve proposed by van Genuchten [39] is adopted as a nonlinear function to describe the relation between water content and pore water pressure:
θ h = θ r + θ s θ r 1 + α h n m           ,   h 0 θ s          , h > 0
K S e = K s S e l 1 1 S e 1 / m m 2   , h 0 K s            , h > 0
where:
S e h = θ h θ r θ s θ r
where θ L 3 · L 3 is volumetric water content; θ r L 3 · L 3 is residual water content; and θ s L 3 · L 3 is saturated water content. α   L 1 , m , and n are shape parameters; K s L · T 1 is saturated hydraulic conductivity; and l is an empirical parameter (generally is 0.5). The parameter m is commonly approximated to 1–1/n, S e L 3 · L 3 is effective saturation.

2.2. Differential Evolution Markov Chain (DE-MC)
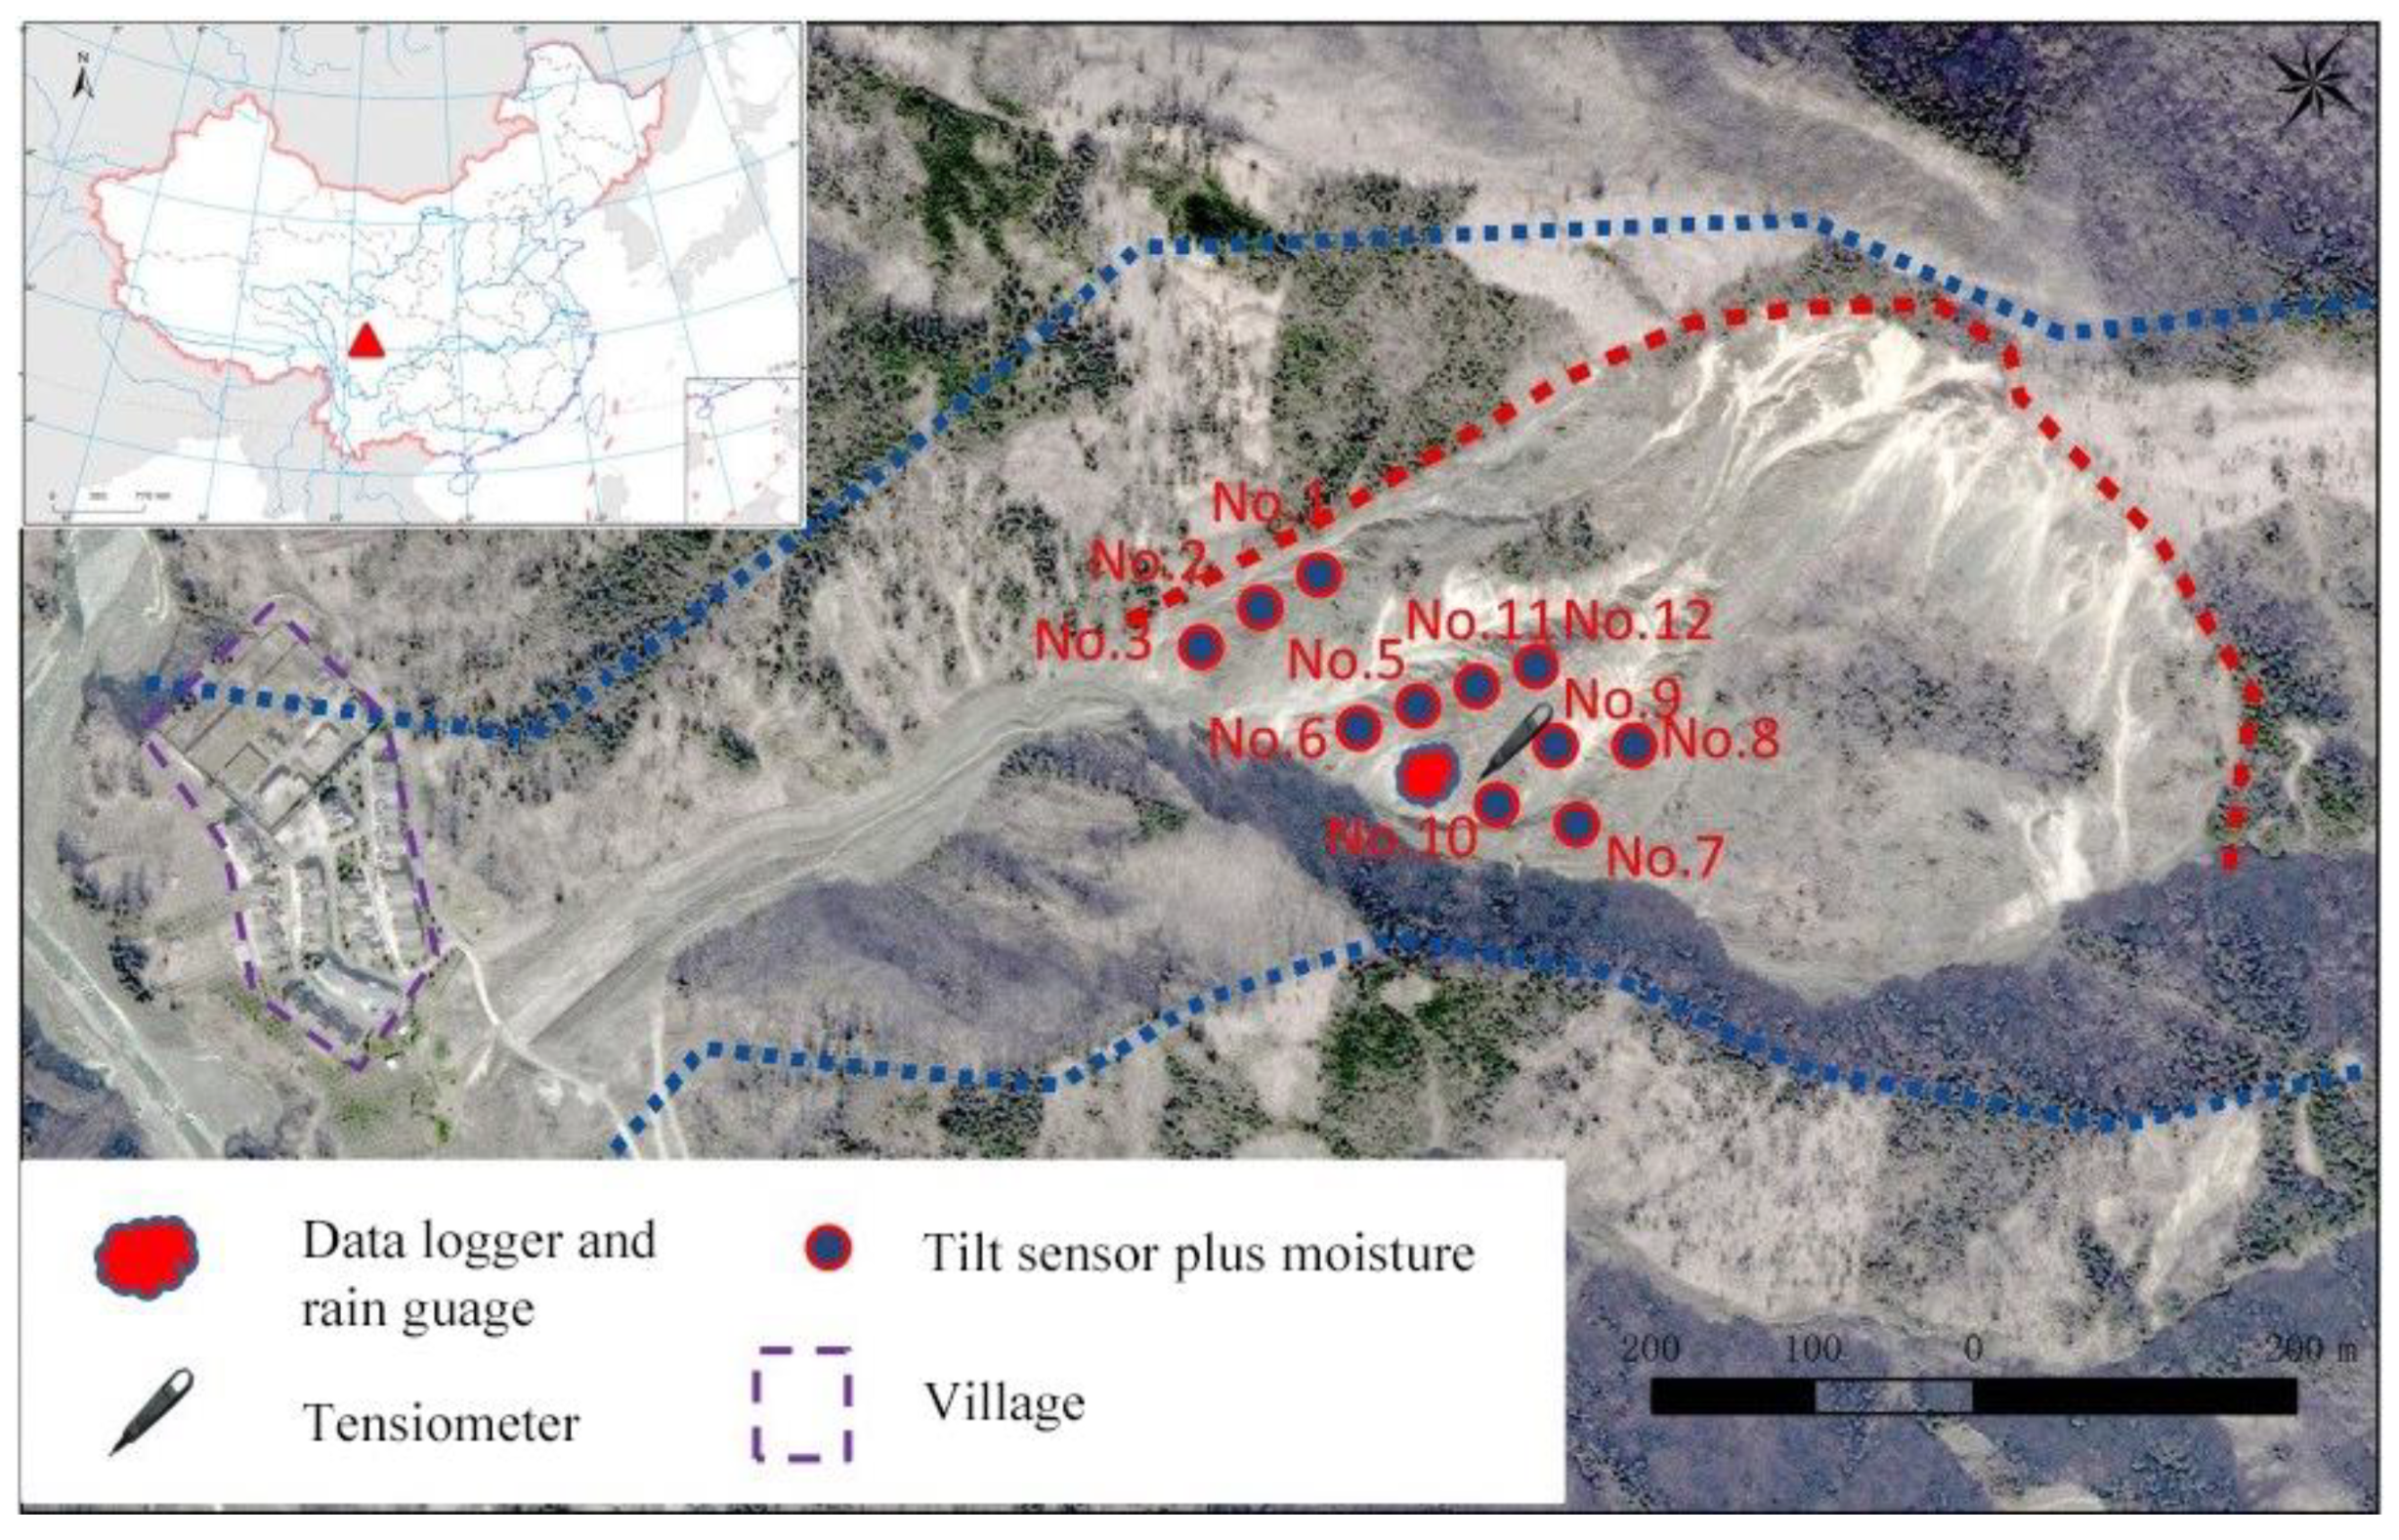
The soil hydraulic properties described with the van Genuchten equation included five parameters of θ r ,   θ s ,   α ,   n ,   K s . The unknown parameters composed a vector of x = θ r ,   θ s ,   α ,   n ,   K s . The parameter sets were calibrated using the DE-MC method. In DE-MC, the observations were merged with the prior parameter knowledge to define the joint posterior probability density function (PDF) of dimensionality d . Here, N different Markov chains were running simultaneously with proposals in parallel in DE-MC. X denotes an N × d matrix, with each chain in row. Then, multivariate X p was generated on the fly from the collection of chains, X = { x   t 1 1 , …, x t - 1 N } using differential evolution:
X p i = γ d X a X b + ζ d ,   a b i
where γ denotes jump rate, a and b are integer values drawn without replacement from { 1 , …, i 1 ,   i + 1 , ,   N }, and ξ ~ n d 0 ,   c * is drawn from a normal distribution with small standard deviation, i.e., c * = 10 6 . By accepting each proposal with Metropolis probability:
p a c c X i X p i = m i n p X p i p X i , 1                   , p X i > 0   1             ,     p X i = 0
Here, the Markov chains are obtained, the stationary or limiting distribution of which is the posterior distribution. If p a c c X i X p i is larger than some uniform label drawn from μ (0,1), then the candidate point is accepted and the ith chain moves to the new position, that is x i = x i p , otherwise x t i = x t 1 i .
The states x 1 x N of the individual chains are independent at any generation after DE-MC has become independent of its initial value. If the initial population is drawn from the prior distribution, then DE-MC can finally transfer these sample into the posterior population.
This study used the Nash–Sutcliffe efficiency coefficient (NSE) as an objective function and soil moisture content θ as a variable to determine whether the transfer happens:
NSE θ = 1 i = 1 N θ true θ sim 2 i = 1 N θ true θ ¯ 2
where θ true L 3 · L 3 and θ sim L 3 · L 3 represent true and simulated soil moisture content; and θ ¯ L 3 · L 3 is mean soil moisture content.

2.3. Study Area

The study area is formed with landslide deposits and located in the Yindongzi gully, Baisha River catchment, Dujiangyan County, Sichuan Province, China (longitude 103′22.75 E; latitude 31′9″36.15 N). The study area sits in the subtropical humid monsoon climate zone with a mean annual temperature of 16.7 °C. The Yindongzi gully has significant seasonal characteristics with district dry and rainy seasons. The mean annual precipitation exceeds 1200 mm, and over 70% rainfall occurred in the rainy season from May to September.
One landslide deposit in the Yindongzi valley was initially triggered by the Wenchuan earthquake (MS. 8.0) on 12 May 2008, after which the deposit was composed with weathered granite, andesitic, and sand, but the fine particles were rare in the deposit. The loose structure of the landslide deposit was easily eroded by rill erosion at the free surface, which occurred after rainfall and souring flows in the hollow of gullies at the edge of the landslide. Soil moisture sensors (Decagon, Pullman, WA, USA) were installed at 50 cm depth (Figure 1) for 12 different locations, and a tipping-bucket rain gauge was installed to collect the actual rainfall data. The soil moisture data measured at other locations were featured with similar patterns in previous studies.

2.4. Modeling Strategies

The Darcy–Richards model was numerically solved by an author-developed script under the Python 3.8 programming environment, in which the algorithms used the implicit finite difference method and Picard iteration technique in each time step. During simulation, the tolerable error of water content was set to 0.0001, and the time step was dynamic in the range of 0.02~10 min, ensuring the numerical accuracy and computational efficiency. Methodologically, the DE-MC algorithm was integrated with the Darcy–Richards equation to optimize the soil hydraulic parameters.
The parameters θ r , θ s , α , n , K s in the van Genuchten equation were regarded as variables for random sampling in parameter space. Table 1 showed the prior ranges of these soil hydraulic parameters specified for both the synthetic and real case numerical experiment. Firstly, we conducted a synthetic numerical experiment to validate the effectiveness of the DE-MC approach in finding the pre-defined true soil hydraulic parameters in the van Genuchten model. The DE-MC algorithm was set at 80 and 20 Markov chains, respectively, and we additionally provided the traditional approach of MCMC that only used one chain. The number of iterations was 500, and finally 40,000, 10,000, and 500 samples of parameter sets can be respectively obtained when using the three approaches. The soil hydraulic parameters optimized with MCMC only provided one parameter set at the last iteration step, and DE-MC provided multiple choices that composed the posterior PDF of each parameter. As validated in the synthetic experiment, 20 chains were specified for the real case numerical experiment, which was sufficient to ensure the effectiveness in finding appropriate soil hydraulic parameters.
The real case numerical study was conducted to implement the proposed method to the measured soil moisture content of the Yindongzi gully from 1 August 2015 to 30 August 2015. The measured data of daily precipitation and soil moisture (No. 12 sensor) in the Yindongzi gully were used for numerical analysis. The selected rainfall in August in the Yingdongzi valley was featured with high frequency and high intensity, and such rainfall condition commonly caused high soil moisture content and a high pore water pressure condition that could be more relevant to landslide-triggering. Moreover, the observations with a one-month duration contained multiple rain pulses, which was sufficient to obtain robust inverse-estimations of soil hydraulic properties.

3. Results

For both synthetic numerical experiment (Section 3.1) and a real case numerical study (Section 3.2), the numerical results were organized as follows: (1) the convergency of each chain (i.e., NSE vs. iteration steps); (2) prior and posterior PDF of each soil hydraulic parameter; (3) ensemble of SWCC and HCF described with prior and posterior parameter; and (4) ensemble of simulated soil moisture dynamics in comparison with true value or measurement. For synthetic experiment, the DE-MC (with 80 and 20 Markov chains) and MCMC (with only 1 Markov chain) were used in inverse modeling, whereas for the real case simulation, only the DE-MC with 20 chains was used.

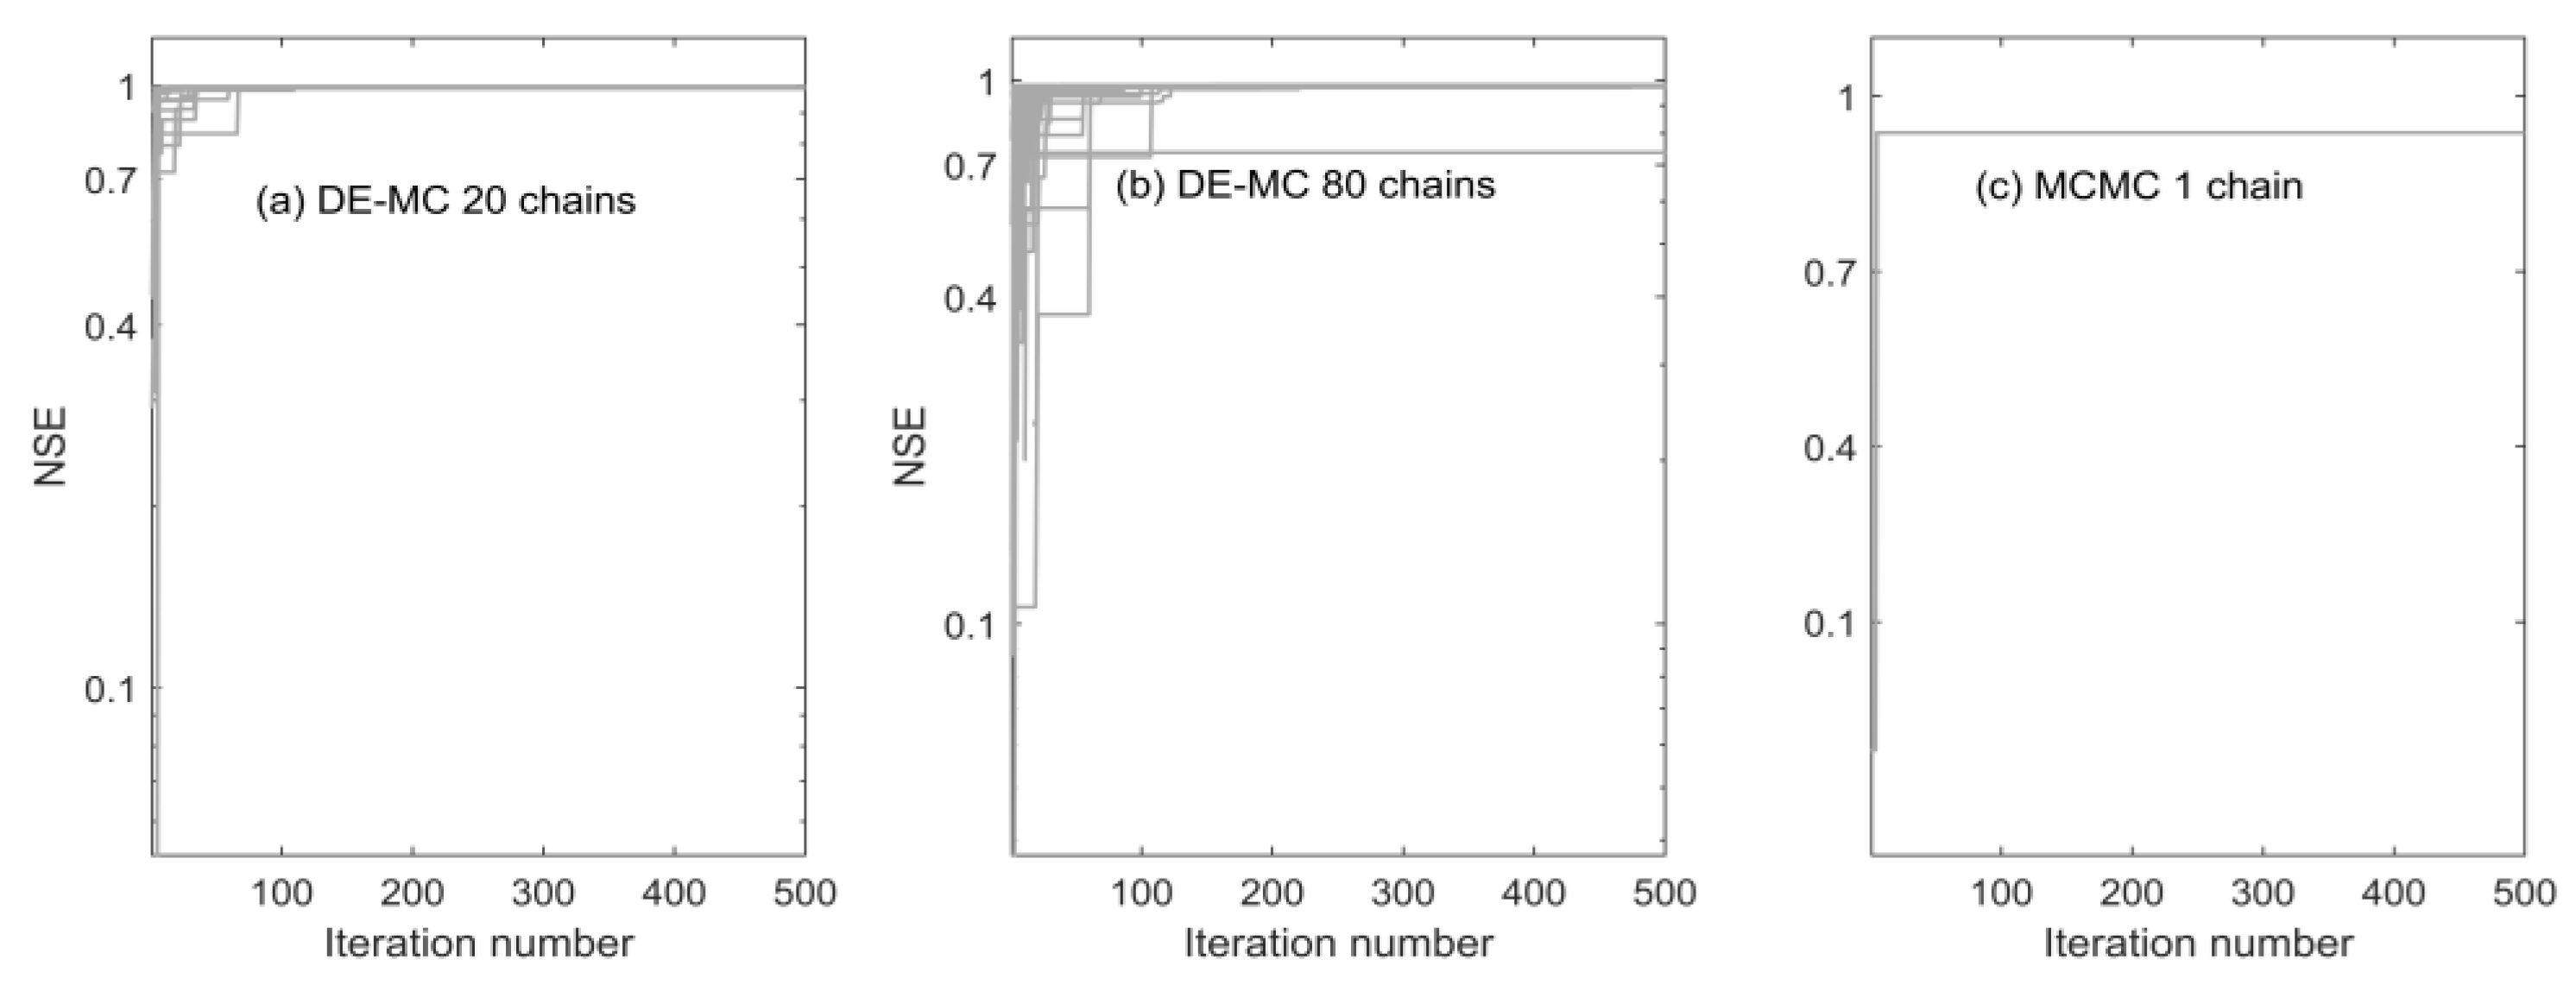
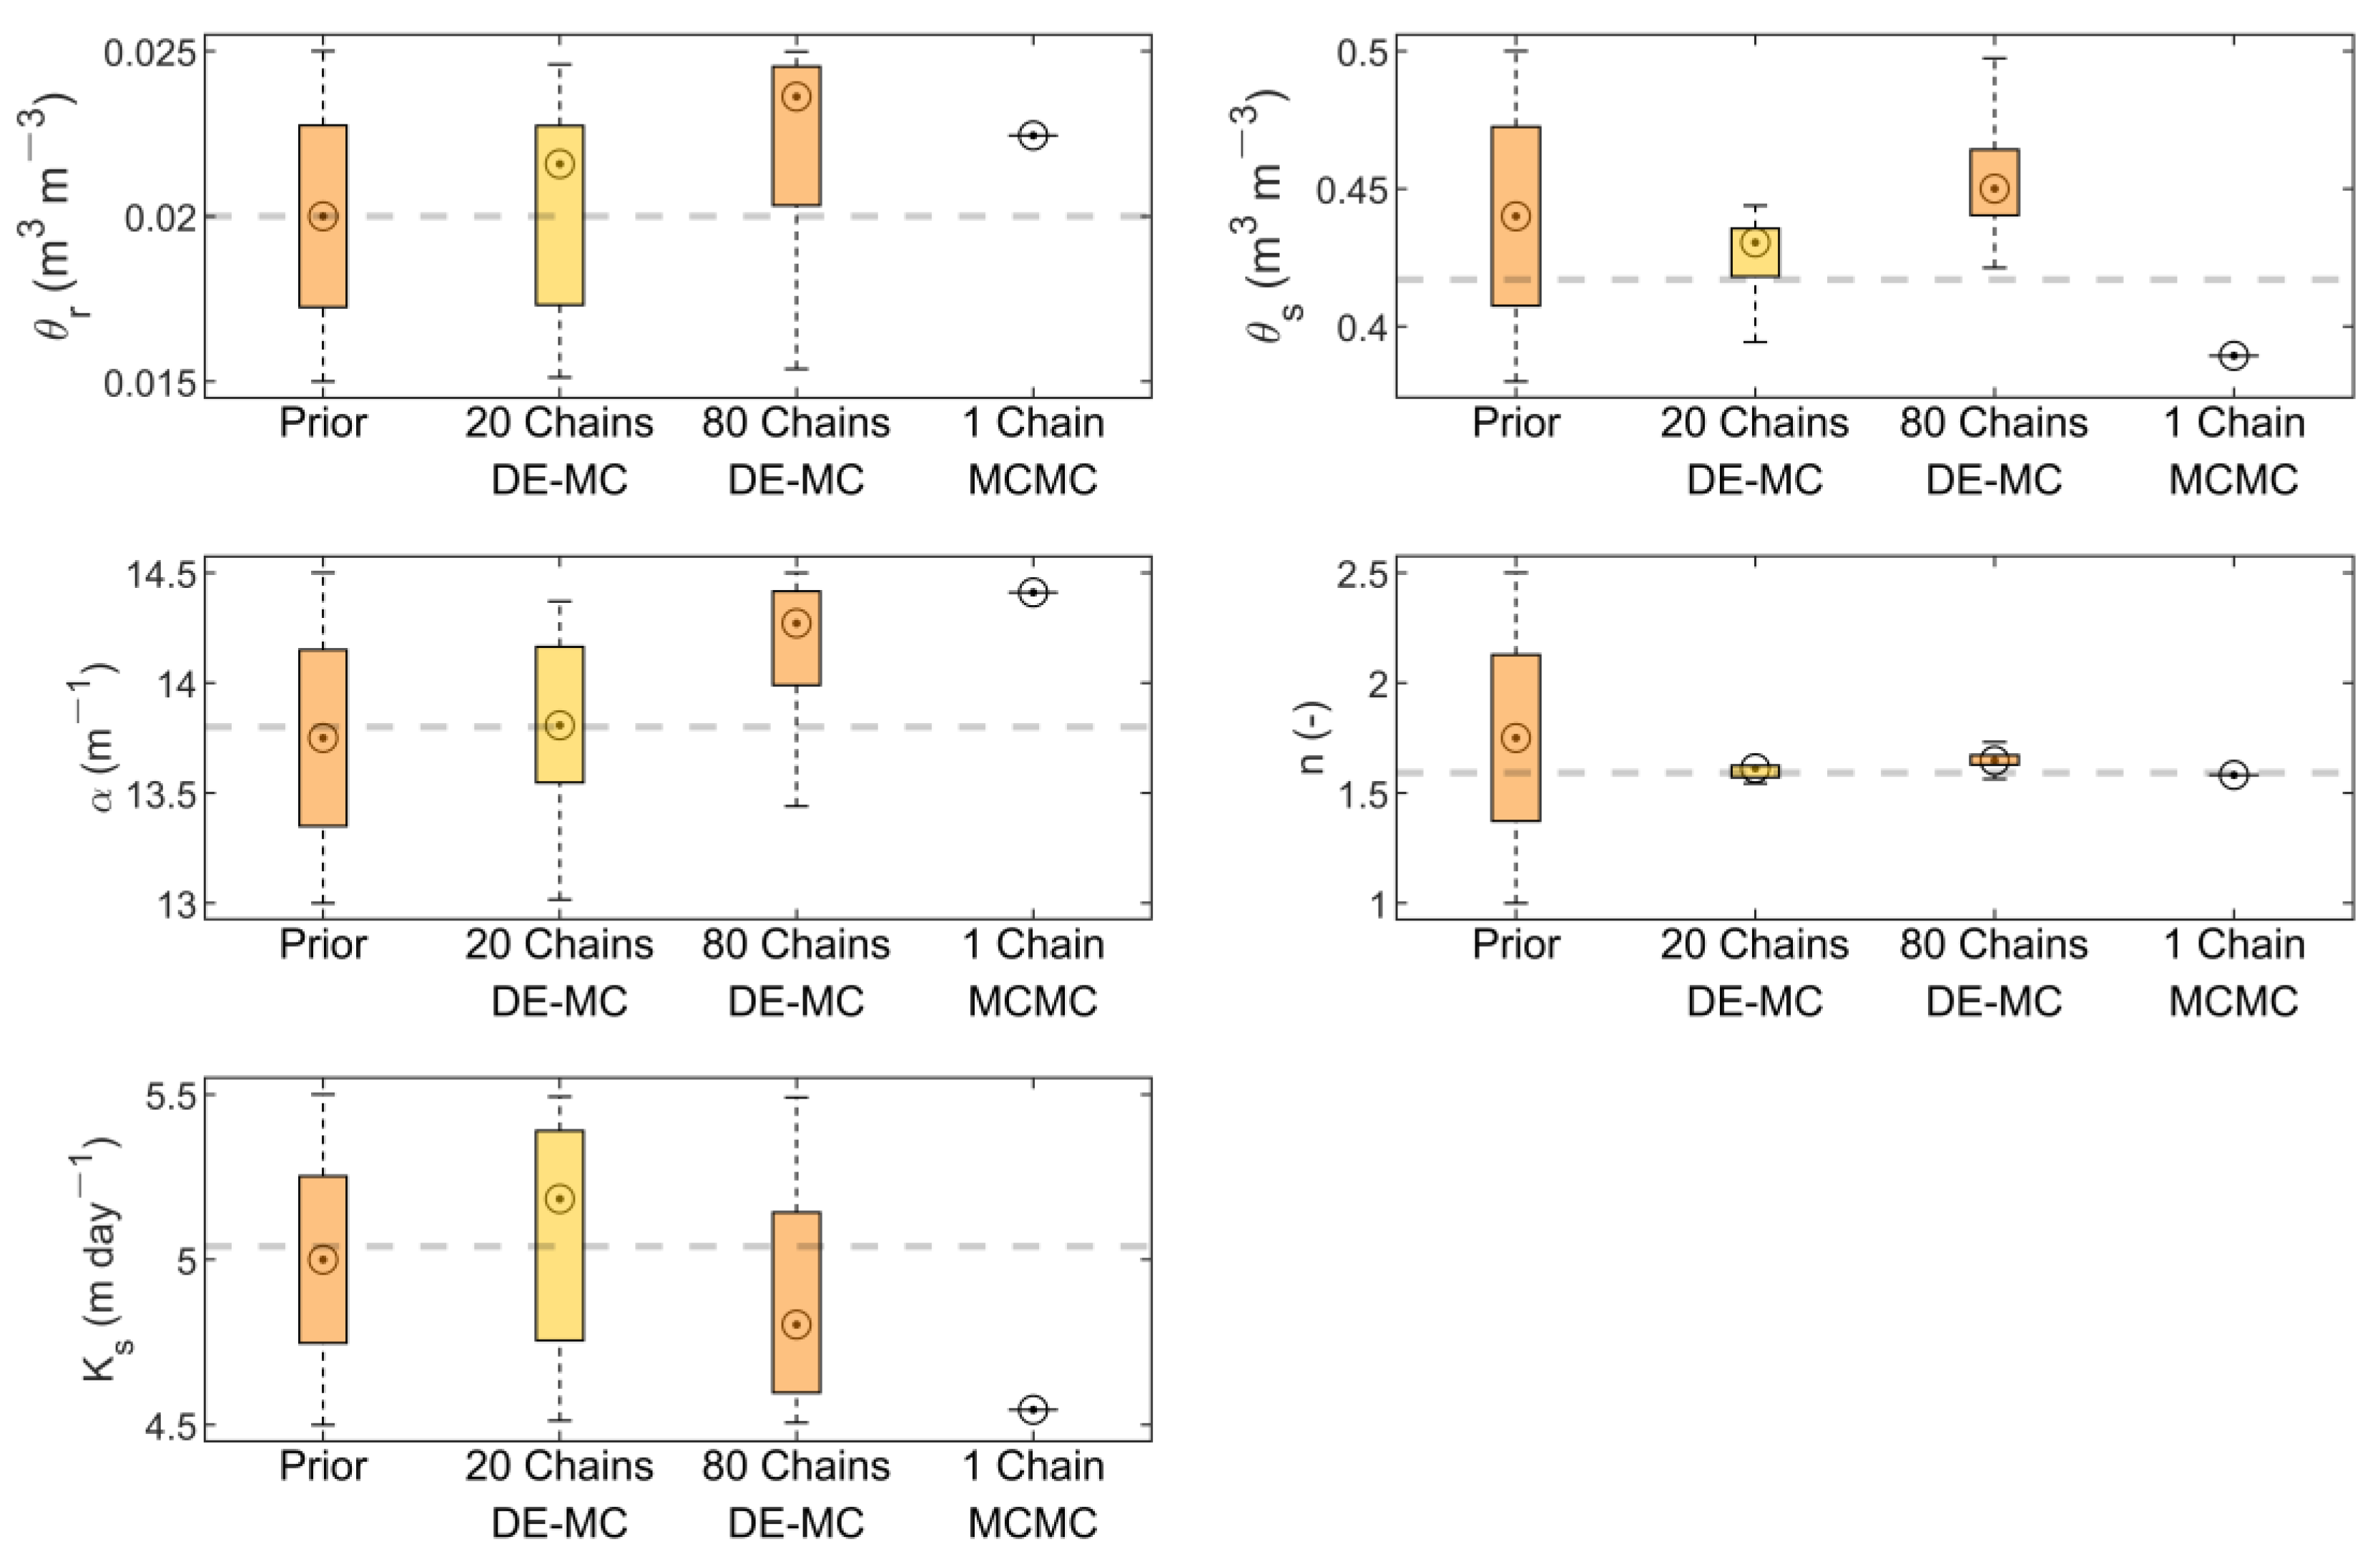
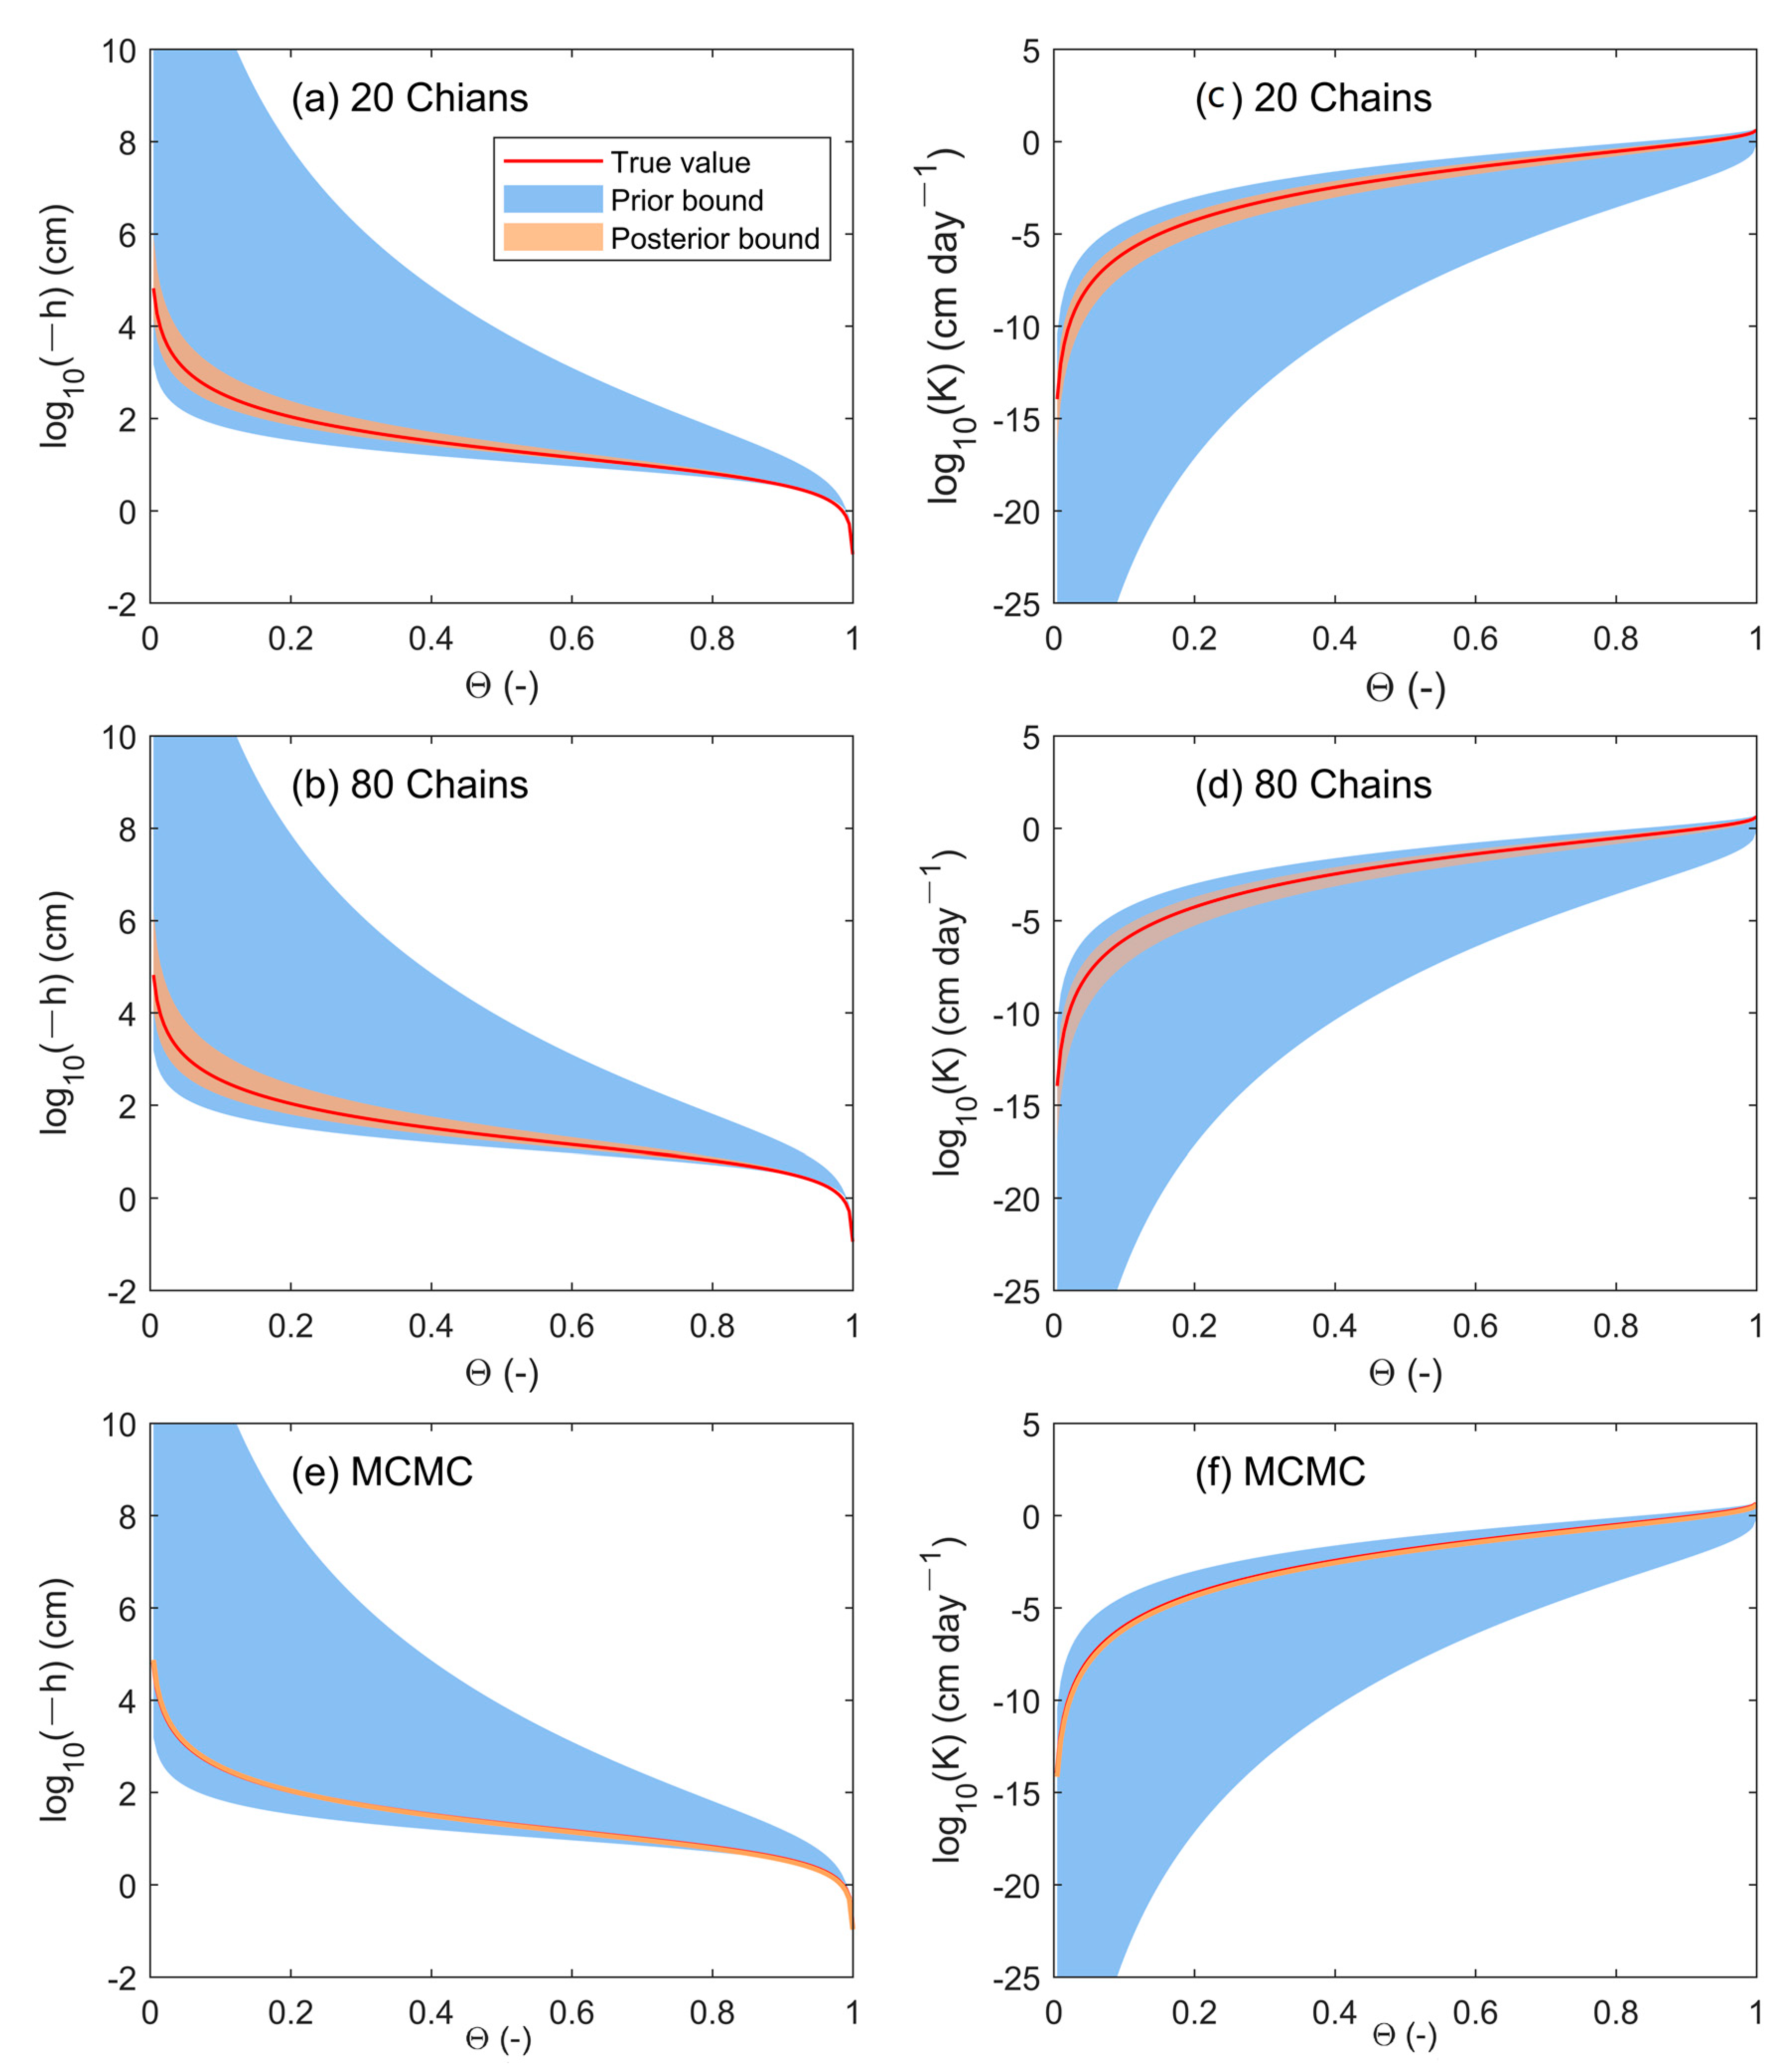
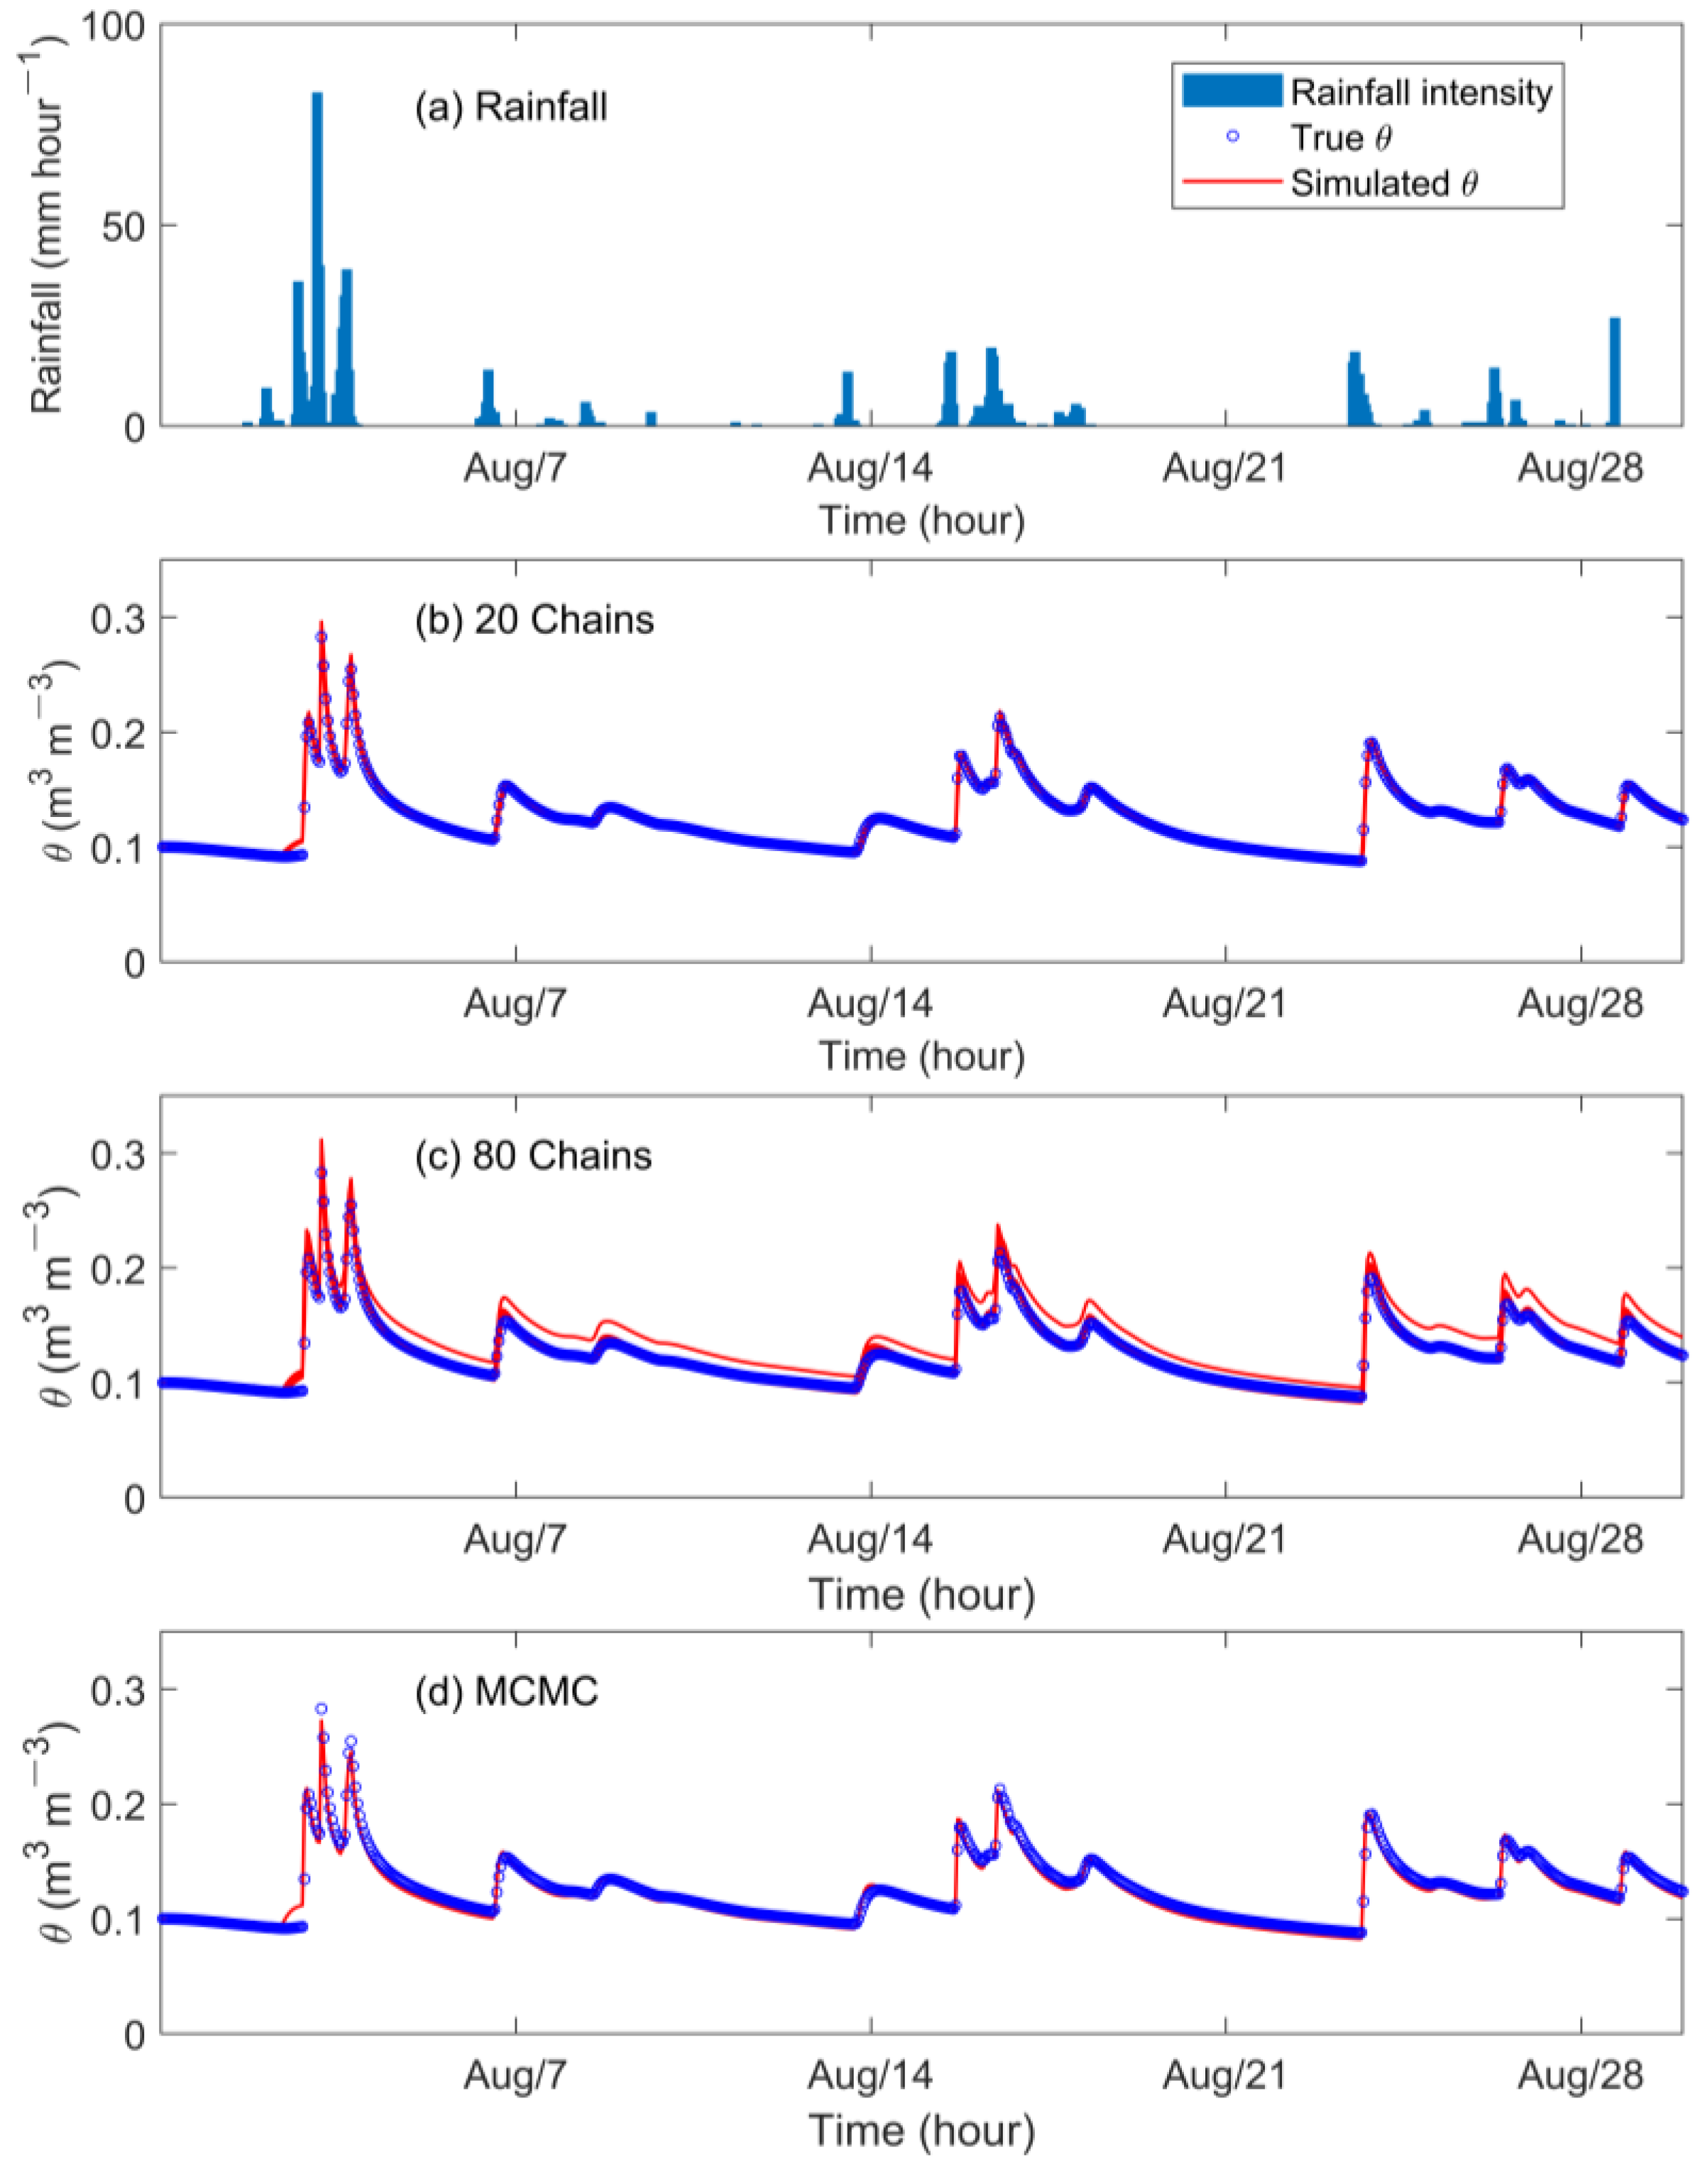
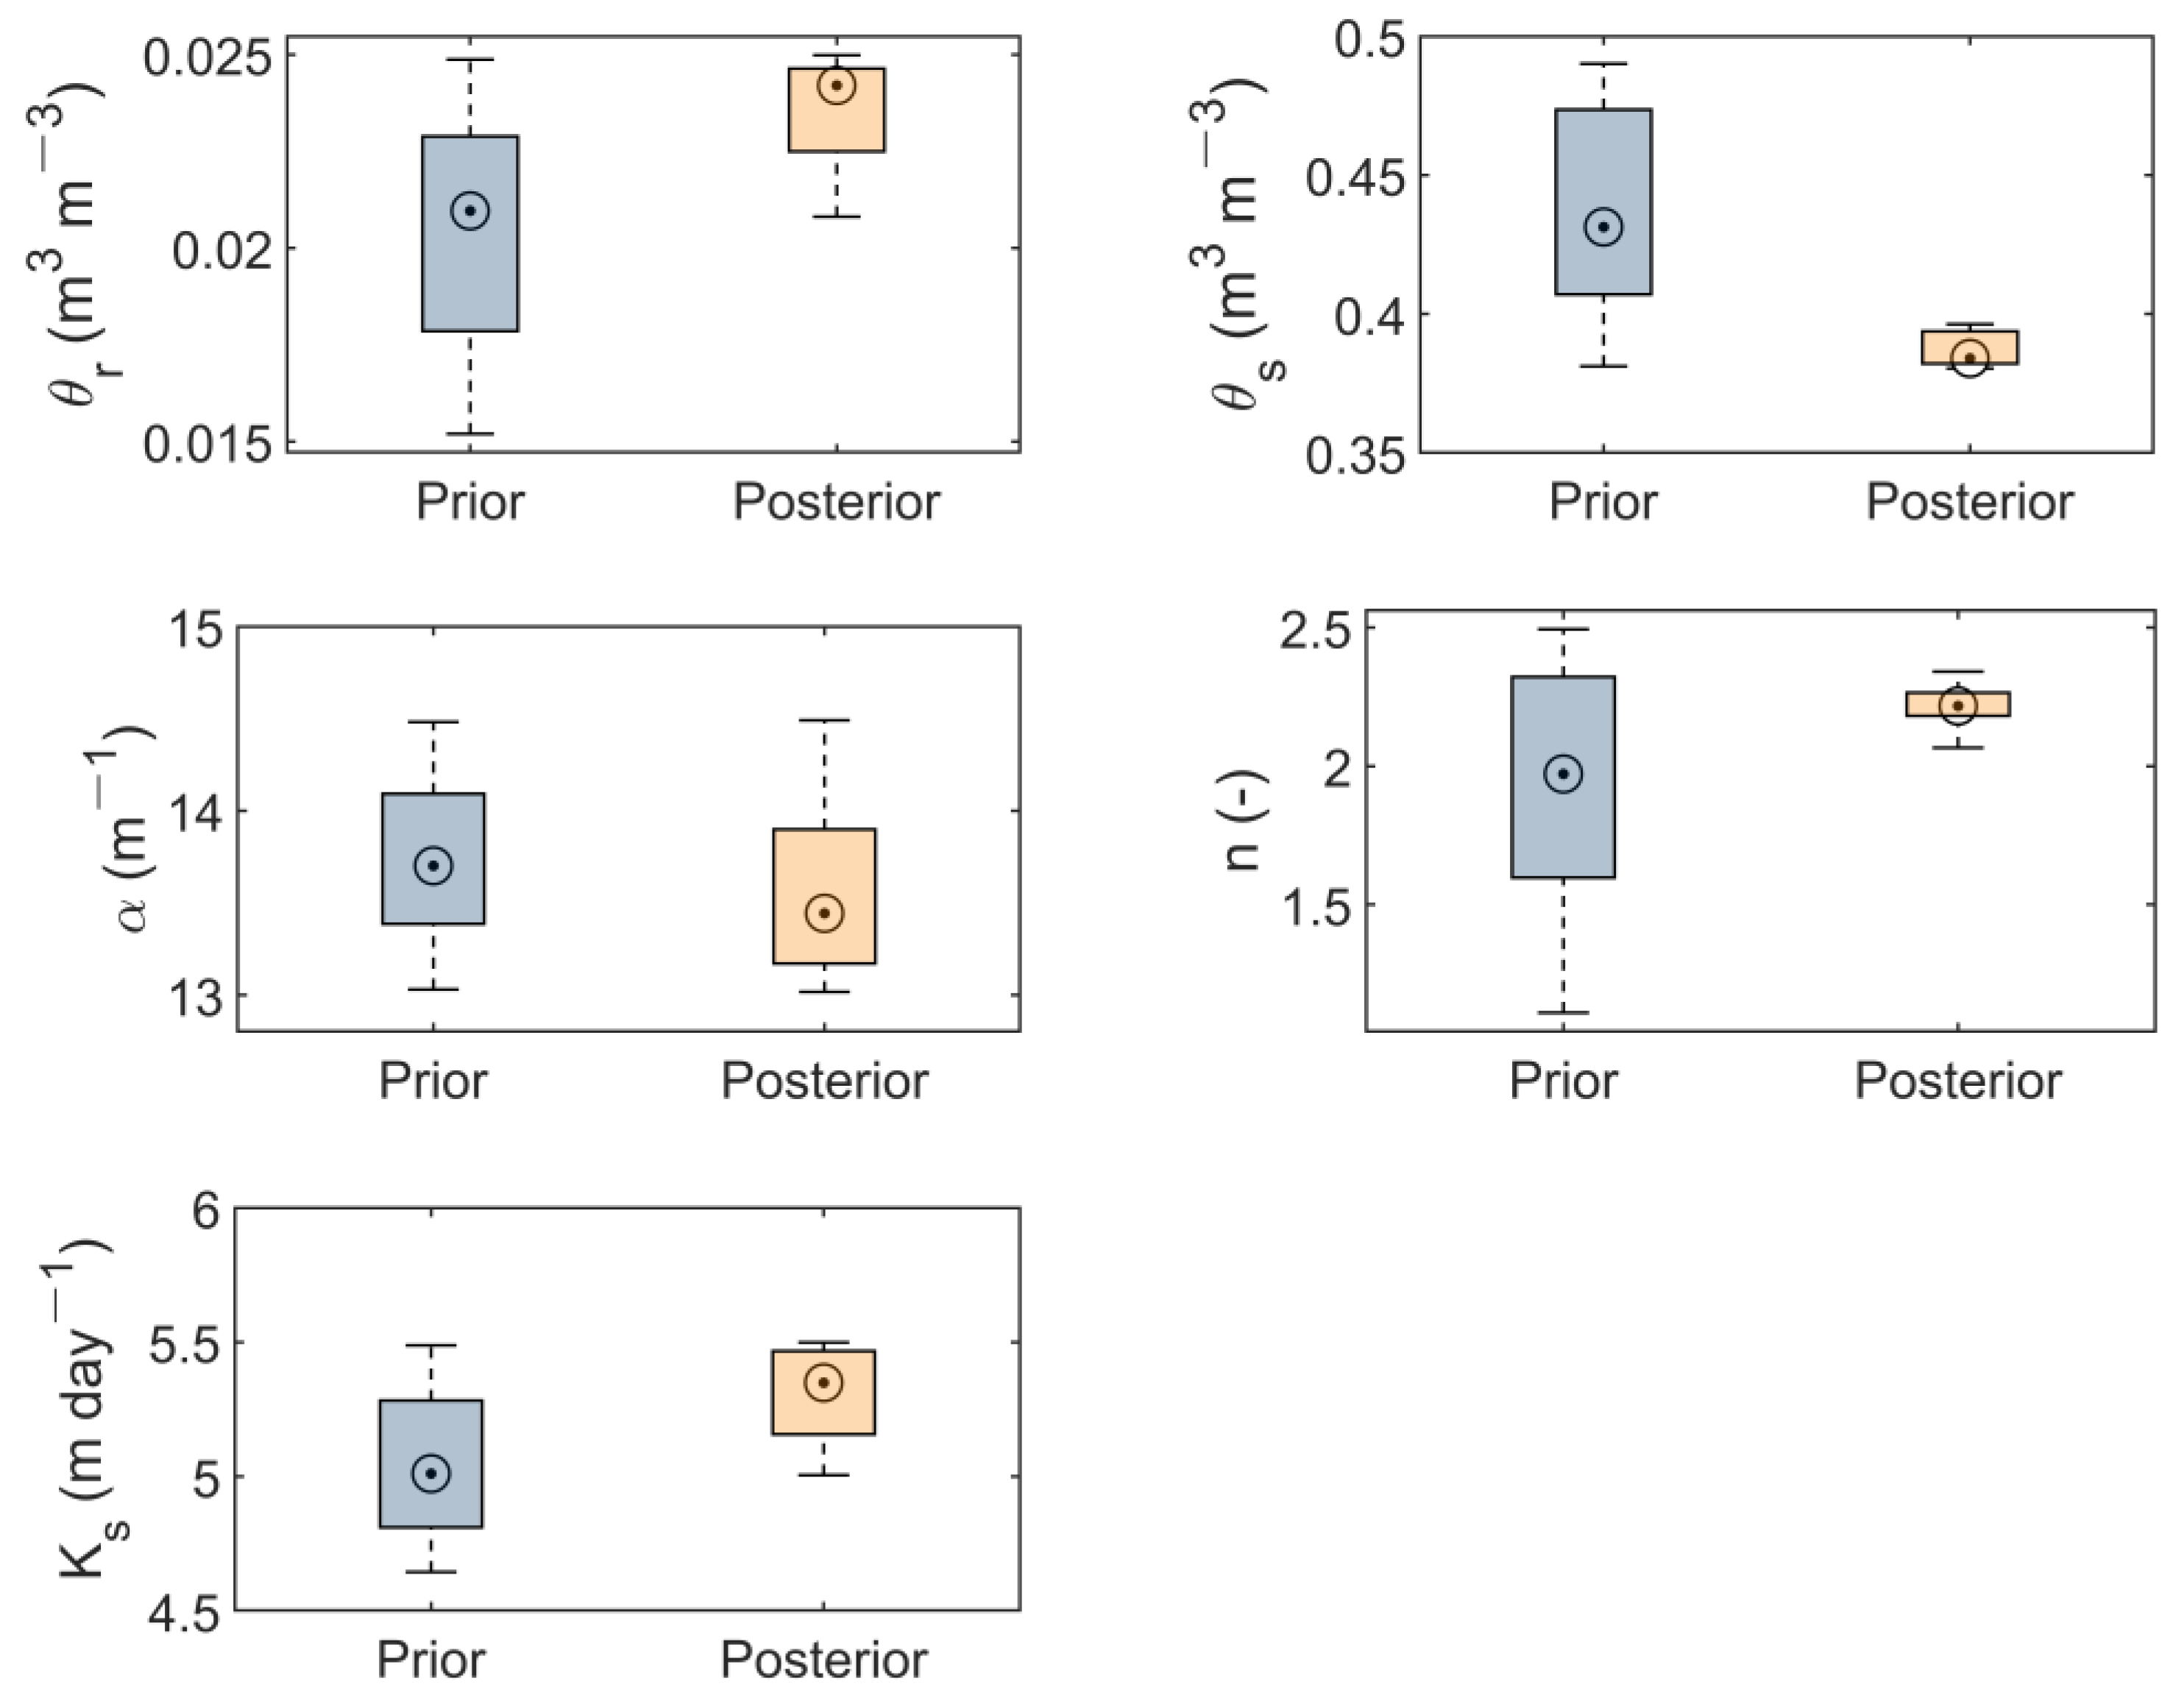
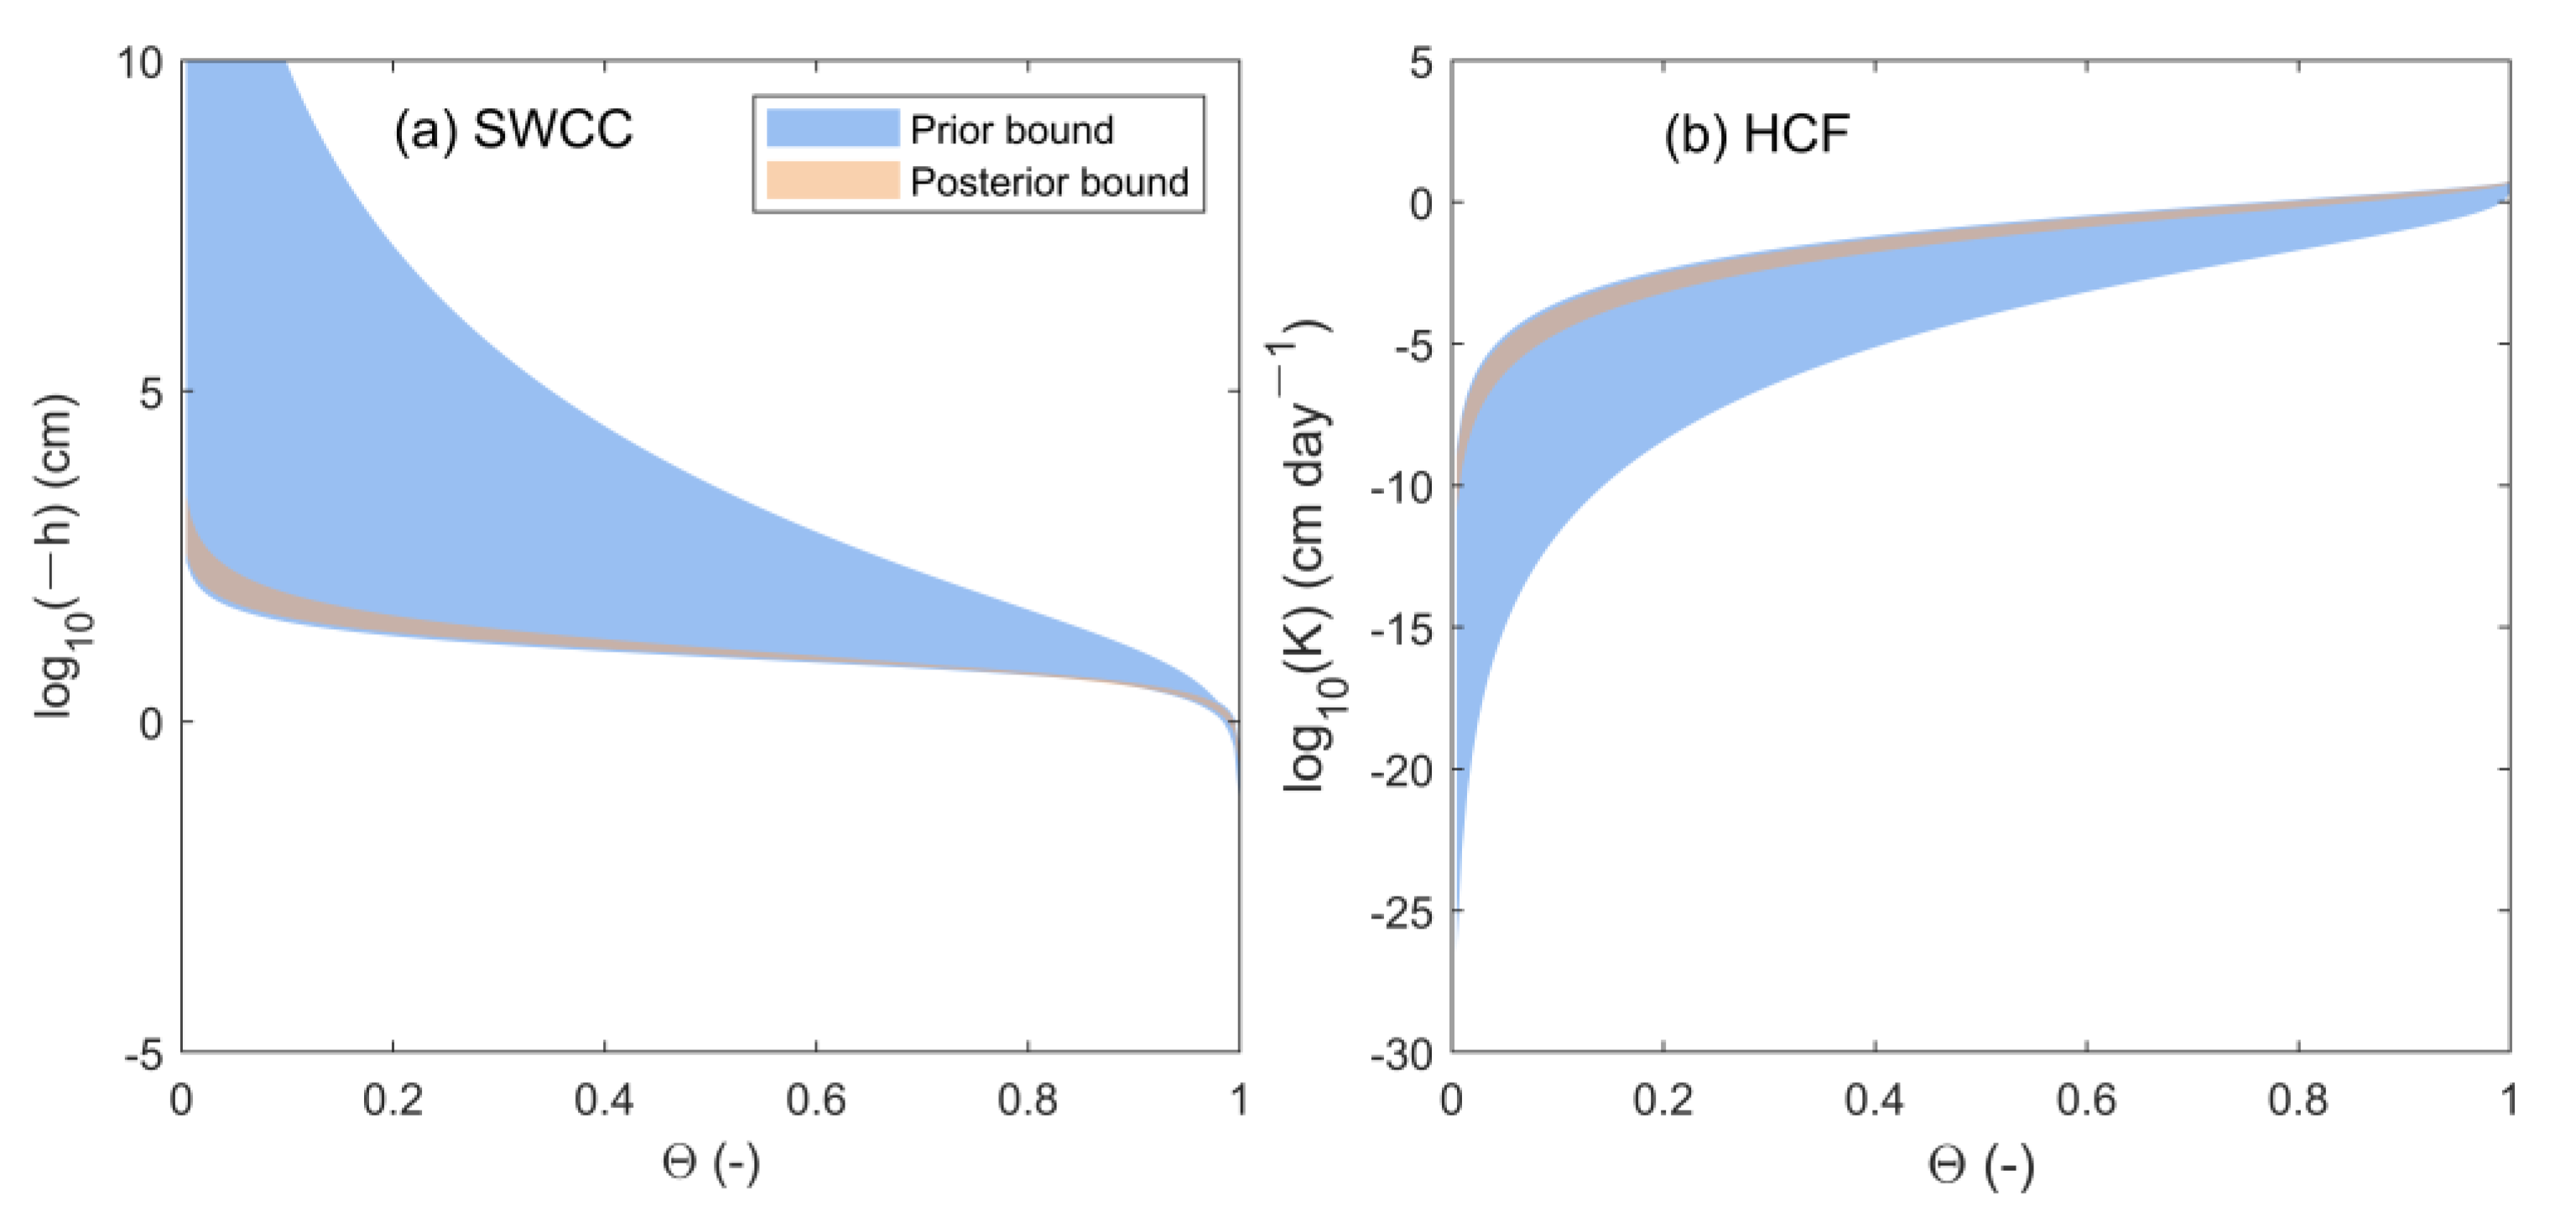
3.1. Synthetic Experiment

Figure 2 shows the NSE versus the number of iterations (generations). The initial NSE of parameter samples generated by DE-MC and MCMC had much wider ranges than the 0.0~1.0, whereas such NSE range quickly converged after a few steps of iterations. The parameter sets of both DE-MC and MCMC converged after around 500 iterations, as can be seen that the NSE values of parameter sets selected by DE-MC were larger than 0.7. In the last iteration step, 95% of the chains reached NSE values of 0.9 after the model parameters were optimized by the DE-MC algorithm. Especially, NSE of MCMC was 0.937 and indicated a satisfying model performance.
For validating the effectiveness of DE-MC and MCMC algorithms in optimizing the soil hydraulic parameters, the prior and posterior PDF of each soil hydraulic parameters were shown as approximations of boxplot, and the predefined true values were plotted as dash lines (Figure 3). Besides, mean values and standard deviations of prior and posterior PDF of parameters were provided in Table 2. The values of prior parameters (round dots in the first boxplot in each sub figure) were generally consistent with the true parameters, meaning the initial soil hydraulic parameters at the first step were well-defined. The boxplot of posterior parameters was directly compared with the true values and prior PDF for an evolution of the effectiveness of MCMC and DE-MC in finding true soil hydraulic parameters. Besides, if the standard deviation of the posterior PDF reduced to less than half of the prior one, we regarded the magnitude of uncertainty as significantly reduced in the posterior parameters.
The soil hydraulic parameters θ r and θ s , respectively, represented the soil moisture content under residual condition and saturation condition. The mean values of inversely estimated θ r by DE-MC and MCMC were highly consistent with the true value. Besides, the standard deviations of the prior and posterior PDF of θ r were all equal to 0.003, indicating relatively small value ranges. For example, the prior mean value of posterior θ r calculated by DE-MC 80 chains and MCMC was equal to 0.022, which was only slightly higher than the prior mean value of 0.020. The mean value of posterior θ r calculated by DE-MC 20 chains was exactly equal to the prior. For saturated water content θ s , the mean values of DE-MC 20 chains and DE-MC 80 chains were 0.43 and 0.451, respectively, which were very closed to the true value of 0.44. However, the posterior θ s estimated with MCMC with one chain was 0.389, which was underestimated in comparison with the true value. Moreover, it is worth to note that the standard deviation of posterior θ s selected by DE-MC 20 chains and 80 chains was 0.020 and 0.022, respectively, which was much lower than prior. DE-MC can reduce uncertainties in prior θ s and finally provided concentrated parameter estimations.
The parameters of α and n expressed the shape of SWCC and HCF. The mean values of posterior α calculated by DE-MC 20 chains and DE-MC 80 chains were 13.814 and 14.189, respectively, which suggested consistent overestimation in comparison with the prior mean. On the contrary, the mean values of posterior n calculated by DE-MC 20 chains and DE-MC 80 chains were 1.604 and 1.645, respectively, which had consistent underestimation in comparison with the prior mean. The coexistence of overestimation of α and underestimation of n may be compensated in describing SWCC and HCF, and such compensation effect can bring the equifinality phenomenon. Moreover, the standard deviations of posterior α selected by DE-MC 20 chains and 80 chains were 0.413 and 0.264, respectively, which were smaller than the prior. More significant changes can be found in the standard deviation of posterior n after the parameter optimization. The standard deviation of prior n was 0.437, whereas the posterior n reduced to 0.056 with DE-MC 20 chains and 0.048 with DE-MC 80 chains. It is well known that n is a sensitive parameter that can significantly affect the described SWCC and HCF, the significantly reduced standard deviation after the parameter optimization using DE-MC, implying an effective reduction of uncertainties. The MCMC with one chain well predicted n value but severely overestimated α value, implying MCMC may also incorrectly predict other soil hydraulic parameters (e.g., K s and θ s , see Figure 3).
The saturated hydraulic conductivity K s dictates the water transport behavior. The mean value of posterior   K s selected by DE-MC 20 chains (5.082) and 80 chains (4.874) were generally consistent with the true value (5.00), whereas the standard deviations of the posterior K s were nearly unchanged. The selected K s with MCMC was much smaller than the true value.
The ensembles of SWCC and HCF described with the prior and posterior soil hydraulic parameters were plotted in Figure 4, covering the low saturation condition ( Θ = 0.005) to near saturated condition ( Θ = 0.995). In Figure 4, the ensemble of parameters selected by MCMC and DE-MC 20 chains and 80 chains were plotted as uncertainty bands, and the true value of soil hydraulic parameters were plotted as solid red lines. For a directly comparison, the ranges of log   10 h and log   10 K under three saturation condition ( Θ = 0.2, 0.5, 0.8) were shown in Table 3. Normally, the effective saturation of natural soil ranges from 0.2 to 0.8.
In Figure 4, the posterior ranges of SWCC and HCF generated by DE-MC with 20 chains and 80 chains were much smaller in comparison with prior ranges, and the ensembles of the posterior parameter were highly consistent with the true value. It can be concluded that soil hydraulic parameters calibrated by the DE-MC algorithm reduced uncertainties of the soil hydraulic properties, and meanwhile provided accurate prediction of the predefined true soil hydraulic properties. The ranges of log   10 h and log   10 K under three saturation conditions ( Θ = 0.2, 0.5, 0.8) quantitively validated the effectiveness of DE-MC to correctly optimize the soil hydraulic parameters. At the low saturation condition ( Θ = 0.2), the ranges of the log   10 h of the ensemble parameters optimized with DE-MC with 20 chains and 80 chains were 1.854~2.382 and 1.803~2.46, which were consistent with the true value 2.039. Similarly, the ranges of log   10 K of the ensemble parameters optimized with the DE-MC with 20 chains and 80 chains were −5.110~−3.762 and −5.284~−3.723, which is also consistent with the true value of −4.268. For the other saturation degree, it also showed that all methods narrowed the prior bound and encompassed the true value. The SWCC and HCF optimized with MCMC were also consistent with the true values as expected. The true values of soil hydraulic parameters were relatively coarse soil textures, thus the distribution of SWCC of all methods was located in the lower part of the prior, and HCF was in the upper of the prior.
Figure 5 showed both synthetic and simulated soil moisture dynamics in the synthetic example. The true soil moisture dynamics were obtained based on the numerical simulation using the predefined true soil hydraulic parameter. Under the implemented rainfall, soil moisture dynamics clearly showed three major stages. The first stage was from 1 to 14 August with relatively high intensity rainfall (peak intensity was around 83 mm/h) implemented on 4 August, under which the soil moisture experienced a significant fluctuation from 0.088 to 0.283. During the second and third rainfall stages (14~23 August 23~30 August), the highest intensities of peak rainfall were all lower than 27 mm/h, and the true soil moisture content was characterized with small variations between 0.087~0.213.
The simulated soil moisture dynamics with all the three different strategies can well agree the predefined true value. Among the DE-MC 20 chains, all the simulated soil moisture content was consistent with the true soil moisture content. For DE-MC 80 chains, the ensembles of simulated soil moisture dynamics were also featured with satisfying agreement with the true soil moisture dynamics, and there was only one parameter set showing a relatively larger difference in comparison with the true. For MCMC, the fluctuated soil moisture content was 0.083 to 0.272, and it was very close to the true soil moisture dynamic.
Overall, three parameter optimization strategies integrated with the vadose zone for quantifications of soil moisture dynamics. However, the MCMC algorithm was unable to express the posterior PDF of soil hydraulic parameters. Considering the DE-MC 20 chains can already well express the uncertainty in inversely estimated soil hydraulic parameters, it was adopted for an inverse estimation of soil hydraulic parameter using the in-situ measurement in the landslide deposit.

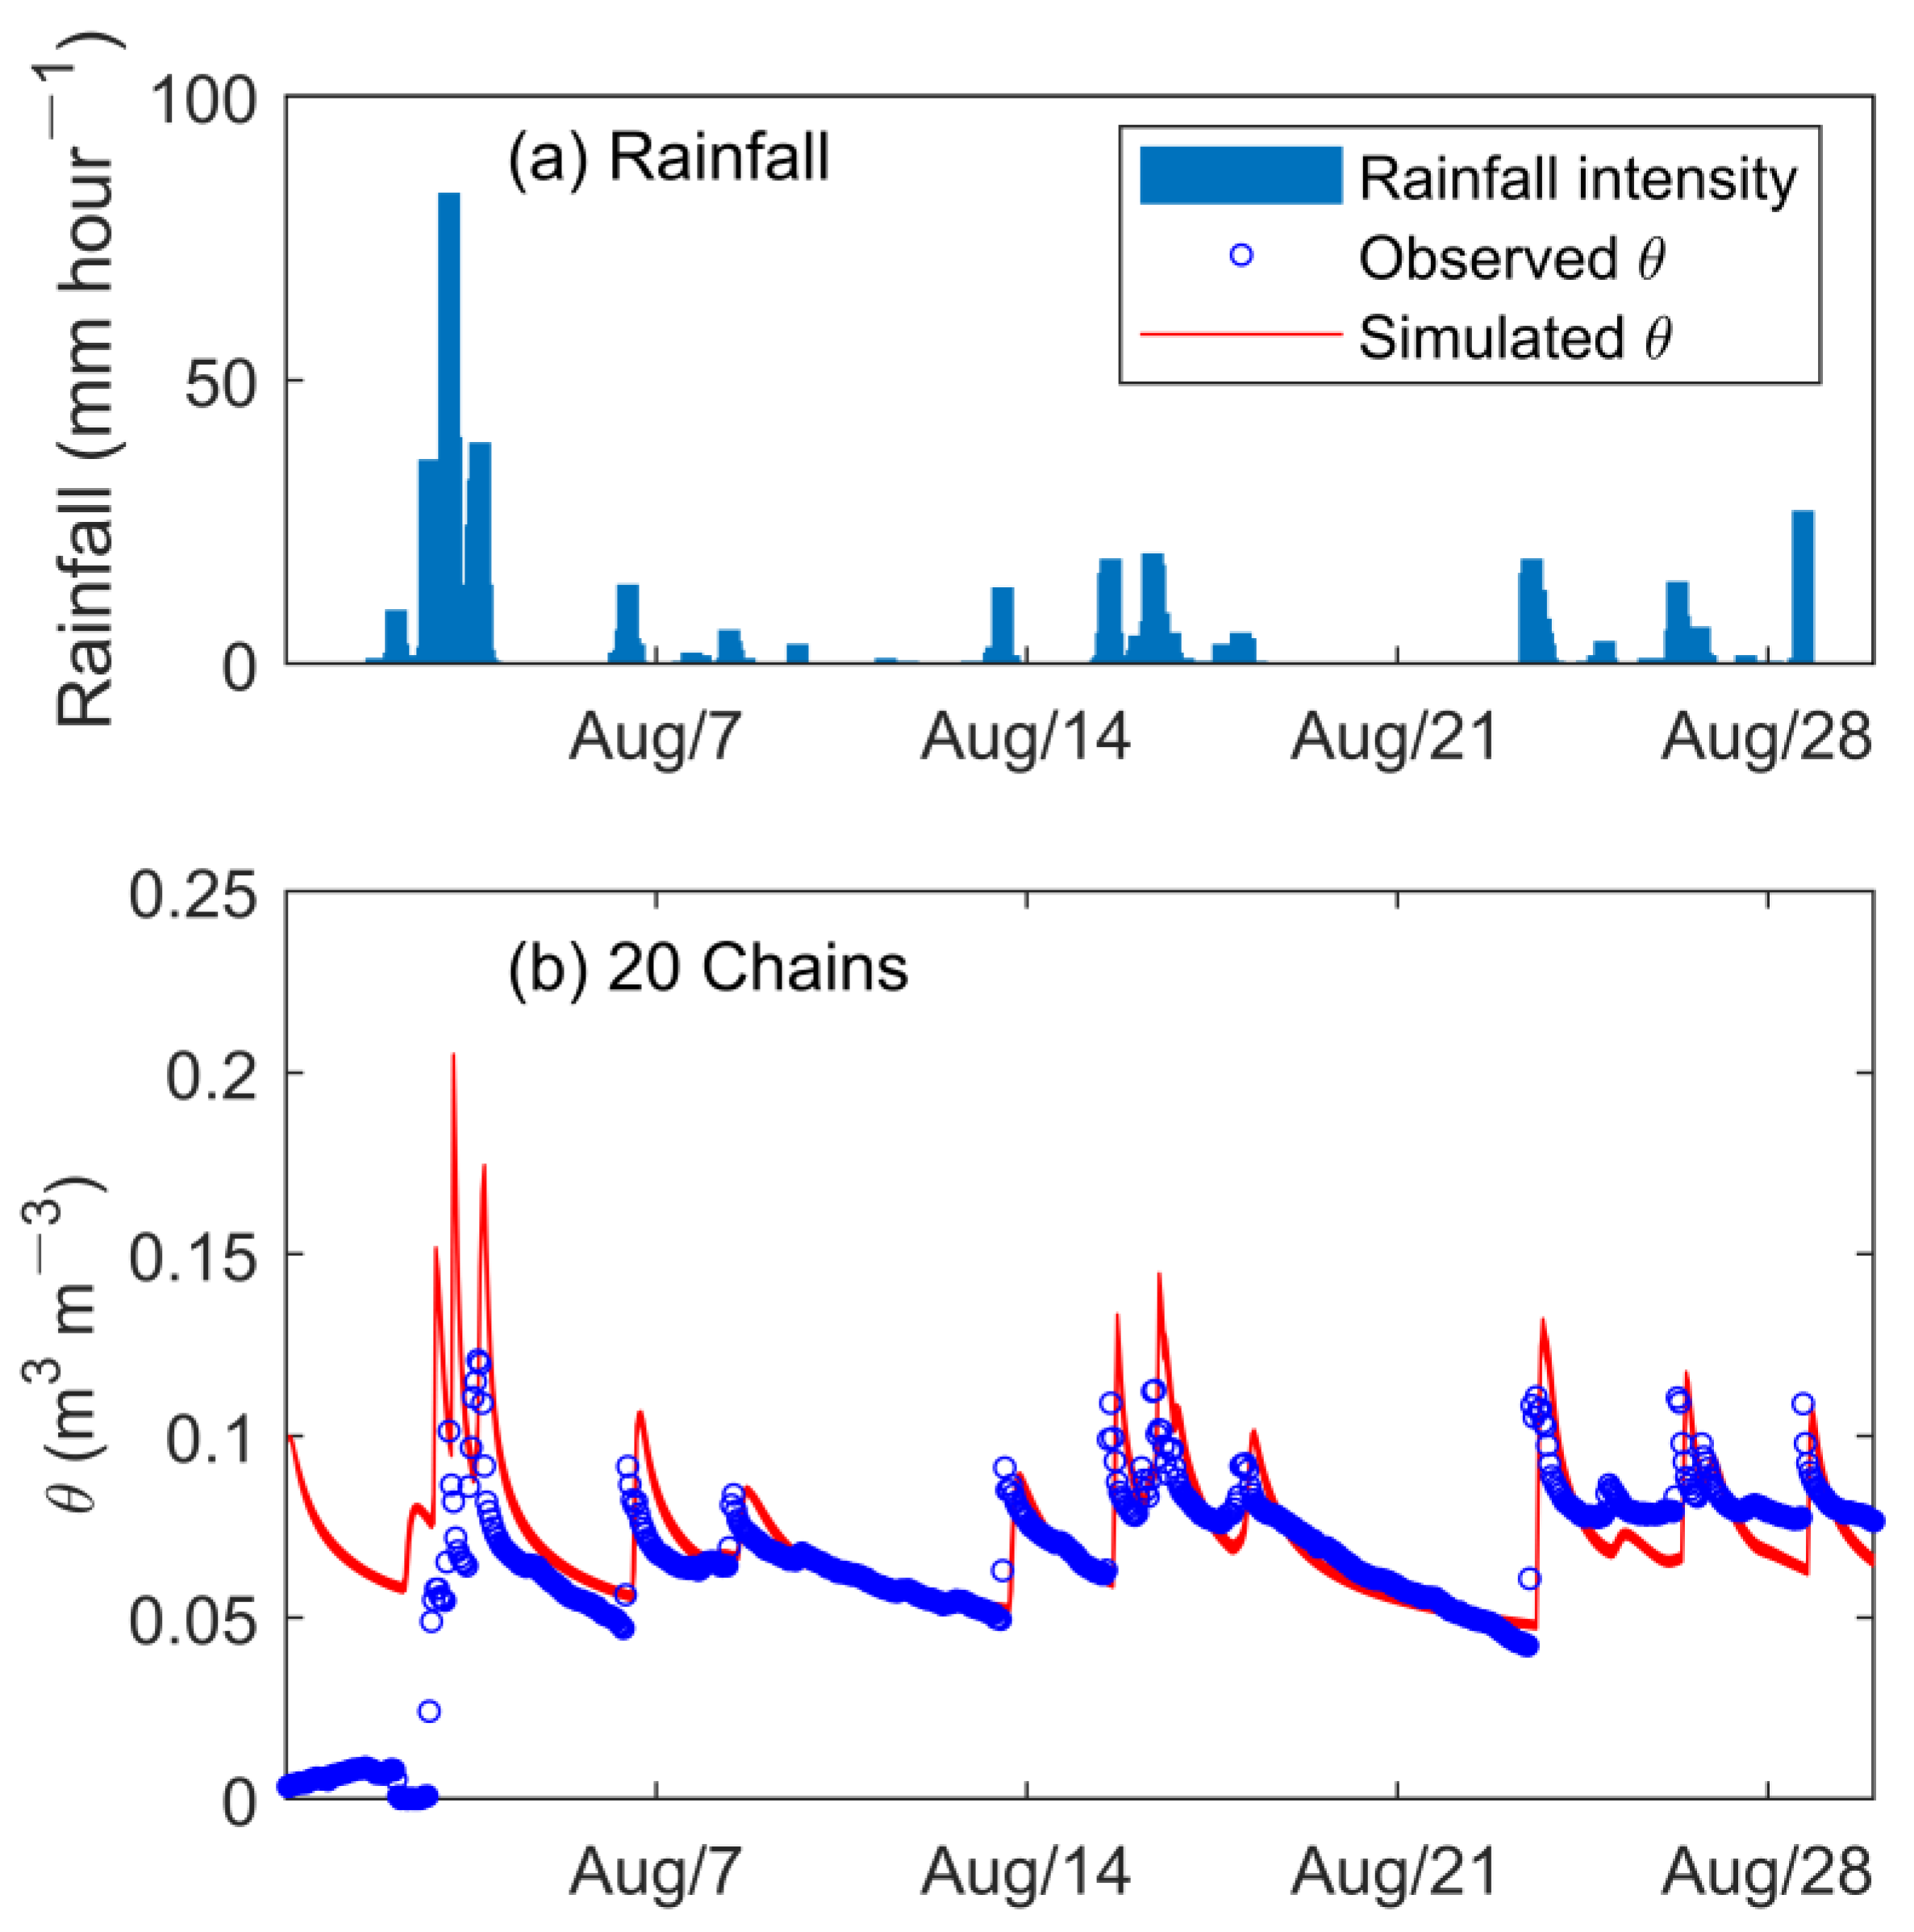
3.2. Real Case Simulation

The DE-MC algorithm was implemented to a real case simulation with 20 chains and 500 iteration steps. Figure 6 shows the evolution of the NSE values with the iteration steps. The NSE values of initial parameter sets were all smaller than 0.3, which indicated an unpredictable performance before parameter optimization. The NSE values converged after 250 iterations, and the parameter sets of all chains may bring satisfying performance as the NSE values were over 0.3. The iterative processes of NSE values clearly indicated that the soil hydraulic parameters calibrated with the DE-MC algorithm can significantly improve the model performance in comparison with the prior parameters.
The prior and posterior PDF of soil hydraulic parameters are shown as the boxplot in Figure 7. The comparison of mean values and standard deviation of the prior and posterior soil hydraulic parameters are shown in Table 4.
In Figure 7, the posterior residual water content θ r converged to the upper part of prior range, whereas the posterior saturated water content θ s converged to the lower part of prior range. In Table 4, mean value of θ r increased from 0.021 in prior PDF to 0.023 in posterior PDF, and mean value of θ s reduced from 0.437 in prior PDF to 0.391 in posterior PDF. The opposite convergence (increase of θ r and decrease of θ s ) expressed a smaller fraction of the pore space for transporting water. However, the standard deviations of the posterior PDF of estimated θ r and θ s were consistently reduced from 0.003 to 0.002 and 0.035 to 0.016, indicating the DE-MC could narrow the range of prior parameters and provide more concentrated ranges of optimized soil hydraulic parameters.
The mean and standard deviation of shape parameter α did not have significant changes in the posterior PDF selected by DE-MC in comparison with the prior. The mean value of α slightly reduced from 13.721 in the prior PDF to 13.576 in the posterior PDF, and standard deviation slightly increased from 0.434 to 0.451. On the contrary, the mean value of n significantly increased from 1.913 in prior PDF to 2.209 in posterior PDF, whereas the standard deviation significantly reduced from 0.461 to 0.101 after parameter optimization. As a result, parameter n tightly converged to the value of 2.2, which was a relatively high value in its prior value range. Apparently, the DE-MC approach significantly reduced uncertainties in estimating n .
The posterior range of selected saturated hydraulic conductivity K s converged to the upper part of the prior range, which was constant with the mean value of K s that increased 5.045 in the prior distribution to 5.296 of the posterior distribution. Besides, the standard deviation of K s reduced from 0.288 to 0.169.
It can be concluded that, except for shape parameter α , the standard deviation of the posterior distribution of each parameter was smaller than the prior distribution, indicating the uncertainty of parameters was significantly reduced after the optimization with the DE-MC algorithm.
The ensembles of SWCC and HCF described with posterior soil hydraulic parameters optimized with DE-MC 20 chains are plotted as orange bands in Figure 8, covering a low saturation condition ( Θ = 0.005) to near saturated condition ( Θ = 0.995), and the prior values are plotted as a blue band. The ranges of log   10 h and log   10 K under three saturation conditions ( Θ = 0.2, 0.5, 0.8) are shown in Table 5. The soil in the study area had coarse texture, and the effective saturation mostly ranged between 0.2 and 0.5.
In Figure 8, the ensemble of posterior SWCC is located in the lower part of the prior, meanwhile the posterior HCF is located in the upper part of the prior. This phenomenon can also be found in the posterior and prior value range of log   10 h and log   10 K in Table 5. For example, Θ = 0.2, the prior range of log   10 h was from 1.296 to 7.211 and the posterior range reduced from 1.350~1.607, which indicated a relatively weaker water storage capability of posterior parameters than the prior. Besides, under the low saturation condition, the posterior range of log   10 K was reduced from −3.216 to −2.509 in comparison with the prior range (−8.435~−2.383). The value ranges of posterior parameters were consistently reduced in comparison with the prior, which indicated the DE-MC reduced the uncertainties in the soil hydraulic properties, and meanwhile described a relatively coarser soil texture in the posterior soil hydraulic parameters than the prior ranges.
The simulated and observed values of soil moisture content are plotted in Figure 9. It can be seen that the agreement between simulation and measurement may be varied at different stages. The rainfall was the same with the synthetic numerical experiment, and simulations can also be evaluated for three different stages: 1st~13th, 14th~22nd, 23rd~30th according to the characteristics of rainfall.
The defined initial condition of soil moisture was 0.1 to ensure a robust numerical simulation. However, the initial soil moisture was overestimated in comparison with the measurement. Besides, a consistent overestimation of peak values can also be found on 4 August, the ensemble of prediction was in a range between 0.202~0.206, whereas the measured peak soil moisture only reached 0.121. However, the simulated soil moisture well agreed with the measurement from 6 August to 13 August, meaning the soil moisture dynamics during the drainage period was correctly simulated.
During the second stage (14 and 23 August), the simulated soil moisture also well agreed with the measurement during the drainage period, whereas a slight overestimation was in the estimated peak soil moisture. For example, on 16 August, the simulated peak soil moisture was 0.145, which was slightly larger than the true value (0.102). The agreement between simulation and measurement had a reverse pattern during the third stage: the measured peak soil moisture under the three rain pulses was well simulated, whereas the simulated soil moisture during the drainage period showed slightly underestimations.
The difference between an ensemble of simulated soil moisture and measurement in the real case numerical experiment was larger than the synthetical numerical experiment. Larger errors in the real case study may be caused by multiple reasons, e.g., the errors in measured rainfall, neglection of evaporation, and the heterogeneous soil hydraulic properties in natural soils. The overall RMSE θ was from 0.025 to 0.026 within an acceptable range. The overall satisfying performance in the ensemble of simulated soil moisture dynamics indicated that the proposed DE-MC approach can also be implemented to real soil to ensure a reliable simulation of soil hydrological processes under transient rainfall.

4. Conclusions

The DE-MC was integrated with the numerical scheme of the Darcy–Richards equation to automatically select soil hydraulic parameters for a better quantification of soil hydrological processes. The synthetic numerical experiment compared the performance of the effectiveness of DE-MC (with 20 chains and 80 chains) with MCMC (with 1 chain) in finding pre-defined true soil hydraulic parameters in the van Genuchten model. The MCMC approach with one chain was unable to obtain a posterior PDF of soil hydraulic parameters, but only provided one parameter set that provided a prediction of soil moisture dynamics. The soil hydraulic parameters optimized with DE-MC provided multiple choices to correctly express predefined SWCC and HCF, and provided the posterior PDF of each parameter.
In the synthetic numerical experiment, the soil hydraulic parameters optimized with DE-MC indicated a clear equifinality phenomenon, which referred to the different parameter sets performed equally well in modeling soil moisture dynamics. Moreover, the ensemble of SWCC and HCF exactly converged to the predefined true value. Presumably, the compensation effect may exist in soil hydraulic parameters, e.g., an overestimation of n combined with an underestimation of α may bring approximately the same SWCC and HCF. Considering the equifinality phenomenon did not affect the performance of simulation soil moisture dynamics, the DE-MC can be effective in optimizing soil hydraulic parameters.
The real case application of DE-MC with 20 chains to in situ measured soil moisture content in the landslide deposit indicated similar results. Through the comparison of the prior and posterior PDF of soil hydraulic parameters, the DE-MC can significantly reduce the uncertainty of soil hydraulic properties. The relationship of SWCC and HCF described with the ensemble of posterior soil hydraulic parameters converged. Overall, the implementation of the DE-MC algorithm to obtain the posterior parameters of the van Genuchten model could effectively improve the simulation accuracy and reliability of the soil moisture content. It is recommended to integrate the DE-MC approach with the unsaturated soil hydrological model to support various interdisciplinary studies that are relevant to the soil moisture dynamics, e.g., early-warning of landslide disasters, contamination transport in landfills, agricultural water management, ecohydrology under climate change, etc.

Author Contributions

Conceptualization, W.S. and H.Y.; methodology, W.S. and Y.S.; software, S.C.; validation, S.C., H.Y. and W.S.; formal analysis, S.C. and W.S.; investigation, H.Y.; resources, Z.Y.; data curation, Z.Y.; writing—original draft preparation, S.C.; writing—review and editing, Y.S. and W.Y.; visualization, L.W.; supervision, S.L.; project administration, G.K.; funding acquisition, W.S. All authors have read and agreed to the published version of the manuscript.

Funding

This research was funded by The National Natural Scientific Foundation of China, grant number 41901076, 41807286 and 51909121; IWHR Research and Development Support Program, grant number JZ0199A032021, GY2205; Fundamental Research Project of Science and Technology Department of Qinghai Province, grant number 2023-ZJ-705. The APC was funded by it.

Data Availability Statement

Not applicable.

Acknowledgments

In this section, you can acknowledge any support given which is not covered by the author contribution or funding sections. This may include administrative and technical support, or donations in kind (e.g., materials used for experiments).

Conflicts of Interest

The authors declare no conflict of interest. The funders had no role in the design of the study; in the collection, analyses, or interpretation of data; in the writing of the manuscript; or in the decision to publish the results.

References

  1. Zhang, X.; Zhao, W.; Wang, L.; Liu, Y.; Liu, Y.; Feng, Q. Relationship between soil water content and soil particle size on typical slopes of the loess plateau during a drought year. Sci. Total Environ. 2019, 648, 943–954. [Google Scholar] [CrossRef] [PubMed] [Green Version]
  2. Baum, R.L.; Godt, J.W.; Savage, W.Z. Estimating the timing and location of shallow rainfall-induced landslides using a model for transient, unsaturated infiltration. J. Geophys. Res. Earth Surf. 2010, 115, F03013. [Google Scholar] [CrossRef]
  3. Sidle, R.C.; Bogaard, T.A. Dynamic earth system and ecological controls of rainfall-initiated landslides. Earth-Sci. Rev. 2016, 159, 275–291. [Google Scholar] [CrossRef]
  4. Liu, X.; Wang, Y. Bayesian selection of slope hydraulic model and identification of model parameters using monitoring data and subset simulation. Comput. Geotech. 2021, 139, 104428. [Google Scholar] [CrossRef]
  5. Yang, Z.; Wang, L.; Qiao, J.; Uchimura, T.; Wang, L. Application and verification of a multivariate real-time early warning method for rainfall-induced landslides: Implication for evolution of landslide-generated debris flows. Landslides 2020, 17, 2409–2419. [Google Scholar] [CrossRef] [Green Version]
  6. Larsen, M.C. Rainfall-triggered landslides, anthropogenic hazards, and mitigation strategies. Adv. Geosci. 2008, 14, 147–153. [Google Scholar] [CrossRef] [Green Version]
  7. Uyeturk, C.E.; Huvaj, N.; Bayraktaroglu, H.; Huseyinpasaoglu, M. Geotechnical characteristics of residual soils in rainfall-triggered landslides in Rize, Turkey. Eng. Geol. 2020, 264, 105318. [Google Scholar] [CrossRef]
  8. Görüm, T.; Fidan, S. Spatiotemporal variations of fatal landslides in Turkey. Landslides 2021, 18, 1691–1705. [Google Scholar] [CrossRef]
  9. Troncone, A.; Pugliese, L.; Conte, E. A simplified analytical method to predict shallow landslides induced by rainfall in unsaturated soils. Water 2022, 14, 3180. [Google Scholar] [CrossRef]
  10. Troncone, A.; Pugliese, L.; Conte, E. Rainfall threshold for shallow landslide triggering due to rising water table. Water 2022, 14, 2966. [Google Scholar] [CrossRef]
  11. Shao, W.; Yang, Z.; Ni, J.; Su, Y.; Nie, W.; Ma, X. Comparison of single- and dual-permeability models in simulating the unsaturated hydro-mechanical behavior in a rainfall-triggered landslide. Landslides 2018, 15, 2449–2464. [Google Scholar] [CrossRef]
  12. Hinds, E.S.; Lu, N.; Mirus, B.B.; Godt, J.W.; Wayllace, A. Evaluation of techniques for mitigating snowmelt infiltration-induced landsliding in a highway embankment. Eng. Geol. 2021, 291, 106240. [Google Scholar] [CrossRef]
  13. Lewis, R.W.; Ghafouri, H.R. A novel finite element double porosity model for multiphase flow through deformable fractured porous media. Int. J. Numer. Anal. Methods Geomech. 1997, 21, 789–816. [Google Scholar] [CrossRef]
  14. Chiu, C.F.; Yan, W.M.; Yuen, K.-V. Reliability analysis of soil–water characteristics curve and its application to slope stability analysis. Eng. Geol. 2012, 135–136, 83–91. [Google Scholar] [CrossRef]
  15. Zhai, Q.; Rahardjo, H.; Satyanaga, A. Effects of variability of unsaturated hydraulic properties on stability of residual soil slopes. In The Unsaturated Soil Mechanics-from Theory to Practice, Proceedings of the 6th Asia Pacific Conference on Unsaturated Soils, Guilin, China, 23–26 October 2015; CRC Press/Balkema: Boca Raton, FL, USA, 2015; pp. 401–406. [Google Scholar]
  16. Chirico, G.B.; Medina, H.; Romano, N. Uncertainty in predicting soil hydraulic properties at the hillslope scale with indirect methods. J. Hydrol. 2007, 334, 405–422. [Google Scholar] [CrossRef]
  17. Dong, J.; Steele-Dunne, S.C.; Ochsner, T.E.; van de Giesen, N. Determining soil moisture and soil properties in vegetated areas by assimilating soil temperatures. Water Resour. Res. 2016, 52, 4280–4300. [Google Scholar] [CrossRef] [Green Version]
  18. Šimůnek, J.; Angulo-Jaramillo, R.; Schaap, M.G.; Vandervaere, J.-P.; van Genuchten, M.T. Using an inverse method to estimate the hydraulic properties of crusted soils from tension-disc infiltrometer data. Geoderma 1998, 86, 61–81. [Google Scholar] [CrossRef]
  19. Zhai, Q.; Rahardjo, H.; Satyanaga, A.; Zhu, Y.; Dai, G.; Zhao, X. Estimation of wetting hydraulic conductivity function for unsaturated sandy soil. Eng. Geol. 2021, 285, 106034. [Google Scholar] [CrossRef]
  20. Ma, C.; Tang, L.; Chang, W.; Jaffar, M.T.; Zhang, J.; Li, X.; Chang, Q.; Fan, J. Effect of shelterbelt construction on soil water characteristic curves in an extreme arid shifting desert. Water 2022, 14, 1803. [Google Scholar] [CrossRef]
  21. Minasny, B.; Field, D.J. Estimating soil hydraulic properties and their uncertainty: The use of stochastic simulation in the inverse modelling of the evaporation method. Geoderma 2005, 126, 277–290. [Google Scholar] [CrossRef]
  22. Scharnagl, B.; Iden, S.C.; Durner, W.; Vereecken, H.; Herbst, M. Inverse modelling of in situ soil water dynamics: Accounting for heteroscedastic, autocorrelated, and non-gaussian distributed residuals. Hydrol. Earth Syst. Sci. Discuss. 2015, 12, 2155–2199. [Google Scholar]
  23. Ines, A.V.M.; Droogers, P. Inverse modelling in estimating soil hydraulic functions: A genetic algorithm approach. Hydrol. Earth Syst. Sci. 2002, 6, 49–66. [Google Scholar] [CrossRef] [Green Version]
  24. Eberhart, R.; Kennedy, J. A new optimizer using particle swarm theory. In Proceedings of the Sixth International Symposium on Micro Machine and Human Science (MHS’95), Nagoya, Japan, 4–6 October 1995; IEEE: Piscataway, NJ, USA, 1995; pp. 39–43. [Google Scholar]
  25. Dai, Y.; Shangguan, W.; Duan, Q.; Liu, B.; Niu, G. Development of a China dataset of soil hydraulic parameters using pedotransfer functions for land surface modeling. J. Hydrometeorol. 2013, 14, 869–887. [Google Scholar] [CrossRef] [Green Version]
  26. Beven, K.; Freer, J. Equifinality, data assimilation, and uncertainty estimation in mechanistic modelling of complex environmental systems using the GLUE methodology. J. Hydrol. 2001, 249, 11–29. [Google Scholar] [CrossRef]
  27. Candela, A.; Noto, L.V.; Aronica, G. Influence of surface roughness in hydrological response of semiarid catchments. J. Hydrol. 2005, 313, 119–131. [Google Scholar] [CrossRef]
  28. Seifi, A.; Ehteram, M.; Nayebloei, F.; Soroush, F.; Gharabaghi, B.; Torabi Haghighi, A. GLUE uncertainty analysis of hybrid models for predicting hourly soil temperature and application wavelet coherence analysis for correlation with meteorological variables. Soft Comput. 2021, 25, 10723–10748. [Google Scholar] [CrossRef]
  29. Zhang, D.; Beven, K.; Mermoud, A. A comparison of non-linear least square and GLUE for model calibration and uncertainty estimation for pesticide transport in soils. Adv. Water Resour. 2006, 29, 1924–1933. [Google Scholar] [CrossRef]
  30. Vrugt, J.A.; ter Braak, C.J.F.; Clark, M.P.; Hyman, J.M.; Robinson, B.A. Treatment of input uncertainty in hydrologic modeling: Doing hydrology backward with Markov Chain Monte Carlo simulation. Water Resour. Res. 2008, 44, W00B09. [Google Scholar] [CrossRef] [Green Version]
  31. Liang, F.; Wong, W.H. Real-parameter evolutionary Monte Carlo with applications to Bayesian mixture models. J. Am. Stat. Assoc. 2001, 96, 653–666. [Google Scholar] [CrossRef]
  32. Du, X.; Du, C.; Radolinski, J.; Wang, Q.; Jian, J. Metropolis-hastings Markov Chain Monte Carlo approach to simulate van genuchten model parameters for soil water retention curve. Water 2022, 14, 1968. [Google Scholar] [CrossRef]
  33. Storn, R.; Price, K. Differential evolution—A simple and efficient heuristic for global optimization over continuous spaces. J. Glob. Optim. 1997, 11, 341–359. [Google Scholar] [CrossRef]
  34. Liu, W.; Luo, X.; Huang, F.; Fu, M. Uncertainty of the soil–water characteristic curve and its effects on slope seepage and stability analysis under conditions of rainfall using the Markov Chain Monte Carlo method. Water 2017, 9, 758. [Google Scholar] [CrossRef] [Green Version]
  35. Braak, C.J.F.T. A Markov Chain Monte Carlo version of the genetic algorithm differential evolution: Easy Bayesian computing for real parameter spaces. Stat. Comput. 2006, 16, 239–249. [Google Scholar] [CrossRef]
  36. Ter Braak, C.J.F.; Vrugt, J.A. Differential Evolution Markov Chain with snooker updater and fewer chains. Stat. Comput. 2008, 18, 435–446. [Google Scholar] [CrossRef] [Green Version]
  37. Smith, T.J.; Marshall, L.A. Bayesian methods in hydrologic modeling: A study of recent advancements in Markov Chain Monte Carlo techniques. Water Resour. Res. 2008, 44, W00B05. [Google Scholar] [CrossRef] [Green Version]
  38. Carsel, R.F.; Parrish, R.S.; Jones, R.L.; Hanse, J.L.; Lamb, R.L. Characterizing the uncertainty of pesticide leaching in agricultural soils. J. Contam. Hydrol. 1988, 2, 111–124. [Google Scholar] [CrossRef]
  39. Van Genuchten, M.T. A closed-form equation for predicting the hydraulic conductivity of unsaturated soils. Soil Sci. Soc. Am. J. 1980, 44, 892–898. [Google Scholar] [CrossRef]
Figure 1. Location of the in situ monitoring site of the landslide in Yindongzi valley, Dujiangyan Country, Sichuan Province, China.
Water 14 03693 g001
Figure 2. NSE of each iteration step in synthetic experiment: (a) DE-MC 20 chains; (b) DE-MC 80 chains; (c) MCMC 1 chain.
Water 14 03693 g002
Figure 3. Comparison of the prior and posterior PDF of the parameters with the true values (black dotted line denotes true value).
Water 14 03693 g003
Figure 4. The SWCC and HCF of synthetic examples and true values.
Water 14 03693 g004
Figure 5. Ensemble of simulated soil moisture content (red lines) in comparison with true values (black round dots).
Water 14 03693 g005
Figure 6. NSE of each iteration step with DE-MC 20 chains for real case study.
Water 14 03693 g006
Figure 7. Comparison of the prior and posterior PDF of the parameters.
Water 14 03693 g007
Figure 8. SWCC and HCF of real case example.
Water 14 03693 g008
Figure 9. Comparison of calculated and measured soil moisture content values.
Water 14 03693 g009
Table 1. Prior ranges of soil hydraulic parameters.
ParameterSynthetic ExperimentReal Case Simulation
Prior Parameter RangesTruePrior Parameter Ranges
θ r   m 3   m 3 0.015~0.0250.0200.015~0.025
θ s   m 3   m 3 0.380~0.5000.4170.350~0.50
α   m 1 13.0~14.513.813.0~14.5
n   1.000~2.001.5921.000~2.500
K s   m   day - 1 4.50~5.505.044.50~5.50
Table 2. Mean values and standard deviations of the prior and posterior PDF of the parameters.
ParameterMean ValueStandard Deviation
PriorPosteriorPriorPosterior
DE-MC
20 Chains
DE-MC
80 Chains
MCMC
1 Chain
DE-MC
20 Chains
DE-MC
80 Chains
MCMC
1 Chain
θ r   m 3   m 3 0.0200.0200.0220.0220.0030.0030.003-
θ s   m 3   m 3 0.440.430.4510.3890.0390.0200.022-
α   m 3   m 3 13.7513.81414.18914.410.4760.4130.264-
n   1.751.6041.6451.5870.4370.0560.048-
K s m   day 1 5.005.0824.8744.5460.2930.3490.304-
Table 3. The ranges of SWCC and HCF at specific saturated degrees.
Saturated DegreeTrueDE-MC
20 Chains
DE-MC
80 Chains
MCMC
log   10 h Θ = 0.22.0391.854~2.3821.803~2.4612.039
Θ = 0.51.3241.251~1.4821.210~1.5241.324
Θ = 0.80.8080.783~0.8710.756~0.8950.808
log   10 K Θ = 0.2−4.268−5.110~−3.762−5.284~−3.723−4.365
Θ = 0.5−1.884−2.345~−1.593−2.445~−1.576−1.957
Θ = 0.8−0.531−0.792~−0.357−0.855~−0.349−0.592
Table 4. Mean values and standard deviations of the prior and posterior soil hydraulic parameters.
ParameterMean ValueStandard Deviation
PriorPosteriorPriorPosterior
θ r   m 3   m 3 0.0210.0230.0030.002
θ s   m 3   m 3 0.4370.3910.0350.016
α   m 1 13.72113.5760.4340.451
n   1.9132.2090.4610.101
K s   m   day - 1 5.0455.2960.2880.169
Table 5. The ranges of logarithmic transformed pore water pressure head and hydraulic conductivity in the ensemble prediction of SWCC and HCF at specific saturated degrees.
Saturated DegreePriorDE-MC
20 Chains
log   10 h Θ = 0.21.296~7.2111.350~1.607
Θ = 0.50.975~3.5931.011~1.118
Θ = 0.80.701~1.6960.711~0.751
log   10 K Θ = 0.2−8.435~−2.383−3.216~−2.509
Θ = 0.5−4.061~−0.802−1.296~−0.888
Θ = 0.8−1.707~−0.093−0.199~0.044
Publisher’s Note: MDPI stays neutral with regard to jurisdictional claims in published maps and institutional affiliations.

