Comparison between Quantile Regression Technique and Generalised Additive Model for Regional Flood Frequency Analysis: A Case Study for Victoria, Australia
Abstract
:1. Introduction
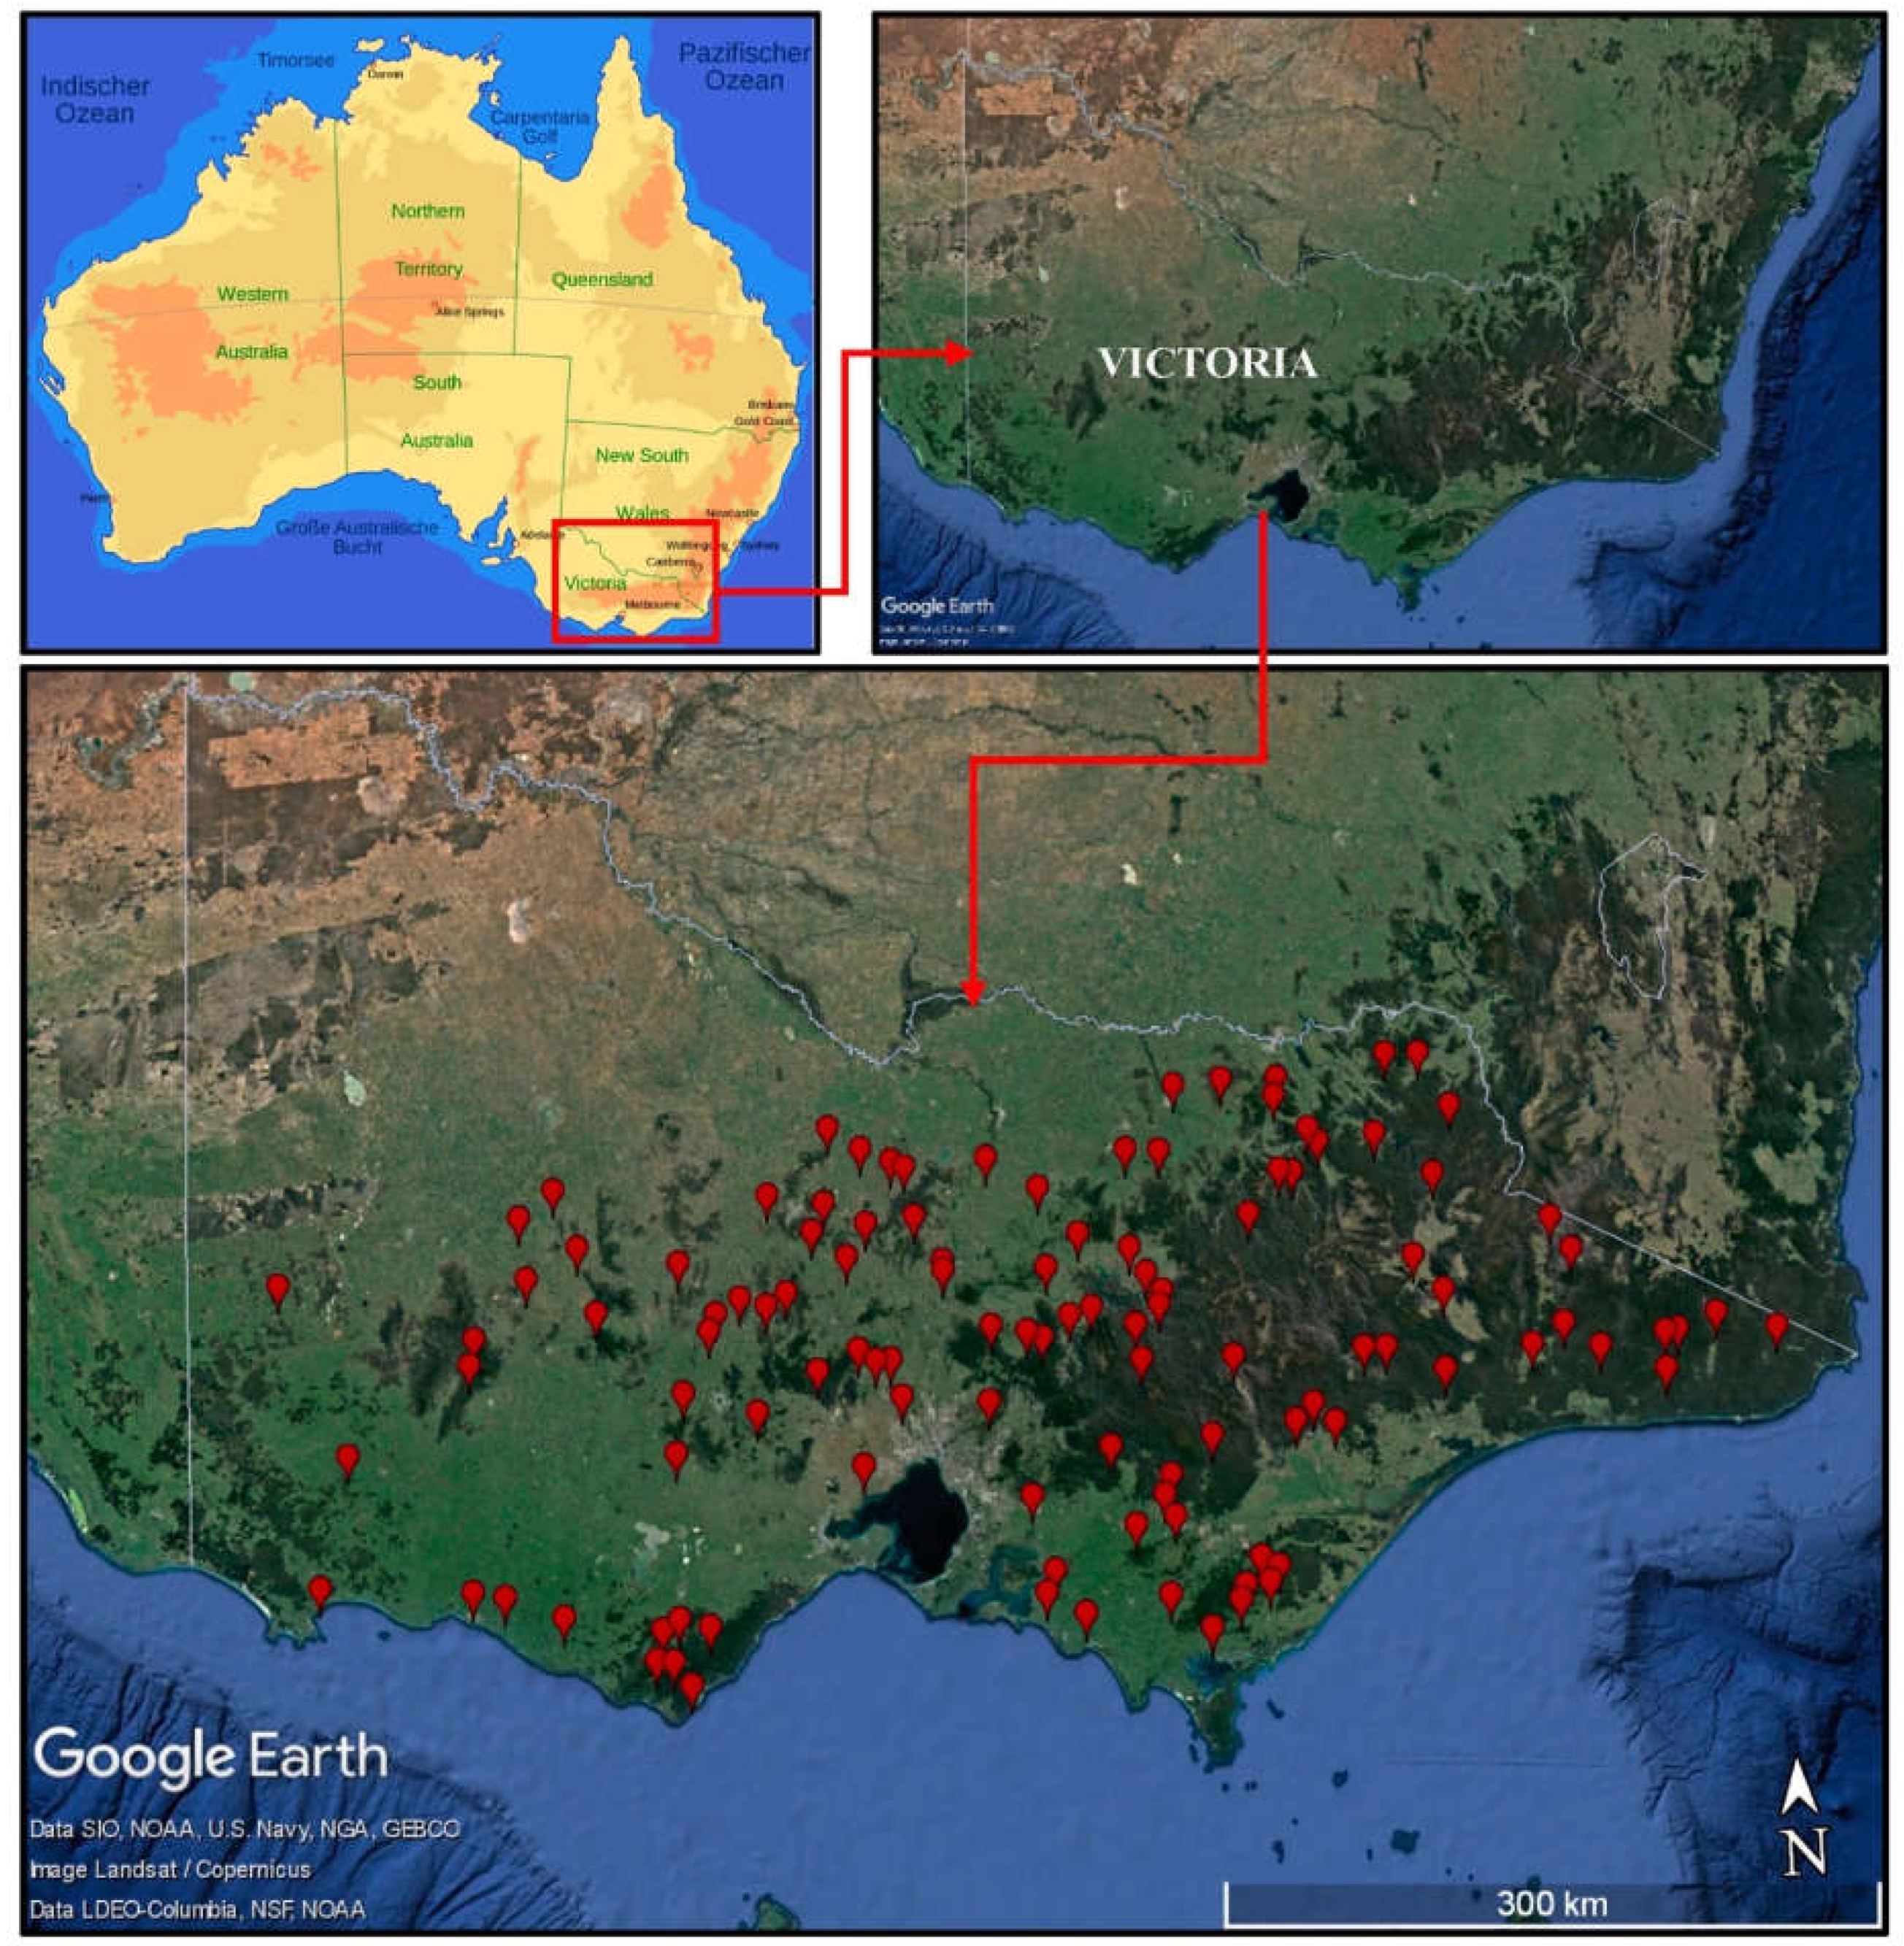
2. Study Area and Data
3. Methodology
3.1. Quantile Regression Technique (QRT)
3.2. GAM
3.3. Cluster Analysis
3.4. Validation
4. Results
5. Discussion
6. Conclusions
Author Contributions
Funding
Institutional Review Board Statement
Informed Consent Statement
Data Availability Statement
Conflicts of Interest
References
- Micevski, T.; Hackelbusch, A.; Haddad, K.; Kuczera, G.; Rahman, A. Regionalisation of the Parameters of the Log-Pearson 3 Distribution: A Case Study for New South Wales, Australia. Hydrol. Process. 2015, 29, 250–260. [Google Scholar] [CrossRef]
- Chebana, F.; Charron, C.; Ouarda, T.B.M.J.; Martel, B. Regional Frequency Analysis at Ungauged Sites with the Generalized Additive Model. J. Hydrometeorol. 2014, 15, 2418–2428. [Google Scholar] [CrossRef] [Green Version]
- Aziz, K.; Rai, S.; Rahman, A. Design Flood Estimation in Ungauged Catchments Using Genetic Algorithm-Based Artificial Neural Network (GAANN) Technique for Australia. Nat. Hazards 2015, 77, 805–821. [Google Scholar] [CrossRef]
- Alobaidi, M.H.; Marpu, P.R.; Ouarda, T.B.M.J.; Chebana, F. Regional Frequency Analysis at Ungauged Sites Using a Two-Stage Resampling Generalized Ensemble Framework. Adv. Water Resour. 2015, 84, 103–111. [Google Scholar] [CrossRef]
- Haddad, K.; Rahman, A. Regional Flood Frequency Analysis: Evaluation of Regions in Cluster Space Using Support Vector Regression. Nat. Hazards 2020, 102, 489–517. [Google Scholar] [CrossRef]
- Hastie, T.; Tibshirani, R. Generalized Additive Models: Some Applications. J. Am. Stat. Assoc. 1987, 82, 371. [Google Scholar] [CrossRef]
- Wood, S.N. Generalized Additive Models; Chapman and Hall/CRC: Boca Raton, FL, USA, 2017. [Google Scholar] [CrossRef] [Green Version]
- Morlini, I. On Multicollinearity and Concurvity in Some Nonlinear Multivariate Models. Stat. Methods Appl. 2006, 15, 3–26. [Google Scholar] [CrossRef]
- Schindeler, S.K.; Muscatello, D.J.; Ferson, M.J.; Rogers, K.D.; Grant, P.; Churches, T. Evaluation of Alternative Respiratory Syndromes for Specific Syndromic Surveillance of Influenza and Respiratory Syncytial Virus: A Time Series Analysis. BMC Infect. Dis. 2009, 9, 190. [Google Scholar] [CrossRef] [PubMed] [Green Version]
- Wen, L.; Rogers, K.; Ling, J.; Saintilan, N. The Impacts of River Regulation and Water Diversion on the Hydrological Drought Characteristics in the Lower Murrumbidgee River, Australia. J. Hydrol. 2011, 405, 382–391. [Google Scholar] [CrossRef]
- Wood, S.N.; Augustin, N.H. GAMs with Integrated Model Selection Using Penalized Regression Splines and Applications to Environmental Modelling. Ecol. Modell. 2002, 157, 157–177. [Google Scholar] [CrossRef] [Green Version]
- Ouarda, T.B.M.J.; Charron, C.; Marpu, P.R.; Chebana, F. The Generalized Additive Model for the Assessment of the Direct, Diffuse, and Global Solar Irradiances Using SEVIRI Images, With Application to the UAE. IEEE J. Sel. Top. Appl. Earth Obs. Remote Sens. 2016, 9, 1553–1566. [Google Scholar] [CrossRef] [Green Version]
- Bayentin, L.; El Adlouni, S.; Ouarda, T.B.M.J.; Gosselin, P.; Doyon, B.; Chebana, F. Spatial Variability of Climate Effects on Ischemic Heart Disease Hospitalization Rates for the Period 1989-2006 in Quebec, Canada. Int. J. Health Geogr. 2010, 9, 5. [Google Scholar] [CrossRef] [PubMed] [Green Version]
- Clifford, S.; Low Choy, S.; Hussein, T.; Mengersen, K.; Morawska, L. Using the Generalised Additive Model to Model the Particle Number Count of Ultrafine Particles. Atmos. Environ. 2011, 45, 5934–5945. [Google Scholar] [CrossRef]
- Guan, B.; Hsu, H.; Wey, T.; Tsao, L. Modeling Monthly Mean Temperatures for the Mountain Regions of Taiwan by Generalized Additive Models. Agric. For. Meteorol. 2009, 149, 281–290. [Google Scholar] [CrossRef]
- Haddad, K.; Vizakos, N. Air Quality Pollutants and Their Relationship with Meteorological Variables in Four Suburbs of Greater Sydney, Australia. Air Qual. Atmos. Health 2021, 14, 55–67. [Google Scholar] [CrossRef]
- Tisseuil, C.; Vrac, M.; Lek, S.; Wade, A.J. Statistical Downscaling of River Flows. J. Hydrol. 2010, 385, 279–291. [Google Scholar] [CrossRef]
- Morton, R.; Henderson, B.L. Estimation of Nonlinear Trends in Water Quality: An Improved Approach Using Generalized Additive Models. Water Resour. Res. 2008, 44. [Google Scholar] [CrossRef]
- Asquith, W.H.; Herrmann, G.R.; Cleveland, T.G. Generalized Additive Regression Models of Discharge and Mean Velocity Associated with Direct-Runoff Conditions in Texas: Utility of the U.S. Geological Survey Discharge Measurement Database. J. Hydrol. Eng. 2013, 18, 1331–1348. [Google Scholar] [CrossRef]
- Wang, Y.; Li, J.; Feng, P.; Hu, R. A Time-Dependent Drought Index for Non-Stationary Precipitation Series. Water Resour. Manag. 2015, 29, 5631–5647. [Google Scholar] [CrossRef]
- Garcia Galiano, S.G.; Olmos Gimenez, P.; Giraldo-Osorio, J.D. Assessing Nonstationary Spatial Patterns of Extreme Droughts from Long-Term High-Resolution Observational Dataset on a Semiarid Basin (Spain). Water 2015, 7, 5458–5473. [Google Scholar] [CrossRef] [Green Version]
- Shortridge, J.E.; Guikema, S.D.; Zaitchik, B.F. Empirical Streamflow Simulation for Water Resource Management in Data-Scarce Seasonal Watersheds. Hydrol. Earth Syst. Sci. Discuss. 2015, 12, 11083–11127. [Google Scholar] [CrossRef]
- Li, L.; Wu, K.; Jiang, E.; Yin, H.; Wang, Y.; Tian, S.; Dang, S. Evaluating Runoff-Sediment Relationship Variations Using Generalized Additive Models That Incorporate Reservoir Indices for Check Dams. Water Resour. Manag. 2021, 35, 3845–3860. [Google Scholar] [CrossRef]
- Rahman, A.; Charron, C.; Ouarda, T.B.M.J.; Chebana, F. Development of Regional Flood Frequency Analysis Techniques Using Generalized Additive Models for Australia. Stoch. Environ. Res. Risk Assess. 2018, 32, 123–139. [Google Scholar] [CrossRef]
- Rahman, A.S.; Khan, Z.; Rahman, A. Application of Independent Component Analysis in Regional Flood Frequency Analysis: Comparison between Quantile Regression and Parameter Regression Techniques. J. Hydrol. 2020, 581, 124372. [Google Scholar] [CrossRef]
- Haddad, K.; Rahman, A.; A Zaman, M.; Shrestha, S. Applicability of Monte Carlo Cross Validation Technique for Model Development and Validation Using Generalised Least Squares Regression. J. Hydrol. 2013, 482, 119–128. [Google Scholar] [CrossRef]
- Mohit Isfahani, P.; Modarres, R. The Generalized Additive Models for Non-Stationary Flood Frequency Analysis. Iran-Water Resour. Res. 2020, 16, 376–387. [Google Scholar]
- Msilini, A.; Charron, C.; Ouarda, T.B.M.J.; Masselot, P. Flood Frequency Analysis at Ungauged Catchments with the GAM and MARS Approaches in the Montreal Region, Canada. Can. Water Resour. J./Rev. Can. Ressour. Hydr. 2022, 47, 111–121. [Google Scholar] [CrossRef]
- Thomas, D.M.; Benson, M.A. Generalization of Streamflow Characteristics from Drainage-Basin Characteristics; Geological Survey Water-Supply Paper 1975; United States Government Printing Office: Washington, WA, USA, 1975.
- McCuen, R.H.; Leahy, R.B.; Johnson, P.A. Problems with Logarithmic Transformations in Regression. J. Hydraul. Eng. 1990, 116, 414–428. [Google Scholar] [CrossRef]
- Haddad, K.; Rahman, A. Regional Flood Frequency Analysis in Eastern Australia: Bayesian GLS Regression-Based Methods within Fixed Region and ROI Framework—Quantile Regression vs. Parameter Regression Technique. J. Hydrol. 2012, 430, 142–161. [Google Scholar] [CrossRef]
- Rahman, A.; Haddad, K.; Zaman, M.; Kuczera, G.; Weinmann, P.E. Design Flood Estimation in Ungauged Catchments: A Comparison between the Probabilistic Rational Method and Quantile Regression Technique for NSW. Aust. J. Water Resour. 2011, 14, 127–140. [Google Scholar] [CrossRef]
- Rahman, A.; Haddad, K.; Kuczera, G.; Weinmann, E. Regional Flood Methods. In Australian Rainfall & Runoff, Chapter 3, Book 3; Ball, J., Babister, M., Nathan, R., Weeks, B., Weinmann, E., Retallick, M., Testoni, I., Eds.; Commonwealth of Australia: Canberra, Australia, 2016. [Google Scholar]
- Rahman, A.; Haddad, K.; Haque, M.; Kuczera, G.; Weinmann, P.E. Australian Rainfall and Runoff Project 5: Regional Flood Methods: Stage 3 Report (No. P5/S3, p. 025); Technical Report; Geoscience Australia and the National Committee for Water Engineering: Symonston, Australia, 2015.
- Zalnezhad, A.; Rahman, A.; Nasiri, N.; Vafakhah, M.; Samali, B.; Ahamed, F. Comparing Performance of ANN and SVM Methods for Regional Flood Frequency Analysis in South-East Australia. Water 2022, 14, 3323. [Google Scholar] [CrossRef]
- Ali, S.; Rahman, A. Development of a Kriging Based Regional Flood Frequency Analysis Technique for South-East Australia, Natural Hazards. 2022. Available online: https://link.springer.com/article/10.1007/s11069-022-05488-4 (accessed on 6 November 2022).
| Variable | Unit | Notation | Min | Mean | Max | SD |
|---|---|---|---|---|---|---|
| Catchment area | km2 | area | 3 | 317.54 | 997 | 244.65 |
| Catchment shape factor | - | SF | 0.281 | 0.79 | 1.4341 | 0.22 |
| Mainstream slope | m/km | S1085 | 0.8 | 13.38 | 69.9 | 12.30 |
| Stream density | km/km2 | sden | 0.52 | 1.53 | 4.25 | 0.53 |
| Fraction of catchment covered by forest | - | forest | 0.01 | 0.59 | 1 | 0.35 |
| Rainfall intensity (6-h duration and 2-year ARI) | mm/h | I6,2 | 24.6 | 34.29 | 46.7 | 5.27 |
| Mean annual rainfall | mm | rain | 484.39 | 931.64 | 1760.81 | 319.01 |
| Mean annual potential evapotranspiration | mm | evap | 925.9 | 1035.47 | 1155.3 | 42.80 |
| Equation | Predictor Variables | Regression Coefficient (β) | Standard Error | Standard Error of Estimate (SEE) | R2 | D.F |
|---|---|---|---|---|---|---|
| log Q2 | (constant) | −2.42 | 0.52 | 0.22 | 0.69 | 110 |
| log (area) | 0.68 | 0.04 | ||||
| log (I6,2) | 1.48 | 0.33 | ||||
| log (sden) | 0.39 | 0.15 | ||||
| log Q5 | (constant) | −1.60 | 0.57 | 0.23 | 0.67 | 109 |
| log (area) | 0.68 | 0.05 | ||||
| log (I6,2) | 1.74 | 0.41 | ||||
| log (rain) | −0.29 | 0.19 | ||||
| log (sden) | 0.31 | 0.16 | ||||
| log Q10 | (constant) | −1.25 | 0.62 | 0.25 | 0.63 | 110 |
| log (area) | 0.66 | 0.05 | ||||
| log (I6,2) | 2.14 | 0.43 | ||||
| log (rain) | −0.53 | 0.20 | ||||
| log Q20 | (constant) | −1.00 | 0.66 | 0.27 | 0.61 | 110 |
| log (area) | 0.66 | 0.05 | ||||
| log (I6,2) | 2.30 | 0.46 | ||||
| log (rain) | −0.66 | 0.21 | ||||
| log Q50 | (constant) | −0.79 | 0.73 | 0.30 | 0.57 | 110 |
| log (area) | 0.66 | 0.06 | ||||
| log (I6,2) | 2.45 | 0.51 | ||||
| log (rain) | −0.76 | 0.23 | ||||
| log Q100 | (constant) | −0.70 | 0.78 | 0.32 | 0.53 | 110 |
| log (area) | 0.66 | 0.06 | ||||
| log (I6,2) | 2.54 | 0.54 | ||||
| log (rain) | −0.81 | 0.25 |
| Flood Quantile | Predictor Variables | Deviance Explained (%) | Generalized Cross Validation Statistic (GCV) | R2 | F Value |
|---|---|---|---|---|---|
| Q2 | area | 73.70 | 501.61 | 0.69 | 30.199 |
| I6,2 | 5.37 | ||||
| evap | 7.59 | ||||
| sden | 6.07 | ||||
| Q5 | area | 71.3 | 3201.90 | 0.66 | 26.69 |
| I6,2 | 4.898 | ||||
| rain | 3.073 | ||||
| evap | 6.278 | ||||
| sden | 4.492 | ||||
| Q10 | area | 67.60 | 8437.80 | 0.62 | 23.46 |
| I6,2 | 4.67 | ||||
| rain | 6.91 | ||||
| evap | 5.02 | ||||
| sden | 3.15 | ||||
| Q20 | area | 62.20 | 18974.00 | 0.56 | 17.39 |
| I6,2 | 4.41 | ||||
| rain | 8.95 | ||||
| evap | 3.99 | ||||
| Q50 | area | 56.20 | 45823.00 | 0.50 | 9.96 |
| I6,2 | 8.56 | ||||
| rain | 12.12 | ||||
| evap | 3.31 | ||||
| Q100 | area | 48.40 | 82994.00 | 0.44 | 17.32 |
| I6,2 | 11.53 | ||||
| rain | 10.87 | ||||
| evap | 2.46 |
| Flood Quantile | Combined Group | Group (A1) | Group (A2) | Group (B1) | Group (B2) | |||||
|---|---|---|---|---|---|---|---|---|---|---|
| log-log Linear Model | GAM | log-log Linear Model | GAM | log-log Linear Model | GAM | log-log Linear Model | GAM | log-log Linear Model | GAM | |
| Q2 | 0.69 | 0.69 | 0.74 | 0.83 | 0.69 | 0.75 | 0.78 | 0.90 | 0.65 | 0.712 |
| Q5 | 0.67 | 0.66 | 0.72 | 0.79 | 0.55 | 0.676 | 0.74 | 0.83 | 0.57 | 0.626 |
| Q10 | 0.63 | 0.62 | 0.70 | 0.73 | 0.48 | 0.554 | 0.71 | 0.78 | 0.48 | 0.506 |
| Q20 | 0.61 | 0.56 | 0.68 | 0.67 | 0.43 | 0.506 | 0.69 | 0.71 | 0.42 | 0.456 |
| Q50 | 0.57 | 0.50 | 0.65 | 0.58 | 0.32 | 0.437 | 0.65 | 0.60 | 0.39 | 0.322 |
| Q100 | 0.53 | 0.44 | 0.62 | 0.51 | 0.27 | 0.36 | 0.62 | 0.55 | 0.32 | 0.30 |
| Overall | 0.62 | 0.58 | 0.69 | 0.69 | 0.46 | 0.55 | 0.70 | 0.73 | 0.47 | 0.49 |
| Flood Quantile | Combined Group | Group (A1) | Group (A2) | Group (B1) | Group (B2) | |||||
|---|---|---|---|---|---|---|---|---|---|---|
| log-log Linear Model | GAM | log-log Linear Model | GAM | log-log Linear Model | GAM | log-log Linear Model | GAM | log-log Linear Model | GAM | |
| Q2 | 18.73 | 34.81 | 29.56 | 22.52 | 23.10 | 39.31 | 30.33 | 16.80 | 25.82 | 33.24 |
| Q5 | 32.88 | 33.88 | 28.60 | 33.10 | 34.69 | 41.46 | 28.20 | 28.92 | 31.97 | 41.11 |
| Q10 | 19.36 | 33.75 | 27.47 | 31.96 | 40.54 | 40.29 | 27.37 | 34.46 | 33.05 | 38.17 |
| Q20 | 34.51 | 34.05 | 30.74 | 39.53 | 43.02 | 42.35 | 29.37 | 42.47 | 36.69 | 45.82 |
| Q50 | 40.41 | 42.67 | 33.25 | 40.12 | 53.10 | 49.59 | 37.42 | 42.08 | 39.29 | 31.38 |
| Q100 | 40.99 | 49.09 | 37.05 | 53.38 | 59.94 | 49.37 | 37.00 | 45.90 | 42.63 | 39.04 |
| Overall | 31.15 | 38.04 | 31.11 | 36.77 | 42.40 | 43.73 | 31.61 | 35.10 | 34.91 | 38.13 |
| Flood Quantile | Combined | Group (A1) | Group (A2) | Group (B1) | Group (B2) | |||||
|---|---|---|---|---|---|---|---|---|---|---|
| log-log Linear Model | GAM | log-log Linear Model | GAM | log-log Linear Model | GAM | log-log Linear Model | GAM | log-log Linear Model | GAM | |
| Q2 | 1.03 | 1.07 | 1.04 | 1.01 | 1.00 | 1.13 | 1.01 | 1.05 | 1.04 | 1.10 |
| Q5 | 1.00 | 1.02 | 0.95 | 1.03 | 0.99 | 1.04 | 0.98 | 1.00 | 1.03 | 0.95 |
| Q10 | 0.97 | 1.04 | 0.94 | 1.06 | 0.98 | 0.83 | 0.96 | 1.02 | 0.92 | 1.04 |
| Q20 | 1.00 | 1.12 | 0.97 | 1.10 | 1.01 | 0.84 | 1.01 | 1.06 | 0.94 | 0.98 |
| Q50 | 0.98 | 1.12 | 1.02 | 1.16 | 0.95 | 0.86 | 1.05 | 1.14 | 0.94 | 0.98 |
| Q100 | 0.94 | 1.12 | 1.02 | 1.12 | 0.95 | 1.14 | 1.09 | 1.13 | 0.90 | 1.01 |
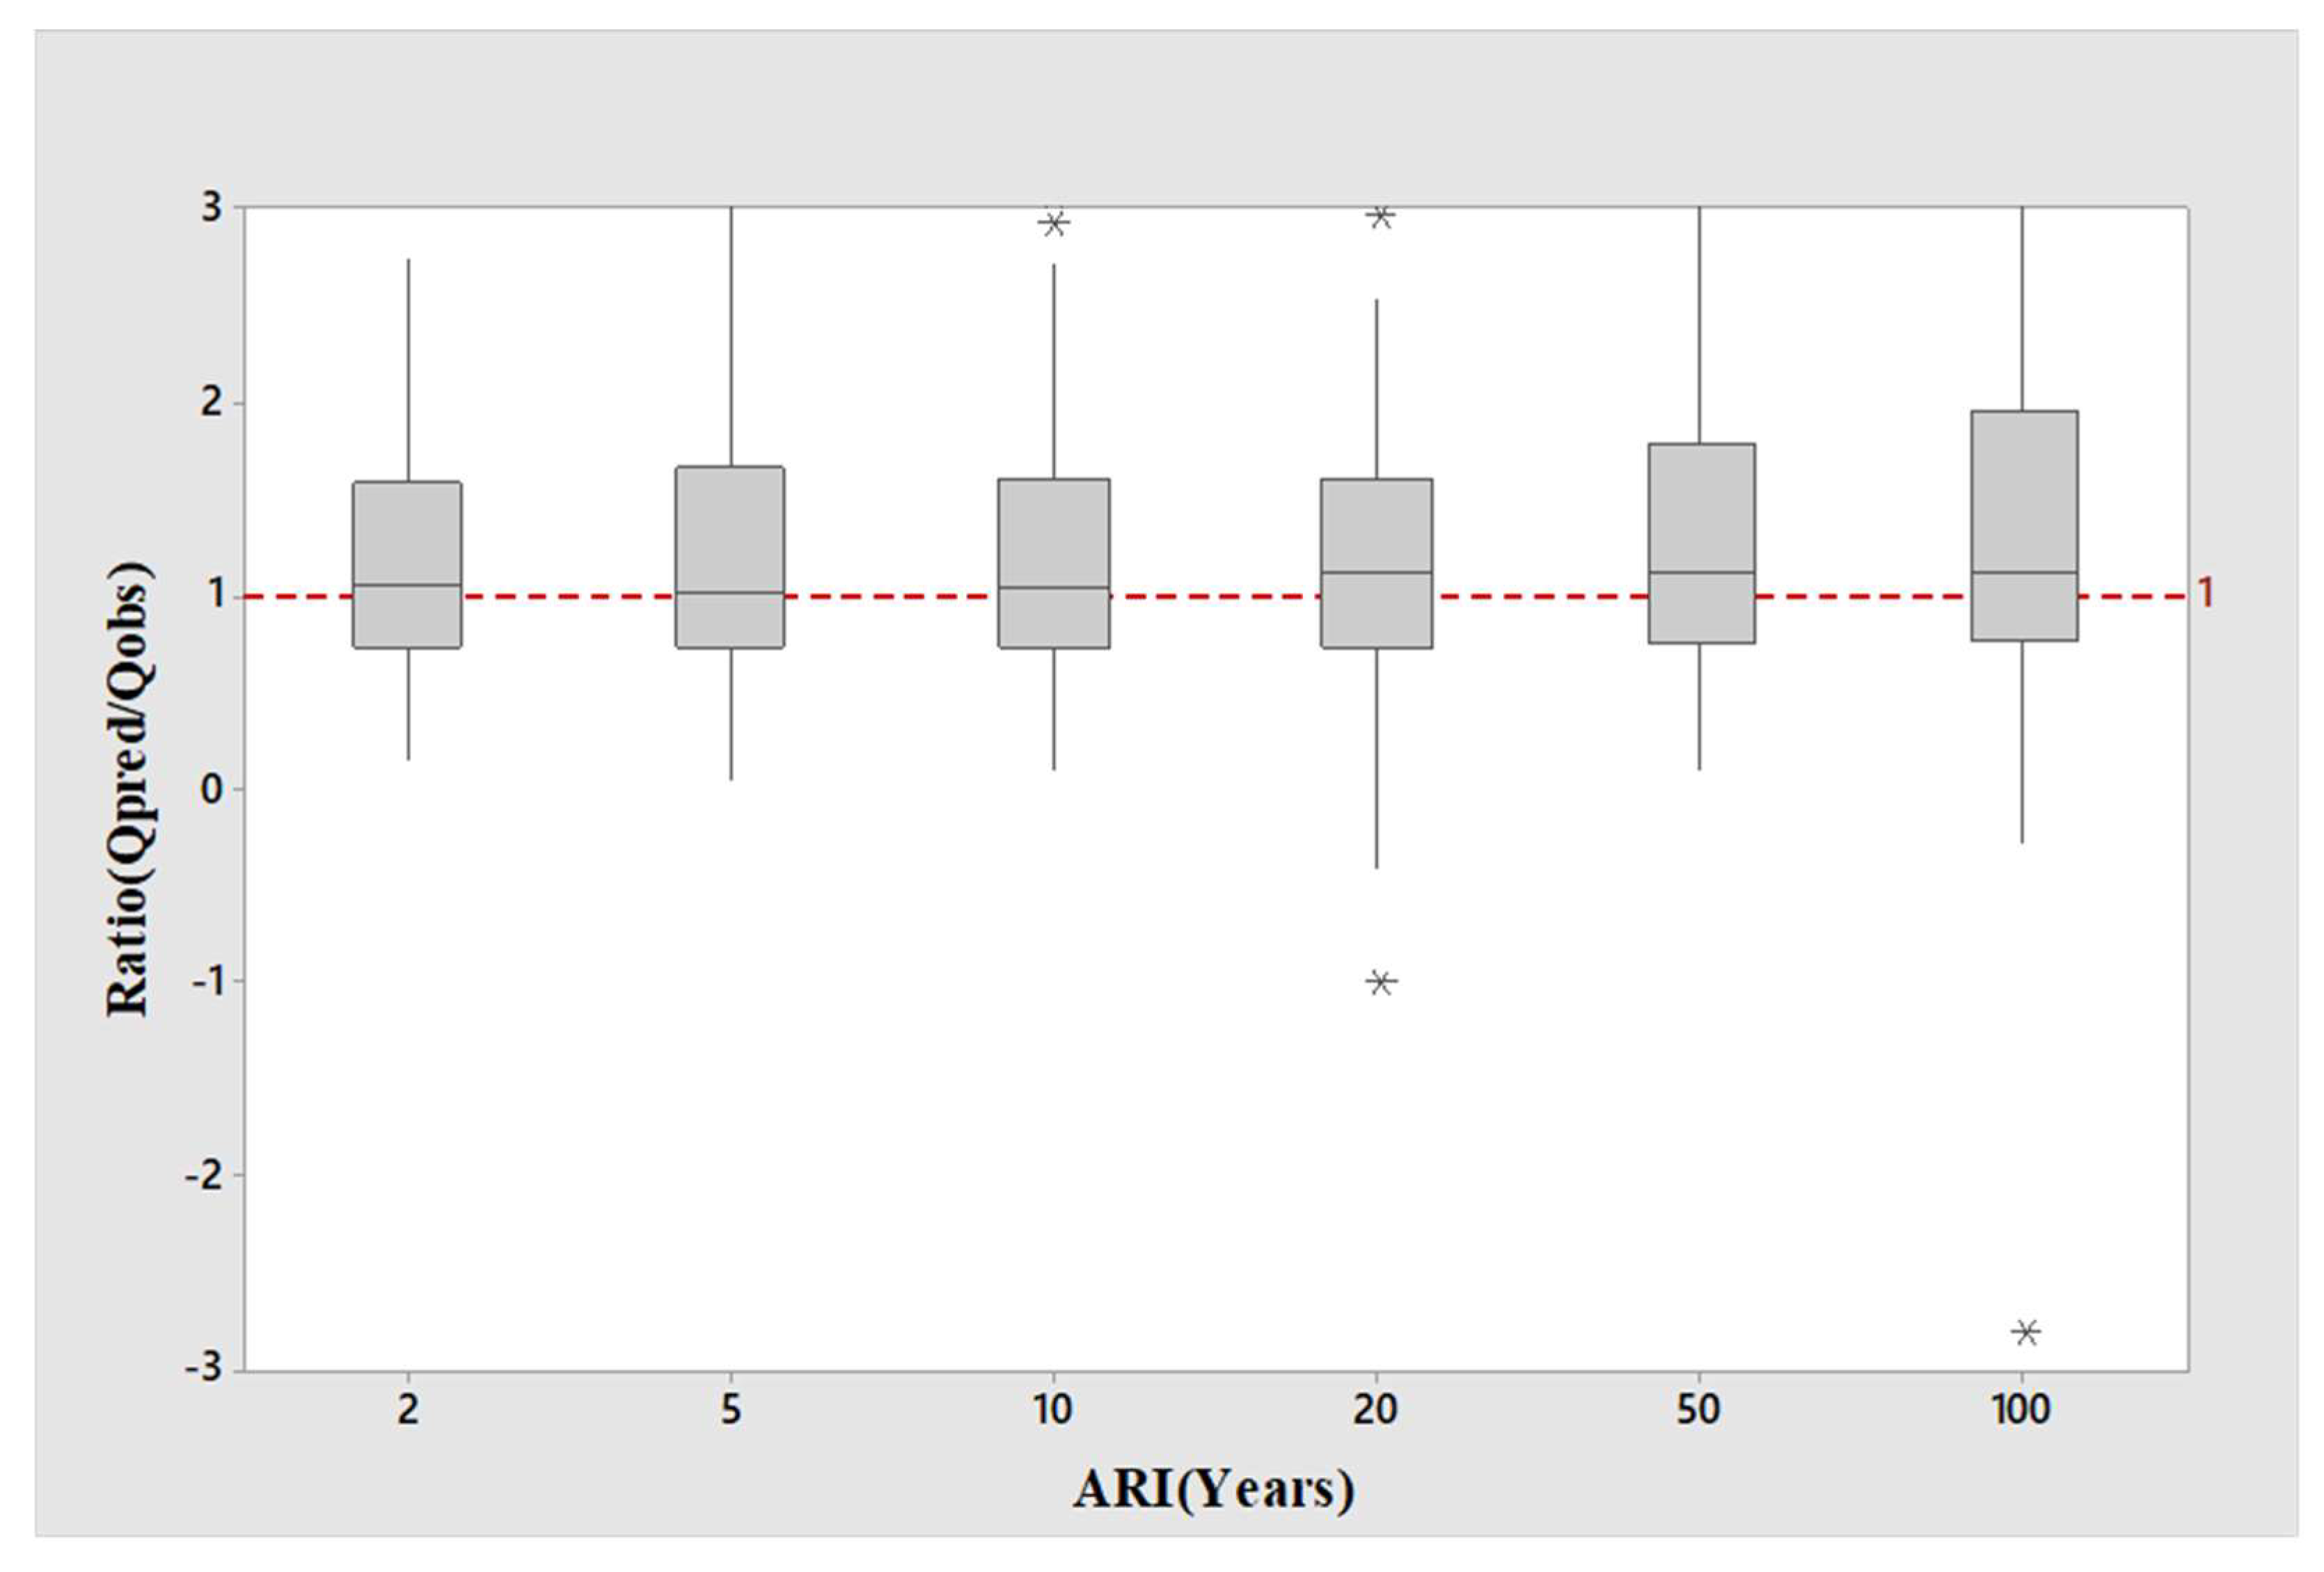
| Overall | 0.99 | 1.08 | 0.99 | 1.08 | 0.98 | 0.97 | 1.01 | 1.07 | 0.96 | 1.01 |
Publisher’s Note: MDPI stays neutral with regard to jurisdictional claims in published maps and institutional affiliations. |
© 2022 by the authors. Licensee MDPI, Basel, Switzerland. This article is an open access article distributed under the terms and conditions of the Creative Commons Attribution (CC BY) license (https://creativecommons.org/licenses/by/4.0/).
Share and Cite
Noor, F.; Laz, O.U.; Haddad, K.; Alim, M.A.; Rahman, A. Comparison between Quantile Regression Technique and Generalised Additive Model for Regional Flood Frequency Analysis: A Case Study for Victoria, Australia. Water 2022, 14, 3627. https://doi.org/10.3390/w14223627
Noor F, Laz OU, Haddad K, Alim MA, Rahman A. Comparison between Quantile Regression Technique and Generalised Additive Model for Regional Flood Frequency Analysis: A Case Study for Victoria, Australia. Water. 2022; 14(22):3627. https://doi.org/10.3390/w14223627
Chicago/Turabian StyleNoor, Farhana, Orpita U. Laz, Khaled Haddad, Mohammad A. Alim, and Ataur Rahman. 2022. "Comparison between Quantile Regression Technique and Generalised Additive Model for Regional Flood Frequency Analysis: A Case Study for Victoria, Australia" Water 14, no. 22: 3627. https://doi.org/10.3390/w14223627
APA StyleNoor, F., Laz, O. U., Haddad, K., Alim, M. A., & Rahman, A. (2022). Comparison between Quantile Regression Technique and Generalised Additive Model for Regional Flood Frequency Analysis: A Case Study for Victoria, Australia. Water, 14(22), 3627. https://doi.org/10.3390/w14223627


