Abstract
Eutrophication and algal blooms have sparked worldwide concern because of their widespread effects on water-dependent species. Harmful algal blooms can cause fatal effects to lesser flamingos (Phoeniconaias minor), obligatory filter feeders and vital bio-indicators in soda lakes. Thus, early detection of algal blooms and potential indicators in water quality is critical, but general tools are lacking in eastern African soda lakes. We monitored algal biomass changes and related water physico–chemical variables for 12 consecutive months in the lakes Big Momella and Rishateni in northern Tanzania. We used chlorophyll-a to measure algal biomass and quantified water physico–chemical variables that might influence algae growth. We also monitored lesser flamingo numbers to understand trends across the year and according to algal bloom occurrence. Algal biomass was strongly related to water nitrogen (r = 0.867; p < 0.001) and phosphorus (r = 0.832; p < 0.001). Monthly patterns showed significant differences in water quality and algal biomass (F = 277, p < 0.001) but not across sampling sites (F = 0.029, p = 0.971). Lesser flamingo numbers seemed to be related to algal biomass at Lake Big Momella (r = 0.828; p < 0.001) and shortly after algal biomass peaked high (i.e., March and April 2021), flamingo numbers declined. Lake Rishateni showed similar patterns. Our findings can provide a basis towards understanding the factors contributing to temporal changes in lesser flamingo abundance due to spatio–temporal water quality variations, which is important for optimising conservation efforts for the species in these unique Momella lakes.
1. Introduction
Eutrophication and algae blooms are widespread issues that have sparked worldwide concern because of their effects on water-dependent species, particularly specialists [1,2,3]. As applied in this study, an algal bloom refers to the rapid increase or accumulation of the algae population in lake systems [4,5]. Findings indicate that algal blooms can occur at any time in nutrient-enriched water bodies with calm surface waters if they have temperatures exceeding 20 °C, and can last for some days or weeks, depending on the prevalence of the influencing environmental factors [4,6]. Although both beneficial and harmful algae species exist [7,8], most algal blooms are harmful not only because they produce toxins but also because they create anoxic conditions, emit unpleasant scents, block light from reaching other organisms lower in the water column [4,9] and clog the filtration systems of filter feeders [10,11].
However, monitoring, controlling and managing algal blooms and understanding their related effects on water-dependent species has been a challenge because algal blooms affect these species in various ways [12,13,14]. Little is known about how spatial or temporal rapid increase in algal biomass might induce algal bloom occurrence and influence the presence of lesser flamingos. In eastern African soda lakes, research has focused on algal blooms, after they have caused devastating effects [15,16,17]. Still, little is known about the relationships between water nutrients, rapid increases in algal biomass and the possibility of algal bloom occurrence. Furthermore, little attention has been paid to quantifying how these blooms might relate to the presence of lesser flamingos.
The lesser flamingo (Phoeniconaias minor) is a water-dependent bird, itinerant and obligate algae filter feeder [10,11]. It feeds on Arthrospira fusiformis, a blue-green algae species abundant in shallow soda lakes and wetlands [10,11,18]. Otherwise, the birds will resort to diatoms when their preferred food falls below a certain threshold [18,19]. The birds forage in either a standing or swimming position or wading in shallow water or muddy areas [20]. In addition, the lesser flamingo predominates in eastern, southern and western Africa [21,22]. East Africa holds the largest lesser flamingo population, amounting to 1.5 to 2.5 million individuals, contributing to 75% of the global population [23,24,25].
The lesser flamingo is treasured because it is an important bio-indicator of ecosystem health and function [11,26]. However, due to rapid population decline and significant habitat loss caused by human-induced activities in recent years, the IUCN (2018) classed this species as near threatened [23,27,28]. The breeding season for the east African lesser flamingo local population is during the short rainy season, especially in October, with Lake Natron in Tanzania serving as the primary breeding area [20,22,29]. Furthermore, several collective behavioural displays help the species synchronise and reproduce once climate conditions, such as temperature, rainfall, and food availability, are favourable [30,31]. However, understanding factors influencing the lesser flamingos’ presence and temporal changes in the soda lakes outside the breeding season remain a major conservation challenge for the species.
The principal foraging requirement for this species is the blue-green algae A. fusiformis that grow in soda lakes under appropriate water chemistry [18,25]. However, harmful algal blooms negatively impact A. fusiformis’ performance, quantity, and the flamingo’s filter-feeding style and often can lead to the death of this species [15,17,32]. In addition, recent large-scale mortality incidences and temporal shifts in lesser flamingos in the east African soda lakes, particularly in Kenya and Tanzania, have raised concerns [15,16,17,32]. As a result, several studies addressed factors behind mortality and temporal population shifts, which found that phytoplankton abundance [22,25], cyanobacteria toxins [15,16,17] and food quality/supply [18,25,27] were all linked to the mortality and temporal shifts of occurrence.
However, the studies pinpointed to the lack of reliable data in monitoring temporal and spatial dynamics of algal biomass. Furthermore, there is still little understanding of how these blooms relate to water physico–chemical properties and whether algal biomass fluctuations are reflected in associated local lesser flamingo population sizes of east African soda lakes. Because algal blooms have been linked to excessive nitrogen and phosphorus inputs in lake systems [4,33,34], water quality assessments and monitoring algal biomass over time could be a useful technique for understanding whether spatio–temporal water quality monitoring can predict algal bloom occurrence [2,6,35].
Our objectives were (i) to quantify algal biomass across different locations and over a year in relation to water physico–chemical variables in the Momella lakes, Arusha National Park, Tanzania. Furthermore, we wanted (ii) to understand the temporal fluctuation of lesser flamingo numbers in the Momella lakes and whether these are associated with algal biomass. We used chlorophyll-a as a measure of algal biomass [36,37] and quantified water physico–chemical variables (nitrogen, phosphorus, temperature, pH, dissolved oxygen, and water transparency) that might influence algae growth in soda lakes [22,25,26]. We conducted monthly water measurements, tracked the amount of rainfall and collected monthly flamingo monitoring data for one year across different locations of the Momella lakes in northern Tanzania. We anticipated that physico–chemical factors play a direct role in changes in algal biomass. We also expected the number of lesser flamingos to increase as algal biomass increased but that there might be a tipping point, above which the algal blooms might deter foraging lesser flamingos.
Our findings provide a basis for understanding the factors contributing to temporal changes in lesser flamingo abundance in their habitats. Furthermore, assessing how water quality is related to algal biomass will help detect eutrophication and predict harmful algal bloom occurrence risk periods, which is important for long-term water quality monitoring programs and improving efforts to reduce eutrophication in the Momella lakes.
2. Materials and Methods
2.1. Study Site
The Momella lakes form an attractive tourist site in the north-eastern region of Tanzania’s Arusha National Park (ANAPA). Rishateni, Tulusia, Lekandiro, Kusare, El Kokhotoito, the Small Momella, and the Big Momella are among the seven soda lakes that make up the ecosystem [38,39]. A hydrogeological survey by Post and Stumpf [40] in the park revealed that the lakes Big Momella, Tulusia and Rishateni have higher salinity concentrations than the rest of the lakes in ANAPA, which favours the growth of blue-green algae, A. fusiformis, which represents the main food source for the lesser flamingos [18]. We focused on two lakes, i.e., Big Momella and Rishateni, covering an area of 1.14 km2 and 0.27 km2, respectively. These two lakes are the principal foraging grounds, attracting thousands of lesser flamingos during favourable conditions around the year [15,38,39]. The lakes are <1 km apart and are located on the outskirts of ANAPA, which might be affected by human-induced pollutants and leaching micro-and macronutrients from unprotected land. Thus, as the lakes are adjacent to each other and vulnerable to human pressure, it was important to monitor both independently to understand the general patterns in algal biomass changes and the lesser flamingo presence over time (Figure 1).
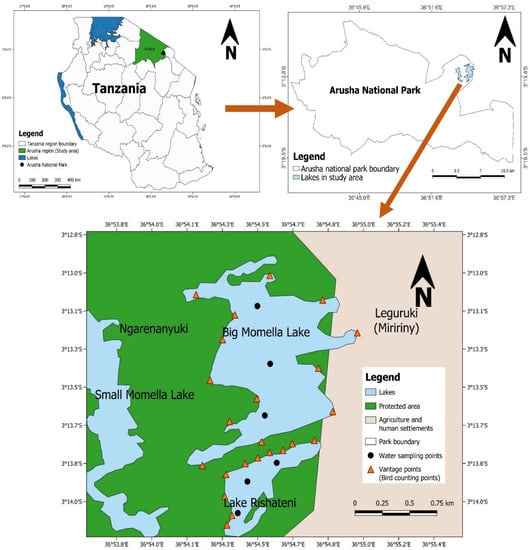
Figure 1.
Locations of the lakes Big Momella and Rishateni, at the boundary of Arusha National Park, in northern Tanzania with the water sampling points, where we measured water physico–chemical properties and algal biomass monthly from May 2020 to April 2021.
The average annual air temperatures In the study site range from 12 to 28 ºC and annual average rainfall varies between 500 mm and 1200 mm, exhibiting a bimodal pattern with long rains from February to May and short rains from November to January [38,41]. The lakes are fed by precipitation and non-permanent run-offs from valleys that drain water into the lakes from the surrounding area, and they are recharged mainly by underground water [38,42]. The local human population of Meru district is roughly 268,000 people, with an annual growth rate of 2.7%, and about 18,000 people live near the lakes in the Leguruki Ward, Miririny village [41]. In view of the above, the lakes are at risk from pollution due to farming and human settlements in the near proximity [41], which is likely to impact soil physico–chemical characteristics and water quality due to agrochemical runoff from neighbouring farms [38,43].
2.2. Data Collection
2.2.1. Water Quality
We conducted surface water quality sampling every month over one year, between May 2020 and April 2021, from three established sampling points in each lake (Figure 1). These sites included two sites close to the shore and one in the middle of each lake. We used 1-litre polyethene plastic bottles, washed with detergents, acidified with 5% HNO3, then rinsed with distilled water, and finally rinsed three times with sample water before filling [25,44]. Water samples for algal biomass determination were taken at a distance of about 10 m from the shoreline and immediately fixed with 1% formaldehyde [26]. The chosen distance was important to avoid the dense cyanobacterial scums that occasionally developed at the shore due to wind [25,45]. The water sample bottles were then labelled, preserved in an icebox and transported to the Nelson Mandela African Institution of Science and Technology (NM-AIST) for immediate analyses within 48 h [25,46,47].
We also measured the main physical (pH, temperature, dissolved oxygen and water transparency) and chemical (nitrogen and phosphorus) water variables that influence algal growth in eutrophic lakes [25,48,49]. At each sampling occasion, we used a portable Hanna 9829 Multiparameter Meter [22,45] and a 20 cm diameter Secchi disk [22,45] for water transparency. In addition, we quantified water total nitrogen content (N) by the Persulfate Digestion Method 10071 and water total phosphorus content (P) by PhosVer 3 with the Acid Digestion Method 8190 [50,51]. Finally, we recorded algal biomass using a DR 2800 spectrophotometer by quantifying chlorophyll-a [36,46]. In line with water quality assessment, we also determined the average monthly rainfall for the Arusha National Park using observational data consisting of rainfall records and rainfall datasets extracted from the Center for Hydrometeorology and Remote Sensing [52] to understand the rainfall pattern.
2.2.2. Lesser Flamingo Abundance
We used the ground census method [22,25] for monthly estimation of the number of lesser flamingo individuals in the two study lakes over one year, between May 2020 and April 2021. We counted by stopping at specified vantage points (Figure 1) and, depending on the abundance and distribution of lesser flamingos, we divided the lake’s shore into recognized counting sections with flocks of lesser flamingos [22,25,53]. The vantage points were purposively chosen to provide the optimum view for counting [22,53].
Because lesser flamingos occur in large flocks, we used recommended telescopes “Orion Go Scope II 70 mm” and binoculars “Orion Delux 8 × 42”(both manufactured by Synta company located in Suzhou, China) to scan, focus, and magnify individuals, as well as cameras to take photographs of large flocks (Figure 2) for confirmation while counting, which helped reduce biases due to interference or obscurity [22,25]. Moreover, we conducted the census between the hours of 8 and 10 a.m. when the birds moved the least to avoid double counting [45,54]. At each location, we stayed long enough to count each flock, which helped us calculate realistic estimates [55,56]. After each monthly counting session, we calculated the number of lesser flamingos by summing up the counts estimated from all vantage points [22,25]. We did not encounter any lesser flamingo deaths during the study period between May 2020 and April 2021.
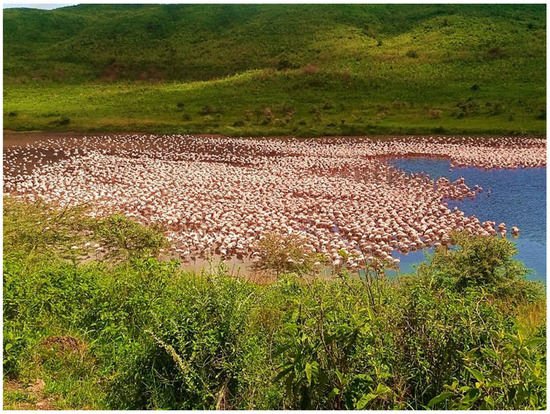
Figure 2.
A flock of lesser flamingos captured wading and feeding along the shore area of Lake Big Momella, northern Tanzania, during one of the counting sessions (April 2021).
2.3. Data Analysis
We calculated the mean for algal biomass across the sampling points each month and the monthly total number of lesser flamingos observed during the study period from May 2020 to April 2021. We also calculated the mean values of water physico–chemical variables across all three sampling points per lake. We used a one-way analysis of variance (ANOVA) to test spatial and temporal variations in algal biomass among the studied sites in each lake, followed by a post hoc test (Tukey HSD test) at a 5% confidence level. We used Pearson’s correlation to understand the strength of the relationship between algal biomass changes and the physico–chemical variables in water. We also correlated lesser flamingo numbers with algal biomass over the entire study period. We performed a Shapiro–Wilk test before the analysis to ensure normal data distribution, and those not normally distributed were transformed accordingly.
To measure the effect of each water physico–chemical factor on algal biomass, we used a multiple linear regression analysis [25,57] after having checked for multicollinearity using the variance inflation factor (VIF). We also performed the same for physico–chemical factors and lesser flamingo numbers. All predictor variables were only slightly correlated (VIF < 5 unit). R-square and adjusted R-square were used to test the model’s goodness of fit [57]. We used the non-linear curve fitting technique to test whether the response variables changed rapidly after a slight change in the predictor variable to identify potential threshold values [58,59]. We used R—Software version 4.1.1 for all statistical analyses, with significance levels set at p < 0.05.
3. Results
3.1. Physico–Chemical Variables and Algal Biomass Variations
The area exhibits a bimodal pattern with long rains from February to May and short rains from November to January (Figure 3). One-way ANOVA test for Lake Big Momella showed that monthly variations in water N (F = 25.0, p < 0.001; Figure 4a) and P (F = 29.8, p < 0.001; Figure 4b) differed significantly. In April 2021, water N was twice as high (11.5 mg/L) as in September 2020 (6.5 mg/L), similar to P, which was almost twice as high in April 2021 than in July and September 2020. Since rainfall and levels of N and P positively correlated (r = 0.654, p < 0.001; and r = 0.684, p < 0.001, respectively), it is possible that the region’s considerable rainfall received in March and April 2021, washed nutrients into the lakes, contributing the high levels of nutrients in April 2021.
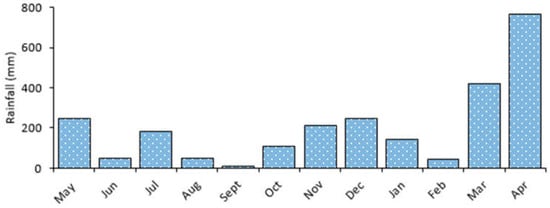
Figure 3.
Monthly average rainfall from May 2020 to April 2021 for the Arusha National Park, northern Tanzania [52].
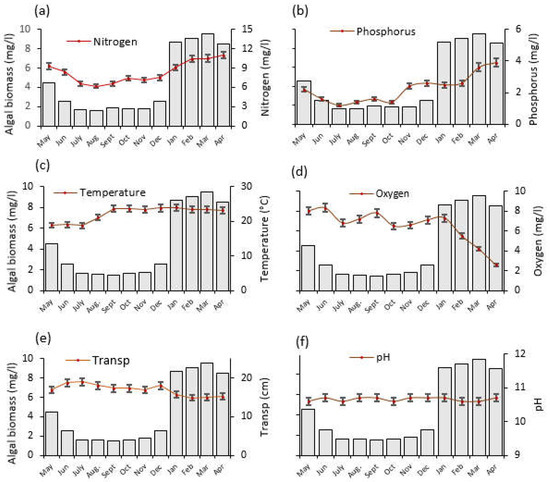
Figure 4.
The temporal trends of average (±SE) physico–chemical water quality parameters and algal biomass as monitored from May 2020 to April 2021 at Lake Big Momella, northern Tanzania; (a) Nitrogen, (b) Phosphorus, (c) Temperature, (d) Oxygen = dissolved oxygen (e) Transp = water transparency and (f) pH. Please note that the left y-axis denotes algal biomass (mg/L), indicated by gray bars, for all panels.
Over the year, the water temperature varied significantly (F = 193.2, p < 0.001; Figure 4c), with the lowest (19 °C) and highest (24 °C) temperature recorded in July 2020 and January 2021, respectively. Furthermore, between June 2020 and April 2021, dissolved oxygen statistically significantly declined to one third of its original value (F = 29.0, p < 0.001; Figure 4d). Water transparency dropped significantly by one quarter between June 2020 and February 2021 (F = 32.2, p < 0.001; Figure 4e). The pH differences were also statistically significant (F = 11.0, p < 0.001) across the months (Figure 4f).
One-way ANOVA test for Lake Rishateni also revealed statistically significant monthly variations for water N (F = 59.2, p < 0.001; Figure 5a) and P (F = 65.4, p < 0.001; Figure 5b). Water N in April 2021 was approximately twice as high (11 mg/L) as August 2020, while P was nearly three times higher (3.7 mg/L). The considerable amount of rainfall received in the area (Figure 3) that positively correlated with N and P (r = 0.547, p < 0.001; r = 0.763, p < 0.001, respectively), might have washed nutrients into the lake, contributing to the lake’s high N and P levels in April 2021. The water temperature varied significantly (F = 8.8, p < 0.001), with the lowest (22 °C) and highest (24 °C) recorded in July and November 2020, respectively (Figure 5c). In addition, dissolved oxygen decreased significantly by almost five times between May 2020 and April 2021 (F = 42.3, p < 0.001; Figure 5d). Between June 2020 and April 2021, Water transparency decreased by nearly one quarter (F = 50.3, p < 0.001; Figure 5e). The pH differences were not statistically significant (F = 11.0, p = 0.141) across the months (Figure 5f).
Figure 5.
The temporal trends of average (±SE) physico–chemical water quality parameters and algal biomass as monitored from May 2020 to April 2021 at Lake Rishateni, northern Tanzania; (a) Nitrogen, (b) Phosphorus, (c) Temperature, (d) Oxygen = dissolved oxygen (e) Transp = water transparency and (f) pH. Please note that the left y-axis denotes algal biomass (mg/L), indicated by gray bars, for all panels.
N and P were strongly positively correlated with algal biomass in Lake Big Momella (r = 0.867, p < 0.001 and r = 0.832, p < 0.001, respectively). Water temperature also showed a positive but not significant correlation with algal biomass (r = 0.325, p = 0.053). In addition, dissolved oxygen and water transparency had a moderate negative but statistically significant relationship with algal biomass (r = −0.663, p = 0.004 and r = −0.667, p < 0.001, respectively) while pH did not differ with algal biomass (r = −0.190, p = 0.268; see Appendix A: Table A1).
Lake Rishateni showed similar results, i.e., N and P had a statistically significant positive correlation with algal biomass (r = 0.912, p < 0.001, r = 0.819, p < 0.001). Water temperature also showed a positive but not significant correlation with algal biomass (r = 0.287, p = 0.089). Dissolved oxygen, water transparency and pH showed negative correlation with algal biomass; however, that of pH was not statistically significant (r = −0.536, p < 0.001, r = −0.499, p = 0.002, r = −0.137, p = 0.425, respectively; see Appendix A: Table A1).
Our scatter diagrams helped to determine the tipping points (thresholds), where the dependent variable (algal biomass) was most sensitive and signaled an abrupt change. Thus, except for pH, which was statistically insignificant, it was found that the nitrogen, temperature, dissolved oxygen, and water transparency tipping points in both lakes were about 8 mg/L, 23 °C, 6 mg/L and 16 cm. The phosphorus tipping points for the two lakes differed, around 3.8 mg/L for Lake Big Momella and 2.8 mg/L for Lake Rishateni (Figure 6 and Figure 7).
Figure 6.
Relationship changes between algal biomass and the physico–chemical variables; (a) Nitrogen, (b) Phosphorus, (c) Temperature, (d) dissolved oxygen, (e) Transp. (water transparency) and (f) pH, during the study period from May 2020 to April 2021 at Lake Big Momella, Tanzania.
Figure 7.
Relationship changes between algal biomass and the physico–chemical variables; (a) Nitrogen, (b) Phosphorus, (c) Temperature, (d) dissolved oxygen, (e) Transp. (water transparency) and (f) pH during the study period from May 2020 to April 2021 at Lake Rishateni, Tanzania.
3.2. Contributions of Influencing Factors to Algal Biomass
The analyzed physico–chemical factors jointly accounted for 80.9% of the variance in algal biomass for Big Momella lake, according to multiple linear regression analysis (F = 20.5, p < 0.001). We found that N and P were the significant predictors of the algal biomass changes, with increasing N and P enhancing algal biomass (B = 1.927, p < 0.001 and B = 0.526, p = 0.020; Table 1a). For Lake Rishateni, the investigated physico–chemical factors accounted for 89.5% of the variance in algal biomass for Lake Rishateni (F = 41.2, p < 0.001) and N and P positively significantly predicted the change in algal biomass (B = 1.954, p < 0.001 and B = 0.587, p = 0.022, respectively; Table 1b). The results indicated that algal biomass increased by 2.0 and 0.6 units for every one unit increase in nitrogen and phosphorus, respectively.

Table 1.
The multiple linear regression results showing the influence of physico-chemicals variables on algal biomass at lakes; (a) Big Momella and (b) Rishateni, Tanzania during the study period from May 2020 to April 2021. Temp = water temperature, Oxygen = dissolved oxygen and Transp = water transparency.
3.3. Algal Biomass and Lesser Flamingo Abundance
Generally, algal biomass fluctuated considerably and showed clear monthly variations in the study lakes across all sampling points, with low levels from May to December, 2020 and high levels between January, 2021 and April, 2021. We noticed the highest increase to 9.51 mg/L in March, 2021 at Lake Big Momella and 8.25 mg/L at Lake Rishateni in February 2021 (Figure 8a,b). Our one-way analysis of variance (ANOVA) revealed no statistically significant difference between the three sampling sites within Lake Big Momella (F = 0.029, p = 0.971) nor within Lake Rishateni (F = 0.017, p = 0.983). However, for both Lake Big Momella and Lake Rishateni, temporal fluctuations in algal biomass were statistically significant (F = 277, p < 0.001; F = 136, p < 0.001; Figure 8a,b, see Appendix B: Table A2).
Figure 8.
Lesser flamingo abundance (monthly number of individuals counted) and algal biomass trends as monitored from May 2020 to April 2021 at lakes; (a) Big Momella and (b) Rishateni, northern Tanzania.
In line with algal biomass, lesser flamingo numbers were relatively low between May and December, 2021 and soured significantly in January and February, 2021 (Figure 8a,b). After that, the numbers dropped in March and April 2021. Pearson correlation analysis showed a statistically significant positive correlation between lesser flamingo abundance and algal biomass in both lakes, Big Momella (r = 0.828, p < 0.001) and Rishateni (r = 0.780, p < 0.001). These results indicated that the amount of algal biomass in both lakes strongly influenced the number of lesser flamingos. However, monthly trends of the lesser flamingo numbers showed that the numbers dropped after a peak in algal biomass in March and April 2021 (Figure 8a,b).
Our regression analysis (Equations (1) and (2)) revealed that 87.2% and 64.7% of the variations in lesser flamingo abundance at lakes Big Momella (F (7, 28) = 27.4, p < 0.001) and Rishateni (F (7, 28) = 7.3, p < 0.001), respectively, could be explained by various physico–chemical factors of the water quality.
AM = Abundance Big Momella, AR = Abundance Rishateni, AB = algal biomass (mg/L), N = nitrogen (mg/L), P = phosphorus (mg/L), DO = dissolve oxygen, Temp = temperature and Transp = water transparency.
In addition, we used the non-linear curves to determine tipping points or “thresholds” in algal biomass, to which the number of lesser flamingos signaled an abrupt change during the study period. As a result, we found the tipping point for the amount of algal biomass to be around 8 mg/L for Lake Big Momella (Figure 9a) and nearly 7 mg/L for Lake Rishateni (Figure 9b).
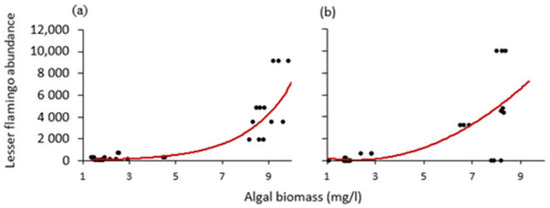
Figure 9.
Scatter diagrams with curved lines showing how the relationship changed between lesser flamingo abundance and algal biomass at lakes; (a) Big Momella and (b) Rishateni, during the study period from May 2020 to April 2021 at lakes Big Momella, northern Tanzania.
4. Discussion
4.1. Physico–Chemical Variables and Algal Biomass Variations
Contrary to our expectation, there were no spatial changes in algal biomass and the physico–chemical parameters. Findings indicate that spatial changes in physico–chemical variables and hence biomass could be attributed to differences in nutrients of the water that enters the lakes at some points through permanent streams from nutrient rich watersheds [60] or areas with spatial differences in geology [61]. However, given that the Momella lakes lack permanent streams, this might not be the case. Surprisingly, temperature and pH did not seem to impact algal biomass changes significantly as observed in other studies [35,49]; although, significant temporal variations were evident. The relatively high water temperatures [62,63] and the stable high-pH environments (pH > 9) which are favourable for algal growth in the soda lakes [64] could possibly be the reasons behind the insignificant impact of these parameters on algal biomass changes.
The rapid increase in algal biomass between January and April 2021 could be attributable to the high levels of N and P enrichment from catchment areas as the lakes are fed by rainfall and non-permanent run-offs from nearby agricultural fields [38,65]. Thus, water N and P significantly influenced algal biomass changes, confirming that algal growth requires a certain range of physico–chemical properties for optimal growth [22,65]. The N and P enrichment may be the result of these nutrients being washed into the lakes through runoff from the watershed areas.
Though few have investigated a possible time lag between nutrient enrichment and responding algal biomass changes [66,67], we found that after 1 to 2 months of high P levels, algal biomass peaked. Our findings suggest that establishing the thresholds, especially for nitrogen and phosphorus concentrations, is essential for preventing eutrophication in aquatic ecosystems caused by non-point source pollution and lowering the high risk of algal blooms [68]. We also recommend a study on the farming practices in the lakeside communities to determine whether they contribute to eutrophication.
Determining physico–chemical parameters’ threshold values for aquatic organisms has been problematic as species respond differently based on the adaptive ability to which they are exposed [69,70]. Furthermore, the observation that dissolved oxygen declined below the recommended threshold in our study, i.e., 6 mg/L [69,70], following the increased algal biomass in March and April, is of great concern. According to Shields and Weidman [71], both 1 and 2 mg/L dissolved oxygen levels seemed to be critical hypoxic thresholds, below which fatal conditions for most water-dependent species occur. Thus, the decreased dissolved oxygen levels suggests that the lakes experienced stressful conditions, particularly in March and April. However, we recommend long-term research on the soda lakes’ critical dissolved oxygen and water transparency thresholds as our study only covered one year of observations.
4.2. Contributions of Influencing Factors to Algal Biomass
According to Chislock [72] and Hamilton [73], high N and P levels in water bodies can promote algae’s rapid growth, resulting in large surface algal blooms and hostile conditions for water-dependent species such as lesser flamingos. The high amounts of N we found in the lakes, particularly between January and April, might be contributed by the lesser flamingo droppings into the water [22,74]. Our finding on high P levels is consistent with other studies conducted in lakes Nakuru and Bogoria in Kenya, which have had much higher P levels in the years 2001–2009 (39.9 mg/L) and 33.4 mg/L), respectively, during wet months [46,75] compared to our study. Since the Momella lakes are protected by ANAPA, with the exception of the north-eastern part, which is vulnerable to human encroachment [38,76], we suspect that the comparatively low levels of N and P may reflect the relatively small human influence, highlighting the importance of protecting these unique soda lakes. We acknowledge that reducing nutrient inputs and controlling algal blooms through mechanical, biological, chemical, genetic and environmental controls [12] involve numerous stakeholders and are often not allowed in protected areas [12,77]. Preventative steps may be more achievable in the Momella lakes ecosystem, to reduce nutrient imports from watershed areas [12,77].
4.3. Algal Biomass and Lesser Flamingo Abundance
Our finding that the number of lesser flamingos increased significantly as algal biomass increased was consistent with our hypothesis. Moreover, based on our algal biomass tipping points, we noted that the lesser flamingo numbers were sensitive to thresholds in algal biomass. As expected, the pattern showed that the number of lesser flamingos declined at a relatively high algal biomass, which might reflect the decrease in supply of their preferred diet in the phytoplankton community, similar to studies conducted in Kenya [10], Tanzania [22,25,26] and South Africa [24,46]. For instance, the number of flamingos at Lake Manyara, Tanzania, increased to 515,777 individuals when A. fusiformis dominated the water column [22], while Kamfers Dam, South Africa attracted large flocks of lesser flamingos soaring to more than 80,000 individuals [24,46] during May 2008 and 2012.
When their preferred food falls below a certain threshold, the birds will resort to a different food source, e.g., diatoms [18,19]. Alternatively, they shift to other lakes in search of suitable and high quantity of food sources [11,22,26]. Thus, our observed unexpected drop in lesser flamingo numbers in the lakes in March/April is likely not due to the birds’ seasonal migration patterns to Lake Natron for breeding, as the species begins nesting there around October only [25,28]. We might have identified tipping point, above which algal biomass becomes too high to support the lesser flamingos in the lakes. However, as our study only covered one year of observations, we recommend long-term monitoring data to understand whether lesser flamingo population drops are indeed related to algal bloom occurrence. We also recommend studies on species identification and Arthrosporic density determination during high algal biomass peaks when flamingo numbers are low as there might be Arthrospira crashes caused by cyanophages [78].
Our findings suggest that monitoring water physico–chemical variables related to algal biomass dynamics in soda lakes can help predict algal bloom risk periods that might affect lesser flamingo presence. The rapid increase in algal biomass that resulted in reduced dissolved oxygen and water transparency, particularly in March and April, could be a sign of an algal bloom event that had an impact on the lesser flamingos’ food and, consequently, their abundance in the lakes [26,75]. Previous findings indicate the risk of food contamination by harmful algal species [79] and toxicity [15,16] during algal bloom occurrence. Since the short duration of our study might have constrained our results, we recommend long-term monitoring of dissolved oxygen and water transparency, followed by algal species composition during high algal biomass peaks. This will add to our knowledge of algal bloom events and toxic algal species that may affect lesser flamingo abundance in the lakes.
5. Conclusions
In this study, we found that algal blooms can be detected through algal biomass changes related to physico–chemical water quality parameters. Tracing sources of water nutrients, i.e., N and P that promote algal growth in the Momella lakes over time and space was an important tool to understand thresholds and correlations of the different factors. Our results indicated that algal biomass dynamics might be one of the main factors influencing lesser flamingo presence in the Momella lakes. We also found algal biomass thresholds, after which lesser flamingo numbers radically dropped. As our study only covered one year, we recommend continuous assessments over several years. However, we highlight that tracking algal biomass dynamics and water nutrient status over time will aid in predicting algal bloom risk periods, which could alter flamingo presence and feeding requirements in lakes.
6. Implication for Conservation
Our study monitored algal biomass changes related to physico–chemical factors influencing algal growth for one year in the Momella lakes. We also tracked lesser flamingo numbers to see how they changed over time. Our findings show that monitoring algal biomass dynamics and the physico–chemical water variables can help predict algal bloom risk periods, adding to our understanding of the factors that might influence the presence of lesser flamingos in their natural habitats. Furthermore, algal biomass peaks and algal bloom risk periods can help researchers determine the optimal time to study dominant or toxic algae species that may contaminate or disrupt the food supply of lesser flamingos [15,16] and, thus, their presence in the lakes. Algal bloom detection through algal biomass changes could be the best tool, rather than relying on water colour changes, deaths of organisms and unpleasant odors [4,9], which are too late and only relative indicators. We also expect our findings to be the basis for supporting efforts to investigating the sources of nutrients leaching into the lakes during high algal biomass peaks. Although the Arusha National Park protects the lakes, we stress long-term water quality monitoring programs and collaborative efforts among stakeholders to protect the lakes from effects related to human encroachment.
Author Contributions
Conceptualization, methodology, data collection, software, formal data analysis, initial manuscript preparation and project administration submission; D.L.L.; methodology validation, interpretation of results, review and editing; D.L.L., P.A.N. and A.C.T. All authors have read and agreed to the published version of the manuscript.
Funding
This research was funded by Rufford Foundation Small Grants (31046-1) through the Nelson Mandela African Institution of Science and Technology (NM-AIST) and IDEA WILD.
Data Availability Statement
Not applicable.
Acknowledgments
We would like to thank the Rufford Foundation for financial support, IDEA WILD for research equipment provision, and TAWIRI and COSTECH for issuing research permits. We also thank the ANAPA staff for their support and guidance during data collection. We appreciate S.W. Smith and J. Efraim’s remarks for shedding light on data analysis. Special thanks to J. Marwa for her suggestions that helped to improve the manuscript. We also appreciate the assistance and generosity of Y.J. Magangali during data collection.
Conflicts of Interest
The authors declare no conflict of interest that could have appeared to influence the work reported in this paper.
Appendix A
Table A1.
Correlation matrix for the studied variables at lakes (1) Big Momella and (2) Rishateni, northern Tanzania. N = Nitrogen, P = Phosphorus, Temp. = water temperature, Oxygen = dissolved Oxygen and Transp. = water transparency.
Table A1.
Correlation matrix for the studied variables at lakes (1) Big Momella and (2) Rishateni, northern Tanzania. N = Nitrogen, P = Phosphorus, Temp. = water temperature, Oxygen = dissolved Oxygen and Transp. = water transparency.
| (1) | |||||||
| N (mg/L) | P (mg/L) | Temp. (°C) | Oxygen (mg/L) | Transp. (cm) | pH | Alga biomass (mg/L) | |
| N (mg/L) | — | ||||||
| P (mg/L) | 0.694 *** | — | |||||
| Temp. (°C) | 0.120 | 0.563 *** | — | ||||
| Oxygen (mg/L) | −0.611 *** | −0.769 *** | −0.505 ** | — | |||
| Transp. (mg/L) | −0.557 *** | −0.883 *** | −0.696 ** | 0.671 *** | — | ||
| pH | −0.083 | 0.013 | −0.110 | 0.122 | 0.058 | — | |
| Algal biomass (mg/L) | 0.867 *** | 0.832 *** | 0.325 | −0.625 *** | −0.667 *** | −0.190 | — |
| (2) | |||||||
| N (mg/L) | P (mg/L) | Temp. (°C) | Oxygen (mg/L) | Transp. (cm) | pH | Alga biomass (mg/L) | |
| N (mg/L) | — | ||||||
| P (mg/L) | 0.793 *** | — | |||||
| Temp. (°C) | 0.258 | 0.447 ** | — | ||||
| Oxygen (mg/L) | −0.459 ** | −0.577 *** | −0.650 *** | — | |||
| Transp. (mg/L) | −0.350 * | −0.453 ** | −0.713 *** | 0.802 *** | — | ||
| pH | −0.112 | 0.095 | −0.050 | −0.169 | 0.139 | — | |
| Algal biomass (mg/L) | 0.912 *** | 0.819 *** | 0.287 | −0.536 *** | −0.499 ** | −0.137 | — |
Note: Mean difference values with asterisk (*) are statistically significant different at * p < 0.05, ** p < 0.01, *** p < 0.001.
Appendix B
Table A2.
The mean (mg/L) difference for algal biomass changes among months at; (1) Lake Big Momella and (2) Lake Rishateni, northern Tanzania, between May 2020 and April 2021. Significant differences are presented according to Tukey’s Post Hoc Test at 95 CL.
Table A2.
The mean (mg/L) difference for algal biomass changes among months at; (1) Lake Big Momella and (2) Lake Rishateni, northern Tanzania, between May 2020 and April 2021. Significant differences are presented according to Tukey’s Post Hoc Test at 95 CL.
| May | June | July | August | September | October | November | December | January | February | March | April | |
| May | — | 0.183 ** | 0.18 ** | 0.227 *** | 0.157 * | 0.177 ** | 0.19 ** | 0.173 ** | −0.377 *** | −0.487 *** | −0.483 *** | −0.473 *** |
| June | — | −0.003 | 0.043 | −0.027 | −0.007 | 0.007 | −0.01 | −0.56 *** | −0.67 *** | −0.667 *** | −0.657 *** | |
| July | — | 0.0467 | −0.023 | −0.003 | 0.01 | −0.007 | −0.557 *** | −0.667 *** | −0.663 *** | −0.653 *** | ||
| August | — | −0.07 | −0.05 | 0.037 | −0.053 | −0.603 *** | −0.713 *** | −0.71 *** | −0.7 *** | |||
| September | — | 0.02 | 0.033 | 0.017 | −0.533 *** | −0.643 *** | −0.64 *** | −0.63 *** | ||||
| October | — | 0.013 | −0.003 | −0.553 *** | −0.663 *** | −0.66 *** | −0.65 *** | |||||
| November | — | −0.017 | −0.567 *** | −0.677 *** | −0.673 *** | −0.663 *** | ||||||
| December | — | −0.55 *** | −0.66 *** | −0.657 *** | −0.647 *** | |||||||
| January | — | −0.11 | −0.107 | −0.097 | ||||||||
| February | — | 0.003 | 0.013 | |||||||||
| March | — | 0.01 | ||||||||||
| April | — | |||||||||||
| May | June | July | August | September | October | November | December | January | February | March | April | |
| May | — | 0.25 *** | 0.44 *** | 0.457 *** | 0.377 *** | 0.397 *** | 0.403 *** | 0.257 *** | −0.283 *** | −0.297 *** | −0.32 *** | −0.27 *** |
| June | — | 0.19 *** | 0.207 *** | 0.127 ** | 0.147 *** | 0.153 *** | 0.007 | −0.533 *** | −0.547 *** | −0.57 *** | −0.52 *** | |
| July | — | 0.017 | −0.063 | −0.043 | −0.037 | −0.183 *** | −0.723 *** | −0.737 *** | −0.76 *** | −0.71 *** | ||
| August | — | −0.08 | −0.06 | −0.053 | −0.2 *** | −0.74 *** | −0.753 *** | −0.777 *** | −0.727 *** | |||
| September | — | 0.02 | 0.027 | −0.12 ** | −0.66 *** | −0.673 *** | −0.697 *** | −0.647 *** | ||||
| October | — | 0.007 | −0.14 ** | −0.68 *** | −0.693 *** | −0.717 *** | −0.667 *** | |||||
| November | — | −0.147 *** | −0.687 *** | −0.7 *** | −0.723 *** | −0.673 *** | ||||||
| December | — | −0.54 *** | −0.553 *** | −0.577 *** | −0.527 *** | |||||||
| January | — | −0.013 | −0.037 *** | 0.013 | ||||||||
| February | — | −0.023 | 0.027 | |||||||||
| March | — | 0.05 | ||||||||||
| April | — |
Note: Mean difference values with asterisk (*) are statistically significant different at * p < 0.05, ** p < 0.01, *** p < 0.001.
References
- Ho, J.C.; Michalak, A.M.; Pahlevan, N. Widespread global increase in intense lake phytoplankton blooms since the 1980s. Nature 2019, 574, 667–670. [Google Scholar] [CrossRef] [PubMed]
- Liu, D.; Yu, S.; Cao, Z.; Qi, T.; Duan, H. Process-oriented estimation of column-integrated algal biomass in eutrophic lakes by MODIS/Aqua. Int. J. Appl. Earth Obs. Geoinf. 2021, 99, 102321. [Google Scholar] [CrossRef]
- Sahoo, D.; Baweja, P. General characteristics of algae. In The Algae World; Springer: Berlin/Heidelberg, Germany, 2015; pp. 3–29. [Google Scholar] [CrossRef]
- Anderson, D.M.; Glibert, P.M.; Burkholder, J.M. Harmful algal blooms and eutrophication: Nutrient sources, composition, and consequences. Estuaries 2002, 25, 704–726. [Google Scholar] [CrossRef]
- Namsaraev, Z.; Melnikova, A.; Komova, A.; Ivanov, V.; Rudenko, A.; Ivanov, E. Algal bloom occurrence and effects in Russia. Water 2020, 12, 285. [Google Scholar] [CrossRef]
- Havens, K.E. Cyanobacteria blooms: Effects on aquatic ecosystems. In Cyanobacterial Harmful Algal Blooms: State of the Science and Research Needs; Springer: New York, NY, USA, 2008; pp. 733–747. [Google Scholar] [CrossRef]
- He, P. Harmful algal blooms. In The Algae World; Springer: Berlin/Heidelberg, Germany, 2015; pp. 339–355. [Google Scholar] [CrossRef]
- Ono, M.; Takeuchi, N.; Zawierucha, K. Snow algae blooms are beneficial for microinvertebrates assemblages (Tardigrada and Rotifera) on seasonal snow patches in Japan. Sci. Rep. 2021, 11, 5973. [Google Scholar] [CrossRef]
- Duan, H.; Tao, M.; Loiselle, S.A.; Zhao, W.; Cao, Z.; Ma, R.; Tang, X. MODIS observations of cyanobacterial risks in a eutrophic lake: Implications for long-term safety evaluation in drinking-water source. Water Res. 2017, 122, 455–470. [Google Scholar] [CrossRef]
- Kaggwa, M.N.; Gruber, M.; Oduor, S.O.; Schagerl, M. A detailed time series assessment of the diet of Lesser Flamingos: Further explanation for their itinerant behaviour. Hydrobiologia 2013, 710, 83–93. [Google Scholar] [CrossRef][Green Version]
- Tuite. The distribution and density of Lesser Flamingos in East Africa in relation to food availability and productivity. Waterbirds 2000, 23, 52–63. [Google Scholar] [CrossRef]
- Anderson, D.M. Approaches to monitoring, control and management of harmful algal blooms (HABs). Ocean. Coast. Manag. 2009, 52, 342–347. [Google Scholar] [CrossRef]
- Paerl, H.W.; Otten, T.G. Harmful Cyanobacterial Blooms: Causes, Consequences, and Controls. Microb. Ecol. 2013, 65, 995–1010. [Google Scholar] [CrossRef]
- Sellner, K.G.; Rensel, J. Prevention, control, and mitigation of harmful algal bloom impacts on fish, shellfish, and human consumers. In Harmful Algal Blooms: A compendium Desk Reference; Wiley Online Library: Hoboken, NJ, USA, 2018; pp. 435–492. [Google Scholar] [CrossRef]
- Lugomela, C.; Pratap, H.B.; Mgaya, Y.D. Cyanobacteria blooms—A possible cause of mass mortality of Lesser Flamingos in Lake Manyara and Lake Big Momela, Tanzania. Harmful Algae 2006, 5, 534–541. [Google Scholar] [CrossRef]
- Nonga, H.E.; Sandvik, M.; Miles, C.O.; Lie, E.; Mdegela, R.H.; Mwamengele, G.L.; Semuguruka, W.D.; Skaare, J.U. Possible involvement of microcystins in the unexplained mass mortalities of Lesser Flamingo (Phoeniconaias minor Geoffroy) at Lake Manyara in Tanzania. Hydrobiologia 2011, 678, 167–178. [Google Scholar] [CrossRef]
- Koenig, R. The Pink Death: Die-Offs of the Lesser Flamingo Raise Concern. Science 2006, 313, 1724–1725. [Google Scholar] [CrossRef] [PubMed]
- Krienitz, L.; Krienitz, D.; Dadheech, P.K.; Hübener, T.; Kotut, K.; Luo, W.; Teubner, K.; Versfeld, W.D. Food algae for Lesser Flamingos: A stocktaking. Hydrobiologia 2016, 775, 21–50. [Google Scholar] [CrossRef]
- Pálmai, T.; Szabó, B.; Kotut, K.; Krienitz, L.; Padisák, J. Ecophysiology of a successful phytoplankton competitor in the African flamingo lakes: The green alga Picocystis salinarum (Picocystophyceae). J. Appl. Phycol. 2020, 32, 1813–1825. [Google Scholar] [CrossRef]
- Krienitz, L.; Mähnert, B.; Schagerl, M. Lesser Flamingo as a Central Element of the East African Avifauna. In Soda Lakes of East Africa; Schagerl, M., Ed.; Springer International Publishing: Cham, Switzerland, 2016; pp. 259–284. [Google Scholar] [CrossRef]
- Brown, L.; Urban, E.K.; Newman, K.B. The Birds of Africa: Volume I; Bloomsbury Publishing: London, UK, 2020. [Google Scholar]
- Kihwele, E.; Howell, K.; Lugomela, C. Temporal Changes in the Lesser Flamingos Population (Phoenicopterus minor) in Relation to Phytoplankton Abundance in Lake Manyara, Tanzania. Open J. Ecol. 2014, 4, 43809. [Google Scholar] [CrossRef]
- BirdLife. BirdLife. The IUCN Red List of Threatened Species 2018. 2018. Available online: https://doi.org/10.2305/IUCN.UK.2018-2.RLTS.T22697369A129912906.en (accessed on 18 February 2022).
- Childress, B.; Nagy, S.; Hughes, B.; Abebe, Y. International Single Species Action Plan for the Conservation of the Lesser Flamingo (Phoeniconaias minor); CMS Technical Series; UNEP/CMS Secretariat: Born, Germany, 2008; Volume 18, AEWA Technical Series No. 34; 59p. [Google Scholar]
- Mgimwa, E.F.; John, J.R.; Lugomela, C.V. The influence of physical–chemical variables on phytoplankton and lesser flamingo (Phoeniconaias minor) abundances in Lake Natron, Tanzania. Afr. J. Ecol. 2021, 59, 667–675. [Google Scholar] [CrossRef]
- Krienitz, L.; Kotut, K. Fluctuating Algal Food Populations and the Occurrence of Lesser Flamingos (Phoeniconaias minor) in Three Kenyan Rift Valley Lakes. J. Phycol. 2010, 46, 1088–1096. [Google Scholar] [CrossRef]
- Mmassy, E.; Maliti, H.; Nkwabi, A.; Mwita, M.; Mwakatobe, A.; Ntalwila, J.; Lowassa, A.; Mtui, D.; Liseki, S.; Lesio, N. Population Status and Trend of Lesser Flamingos at Lakes Natron and Manyara, Tanzania. 2018. Available online: http://www.flamingo-sg.org/wp-content/uploads/2019/01/paper-3.pdf (accessed on 7 May 2022).
- Krienitz, L. The Lesser Flamingo. In Lesser Flamingos: Descendants of Phoenix; Krienitz, L., Ed.; Springer: Berlin/Heidelberg, Germany, 2018; pp. 3–18. [Google Scholar] [CrossRef]
- Groom, G.; Krag Petersen, I.; Anderson, M.D.; Fox, A.D. Using object-based analysis of image data to count birds: Mapping of Lesser Flamingos at Kamfers Dam, Northern Cape, South Africa. Int. J. Remote Sens. 2011, 32, 4611–4639. [Google Scholar] [CrossRef]
- Delfino, H.C.; Carlos, C.J. What do we know about flamingo behaviors? A systematic review of the ethological research on the Phoenicopteridae (1978–2020). Acta Ethol. 2022, 25, 1–14. [Google Scholar] [CrossRef]
- Bucher, E.H.; Curto, E. Influence of long-term climatic changes on breeding of the Chilean flamingo in Mar Chiquita, Córdoba, Argentina. Hydrobiologia 2012, 697, 127–137. [Google Scholar] [CrossRef]
- Ndetei, R.; Muhandiki, V. Mortalities of lesser flamingos in Kenyan Rift Valley saline lakes and the implications for sustainable management of the lakes. Lakes Reserv. Sci. Policy Manag. Sustain. Use 2005, 10, 51–58. [Google Scholar] [CrossRef]
- Dubey, D.; Dutta, V. Nutrient Enrichment in Lake Ecosystem and Its Effects on Algae and Macrophytes. In Environmental Concerns and Sustainable Development: Volume 2: Biodiversity, Soil and Waste Management; Shukla, V., Kumar, N., Eds.; Springer Singapore: Singapore, 2020; pp. 81–126. [Google Scholar] [CrossRef]
- Li, Y.; Cao, W.; Su, C.; Hong, H. Nutrient sources and composition of recent algal blooms and eutrophication in the northern Jiulong River, Southeast China. Mar. Pollut. Bull. 2011, 63, 249–254. [Google Scholar] [CrossRef] [PubMed]
- Huisman, J.; Codd, G.A.; Paerl, H.W.; Ibelings, B.W.; Verspagen, J.M.H.; Visser, P.M. Cyanobacterial blooms. Nat. Rev. Microbiol. 2018, 16, 471–483. [Google Scholar] [CrossRef] [PubMed]
- Steinman, A.D.; Lamberti, G.A.; Leavitt, P.R.; Uzarski, D.G. Biomass and pigments of benthic algae. In Methods in Stream Ecology; Elsevier: Amsterdam, The Netherlands, 2017; Volume 1, pp. 223–241. [Google Scholar]
- Berkman, J.A.H.; Canova, M. Algal Biomass Indicators; Chapter A7, Section 7.4; US Geological Survey: Reston, VA, USA, 2007.
- Marttila, O. The Great Savanna: The National Parks of Tanzania and Other Key Conservation Areas; Auris Publishers: Vancouver, AB, Canada, 2011. [Google Scholar]
- TAWIRI. Priority Areas for Research for Tanzania National Parks (TANAPA), Ngorongoro Conservation Area Authority (NCAA), Wildlife Division (WD) and Tanzania Forest Service (TFS). 2012. Available online: https://tawiri.or.tz (accessed on 26 July 2022).
- Post, V.; Stumpf, R. Hydrogeological Survey at Arusha National Park–Hydrochemical. Bdl 2018, 3, 4. [Google Scholar]
- URT. Prime Minister’s Office Regional Administration and Local Government, Meru District Council Socio–Economic Profile; URT: Arusha, Tanzania, 2017.
- Scoon, R.N. Arusha national park (Mount Meru). In Geology of National Parks of Central/Southern Kenya and Northern Tanzania; Springer: Berlin/Heidelberg, Germany, 2018; pp. 141–154. [Google Scholar]
- Baker, N.E.; Baker, E. Important Bird Areas in Tanzania: A Fist Inventory; WCST, Wildlife Conservation Society of Tanzania: Dar es Salaam, Tanzania, 2002. [Google Scholar]
- APHA. Standard Methods for the Examination of Water and Wastewater, 20th ed.; American Public Health Association, American Water Work Association, Water Environment Federation: Washington, DC, USA, 1998. [Google Scholar]
- Githaiga, J.M. Ecological Factors Determining Utilisation Patterns and Inter-Lake Movements of Lesser Flamingo (Phoenicopterus minor GEOFFROY) in Kenyan Alkaline Lakes. Ph.D. Thesis, Department of Zoology, University of Nairobi, Nairobi, Kenya, 2003. Unpublished. [Google Scholar]
- Rice, E.; Baird, R.; Eaton, A. Standard Methods for the Examination of Water and Wastewater, 23rd ed.; American Public Health Association (APHA), American Water Works Association (AWWA) and Water Environment Federation (WEF): Washington, DC, USA, 2017. [Google Scholar]
- Hill, L.; Bowerman, W.; Roos, J.; Bridges, W.; Anderson, M. Effects of water quality changes on phytoplankton and lesser flamingo Phoeniconaias minor populations at Kamfers Dam, a saline wetland near Kimberley, South Africa. Afr. J. Aquat. Sci. 2013, 38, 287–294. [Google Scholar] [CrossRef]
- Lap, B.Q.; Ta, D.T. Analysis of the Principal Factors Affecting the Algae Growth in an Urban Eutrophic Shallow Lake by an Ecosystem Model. Water Air Soil Pollut. 2020, 231, 537. [Google Scholar] [CrossRef]
- Li, D.; Wu, N.; Tang, S.; Su, G.; Li, X.; Zhang, Y.; Wang, G.; Zhang, J.; Liu, H.; Hecker, M.; et al. Factors associated with blooms of cyanobacteria in a large shallow lake, China. Environ. Sci. Eur. 2018, 30, 27. [Google Scholar] [CrossRef]
- Ihunwo, O.; Chisom, E.; Okon, M.; Isaiah, O.; Obunwo, C.; Mmom, C. Effect of urban effluent on river water quality in the Niger delta. Front. Environ. Microbiol. 2018, 4, 110–114. [Google Scholar] [CrossRef]
- Hach, D. 2800 Spectrophotometer: Procedures Manual; Hach Company: Düsseldorf, Germany, 2007. [Google Scholar]
- Nguyen, P.; Shearer, E.J.; Tran, H.; Ombadi, M.; Hayatbini, N.; Palacios, T.; Huynh, P.; Braithwaite, D.; Updegraff, G.; Hsu, K.; et al. The CHRS Data Portal, an easily accessible public repository for PERSIANN global satellite precipitation data. Sci. Data 2019, 6, 180296. [Google Scholar] [CrossRef]
- Bennun, L.; Nasirwa, O. Trends in waterbird numbers in the southern Rift Valley of Kenya. Ostrich 2000, 71, 220–226. [Google Scholar] [CrossRef]
- Kumssa, T.; Bekele, A. Current population status and activity pattern of lesser flamingos (Phoeniconaias minor) and greater flamingo (Phoenicopterus roseus) in Abijata-Shalla Lakes National Park (ASLNP), Ethiopia. Int. J. Biodivers. 2014, 2014, 95362. [Google Scholar] [CrossRef]
- Kumssa, T.; Bekele, A. Feeding ecology of Lesser Flamingos (Phoeniconaias minor) in Abijata-Shalla Lakes National Park (ASLNP) with special reference to lakes Abijata and Chitu, Ethiopia. Asian J. Biol. Sci. 2014, 7, 57–65. [Google Scholar] [CrossRef][Green Version]
- Bibby, C.J.; Burgess, N.D.; Hillis, D.M.; Hill, D.A.; Mustoe, S. Bird Census Techniques; Elsevier: Amsterdam, The Netherlands, 2000. [Google Scholar]
- Ott, R.L.; Longnecker, M.T. An Introduction to Statistical Methods and Data Analysis, 6th ed.; Cengage Learning: Boston, MA, USA, 2015. [Google Scholar]
- Juliano, S.A. Nonlinear curve fitting: Predation and functional response curves. In Design and Analysis of Ecological Experiments; Chapman and Hall/CRC: Boca Raton, FL, USA, 2020; pp. 159–182. [Google Scholar]
- Tong, Y.; Yu, L.; Li, S.; Liu, J.; Qin, H.; Li, W. Polynomial Fitting Algorithm Based on Neural Network. ASP Trans. Pattern Recognit. Intell. Syst. 2021, 1, 32–39. [Google Scholar] [CrossRef]
- Saturday, A.; Lyimo, T.J.; Machiwa, J.; Pamba, S. Spatio-temporal variations in physicochemical water quality parameters of Lake Bunyonyi, Southwestern Uganda. SN Appl. Sci. 2021, 3, 684. [Google Scholar] [CrossRef]
- Wagaw, S.; Mengistou, S.; Getahun, A. Phytoplankton community structure in relation to physico-chemical factors in a tropical soda lake, Lake Shala (Ethiopia). Afr. J. Aquat. Sci. 2021, 46, 428–440. [Google Scholar] [CrossRef]
- Mantzouki, E.; Lürling, M.; Fastner, J.; De Senerpont Domis, L.; Wilk-Woźniak, E.; Koreivienė, J.; Seelen, L.; Teurlincx, S.; Verstijnen, Y.; Krztoń, W.; et al. Temperature Effects Explain Continental Scale Distribution of Cyanobacterial Toxins. Toxins 2018, 10, 156. [Google Scholar] [CrossRef]
- Schagerl, M.; Burian, A. The Ecology of African Soda Lakes: Driven by Variable and Extreme Conditions. In Soda Lakes of East Africa; Schagerl, M., Ed.; Springer International Publishing: Cham, Switzerland, 2016; pp. 295–320. [Google Scholar] [CrossRef]
- Boros, E.; Kolpakova, M. A review of the defining chemical properties of soda lakes and pans: An assessment on a large geographic scale of Eurasian inland saline surface waters. PLoS ONE 2018, 13, e0202205. [Google Scholar] [CrossRef]
- Zhou, J.; Han, X.; Brookes, J.D.; Qin, B. High probability of nitrogen and phosphorus co-limitation occurring in eutrophic lakes. Environ. Pollut. 2022, 292, 118276. [Google Scholar] [CrossRef]
- Cho, S.; Lim, B.; Jung, J.; Kim, S.; Chae, H.; Park, J.; Park, S.; Park, J.K. Factors affecting algal blooms in a man-made lake and prediction using an artificial neural network. Measurement 2014, 53, 224–233. [Google Scholar] [CrossRef]
- Carstensen, J.; Henriksen, P.; Heiskanen, A.-S. Summer algal blooms in shallow estuaries: Definition, mechanisms, and link to eutrophication. Limnol. Oceanogr. 2007, 52, 370–384. [Google Scholar] [CrossRef]
- Song, K.; Lu, Y.; Dao, G.; Chen, Z.; Wu, Y.; Wang, S.; Liu, J.; Hu, H.-Y. Reclaimed water for landscape water replenishment: Threshold nitrogen and phosphorus concentrations values for bloom control. Algal Res. 2022, 62, 102608. [Google Scholar] [CrossRef]
- Ma, J.; Wu, S.; Shekhar, N.V.R.; Biswas, S.; Sahu, A.K. Determination of Physicochemical Parameters and Levels of Heavy Metals in Food Waste Water with Environmental Effects. Bioinorg. Chem. Appl. 2020, 2020, 8886093. [Google Scholar] [CrossRef] [PubMed]
- Wannamaker, C.M.; Rice, J.A. Effects of hypoxia on movements and behavior of selected estuarine organisms from the southeastern United States. J. Exp. Mar. Biol. Ecol. 2000, 249, 145–163. [Google Scholar] [CrossRef]
- Shields, E.; Weidman, C. A quantitative approach to characterizing hypoxic events. J. Coast. Res. 2008, 10055, 50–58. [Google Scholar] [CrossRef]
- Chislock, M.F.; Doster, E.; Zitomer, R.A.; Wilson, A.E. Eutrophication: Causes, consequences, and controls in aquatic ecosystems. Nat. Educ. Knowl. 2013, 4, 10. Available online: https://www.nature.com/scitable/knowledge/library/eutrophication-causes-consequences-and-controls-in-aquatic-102364466/ (accessed on 1 October 2022).
- Hamilton, D.P.; Salmaso, N.; Paerl, H.W. Mitigating harmful cyanobacterial blooms: Strategies for control of nitrogen and phosphorus loads. Aquat. Ecol. 2016, 50, 351–366. [Google Scholar] [CrossRef]
- Brown, L.H. The breeding behaviour of the lesser flamingo Phoeniconaias minor. Ibis 1971, 113, 147–172. [Google Scholar] [CrossRef]
- Ballot, A.; Krienitz, L.; Kotut, K.; Wiegand, C.; Metcalf, J.S.; Codd, G.A.; Pflugmacher, S. Cyanobacteria and cyanobacterial toxins in three alkaline Rift Valley lakes of Kenya—Lakes Bogoria, Nakuru and Elmenteita. J. Plankton Res. 2004, 26, 925–935. [Google Scholar] [CrossRef]
- URT. Wildlife Division. Tanzania National Single Species Action Plan for the Conservation of Lesser Flamingo (Phoeniconaias minor); Ministry of Natural Resources and Tourism: Dar es Salaam, Tanzania, 2010.
- Spears, B.M.; Hamilton, D.P.; Pan, Y.; Zhaosheng, C.; May, L. Lake management: Is prevention better than cure? Inland Waters 2022, 12, 173–186. [Google Scholar] [CrossRef]
- Amer, A.S.; Clokie, M.R.; Junaideen, M.I.; Tebbs, E.J.; Chebii, E.; Pacini, N.; Harper, D.M. Towards understanding lesser flamingo unpredictability in East Africa; what might cause crashes of their major food item at a lake? Flamingo J. IUCN SSC/Wetl. Int. Flamingo Spec. Group 2018, e1, 71. [Google Scholar]
- Watson, S.B.; Whitton, B.A.; Higgins, S.N.; Paerl, H.W.; Brooks, B.W.; Wehr, J.D. Chapter 20-Harmful Algal Blooms. In Freshwater Algae of North America, 2nd ed.; Wehr, J.D., Sheath, R.G., Kociolek, J.P., Eds.; Academic Press: Boston, MA, USA, 2015; pp. 873–920. [Google Scholar] [CrossRef]


Publisher’s Note: MDPI stays neutral with regard to jurisdictional claims in published maps and institutional affiliations. |
© 2022 by the authors. Licensee MDPI, Basel, Switzerland. This article is an open access article distributed under the terms and conditions of the Creative Commons Attribution (CC BY) license (https://creativecommons.org/licenses/by/4.0/).