
Pesticide Contamination of Surface and Groundwater in an Ethiopian Highlands’ Watershed

 ,
,  , ,
, , 

Abstract
1. Introduction
2. Materials and Methods
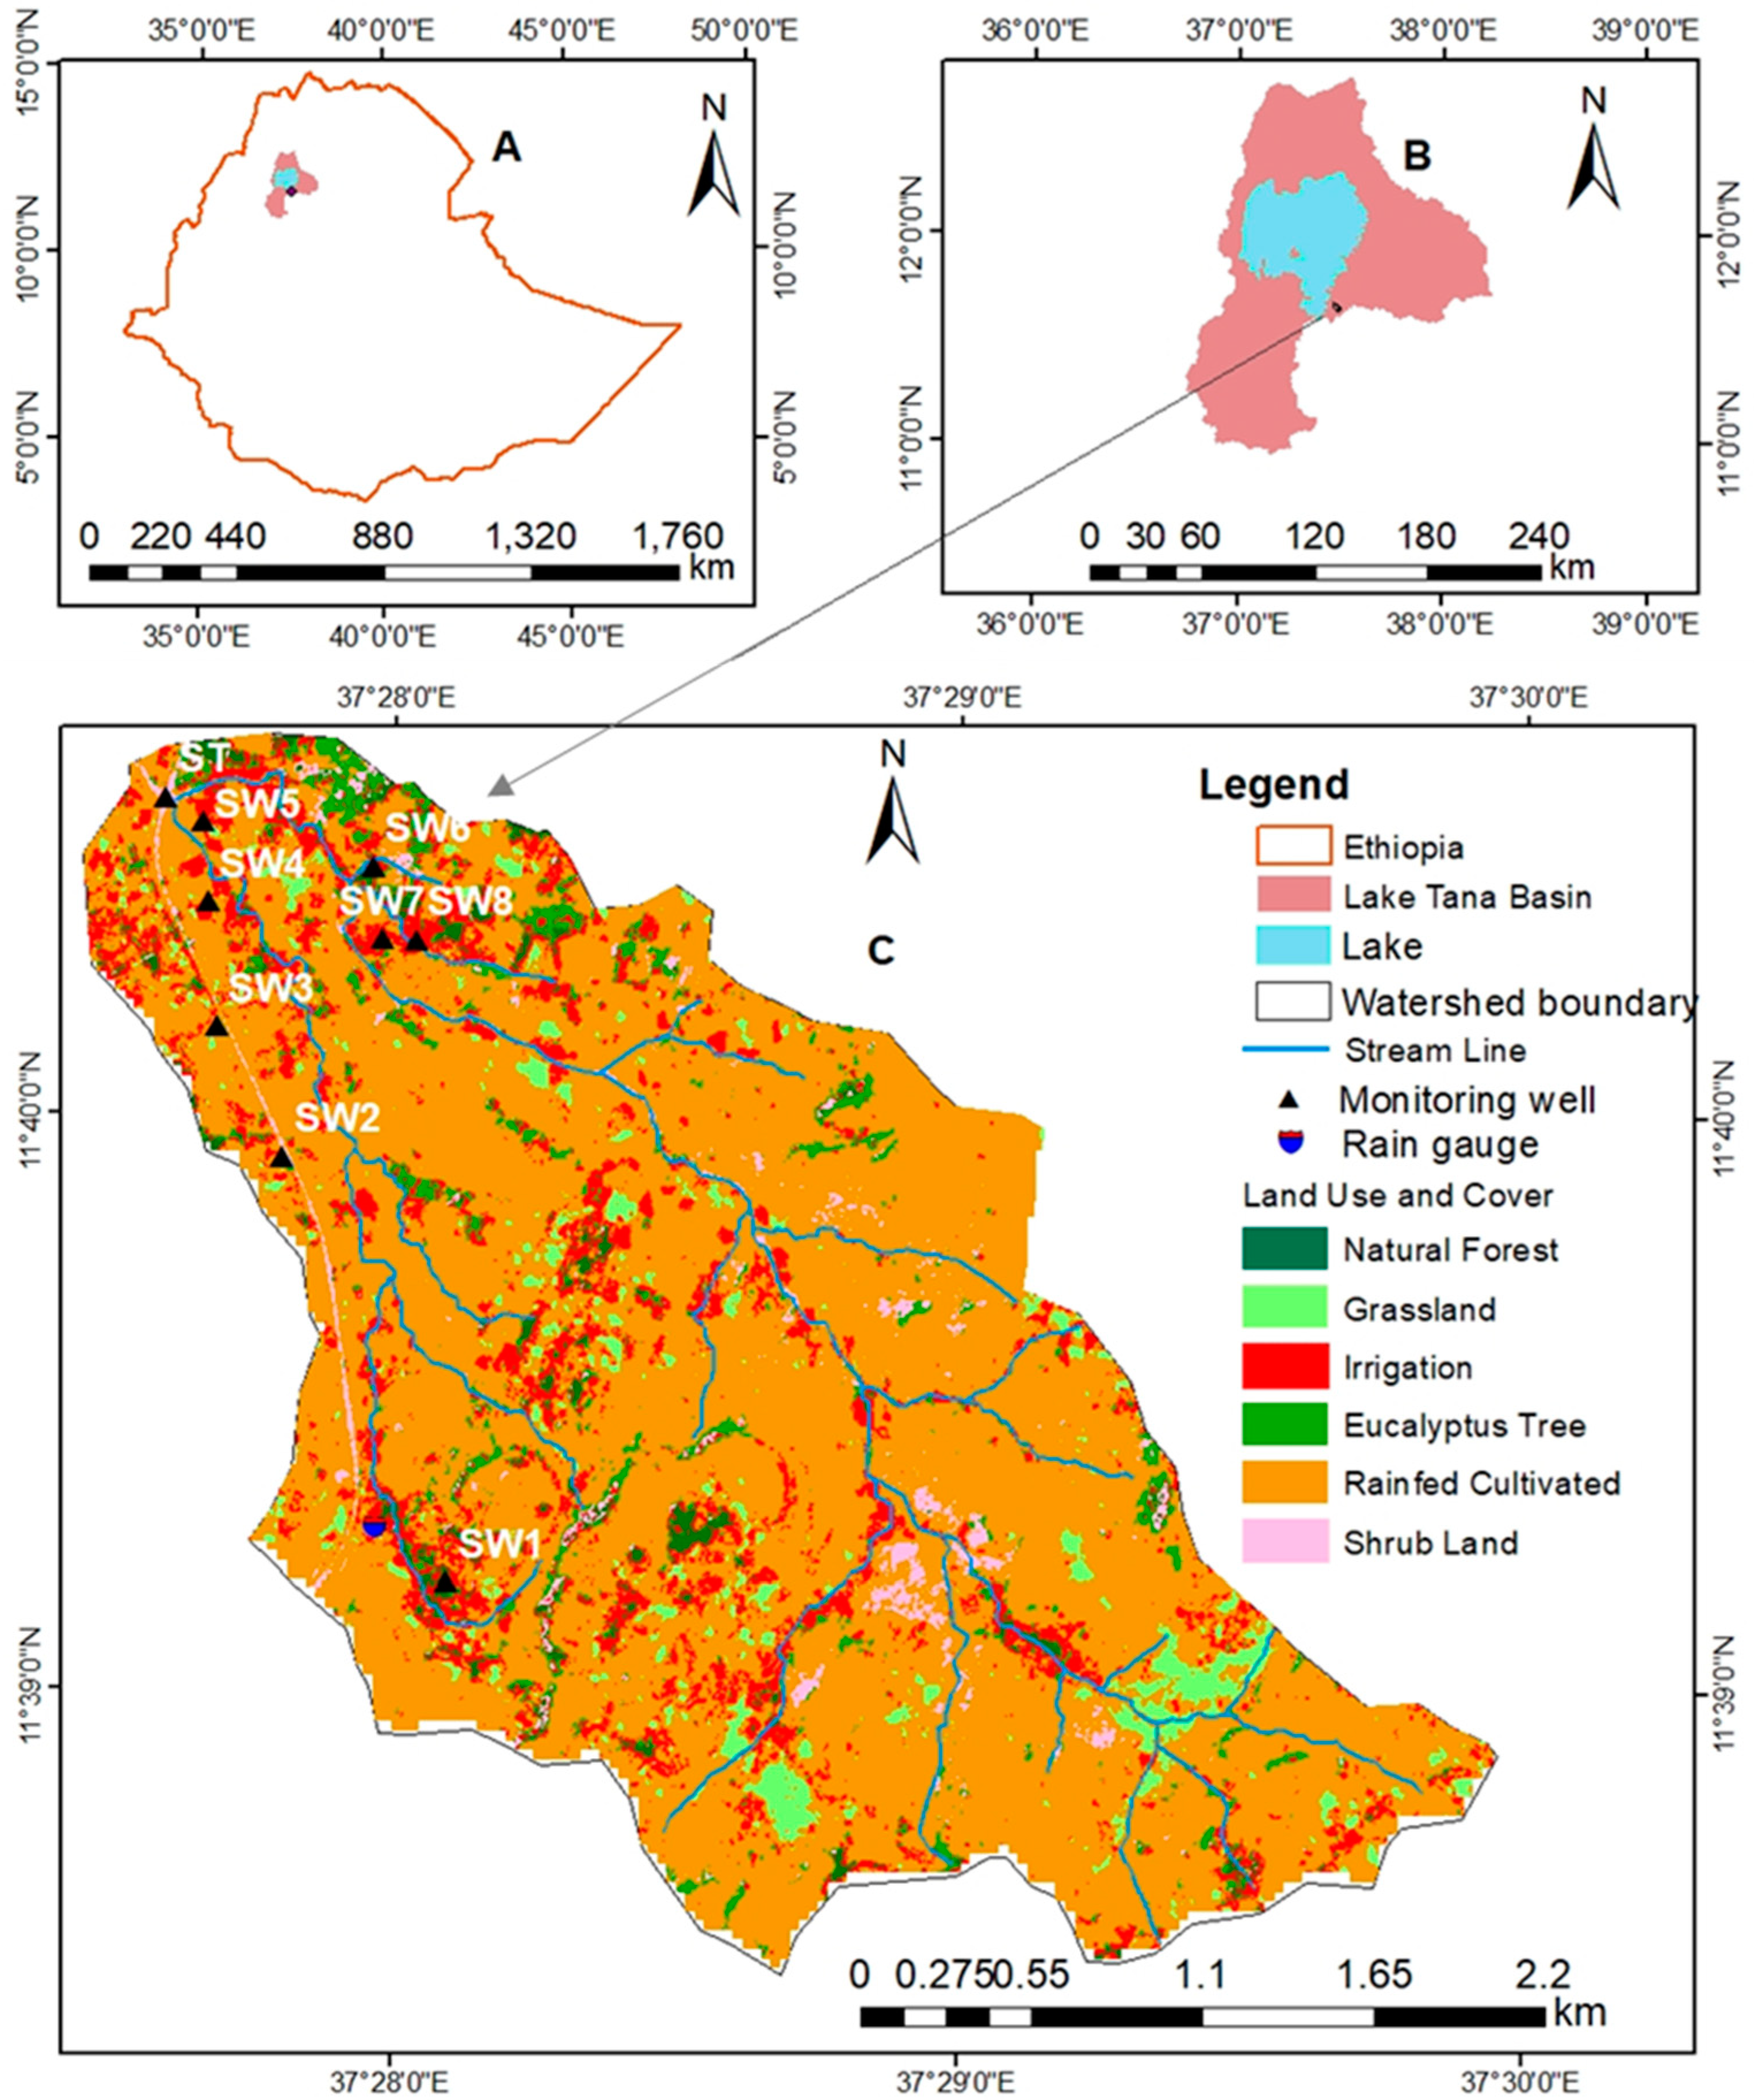
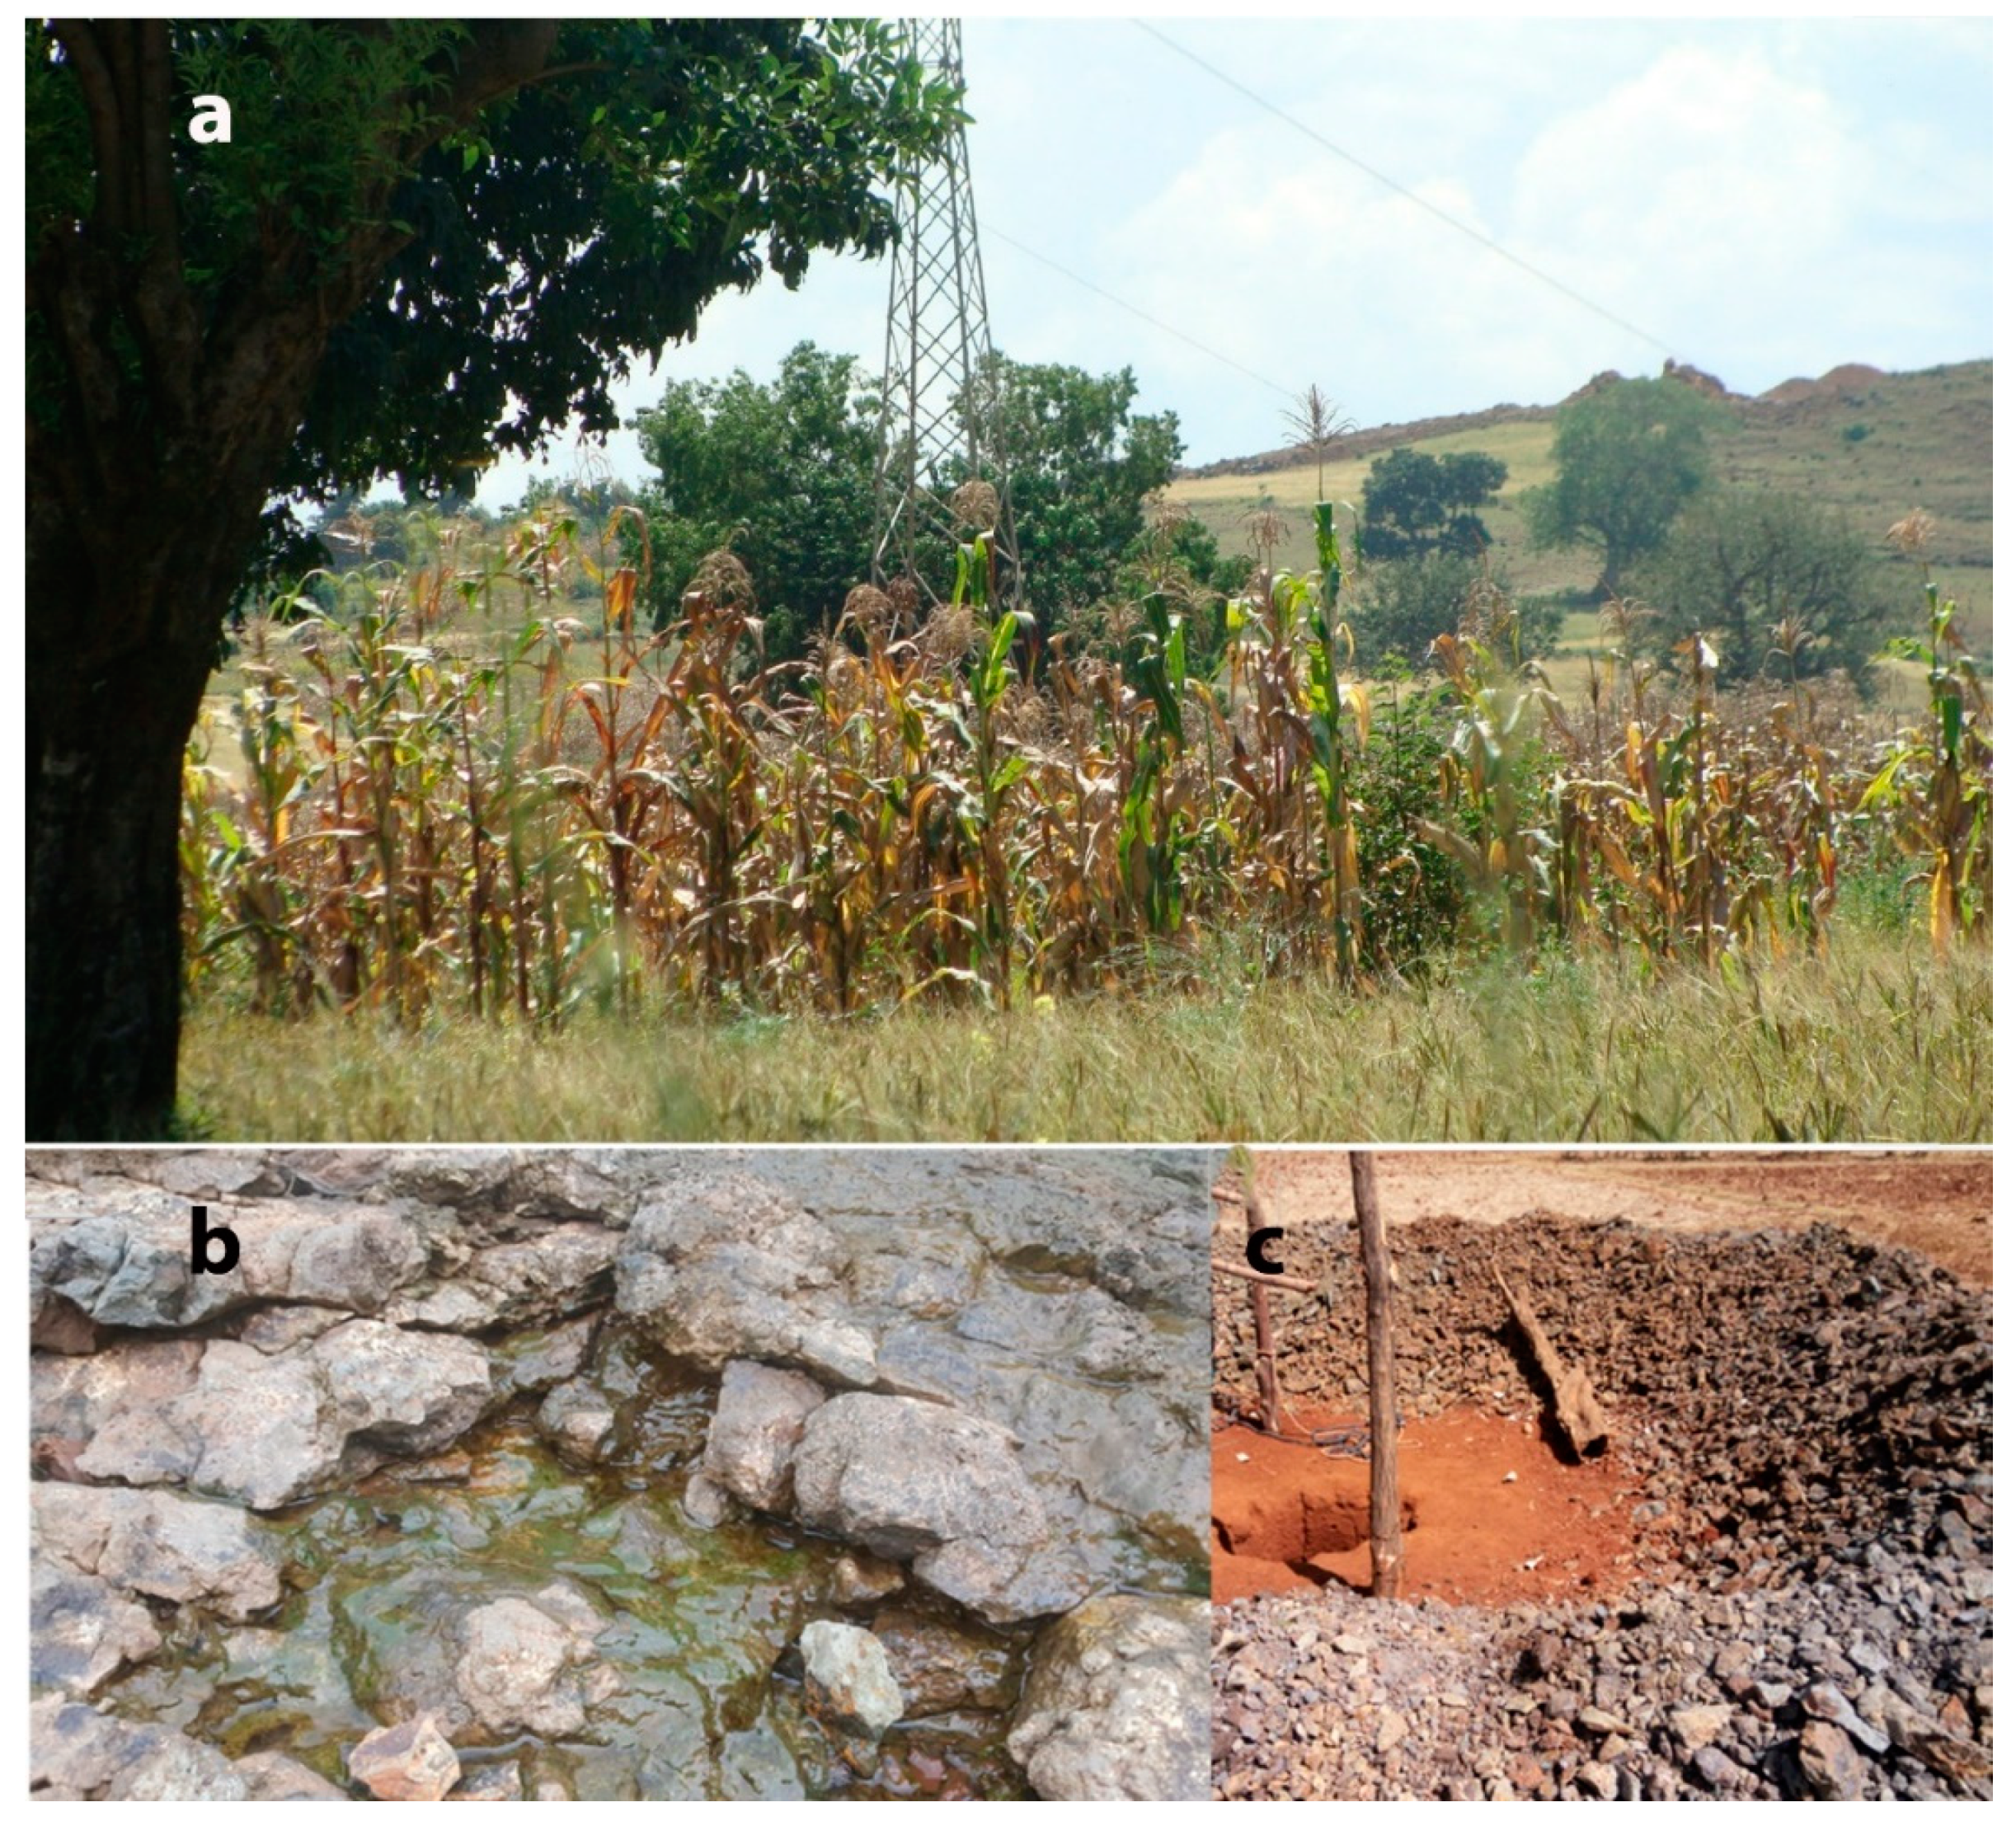
2.1. Description of the Study Area
2.2. Data Collection
2.2.1. Pesticide Application Data Collection
2.2.2. Water Sample Collection
2.3. Risk Assessment
2.3.1. Aquatic Life Risk Assessment of Pesticides in Surface Water
2.3.2. Human Health Risk Assessment of Pesticides in Groundwater
2.4. Statistical Analysis
2.5. Chemical Analysis Methods
2.6. Quality Control and Assurance
3. Results
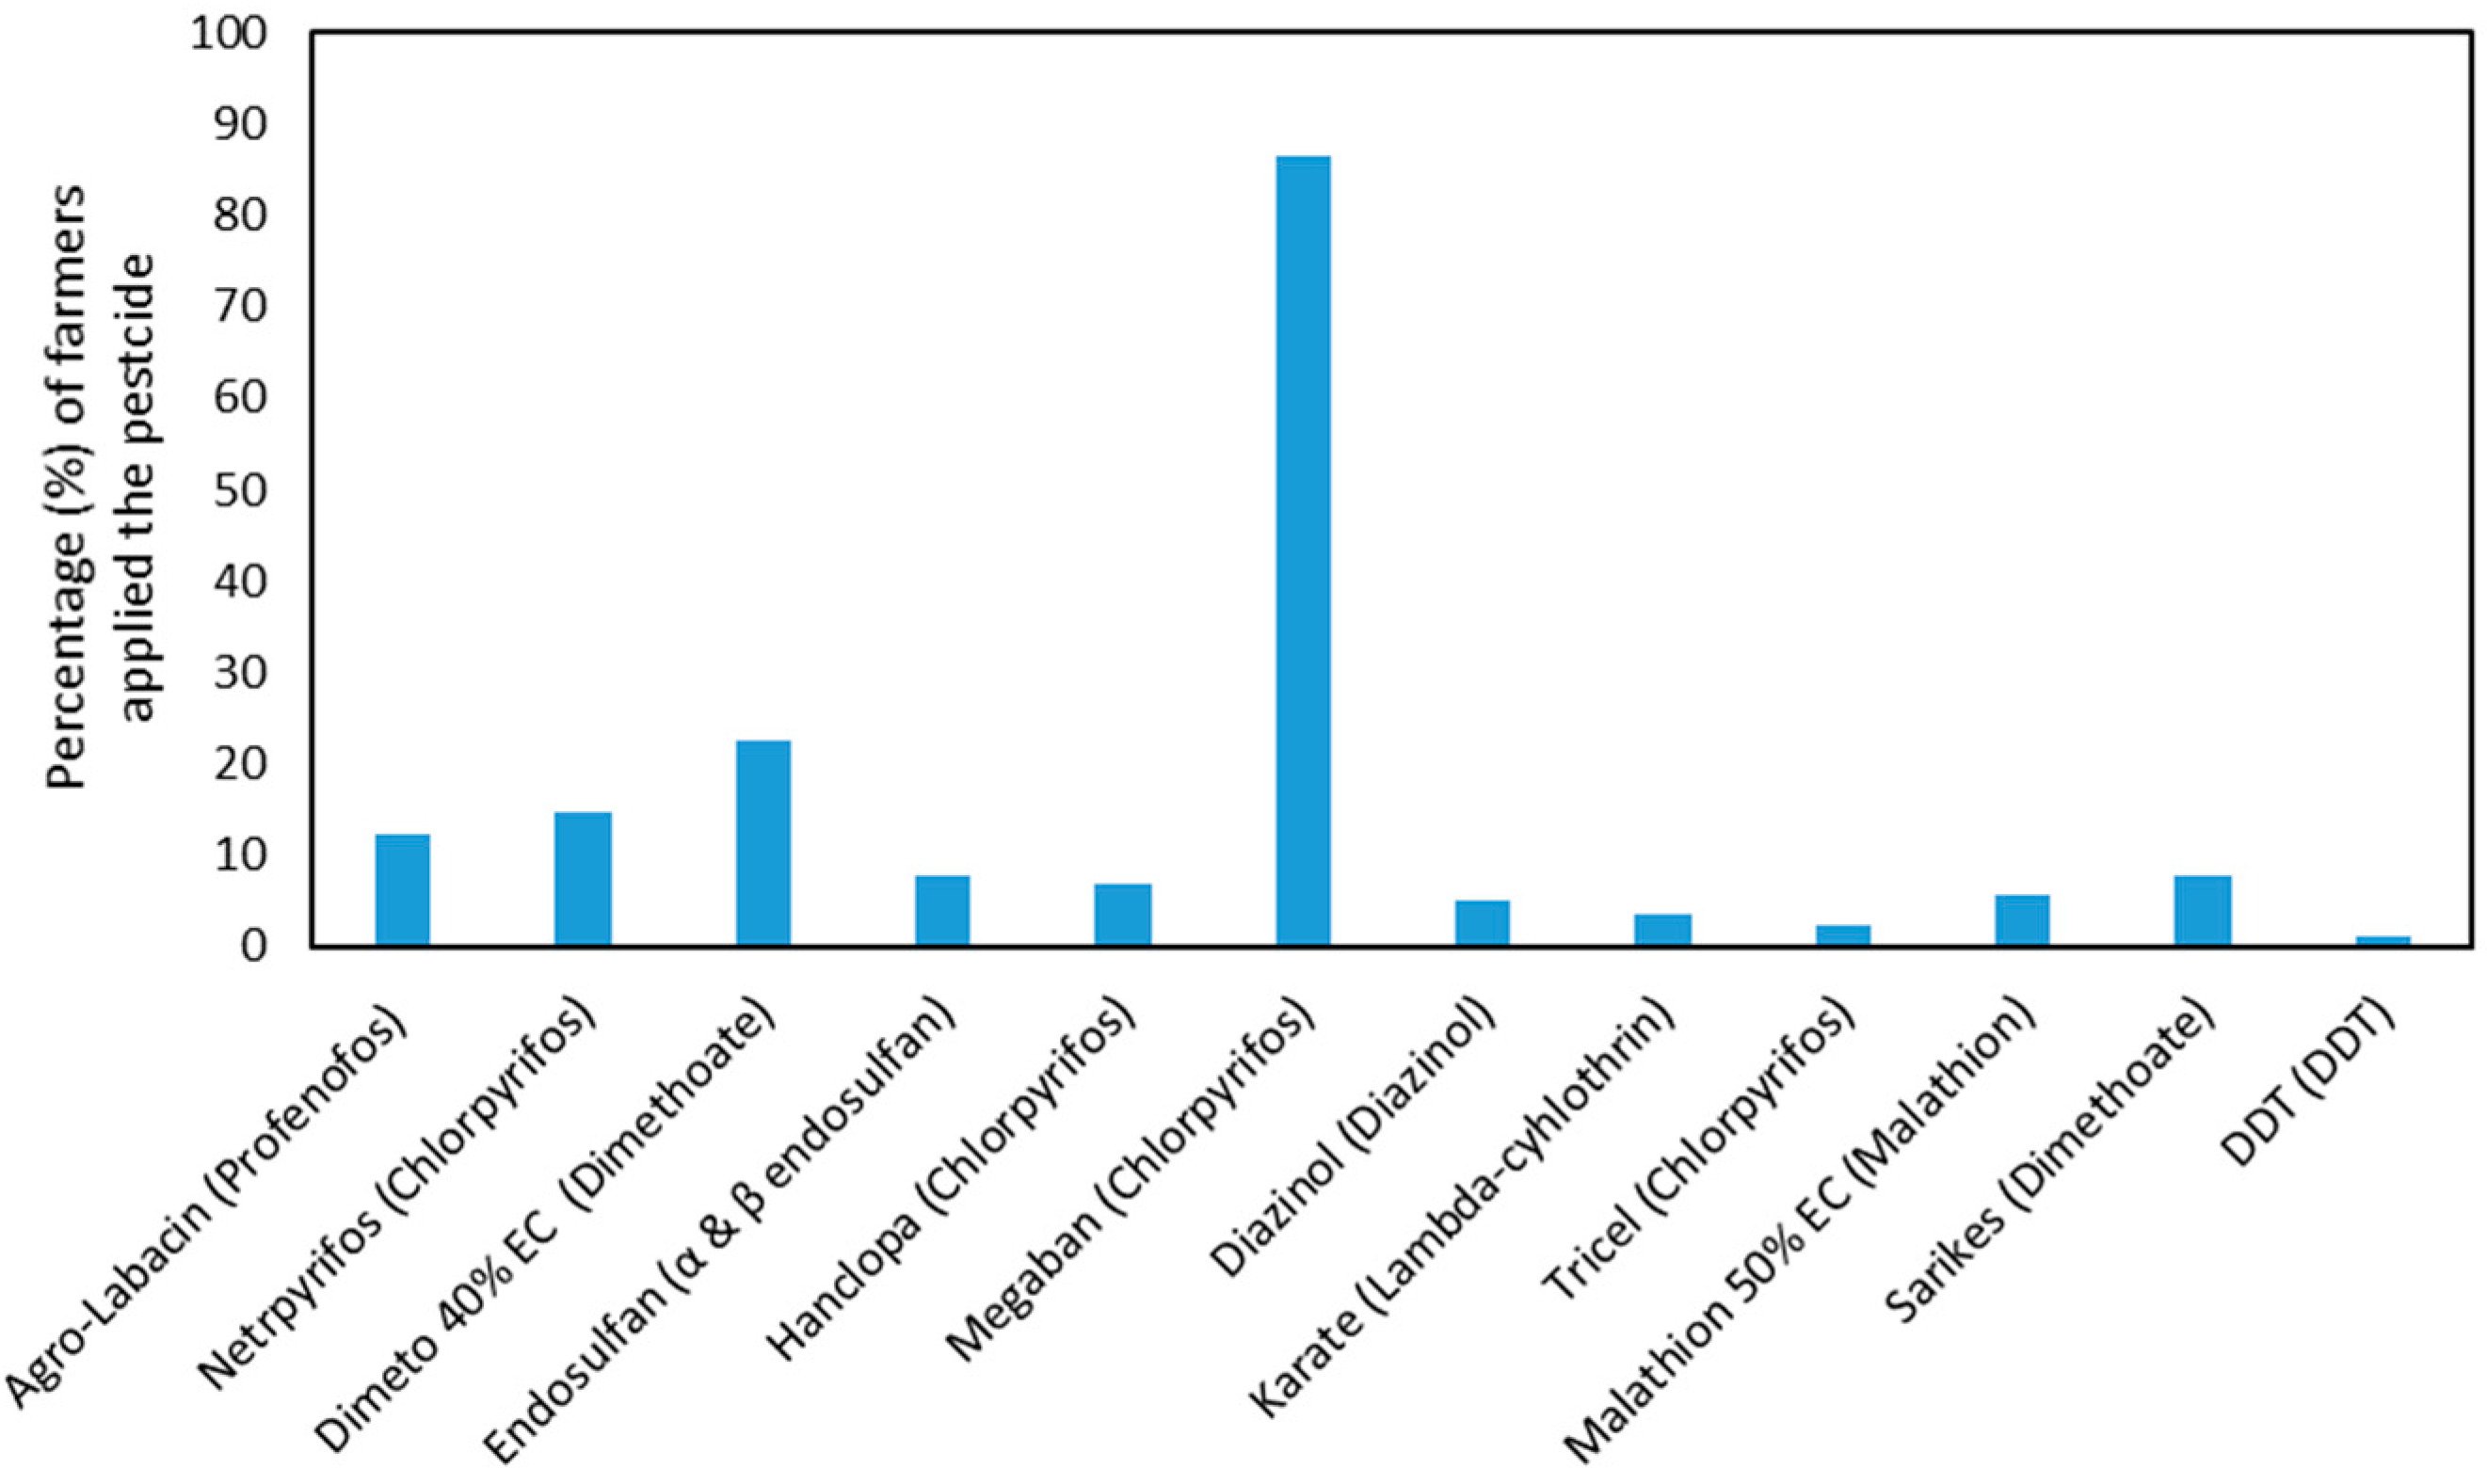
3.1. Pesticide Use
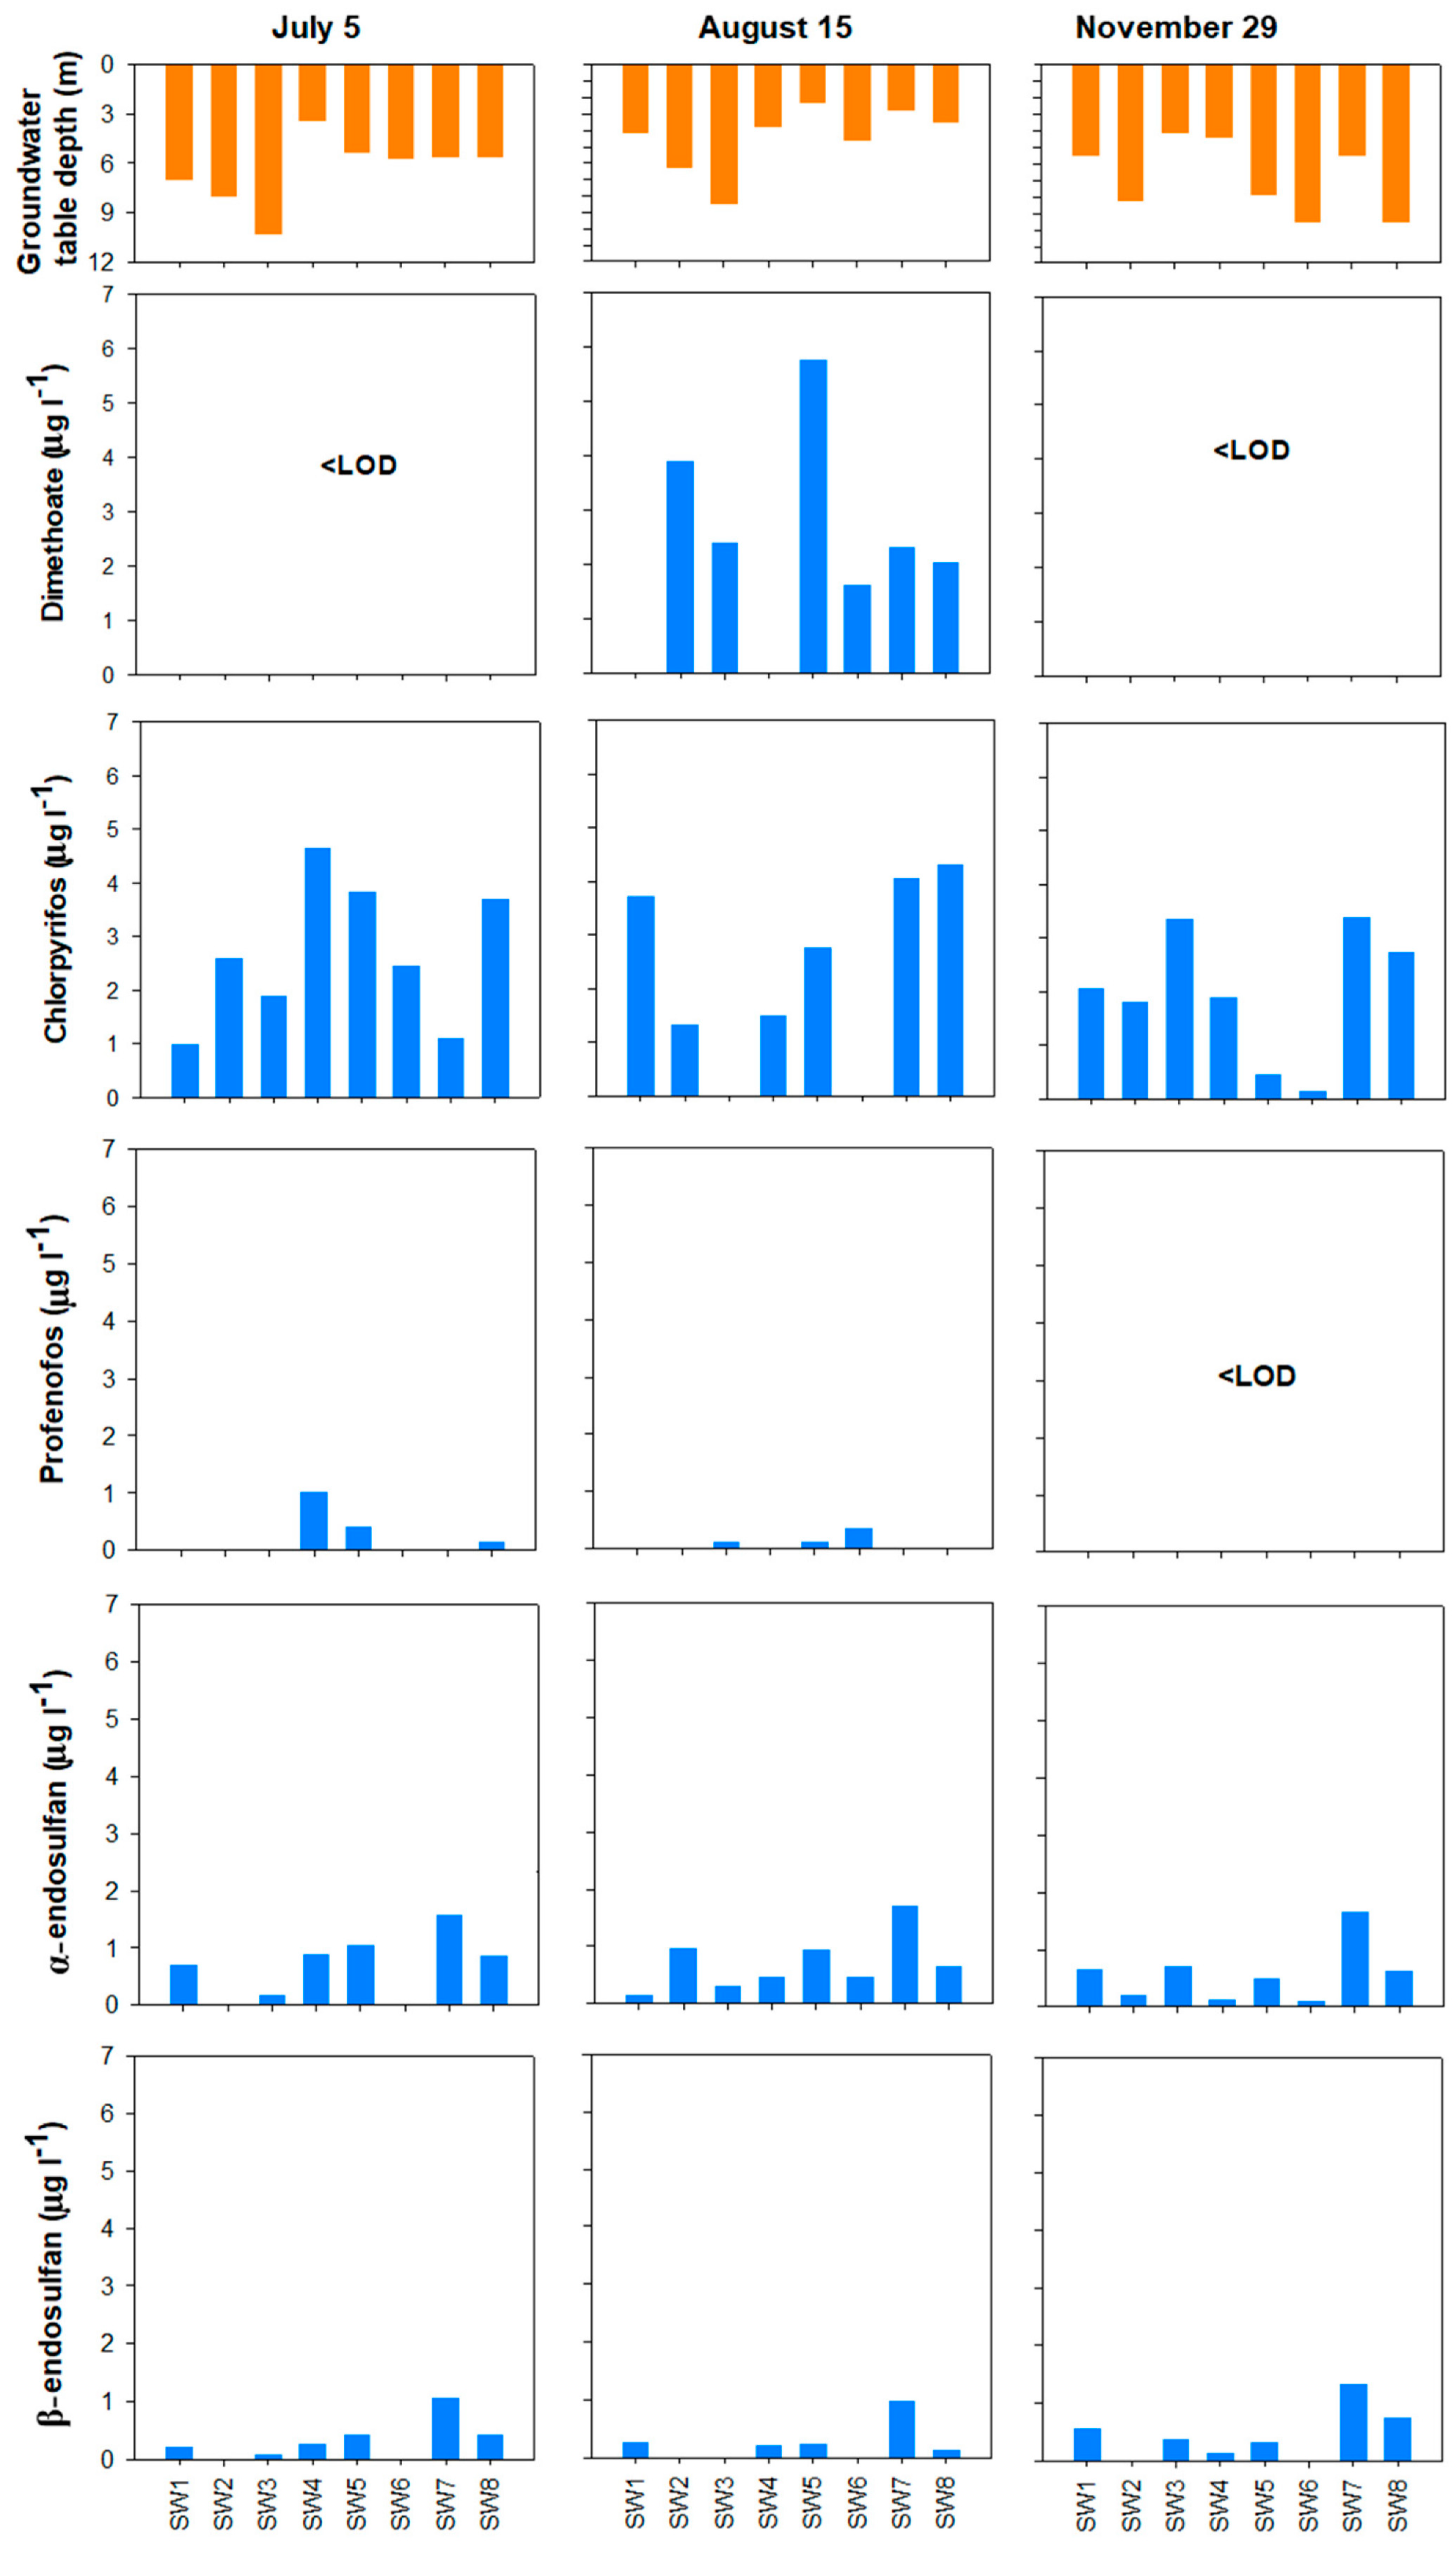
3.2. Concentration of Pesticides in Groundwater
3.2.1. Transport from Surface to Groundwater
3.2.2. Degradation
3.2.3. Relationship with Other Variables
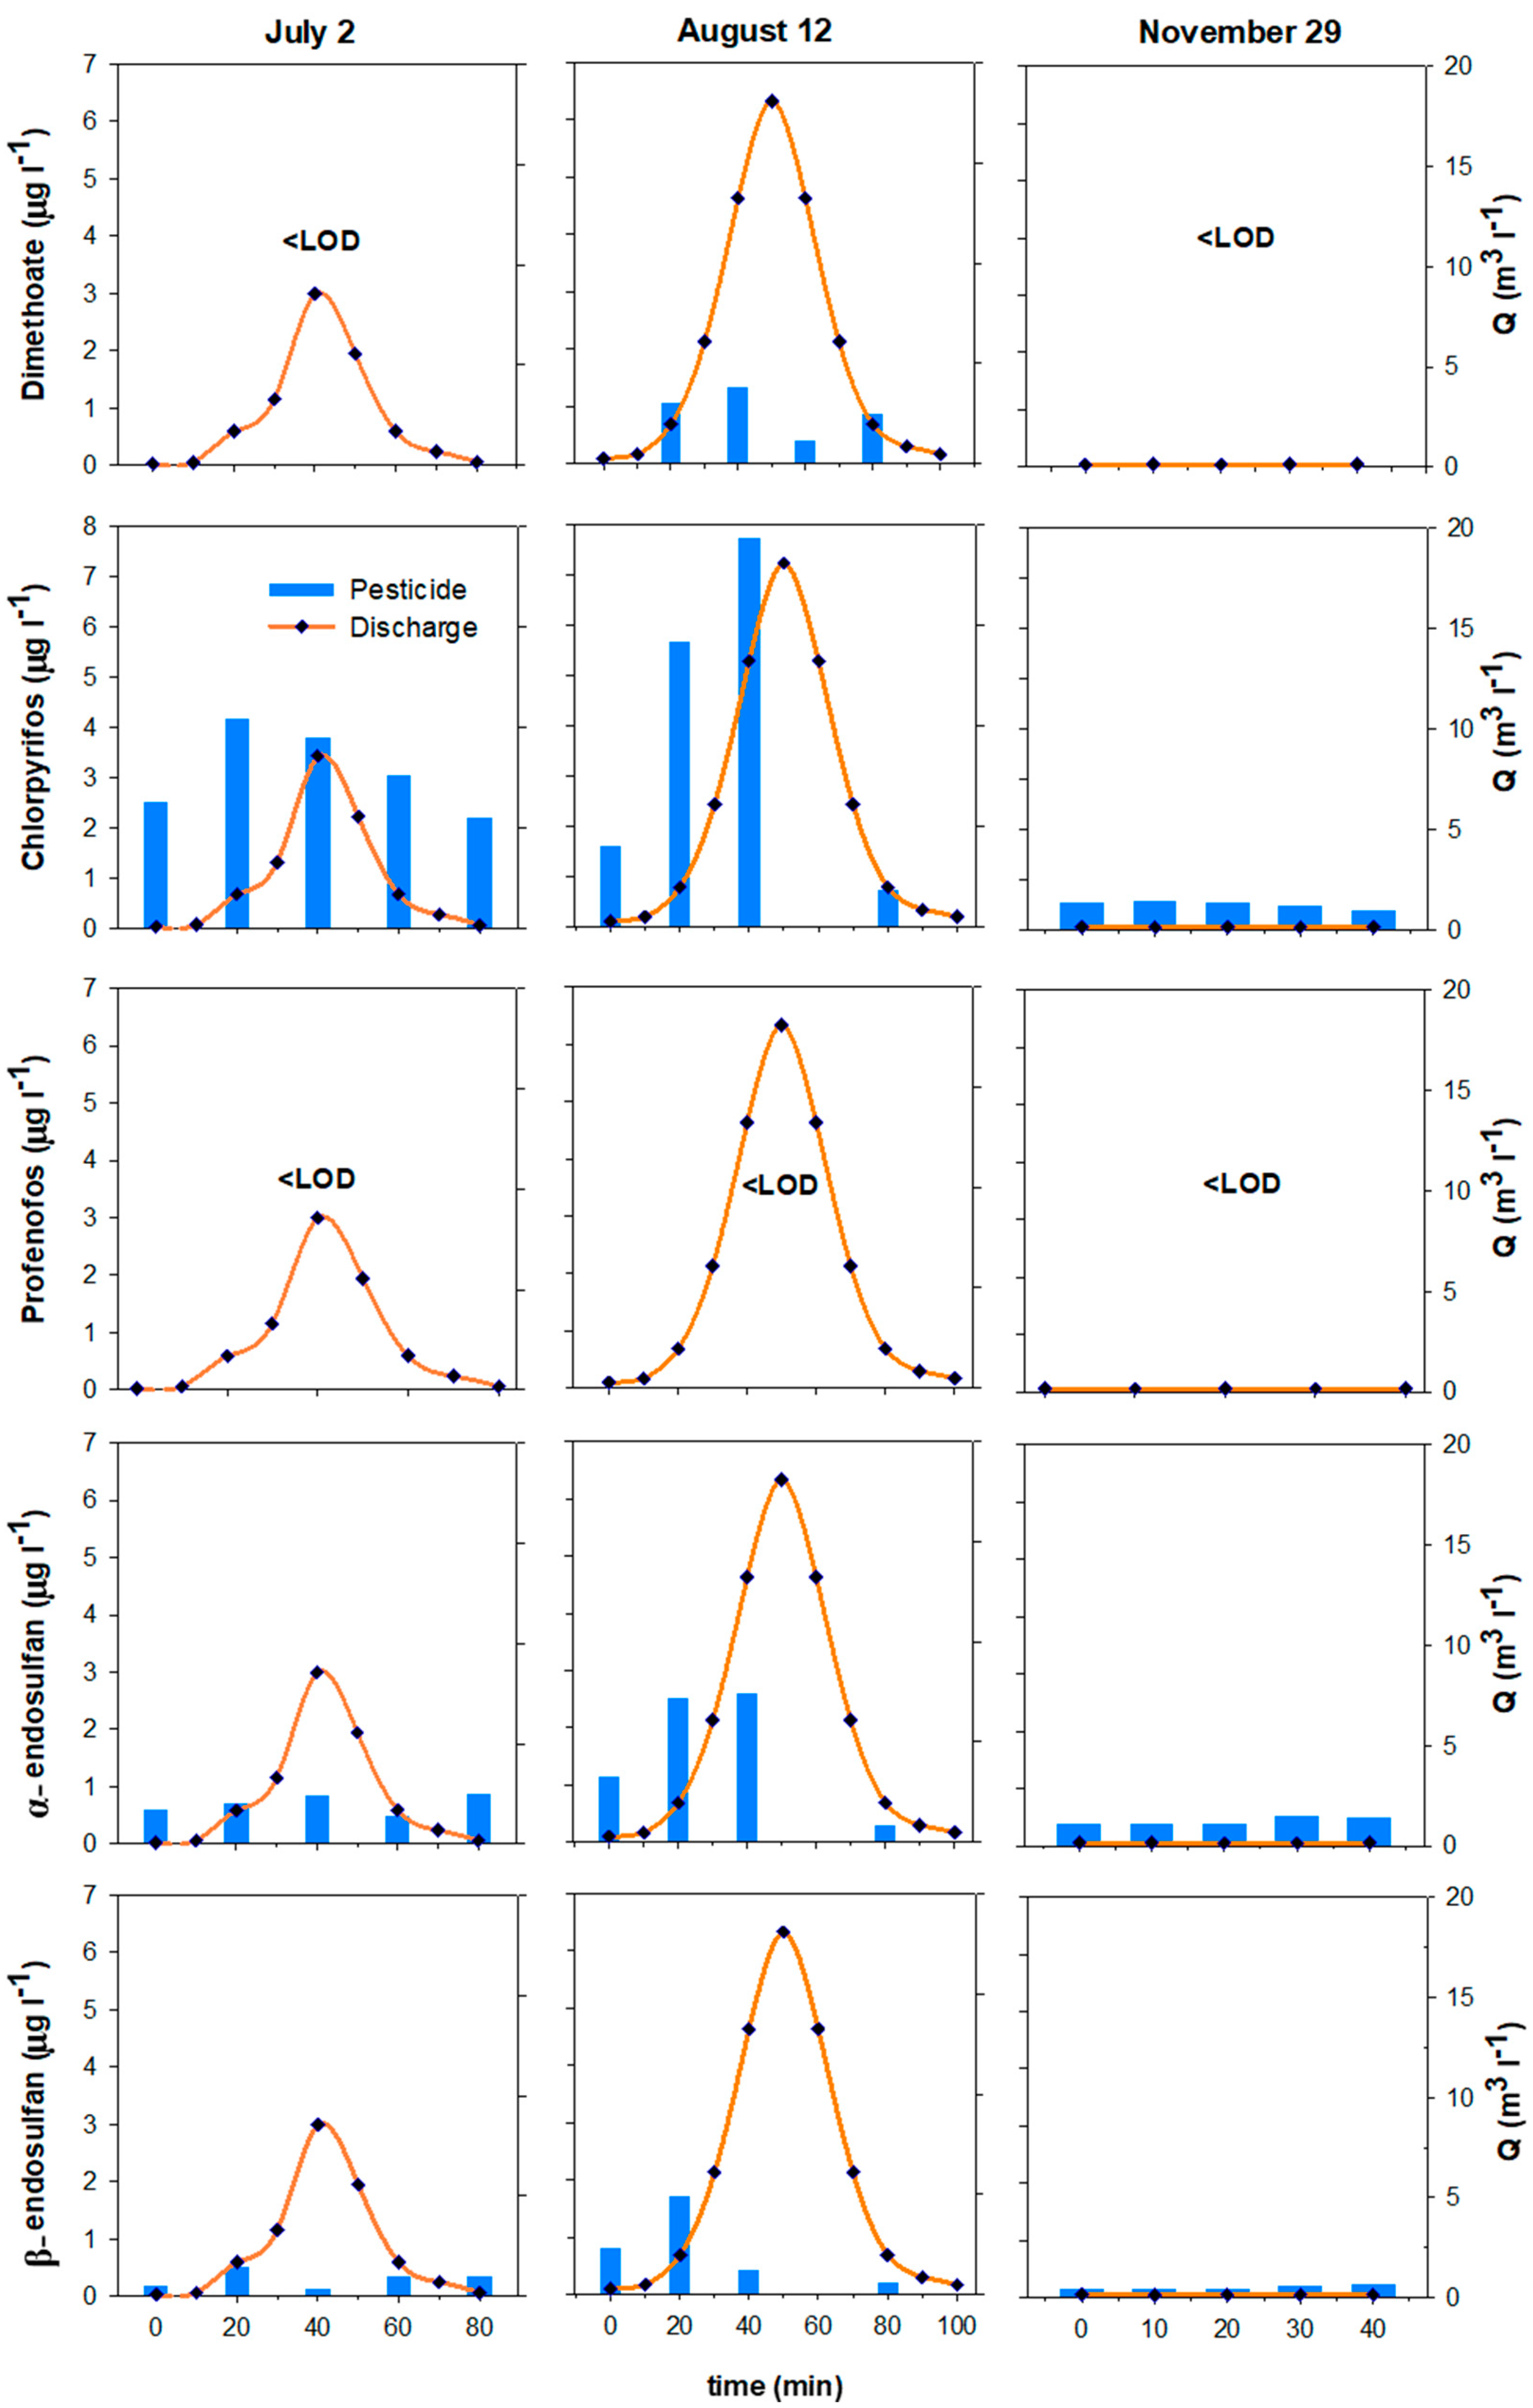
3.3. Concentrations of Pesticides in Surface Water
4. Discussion
4.1. Comparison with Published Pesticide Concentrations in Groundwater and Surface Water
4.2. Farmers’ Awareness of Pesticides Use and Management
4.3. Risk Assessment
4.3.1. Human Health Risk Assessment of Pesticides in Groundwater
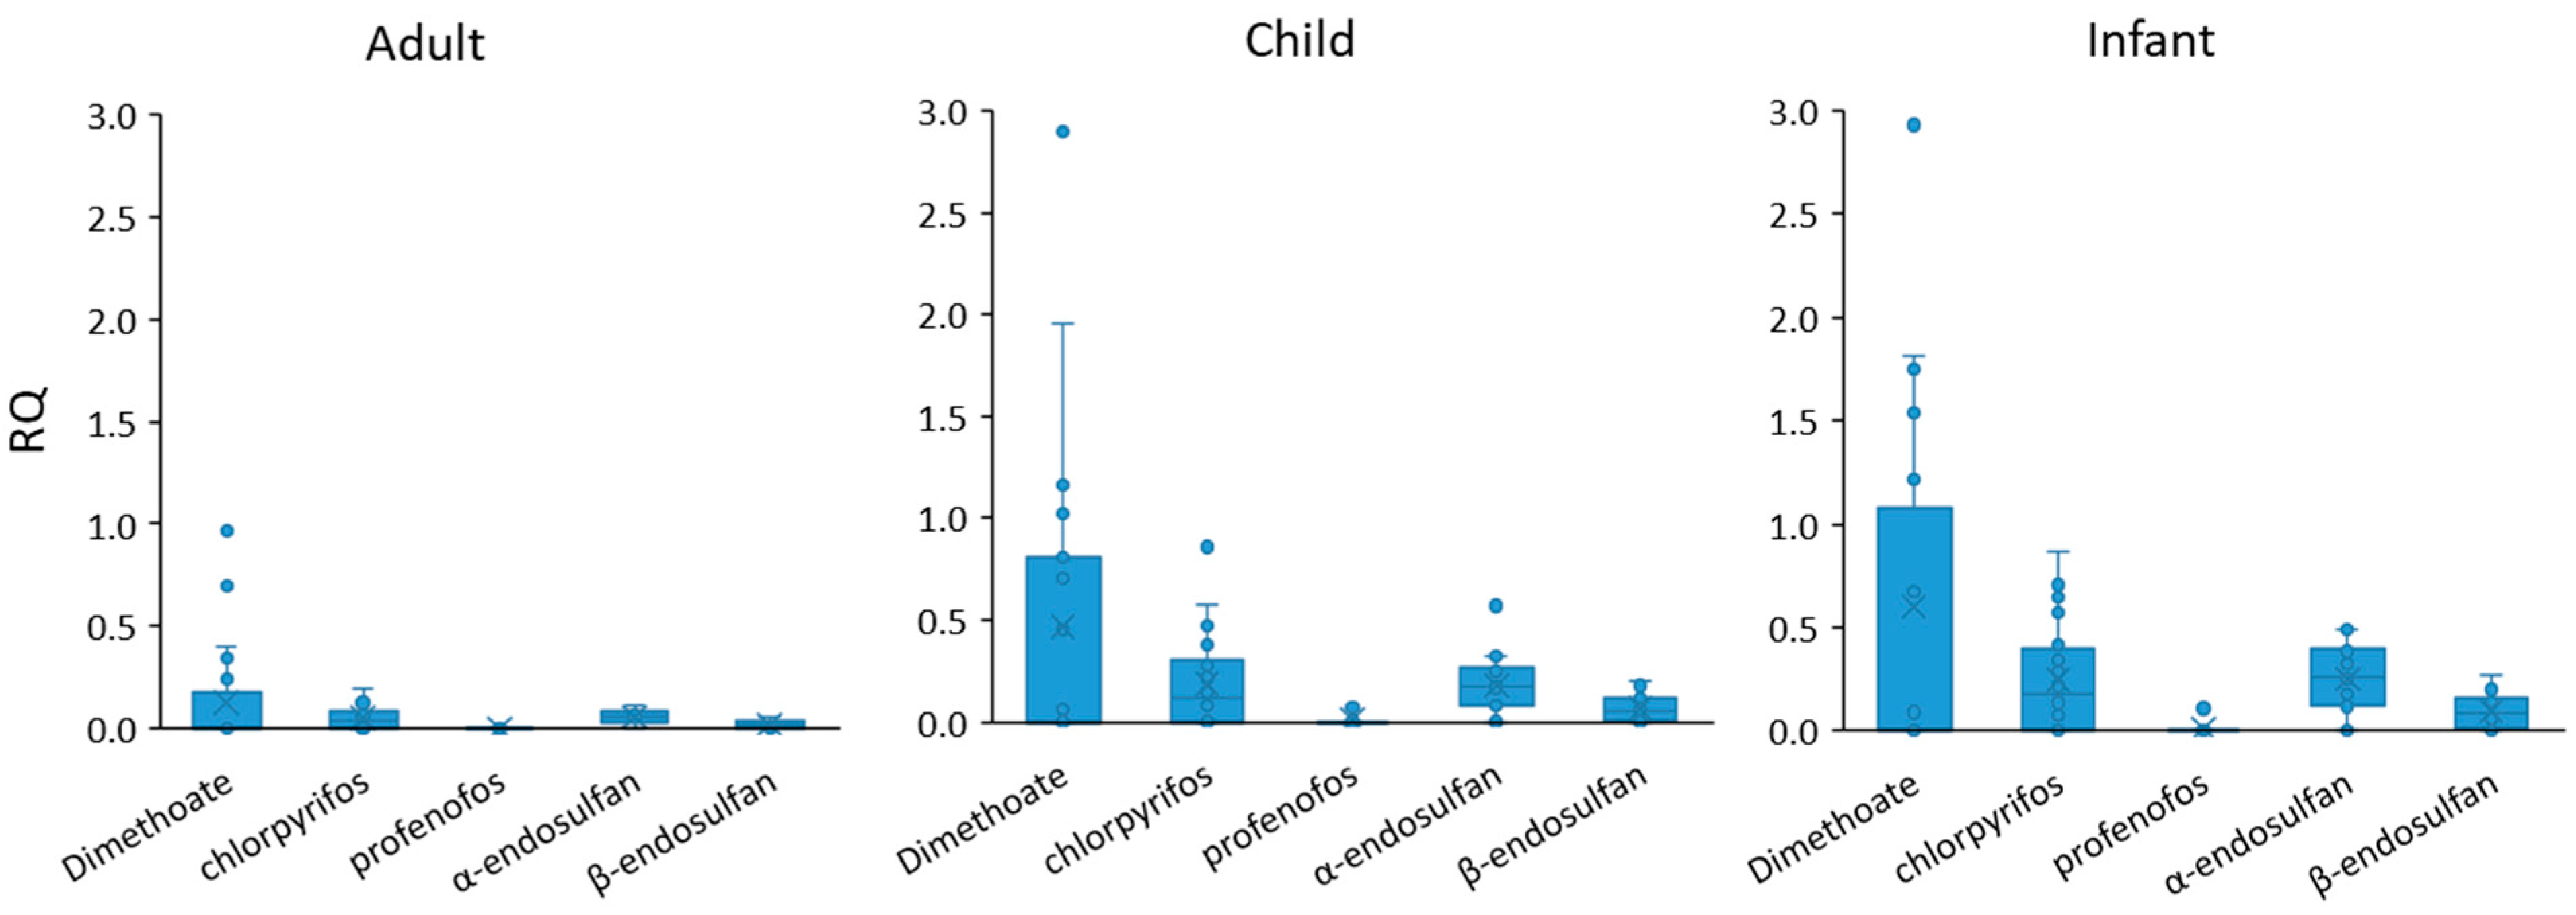
4.3.2. Eco-Toxicity Risk Assessment of Pesticides in Surface Water
5. Conclusions
Supplementary Materials
Author Contributions
Funding
Data Availability Statement
Acknowledgments
Conflicts of Interest
References
- Sousa, J.C.G.; Ribeiro, A.R.; Barbosa, M.O.; Pereira, M.F.R.; Silva, A.M.T. A review on environmental monitoring of water organic pollutants identified by EU guidelines. J. Hazard. Mater. 2018, 344, 146–162. [Google Scholar] [CrossRef] [PubMed]
- Nyenje, P.; Foppen, J.; Uhlenbrook, S.; Kulabako, R.; Muwanga, A. Eutrophication and nutrient release in urban areas of sub-Saharan Africa—A review. Sci. Total Environ. 2010, 408, 447–455. [Google Scholar] [CrossRef] [PubMed]
- Li, Y.; Ni, L.; Guo, Y.; Zhao, X.; Dong, Y.; Cheng, Y. Challenges and Opportunities to Treat Water Pollution. In Paths to Clean Water Under Rapid Changing Environment in China; Li, Y., Ni, L., Guo, Y., Zhao, X., Dong, Y., Cheng, Y., Eds.; Springer Nature: Singapore, 2022; pp. 13–42. [Google Scholar]
- Parris, K. Impact of Agriculture on Water Pollution in OECD Countries: Recent Trends and Future Prospects. Int. J. Water Resour. Dev. 2011, 27, 33–52. [Google Scholar] [CrossRef]
- Gad, M.; Saleh, A.H.; Hussein, H.; Farouk, M.; Elsayed, S. Appraisal of Surface Water Quality of Nile River Using Water Quality Indices, Spectral Signature and Multivariate Modeling. Water 2022, 14, 1131. [Google Scholar] [CrossRef]
- Sharma, A.; Kumar, V.; Shahzad, B.; Tanveer, M.; Sidhu, G.P.S.; Handa, N.; Kohli, S.K.; Yadav, P.; Bali, A.S.; Parihar, R.D.; et al. Worldwide pesticide usage and its impacts on ecosystem. SN Appl. Sci. 2019, 1, 1446. [Google Scholar] [CrossRef]
- Snyder, J.; Smart, J.; Goeb, J.; Tschirley, D. Pesticide Use in Sub-Saharan Africa: Estimates, Projections, and Implications in the Context of Food System Transformation; IIAM Research Report; Michgan State University: East Lansing, MI, USA, 2015. [Google Scholar]
- Popp, J.; Pető, K.; Nagy, J. Pesticide productivity and food security. A review. Agron. Sustain. Dev. 2013, 33, 243–255. [Google Scholar] [CrossRef]
- Tudi, M.; Daniel Ruan, H.; Wang, L.; Lyu, J.; Sadler, R.; Connell, D.; Chu, C.; Phung, D.T. Agriculture Development, Pesticide Application and Its Impact on the Environment. Int. J. Environ. Res. Public Health 2021, 18, 1112. [Google Scholar] [CrossRef] [PubMed]
- CABI African Crop Epidemiology System. Available online: https://www.cabi.org/projects/food-security/tackling-pests-diseases/ (accessed on 7 June 2022).
- Food and Agriculture Organization (FAO). Pesticides Indicators; Food and Agriculture Organization: Rome, Italy, 2021. [Google Scholar]
- Central Statistical Agency (CSA). Farm Management Practices; The Federal Democratic Republic of Ethiopia Central Statistical Agency (CSA): Addis Ababa, Ethiopia, 2021. [Google Scholar]
- Kumela, T.; Simiyu, J.; Sisay, B.; Likhayo, P.; Mendesil, E.; Gohole, L.; Tefera, T. Farmers’ knowledge, perceptions, and management practices of the new invasive pest, fall armyworm (Spodoptera frugiperda) in Ethiopia and Kenya. Int. J. Pest Manag. 2019, 65, 1–9. [Google Scholar] [CrossRef]
- Feldmann, F.; Rieckmann, U.; Winter, S. The spread of the fall armyworm Spodoptera frugiperda in Africa—What should be done next? J. Plant Dis. Prot. 2019, 126, 97–101. [Google Scholar] [CrossRef]
- Sishu, F.K.; Thegaye, E.K.; Schmitter, P.; Habtu, N.G.; Tilahun, S.A.; Steenhuis, T.S. Endosulfan pesticide dissipation and residue levels in khat and onion in a sub-humid region of Ethiopia. In Proceedings of the International Conference on Advances of Science and Technology, Bahir Dar, Ethiopia, 2–4 August 2019; Springer: Berlin/Heidelberg, Germany; pp. 16–28. [Google Scholar]
- Teklu, B.M.; Haileslassie, A.; Mekuria, W. Pesticides as water pollutants and level of risks to environment and people: An example from Central Rift Valley of Ethiopia. Environ. Dev. Sustain. 2022, 24, 5275–5294. [Google Scholar] [CrossRef]
- Negatu, B.; Kromhout, H.; Mekonnen, Y.; Vermeulen, R. Use of Chemical Pesticides in Ethiopia: A Cross-Sectional Comparative Study on Knowledge, Attitude and Practice of Farmers and Farm Workers in Three Farming Systems. Ann. Occup. Hyg. 2016, 60, 551–566. [Google Scholar] [CrossRef] [PubMed]
- Afata, T.N.; Mekonen, S.; Shekelifa, M.; Tucho, G.T. Prevalence of Pesticide Use and Occupational Exposure Among Small-Scale Farmers in Western Ethiopia. Environ. Health Insights 2022, 16, 11786302211072950. [Google Scholar] [CrossRef] [PubMed]
- Endalew, M.; Gebrehiwot, M.; Dessie, A. Pesticide Use Knowledge, Attitude, Practices and Practices Associated Factors Among Floriculture Workers in Bahirdar City, North West, Ethiopia, 2020. Environ. Health Insights 2022, 16, 11786302221076250. [Google Scholar] [CrossRef] [PubMed]
- Fikre Lemessa, O.; Fikadu Mitiku, A.; Gezahegn Berecha, Y.; Adugna Eneyew, B. Smallholder farmers’ knowledge, perception and practice in pesticide use in South Western Ethiopia. J. Agric. Environ. Int. Dev. (JAEID) 2016, 110, 307–323. [Google Scholar]
- Mengistie, B.T.; Mol, A.P.J.; Oosterveer, P. Pesticide use practices among smallholder vegetable farmers in Ethiopian Central Rift Valley. Environ. Dev. Sustain. 2017, 19, 301–324. [Google Scholar] [CrossRef]
- Mekonen, S.; Ambelu, A.; Spanoghe, P. Pesticide residue evaluation in major staple food items of Ethiopia using the QuEChERS method: A case study from the Jimma Zone. Environ. Toxicol. Chem. 2014, 33, 1294–1302. [Google Scholar] [CrossRef]
- Yohannes, Y.B.; Ikenaka, Y.; Nakayama, S.M.M.; Saengtienchai, A.; Watanabe, K.; Ishizuka, M. Organochlorine pesticides and heavy metals in fish from Lake Awassa, Ethiopia: Insights from stable isotope analysis. Chemosphere 2013, 91, 857–863. [Google Scholar] [CrossRef]
- Yohannes, Y.B.; Ikenaka, Y.; Saengtienchai, A.; Watanabe, K.P.; Nakayama, S.M.M.; Ishizuka, M. Concentrations and human health risk assessment of organochlorine pesticides in edible fish species from a Rift Valley lake—Lake Ziway, Ethiopia. Ecotoxicol. Environ. Saf. 2014, 106, 95–101. [Google Scholar] [CrossRef]
- Groot, M.J.; van’t Hooft, K.E. The Hidden Effects of Dairy Farming on Public and Environmental Health in the Netherlands, India, Ethiopia, and Uganda, Considering the Use of Antibiotics and Other Agro-chemicals. Front. Public Health 2016, 4, 12. [Google Scholar] [CrossRef]
- Jansen, H.; Harmsen, J. Pesticide Monitoring in the Central Rift Valley 2009–2010: Ecosystems for Water in Ethiopia; Alterra: Wageningen, The Netherlands, 2011; pp. 1566–7197. [Google Scholar]
- Loha, K.M.; Lamoree, M.; de Boer, J. Pesticide residue levels in vegetables and surface waters at the Central Rift Valley (CRV) of Ethiopia. Environ. Monit. Assess. 2020, 192, 546. [Google Scholar] [CrossRef]
- Mekonen, S.; Argaw, R.; Simanesew, A.; Houbraken, M.; Senaeve, D.; Ambelu, A.; Spanoghe, P. Pesticide residues in drinking water and associated risk to consumers in Ethiopia. Chemosphere 2016, 162, 252–260. [Google Scholar] [CrossRef] [PubMed]
- Merga, L.B.; Mengistie, A.A.; Alemu, M.T.; Van den Brink, P.J. Biological and chemical monitoring of the ecological risks of pesticides in Lake Ziway, Ethiopia. Chemosphere 2021, 266, 129214. [Google Scholar] [CrossRef] [PubMed]
- Teklu, B.M.; Hailu, A.; Wiegant, D.A.; Scholten, B.S.; Van den Brink, P.J. Impacts of nutrients and pesticides from small- and large-scale agriculture on the water quality of Lake Ziway, Ethiopia. Environ. Sci. Pollut. Res. 2018, 25, 13207–13216. [Google Scholar] [CrossRef]
- European Union (EU). COUNCIL DIRECTIVE 98/83/EC on the quality of water intended for human consumption. Off. J. Eur. Communities 1998, L330, 32–54. [Google Scholar]
- Plumpton, H.; Cornforth, R. Groundwater Country Profiles for Seven UpGro Consortium Project Countries in Africa. Available online: https://upgro.org/country-profiles/ethiopia/ (accessed on 23 October 2022).
- Pavelic, P.; Giordano, M.; Keraita, B.N.; Ramesh, V.; Rao, T. Groundwater Availability and Use in Sub-Saharan Africa: A Review of 15 Countries; International Water Management Institute: Colombo, Sri Lanka, 2012; p. 224. [Google Scholar]
- Chebud, Y.A.; Melesse, A.M. Modelling lake stage and water balance of Lake Tana, Ethiopia. Hydrol. Process. 2009, 23, 3534–3544. [Google Scholar] [CrossRef]
- Nagelkerke, L.A.J.; Mina, M.V.; Wudneh, T.; Sibbing, F.A.; Osse, J.W.M. In Lake Tana, a Unique Fish Fauna Needs Protection. Available online: https://link.gale.com/apps/doc/A17779579/HRCA?u=anon~6c1a8a5&sid=googleScholar&xid=f4d6e056 (accessed on 12 September 2022).
- Mengistu, A.A.; Aragaw, C.; Mengist, M.; Goshu, G. The Fish and the Fisheries of Lake Tana. In Social and Ecological System Dynamics: Characteristics, Trends, and Integration in the Lake Tana Basin, Ethiopia; Stave, K., Goshu, G., Aynalem, S., Eds.; Springer International Publishing: Cham, The Netherlands, 2017; pp. 157–177. [Google Scholar]
- Setegn, S.; Srinivasan, R.; Dargahi, B. Hydrological modelling in the Lake Tana Basin, Ethiopia Using SWAT Model. Open Hydrol. J. 2008, 2, 49–62. [Google Scholar] [CrossRef]
- Chorowicz, J.; Collet, B.; Bonavia, F.; Mohr, P.; Parrot, J.-F.; Korme, T. The Tana basin, Ethiopia: Intra-plateau uplift, rifting and subsidence. Tectonophysics 1998, 295, 351–367. [Google Scholar] [CrossRef]
- Tilahun, S.A.; Yilak, D.L.; Schmitter, P.; Zimale, F.A.; Langan, S.; Barron, J.; Parlange, J.Y.; Steenhuis, T.S. Establishing irrigation potential of a hillside aquifer in the African highlands. Hydrol. Process. 2020, 34, 1741–1753. [Google Scholar] [CrossRef]
- Getahun, A. Agricultural systems in Ethiopia. Agric. Syst. 1978, 3, 281–293. [Google Scholar] [CrossRef]
- Abidela, M.H.; Muche, H.; Schmitter, P.; Nakawuka, P.; Tilahun, S.A.; Langan, S.; Barron, J.; Steenhuis, T.S. Deep Tillage Improves Degraded Soils in the (Sub) Humid Ethiopian Highlands. Land 2019, 8, 159. [Google Scholar] [CrossRef]
- Sishu, F.K.; Bekele, A.M.; Schmitter, P.; Tilahun, S.A.; Steenhuis, T.S. Phosphorus Export From Two Contrasting Rural Watersheds in the (Sub) Humid Ethiopian Highlands. Front. Earth Sci. 2021, 9, 762703. [Google Scholar] [CrossRef]
- Bureau Central d’Études pour les Équipements d’Outre-Mer (BCEOM). Abay River Basin Integrated Master Plan, Main Report; Ministry of Water Resources: Addis Ababa, Ethiopia, 1999. [Google Scholar]
- Nigate, F.; Van Camp, M.; Yenehun, A.; Belay, A.S.; Walraevens, K. Recharge—Discharge Relations of Groundwater in Volcanic Terrain of Semi-Humid Tropical Highlands of Ethiopia: The Case of Infranz Springs, in the Upper Blue Nile. Water 2020, 12, 853. [Google Scholar] [CrossRef]
- American Public Health Association (APHA). Standard Methods for the Examination of Water and Wastewater; American Public Health Association: Washingiton, DC, USA, 1995; p. 1000. [Google Scholar]
- Abbay Basin Authority (ABA). Abbay Basin Authority Mission and Vision; The Federal Democratic Republic Of Ethiopia Abbay Basin Authority: Bahir Dar, Ethiopia, 2016. [Google Scholar]
- Gad, M.; Abou El-Safa, M.M.; Farouk, M.; Hussein, H.; Alnemari, A.M.; Elsayed, S.; Khalifa, M.M.; Moghanm, F.S.; Eid, E.M.; Saleh, A.H. Integration of Water Quality Indices and Multivariate Modeling for Assessing Surface Water Quality in Qaroun Lake, Egypt. Water 2021, 13, 2258. [Google Scholar] [CrossRef]
- Banda, T.D.; Kumarasamy, M. Development of a Universal Water Quality Index (UWQI) for South African River Catchments. Water 2020, 12, 1534. [Google Scholar] [CrossRef]
- Deneer, J.W.; Adriaanse, P.; De Boer, P.; Busschers, M.; Lahr, J.; Schoor, C.; Van Vliet, P.; Woldeamanual, A. Handbook of a Scientific Evaluation System for the Registration of (Chemical) Pesticides in Ethiopia; 1566–7197; Alterra Wageningen UR (University & Research centre): Wageningen, The Netherlands, 2014; p. 188. [Google Scholar]
- Adriaanse, P.; Ter Horst, M.; Teklu, B.M.; Deneer, J.W.; Woldeamanuel, A.; Boesten, J. Development of Scenarios for Drinking Water Produced from Groundwater and Surface Water for Use in the Pesticide Registration Procedure of Ethiopia; 1566–7197; Alterra, Wageningen-UR: Wageningen, The Netherlands, 2015. [Google Scholar]
- Teklu, B.M.; Adriaanse, P.I.; Ter Horst, M.M.S.; Deneer, J.W.; Van den Brink, P.J. Surface water risk assessment of pesticides in Ethiopia. Sci. Total Environ. 2015, 508, 566–574. [Google Scholar] [CrossRef] [PubMed]
- University of Hertfordshire. Pesticide Properties Database (PPDB), 2007 ed.; Agriculture & Environment Research Unit (AERU) at the University of Hertfordshire: Hatfield, UK, 2007. [Google Scholar]
- World Health Organization (WHO). Guidelines for Drinking-Water Quality; World Health Organization: Genève, Switzerland, 2017; p. 123. [Google Scholar]
- Joint Meeting on Pesticide Residues. Inventory of Evaluations Performed by the Joint Meeting on Pesticide Residues (JMPR); Joint FAO/WHO: Geneva, Switzerland, 2012. [Google Scholar]
- Palin, A.T. Palintest Water Analysis Technology. Available online: https://www.palintest.com/parameters/ (accessed on 27 November 2021).
- U.S. Environmental Protection Agency. Method 1699: Pesticides in Water, Soil, Sediment, Biosolids, and Tissue by HRGC/HRMS; US Environmental Protection Agency, Office of Science and Technology: Washington, DC, USA, 2007.
- Belmonte Vega, A.; Garrido Frenich, A.; Martínez Vidal, J.L. Monitoring of pesticides in agricultural water and soil samples from Andalusia by liquid chromatography coupled to mass spectrometry. Anal. Chim. Acta 2005, 538, 117–127. [Google Scholar] [CrossRef]
- Currie, L.A. Nomenclature in evaluation of analytical methods including detection and quantification capabilities (IUPAC Recommendations 1995). Pure Appl. Chem. 1995, 67, 1699–1723. [Google Scholar] [CrossRef]
- Food And Agriculture Organization (FAO). Assessing Soil Contamination A Reference Manual. Available online: http://www.fao.org/3/X2570E/X2570E06.htm (accessed on 29 August 2022).
- Sishu, F.K.; Tilahun, S.A.; Schmitter, P.; Steenhuis, T.S. Investigating groundwater nitrate concentrations in two contrasting tropical volcanic highland watersheds. Submitted to Frontiers. 2022. [Google Scholar]
- World Health Organization. Guidelines for Drinking-Water Quality, 3rd ed.; World Health Organization: Geneva, Switzerland, 2004; Volume 1, p. 494. [Google Scholar]
- Sinkevich, M.G., Jr.; Walter, M.T.; Lembo, A.J., Jr.; Richards, B.K.; Peranginangin, N.; Aburime, S.A.; Steenhuis, T.S. A GIS-Based Ground Water Contamination Risk Assessment Tool for Pesticides. Groundw. Monit. Remediat. 2005, 25, 82–91. [Google Scholar] [CrossRef]
- Ali, M.; Kazmi, A.A.; Ahmed, N. Study on effects of temperature, moisture and pH in degradation and degradation kinetics of aldrin, endosulfan, lindane pesticides during full-scale continuous rotary drum composting. Chemosphere 2014, 102, 68–75. [Google Scholar] [CrossRef]
- Schulz, R. Comparison of spray drift- and runoff-related input of azinphos-methyl and endosulfan from fruit orchards into the Lourens River, South Africa. Chemosphere 2001, 45, 543–551. [Google Scholar] [CrossRef]
- Zhang, X.; Luo, Y.; Goh, K.S. Modeling spray drift and runoff-related inputs of pesticides to receiving water. Environ. Pollut. 2018, 234, 48–58. [Google Scholar] [CrossRef] [PubMed]
- Peterson, S.M.; Batley, G.E. The fate of endosulfan in aquatic ecosystems. Environ. Pollut. 1993, 82, 143–152. [Google Scholar] [CrossRef]
- González-Farias, F.; Cisneros Estrada, X.; Fuentes Ruíz, C.; Díaz González, G.; Botello, A.V. Pesticides Distribution in Sediments of a Tropical Coastal Lagoon Adjacent to an Irrigation District in Northwest Mexico. Environ. Technol. 2002, 23, 1247–1256. [Google Scholar] [CrossRef] [PubMed]
- Walse, S.S.; Shimizu, K.D.; Ferry, J.L. Surface-Catalyzed Transformations of Aqueous Endosulfan. Environ. Sci. Technol. 2002, 36, 4846–4853. [Google Scholar] [CrossRef] [PubMed]
- Zhong, G.; Tang, J.; Xie, Z.; Mi, W.; Chen, Y.; Möller, A.; Sturm, R.; Zhang, G.; Ebinghaus, R. Selected current-use pesticides (CUPs) in coastal and offshore sediments of Bohai and Yellow seas. Environ. Sci. Pollut. Res. 2015, 22, 1653–1661. [Google Scholar] [CrossRef] [PubMed]
- Tilahun, S.A.; Mukundan, R.; Demisse, B.A.; Engda, T.A.; Guzman, C.D.; Tarakegn, B.C.; Easton, Z.M.; Collick, A.S.; Zegeye, A.D.; Schneiderman, E.M. A saturation excess erosion model. Trans. ASABE 2013, 56, 681–695. [Google Scholar] [CrossRef]
- Steenhuis, T.S.; Tilahun, S.A.; Elkamil, M.; Atanaw, F.; Worqlul, A.; Ayana, E.K.; Abiy, A.Z.; Mulukken, M.; Tesemma, Z.K.; Mohamad, Y.A. Simulating discharge and sediment concentrations in the increasingly degrading Blue Nile Basin. In Proceedings of the conference on science and technology towards the Development of East Africa, Bahir Dar, Ethiopia, 7 May 2013; pp. 291–299. [Google Scholar]
- Dagnew, D.C.; Guzman, C.D.; Akale, A.T.; Tebebu, T.Y.; Zegeye, A.D.; Mekuria, W.; Tilahun, S.A.; Steenhuis, T.S. Effects of land use on catchment runoff and soil loss in the sub-humid Ethiopian highlands. Ecohydrol. Hydrobiol 2017, 17, 274–282. [Google Scholar] [CrossRef]
- Duffner, A.; Ingwersen, J.; Hugenschmidt, C.; Streck, T. Pesticide Transport Pathways from a Sloped Litchi Orchard to an Adjacent Tropical Stream as Identified by Hydrograph Separation. J. Environ. Qual. 2012, 41, 1315–1323. [Google Scholar] [CrossRef]
- Kurwadkar, S.; Dane, J.; Kanel, S.R.; Nadagouda, M.N.; Cawdrey, R.W.; Ambade, B.; Struckhoff, G.C.; Wilkin, R. Per- and polyfluoroalkyl substances in water and wastewater: A critical review of their global occurrence and distribution. Sci. Total Environ. 2022, 809, 151003. [Google Scholar] [CrossRef] [PubMed]
- Lari, S.Z.; Khan, N.A.; Gandhi, K.N.; Meshram, T.S.; Thacker, N.P. Comparison of pesticide residues in surface water and ground water of agriculture intensive areas. J. Environ. Health Sci. Eng. 2014, 12, 11. [Google Scholar] [CrossRef]
- Shakerkhatibi, M.; Mosaferi, M.; Asghari Jafarabadi, M.; Lotfi, E.; Belvasi, M. Pesticides residue in drinking groundwater resources of rural areas in the northwest of iran. Health Promot. Perspect. 2014, 4, 195–205. [Google Scholar] [PubMed]
- Jurado, A.; Vàzquez-Suñé, E.; Carrera, J.; López de Alda, M.; Pujades, E.; Barceló, D. Emerging organic contaminants in groundwater in Spain: A review of sources, recent occurrence and fate in a European context. Sci. Total Environ. 2012, 440, 82–94. [Google Scholar] [CrossRef] [PubMed]
- Abong’o, D.A.; Wandiga, S.O.; Jumba, I.O. Occurrence and distribution of organochlorine pesticide residue levels in water, sediment and aquatic weeds in the Nyando River catchment, Lake Victoria, Kenya. Afr. J. Aquat. Sci. 2018, 43, 255–270. [Google Scholar] [CrossRef]
- Wenaty, A.; Mabiki, F.; Chove, B.; Mdegela, R. Assessment of persistent organochlorine compounds contamination on the Lake Victoria water and sediments: A case study in Tanzania. Afr. J. Aquat. Sci. 2019, 44, 281–290. [Google Scholar] [CrossRef]
- Okoya, A.A.; Ogunfowokan, A.O.; Asubiojo, O.I.; Torto, N. Organochlorine Pesticide Residues in Sediments and Waters from Cocoa Producing Areas of Ondo State, Southwestern Nigeria. ISRN Soil Sci. 2013, 2013, 131647. [Google Scholar] [CrossRef]
- Otieno, P.O.; Schramm, K.-W.; Pfister, G.; Lalah, J.O.; Ojwach, S.O.; Virani, M. Spatial Distribution and Temporal Trend in Concentration of Carbofuran, Diazinon and Chlorpyrifos Ethyl Residues in Sediment and Water in Lake Naivasha, Kenya. Bull. Environ. Contam. Toxicol. 2012, 88, 526–532. [Google Scholar] [CrossRef] [PubMed]
- Affum, A.O.; Acquaah, S.O.; Osae, S.D.; Kwaansa-Ansah, E.E. Distribution and risk assessment of banned and other current-use pesticides in surface and groundwaters consumed in an agricultural catchment dominated by cocoa crops in the Ankobra Basin, Ghana. Sci. Total Environ. 2018, 633, 630–640. [Google Scholar] [CrossRef]
- Darko, G.; Akoto, O.; Oppong, C. Persistent organochlorine pesticide residues in fish, sediments and water from Lake Bosomtwi, Ghana. Chemosphere 2008, 72, 21–24. [Google Scholar] [CrossRef]
- Veludo, A.F.; Martins Figueiredo, D.; Degrendele, C.; Masinyana, L.; Curchod, L.; Kohoutek, J.; Kukučka, P.; Martiník, J.; Přibylová, P.; Klánová, J.; et al. Seasonal variations in air concentrations of 27 organochlorine pesticides (OCPs) and 25 current-use pesticides (CUPs) across three agricultural areas of South Africa. Chemosphere 2022, 289, 133162. [Google Scholar] [CrossRef]
- Musa, S.; Gichuki, J.W.; Raburu, P.O.; Aura, C.M. Risk assessment for organochlorines and organophosphates pesticide residues in water and Sediments from lower Nyando/Sondu-Miriu river within Lake Victoria Basin, Kenya. Lakes Reserv. Res. Manag. 2011, 16, 273–280. [Google Scholar] [CrossRef]
- Loewy, R.M.; Carvajal, L.G.; Novelli, M.; Pechen de D’Angelo, A.M. Effect of Pesticide Use in Fruit Production Orchards on Shallow Ground Water. J. Environ. Sci. Health Part B 2003, 38, 317–325. [Google Scholar] [CrossRef] [PubMed]
- Munn, M.D.; Gilliom, R.J.; Moran, P.W.; Nowell, L.H. Pesticide Toxicity Index for Freshwater Aquatic Organisms; US Department of the Interior, US Geological Survey: Washington, DC, USA, 2001.
- Sangchan, W.; Bannwarth, M.; Ingwersen, J.; Hugenschmidt, C.; Schwadorf, K.; Thavornyutikarn, P.; Pansombat, K.; Streck, T. Monitoring and risk assessment of pesticides in a tropical river of an agricultural watershed in northern Thailand. Environ. Monit. Assess. 2014, 186, 1083–1099. [Google Scholar] [CrossRef] [PubMed]
- Peris, A.; Barbieri, M.V.; Postigo, C.; Rambla-Alegre, M.; López de Alda, M.; Eljarrat, E. Pesticides in sediments of the Ebro River Delta cultivated area (NE Spain): Occurrence and risk assessment for aquatic organisms. Environ. Pollut. 2022, 305, 119239. [Google Scholar] [CrossRef] [PubMed]


| Pesticide | Type of Crop | Time of Application | Frequency | Farmers Application Rate (L ha−1) | Active Ingredients per Application (kg ha−1) | Recommended Active Ingredients (kg ha−1) |
|---|---|---|---|---|---|---|
| Chlorpyrifos | Maize | Jun.–Jul. | 1 | 1.05 | 0.50 | 0.12 |
| Khat | Jun.–Jan. | 8 | 2.13 | 1.02 | 0.82 | |
| Onion | Jun.–Jul. | 1 | 0.92 | 0.44 | 0.48 | |
| Cabbage | Oct.–Dec. | 1 | 0.78 | 0.37 | 0.48 | |
| Garlic | Oct.–Dec. | 1 | 0.63 | 0.30 | 0.48 | |
| Dimethoate | Maize | Jul. | 1 | 2.00 | 0.80 | 0.26 |
| Khat | Jun.–Jul. | 4 | 2.50 | 1.00 | 0.32 | |
| Tomato | Oct.–Dec. | 1 | 1.32 | 0.53 | 0.32 | |
| Onion | Oct.–Dec. | 1 | 0.75 | 0.30 | 0.32 | |
| Garlic | Oct.–Dec. | 1 | 0.75 | 0.30 | 0.32 | |
| Profenofos | Maize | Jul. | 1 | 1.14 | 0.57 | 0.55 |
| Endosulfan (α and β) | Khat | Nov.–Jan. | 2 | 3.12 | 1.09 | 0.81 |
| Tomato | Oct.–Dec. | 1 | 2.30 | 0.81 | 0.81 |
| Physical and Chemical Properties | Pesticides | |||
|---|---|---|---|---|
| Chlorpyrifos | Dimethoate | Profenofos | Endosulfan (α and β) | |
| Substance Group | OPP | OPP | OPP | OCP |
| Molecular mass | 351 | 229 | 374 | 407 |
| Solubility in water @20 °C (mg L−1) | 1.05 | 25,900 | 28 | 0.32 |
| Vapor pressure (mPa @20 °C) | 1.43 | 0.25 | 2.53 | 0.83 |
| Soil degradation DT₅₀ (days) (lab at 20 °C) | 386 | 2.5 (4–122) | 7 | 39 (60–800) |
| Aqueous hydrolysis DT₅₀ (days) | 53.5 | 68 | 14.6 | 20 |
| Sorption: KOC (m3 Mg−1) | 5509 | 28.3 (10) | 2016 | 11,500 (2500) |
| Mobility | slightly | high/moderate | slightly | Slightly/hardly |
| Kd for 2% organic matter (m3 Mg−1) | 66 | 0.34 | 24 | 138 |
| Avg displacement cm a−1 for a soil with ρ = 1.2; = 0.3; and 500 mm a−1 recharge | <1 | 70 | 2 | <1 |
| Variables | Act. Ingredients | R2 | Slope Coef (β) | t-Test | p-Value |
|---|---|---|---|---|---|
| Depth to groundwater | Chlorpyrifos | 0.23 | −0.3 | −2.79 | 0.01 |
| Dimethoate | 0.08 | 0.25 | 0.13 | 0.10 | |
| Profenofos | 0.04 | −0.02 | −1.58 | 0.20 | |
| α-endosulfan | 0.15 | −0.14 | −2.23 | 0.13 | |
| β-endosulfan | 0.07 | −0.05 | −1.57 | 0.16 | |
| pH | Chlorpyrifos | 0.06 | 2.10 | 1.50 | 0.13 |
| Dimethoate | 0.01 | 0.73 | 0.27 | 0.78 | |
| Profenofos | 0.02 | 0.52 | 1.16 | 0.26 | |
| α-endosulfan | 0.15 | 1.09 | 2.23 | 0.05 | |
| β-endosulfan | 0.11 | 0.69 | 1.40 | 0.06 | |
| N- | Chlorpyrifos | 0.21 | −0.6 | −2.50 | 0.02 |
| Dimethoate | 0.05 | 0.16 | 0.57 | 0.15 | |
| Profenofos | 0.05 | 0.07 | 1.40 | 0.16 | |
| α-endosulfan | 0.12 | 0.12 | 1.80 | 0.04 | |
| β-endosulfan | 0.10 | 0.10 | 1.70 | 0.07 | |
| Dissolved_ P | Chlorpyrifos | 0.12 | 2.30 | 2.60 | 0.04 |
| Dimethoate | 0.05 | 1.30 | 1.50 | 0.13 | |
| Profenofos | 0.05 | 1.53 | 1.14 | 0.26 | |
| α-endosulfan | 0.06 | 4.80 | 1.40 | 0.12 | |
| β-endosulfan | 0.02 | 3.00 | 1.80 | 0.29 |
| Pesticide | Groundwater | Surface Water | ||||||||||
|---|---|---|---|---|---|---|---|---|---|---|---|---|
| Date | DF (%) | Min | Mean | Max | Sig. p | Date | DF (%) | Min | Mean | Max | Sig. p | |
| Dimethoate | 5-Jul. | - | <LOD | - | <LOD | - | 2-Jul. | 0 | <LOD | - | <LOD | - |
| 15-Aug. | 75 | <LOD | 1.75 | 5.79 | 12-Aug. | 60 | <LOD | 0.38 | 1.03 | |||
| 29-Nov. | - | <LOD | - | <LOD | 29-Nov. | 0 | <LOD | - | <LOD | |||
| Chlorpyrifos | 5-Jul. | 100 | 1.01 | 2.15 | 4.65 | 0.19 | 2-Jul. | 80 | <LOD | 2.50 | 3.60 | 0.03 |
| 15-Aug. | 50 | <LOD | 2.21 | 4.33 | 12-Aug. | 80 | <LOD | 3.15 | 7.73 | |||
| 29-Nov. | 75 | <LOD | 1.91 | 3.12 | 29-Nov. | 100 | 0.41 | 0.58 | 0.87 | |||
| Profenofos | 5-Jul. | 38 | <LOD | 0.07 | 1.02 | 0.03 | 2-Jul. | - | <LOD | - | <LOD | - |
| 15-Aug. | 25 | <LOD | 0.03 | 0.37 | 12-Aug. | - | <LOD | - | <LOD | |||
| 29-Nov. | - | <LOD | - | <LOD | 29-Nov. | - | <LOD | - | <LOD | |||
| α-endosulfan | 5-Jul. | 75 | <LOD | 0.65 | 1.59 | 0.28 | 2-Jul. | 100 | 0.48 | 0.69 | 0.87 | 0.02 |
| 15-Aug. | 100 | 0.14 | 0.51 | 1.71 | 12-Aug. | 80 | <LOD | 1.02 | 2.61 | |||
| 29-Nov. | 75 | <LOD | 0.28 | 1.67 | 29-Nov. | 80 | <LOD | 0.41 | 1.69 | |||
| β-endosulfan | 5-Jul. | 100 | 0.21 | 0.31 | 1.06 | 0.48 | 2-Jul. | 100 | 0.13 | 0.30 | 0.51 | 0.01 |
| 15-Aug. | 80 | <LOD | 0.34 | 1.33 | 12-Aug. | 80 | <LOD | 0.64 | 1.71 | |||
| 29-Nov. | 80 | <LOD | 0.29 | 0.97 | 29-Nov. | 80 | <LOD | 0.24 | 0.76 | |||
| Pesticide | Aquatic Invertebrate | Fish | ||||||
|---|---|---|---|---|---|---|---|---|
| Acute | Chronic | Acute | Chronic | |||||
| RQ Range | %RQ > 1 | RQ Range | %RQ > 1 | RQ Range | %RQ > 1 | RQ Range | %RQ > 1 | |
| Dimethoate | 0.01–0.20 | 0 | 0.03–0.85 | 0 | 0.01–0.10 | 0 | 0.01–0.87 | 0 |
| chlorpyrifos | 121–5680 | 100 | 0.26–9.20 | 67 | 1.56–2.30 | 100 | 1.87–405 | 100 |
| α-endosulfan | 0.01–0.65 | 0 | - | - | 14–94 | 100 | 560–5680 | 100 |
| β-endosulfan | 0.03–0.47 | 0 | - | - | 11–57 | 100 | 520-4140 | 100 |
Publisher’s Note: MDPI stays neutral with regard to jurisdictional claims in published maps and institutional affiliations. |
© 2022 by the authors. Licensee MDPI, Basel, Switzerland. This article is an open access article distributed under the terms and conditions of the Creative Commons Attribution (CC BY) license (https://creativecommons.org/licenses/by/4.0/).
Share and Cite
Sishu, F.K.; Tilahun, S.A.; Schmitter, P.; Assefa, G.; Steenhuis, T.S. Pesticide Contamination of Surface and Groundwater in an Ethiopian Highlands’ Watershed. Water 2022, 14, 3446. https://doi.org/10.3390/w14213446
Sishu FK, Tilahun SA, Schmitter P, Assefa G, Steenhuis TS. Pesticide Contamination of Surface and Groundwater in an Ethiopian Highlands’ Watershed. Water. 2022; 14(21):3446. https://doi.org/10.3390/w14213446
Chicago/Turabian StyleSishu, Feleke K., Seifu A. Tilahun, Petra Schmitter, Getachew Assefa, and Tammo S. Steenhuis. 2022. "Pesticide Contamination of Surface and Groundwater in an Ethiopian Highlands’ Watershed" Water 14, no. 21: 3446. https://doi.org/10.3390/w14213446
APA StyleSishu, F. K., Tilahun, S. A., Schmitter, P., Assefa, G., & Steenhuis, T. S. (2022). Pesticide Contamination of Surface and Groundwater in an Ethiopian Highlands’ Watershed. Water, 14(21), 3446. https://doi.org/10.3390/w14213446