Article

Evaluation of Soil-Water Characteristic Curve and Pore-Size Distribution of Fine-Grained Soils

1
Department of Civil Engineering, Faculty of Engineering, Sakarya University, Serdivan 54050, Turkey
2
Department of Civil and Environmental Engineering, College of Engineering, University of Wisconsin-Madison, Madison, WI 53706, USA
3
Department of Civil Engineering, Faculty of Technology, Sakarya University of Applied Sciences, Serdivan 54050, Turkey
*
Author to whom correspondence should be addressed.
Water 2022, 14(21), 3445; https://doi.org/10.3390/w14213445
Submission received: 30 September 2022 / Revised: 21 October 2022 / Accepted: 26 October 2022 / Published: 29 October 2022

Abstract

:
A soil’s physical properties, mineral types, and pore structure significantly influence the shape and properties of the soil-water characteristic curve (SWCC). This study investigated the effects of the soil’s physical properties and mineral types on the SWCC and pore-size distribution (PSD). Eight different soils from an alluvial deposit in Istanbul and Adapazarı/Türkiye were used in the study. The test samples were prepared by compaction at optimum water content (OWC) and wet side of optimum water content (wet of OWC). The samples were prepared by consolidation from the slurry. The PSDs of the samples were calculated using the SWCCs and evaluated with scanning electron microscope (SEM) analysis. In addition, the mineral types of all soils were determined by X-ray diffraction analysis. The soil which contains illite-type minerals has higher matric suction than containing kaolin-type. The effect of the clay percentage is more pronounced in silty soils than in plasticity and activity. Soil suction increased with decreasing compaction water content in clayey soils. The air entry water contents rose as the void ratio, liquid limit, clay content, and plasticity increased. The compaction conditions affected the macropore structure more than the micropore structure. In addition, the ratio of macro-micro pore sizes increased with the rise of the compaction water content.

1. Introduction and Background

Permeability, shear strength, and volume change properties mainly depend on the water retention capacity of soils. The water-holding capacity of unsaturated soils is defined as the soil-water characteristic curve (SWCC) [1,2,3,4]. The SWCC is expressed as water content (alternatively degree of saturation) versus suction. It has two critical properties: air entry value (AEV) and residual water content (θr). The AEV is the suction value where the water drains starting from the large pores, and thus the air becomes continuous in the soil [5]. Suction values smaller than the AEV indicate the saturated capillary zone, whereas those greater than the residual value indicate the residual water zone [6]. The residual value is the suction value where the drainage in the liquid phase in the soil pores starts to decrease, and the water evaporates [2,7]. Many soil characteristics, such as soil structure, stress state, mineralogy, specific surface, chemical composition, initial water content, void ratio, surface activity, pore water properties, and pore-size distribution (PSD), affect the engineering properties of unsaturated soils [8,9]. The compaction energy, compaction method, and initial water content, through their control of the pore structure of the soil, influence the shape of SWCC in compacted soils [6,10,11,12,13,14,15]. Marinho (2005) determined that the slope of the SWCC increased with the increasing plasticity by examining 18 soil samples between 24% and 95% percent liquid limit and 6–60% plasticity index [16]. Tinjum et al. (1997) stated that if high plasticity soils are compacted with higher than OWC using high energy, the SWCCs will be steeper, and the AEVs will be higher [17]. Increasing clay content and plasticity in compacted clayey soils resulted in greater suction value at the same water content and higher AEVs [14,18,19]. The presence of water-absorbing minerals such as montmorillonite in the mineral composition of the soil causes a higher water absorption capacity [20,21,22]. In unsaturated soil, there are many voids filled with air and water. A meniscus similar to capillary tubes is formed at the air-water interfaces in the pore structure [23]. The capillary rise in the soil pores is directly dependent on the sizes of the pores. Several authors posited that soils with smaller pore diameters could have higher suction [6]. Sillers et al. (2001) defined the relationship between pore size and soil suction in terms of PSD [24]. Lu and Likos (2004) proposed a method that calculates the PSD from SWCC [23]. Unsaturated compacted soils have a bimodal pore structure [25]. Wan et al. (1995) indicated that large pore diameters indicate the dimensions of the intergranular voids [26]. The bimodal distribution’s first peak (at small diameters) shows the intragranular pores. Zaffar and Lu (2015) stated that in clay soils, pore sizes in the range of 0.01–0.1 µm represent voids between clay slabs, pore sizes smaller than 0.01 µm represent voids between layers in clays, and pore sizes greater than 1.0 µm represent voids between grains [27]. Thom et al. (2007) determined that reducing the compaction water content increases intragranular voids and decreases the percentage of intergranular voids [28].
Thieu et al. (2001) stated that SWCC should be determined precisely in order to estimate the permeability, water retention, and shear strength properties of unsaturated soils [29]. Various equations are proposed to determine the SWCC. Some commonly used curve fitting models include [13,30,31,32]. Sillers et al. (2001) stated that the van Genuchten (VG) curve fitting model is an SWCC model that provides a continuous water-suction relationship of the soil at all suction values [24]. VG’s equation is expressed as follows:
Θ = θ θ r θ s θ r = [ 1 1 + ( α φ ) n ] 1 1 n
where θr = residual water content, θs = saturated water content, φ = suction, α, and n are fitting parameters. Tinjum et al. (1997) stated that the increase in parameter “n” makes the SWCC horizontal, while the decrease in the α parameter makes the curve slope steeper [17].
This study was carried out to analyze the effects of physical properties, mineralogy, and compaction conditions on SWCC and the PSD curves obtained from SWCC in fine-grained soils. SWCC tests were performed with the filter paper method, and VG’s equation was used to generate the curves. PSD curves were determined using the method of Lu and Likos (2004) on SWCC experimental data. In addition, micro and macropore sizes obtained from PSD curves were supported by SEM analysis [23].

2. Soil Samples and Testing Methods

The effects of soil type, clay content, sample water content, mineral composition, and pore structure on SWCC were investigated in this study. In the experimental research, the SWCCs of the compacted samples (using modified Proctor) at OWC and wet of OWC (wopt+%5) and samples consolidated from slurry under 100 kPa stress were measured. Matric suction measurements were carried out using the filter paper method. The filter paper method was preferred instead of the standard pressure plate due to the very high suction values measured in unsaturated clayey soils. It is seen from the measurement results that the matric suction values of the samples occurred in the range of 0–106 kPa. The measured matric suction-water content data of the soils were fitted with the VG mathematical equation to obtain SWCCs. PSD curves were obtained from the SWCC with Lu and Likos’s approach. The pore-size analysis of the samples was compared to the scanning electron microscope images (SEM). Pore structure was observed from the SEM images magnified by 3000×. In addition, the mineral composition of the soils was determined by X-ray diffraction (XRD) analysis.

2.1. Soil Samples

No. 1, No. 2, No. 3, and No. 4 soils were taken from an embankment area in Istanbul, and No. 5, No. 6, No. 7, and No. 8 soils were taken from the Adapazarı alluvial plain. The physical properties of soils [33,34,35,36] and compaction characteristics [37] are presented in Table 1. Grain size distribution curves are given in Figure 1a. The results of triangular soil classification created according to USDA (United States Department of Agriculture) are shown in Figure 1b. As demonstrated here, the consistency limits are dominant in the classification of fine-grained soils, are not considered in the triangular classification system, and are evaluated only according to the grain size. While these soils are classified as clay according to USCS (Unified Soil Classification System) [38], they are in the silty soil zone according to USDA. However, though the particles of clay size are low in percentage, soils show claylike behavior due to their activity.
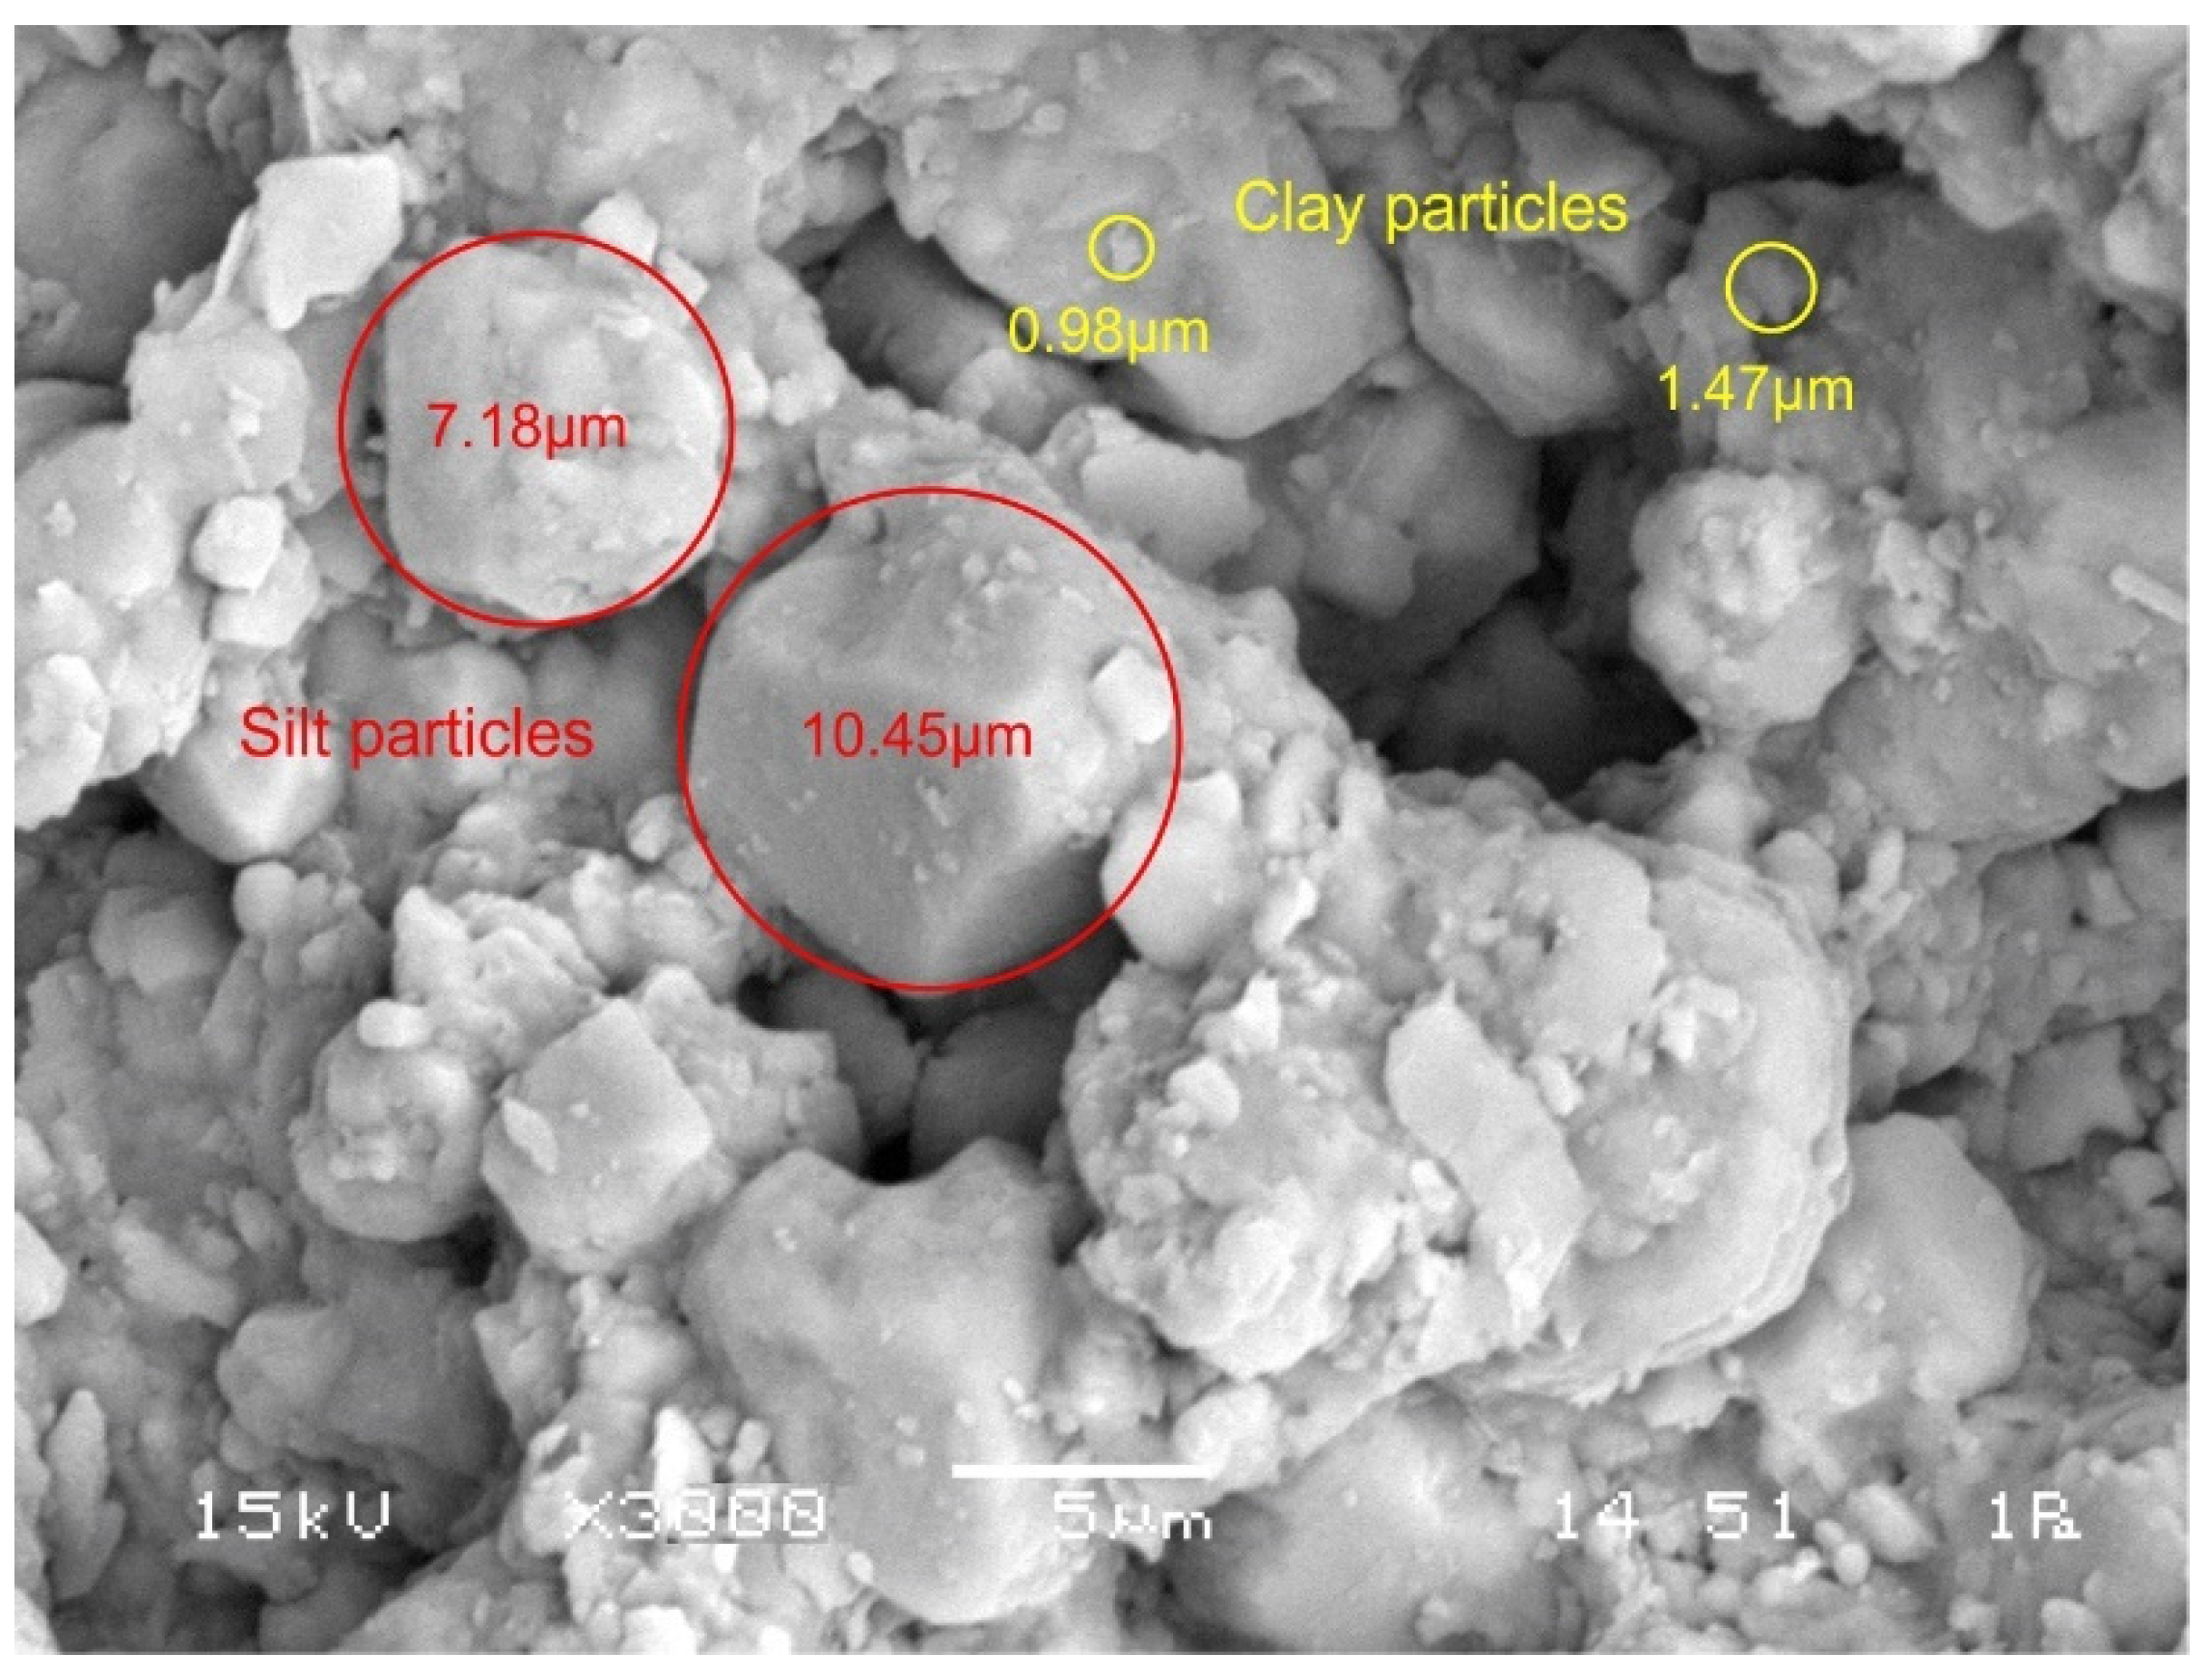
Silt and clay particles are seen in the electron microscope image taken from the surface of the No. 1 soil in its natural state at 3000× magnification (Figure 2). It is seen that clay particles smaller than 2 µm are flat and leafy. On the other hand, silt particles are primarily in polyhedral form.
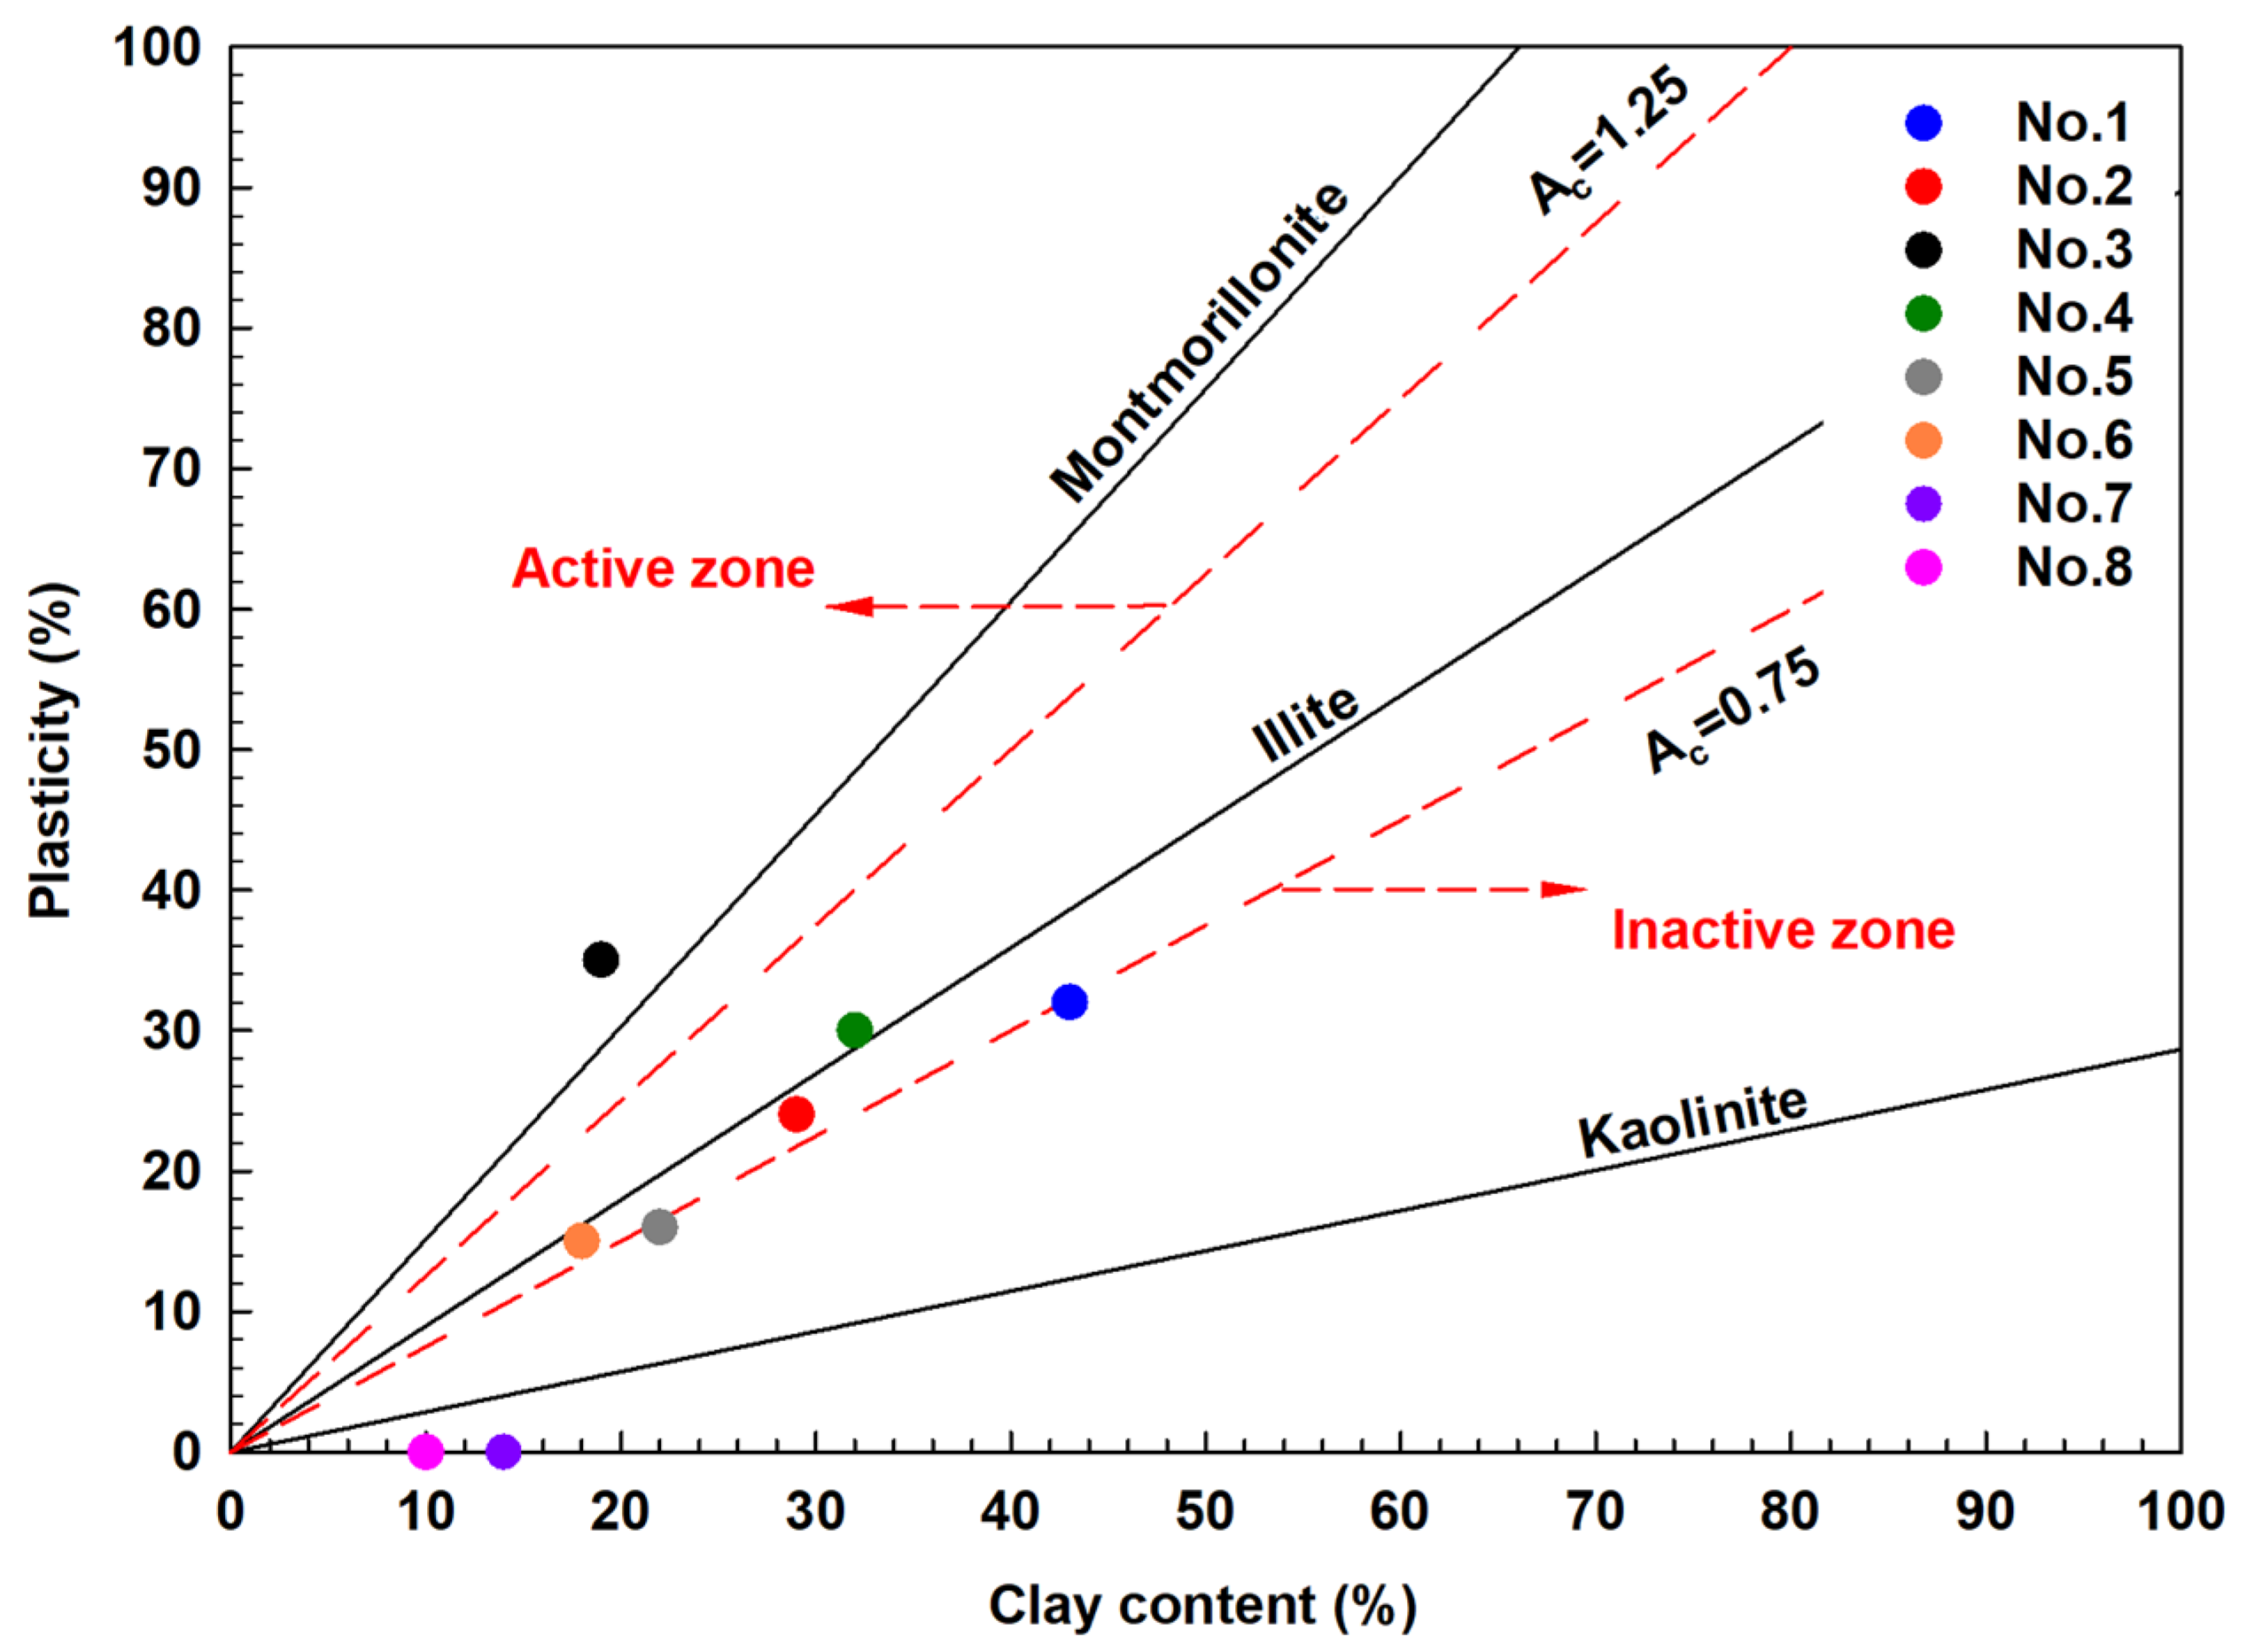
The activities of the soils were calculated with Equation (2), which Skempton (1953) proposed and uses the linear relationship between plasticity and clay percentage [39]. Activity values are shown in Table 1. The locations of the soils on the Skempton activity chart are shown in Figure 3.
A c ( activity ) = plasticity   index clay   fraction
The mineral composition of the soils was determined by X-ray diffractometry in the Metallurgical and Materials Engineering Laboratory at Sakarya University. The main minerals of soils are identified as quartz, calcite, hematite, kaolinite, glauconite, lizardite, and feldspar and are shown in Table 2. The mineral composition of No. 3 and No. 4 soils includes the illite group glauconite and kaolin-serpentine group lizardite. Other soils have kaolin group kaolinite minerals. Depending on the minerals in their compounds, the activities of No. 3 and No. 4 soils are higher. Non-plastic silty soils (No. 7 and No. 8) are in the inactive zone.

2.2. Specimen Preparation

The specimens of Nos. 1, 2, 3, and 4 have been brought from an embankment in Istanbul. Thus, these samples were prepared by compaction. The specimens of Nos. 5, 6, 7, and 8 have been obtained from Adapazarı city, lying on approximately 100 m alluvial deposits. Thus, they were prepared by consolidating from the slurry to simulate the alluvial formation process. The slurry method is generally recommended for sample preparation due to the homogeneity in the literature [40,41,42,43]. In the compaction method, samples were compacted at the OWC and the wet side of OWC (wopt+%5) by modified Proctor energy. In the slurry method, samples were prepared by consolidation from a slurry. The soils were slurried at a water content of 1.5 times the liquid limit. Then the slurry was deaired in a vacuum desiccator. The deaired slurry was placed in a 50 mm diameter consolidation cell (shown in Figure 4) and consolidated under axial pressure, gradually increasing to 100 kPa.

2.3. Saturation of Samples

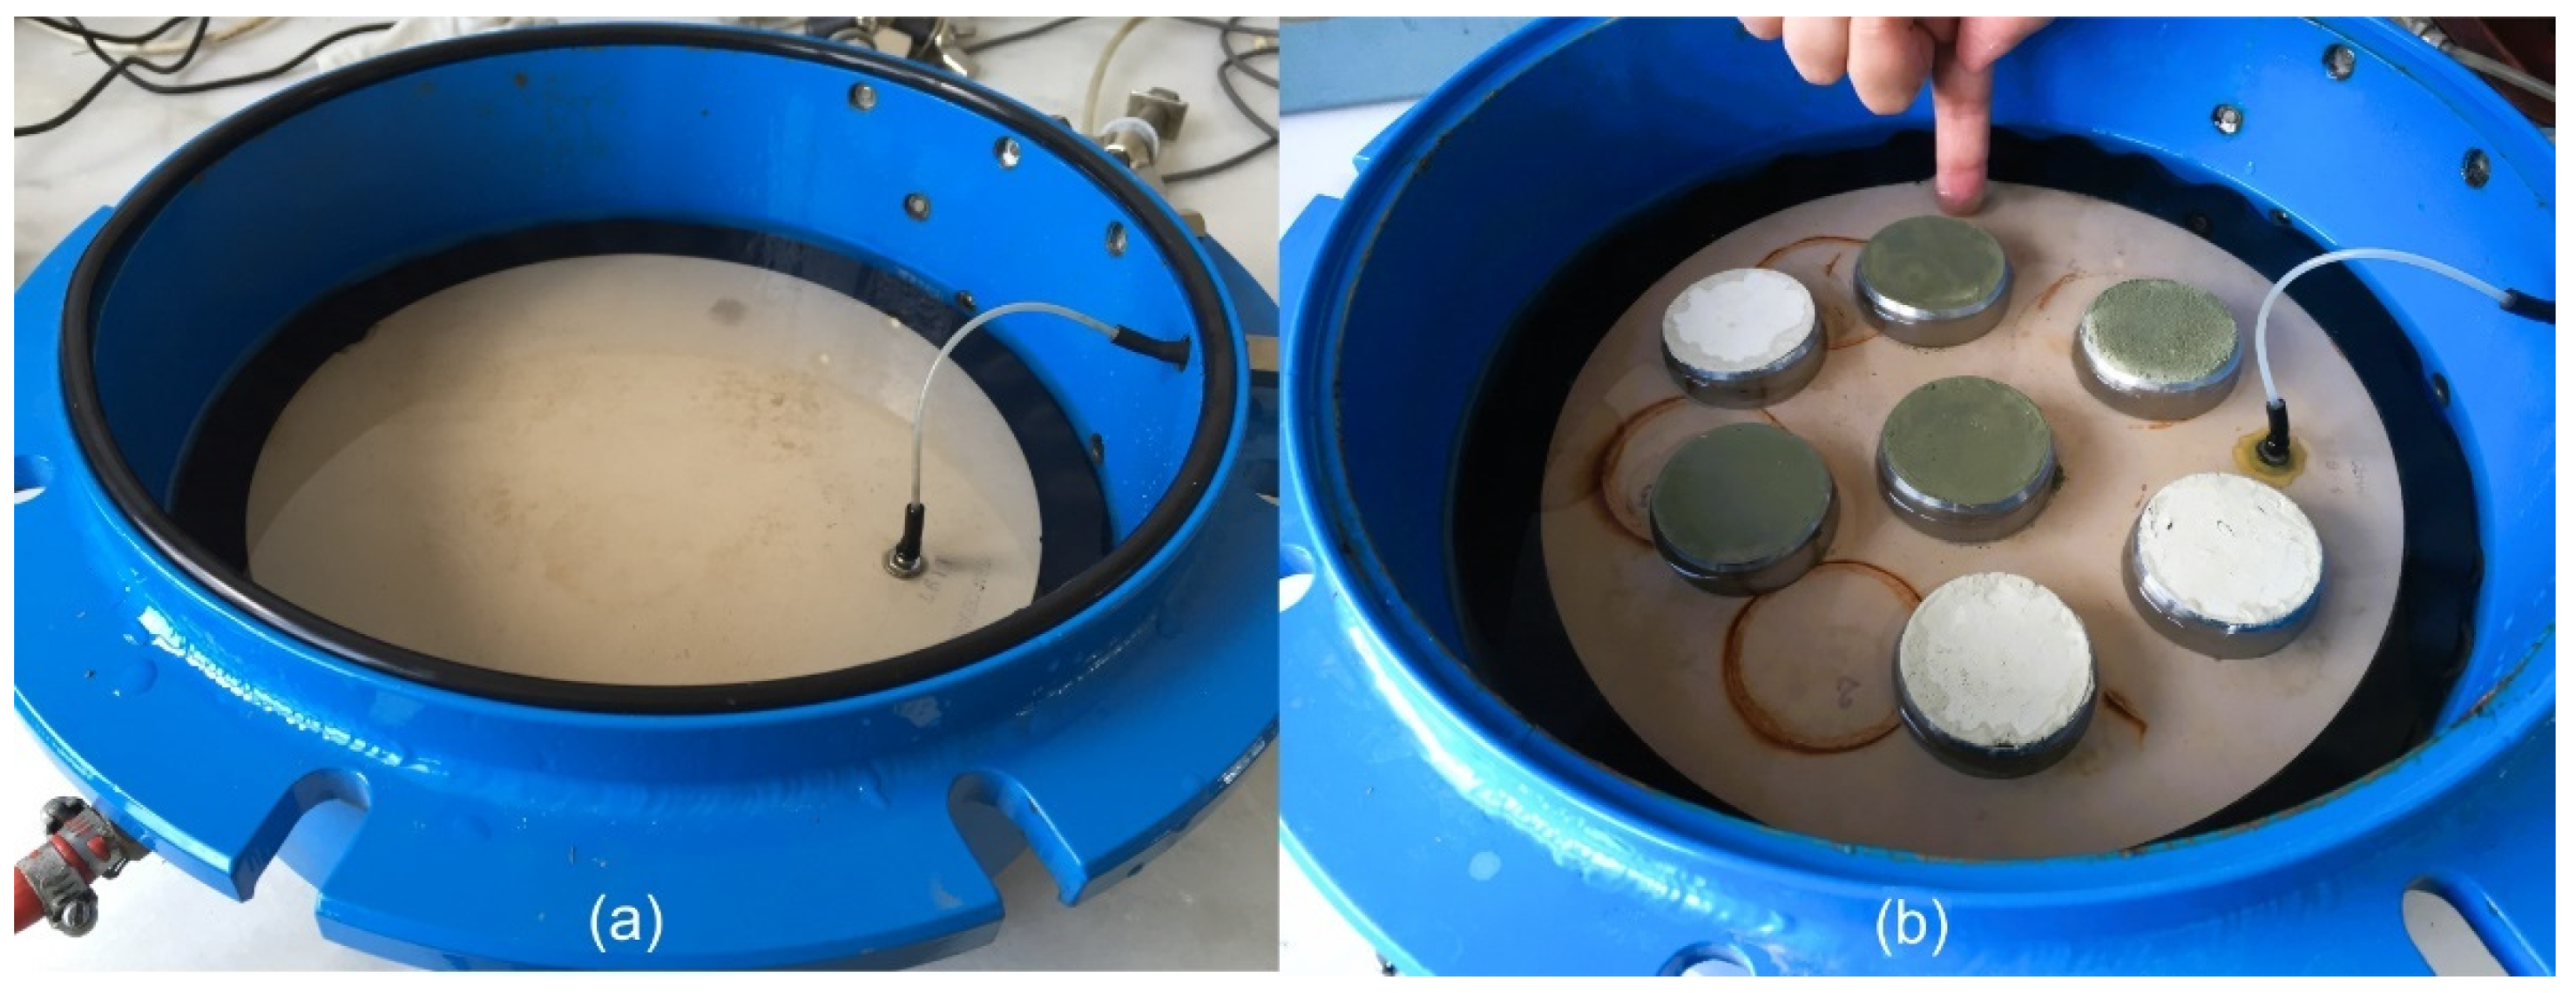
Firstly, the ceramic disc with a 1500 kPa air entry value was saturated in the pressure cell, where degassed pure water was placed. Initially, the disc was saturated by applying 100 kPa of air pressure (Figure 5a). Then, the compacted samples (diameter of 50 mm and height of 20 mm) were placed on the saturated ceramic disc and brought to 0 matric suction value. The samples consolidated from the slurry were assumed to be saturated because the air was removed by vacuum before consolidating. Degassed pure water was added to the pressure cell, and samples were saturated under air pressure (Figure 5b).

2.4. Filter Papers Measurement of SWCCs

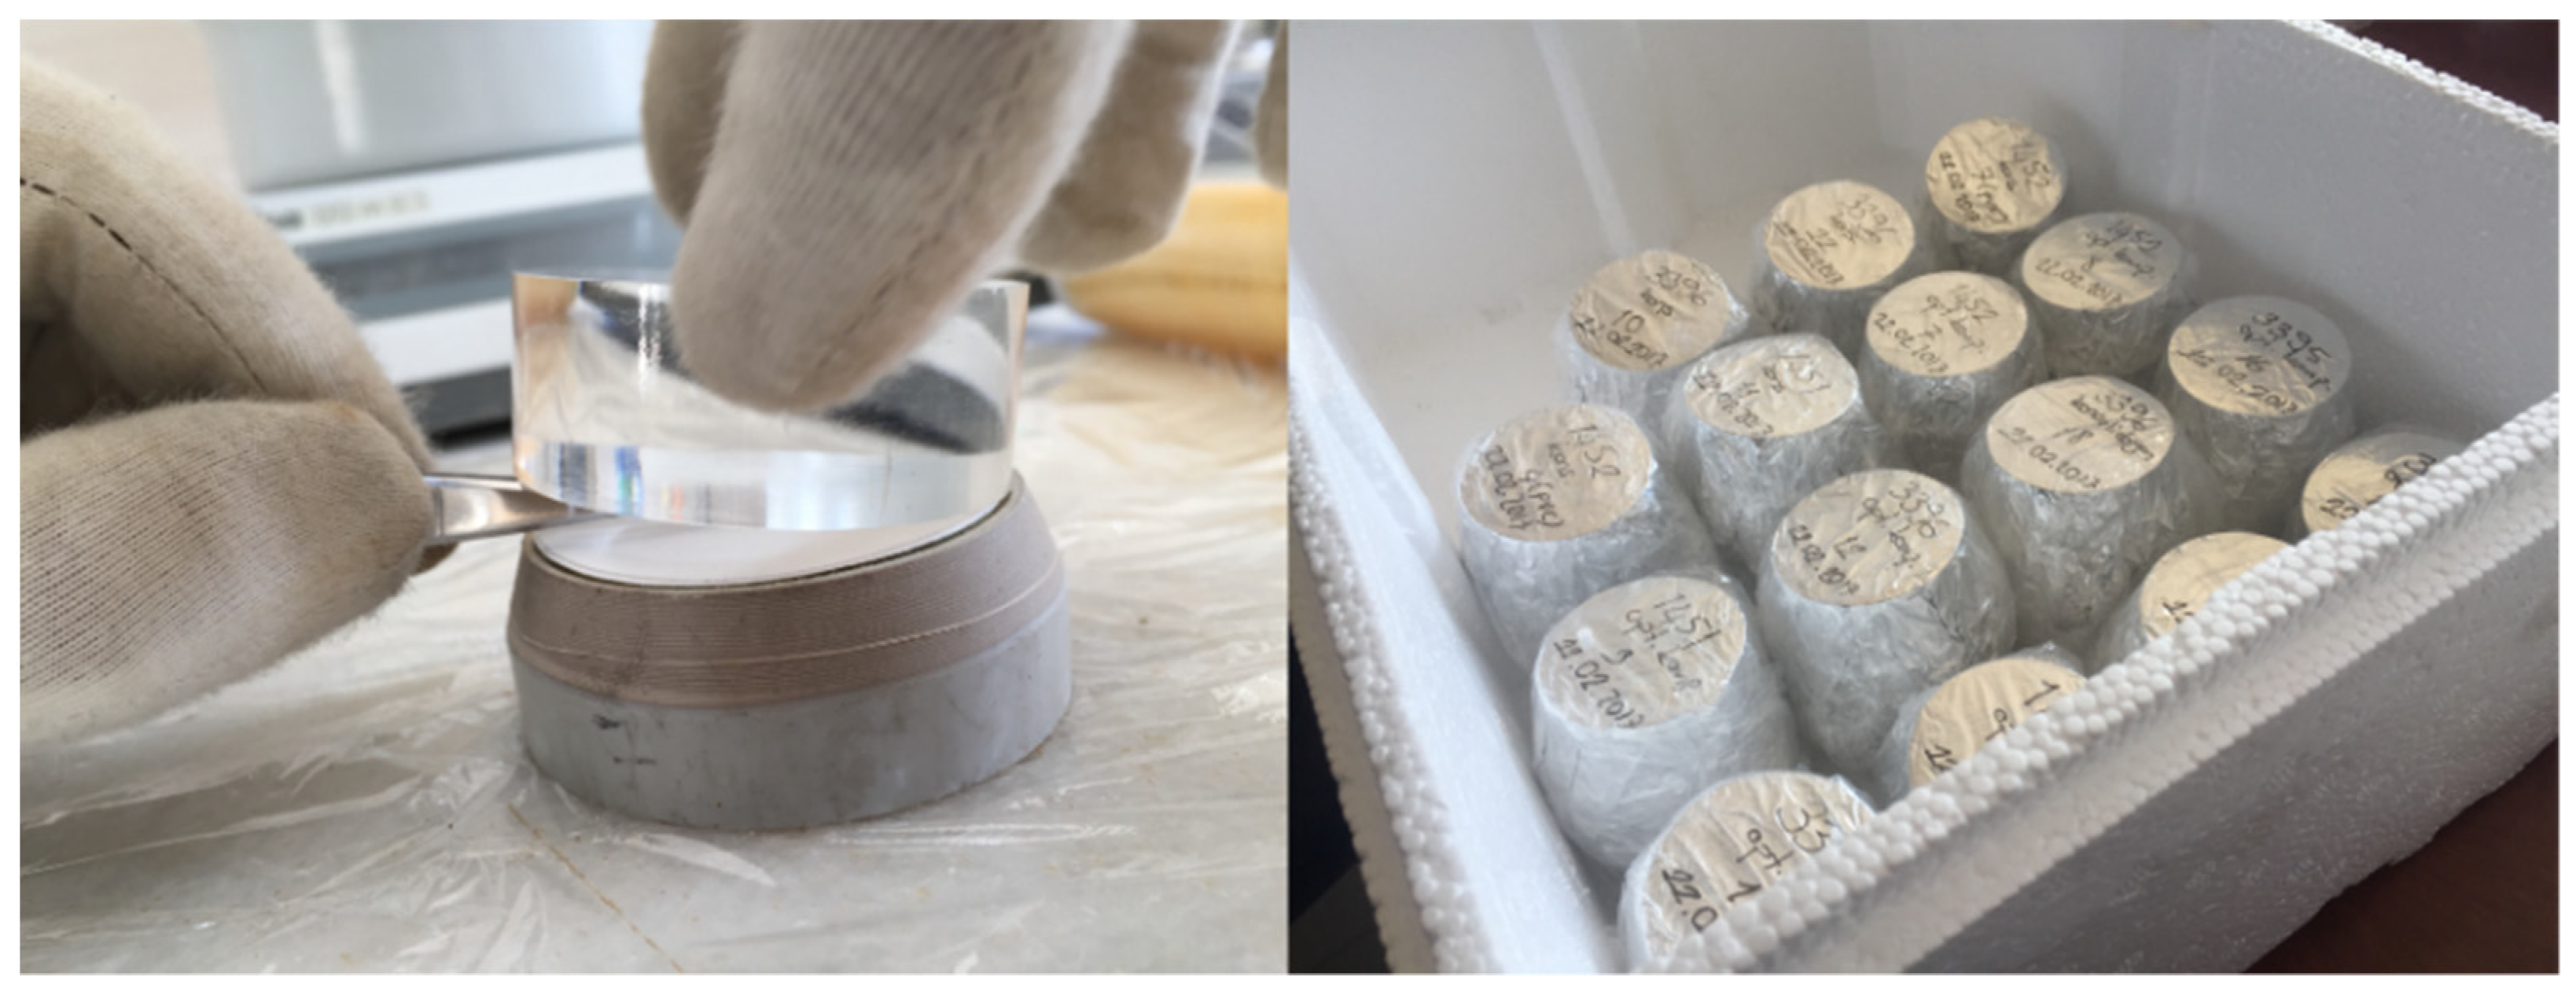
The procedure detailed in ASTM D5298-10 was applied for the filter paper application [44]. Whatman No. 42 filter paper with a thickness of 200 µm, a maximum ash content of 0.007%, a pore size of 2.5 µm, a unit weight of 1 g/m2, and a diameter of 55 mm was used in the measurements. First, filter papers were placed in contact (for matric suction measurement) with saturated samples. The samples are wrapped in plastic film and aluminum foil and placed in a thermally controlled box to keep the ambient temperature constant (Figure 6). For the water flow between the soil and the filter paper to reach a steady state, the samples were kept for seven days in the temperature-controlled room, and the test phase was completed. The same procedure was repeated for subsequent measurements. The matric suction value of the soil was obtained using the measured filter paper water content with the filter paper calibration curve. The calibration curve equation of the Whatman No. 42 filter paper is given in Equation (3). SWCC data were determined using the soil’s gravimetric water content and matric suction values for each measurement.
l o g φ = 2.412 0.0135   l o g w f   i f   w f 45.3 %
    l o g φ = 5.327 0.0779   l o g w f   i f   w f < 45.3 %
where φ is suction and w f is the water content of filter paper.

2.5. SEM Analysis

The samples used in the SEM analysis were prepared by the same methods as the soil samples prepared for SWCC measurement. The SEM samples were cut cylindrically with 15 mm diameter and 10 mm height before drying in a vacuum oven set at 105 °C to remove the water in their voids. Before imaging, the sample surface was coated with gold and tested for resistance to high vacuum for approximately an hour, and then the pore structure was observed in the SEM.

3. Results and Discussions

3.1. SWCCs of Soils

The matric suction measurement results determined by the filter paper method of the samples in their initial state (at approximately OWC and wet side of OWC) are given in Table 3. Samples compacted at OWC have much greater soil suction values than samples that were at the wet side of OWC. The water contents of the compacted samples are higher than the water content when it comes to the equivalent suction value in the SWCC initiated after the saturation process. This is because the wetting path is above the drying path (Figure 7).

3.2. Van Genuchten SWCC Models of Soils

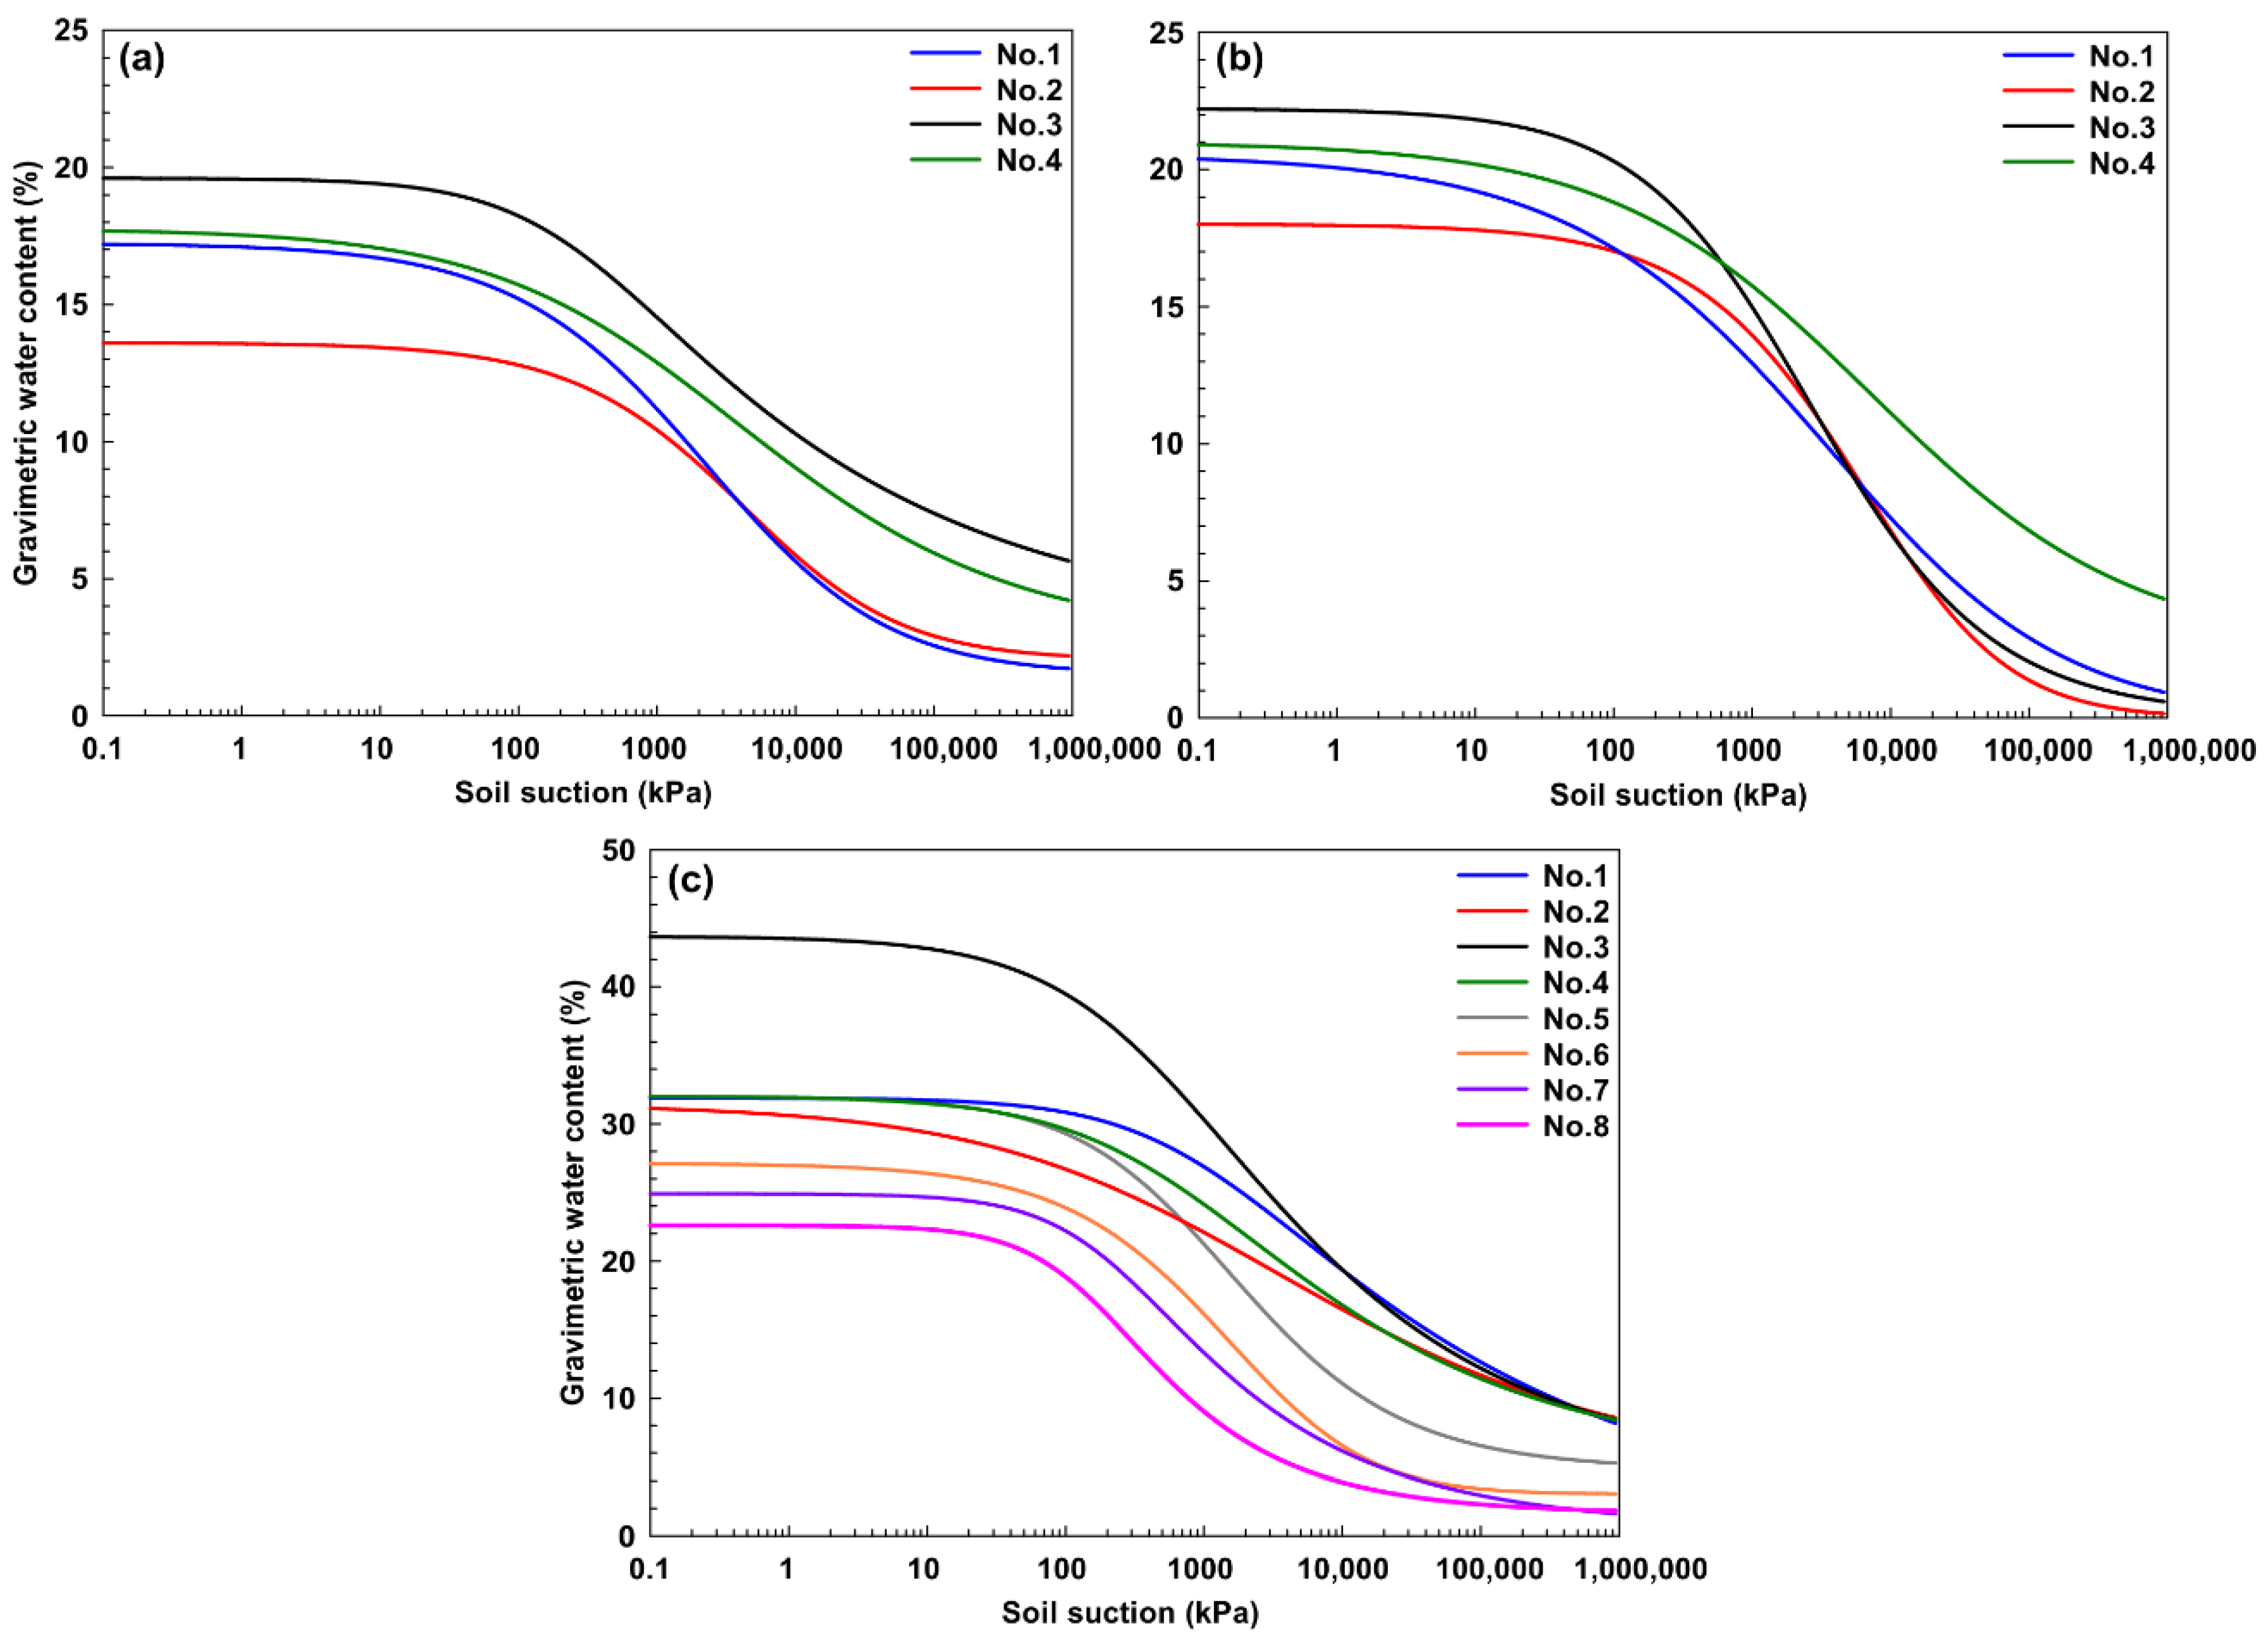
The VG model (Equation (1)) was fitted to the data obtained from SWCC tests. Fitting the VG equation to the experimental results, SWCCs fully reflect the suction-water content relationship in 0–106 kPa. The VG curve models of clayey soils (No. 1, No. 2, No. 3, and No. 4) prepared by different methods are shown in Figure 8. Table 4 presents the VG parameters of the SWCCs.
The VG equation created curves compatible with all test results regardless of soil type and sample preparation method. The air entry water contents produced by the VG method are equal to saturated water content. The SWCCs of the samples compacted at OWC and the wet side of OWC (subsequently saturated) converged at suction values higher than the AEV (except No. 4). This situation was also reported by Vanapalli et al. (1999) [11]. They stated that although the void ratio of samples at OWC is smaller, the air entry value of wet OWC is equal to or higher than OWC samples. The SWCCs of the wet side of OWC samples are separated from saturation with a steeper slope than OWC samples [17]. The samples prepared by consolidating from a slurry reached residual values at higher water contents than the compacted samples.
Figure 8c shows the SWCCs of the soil samples from Adapazarı (Nos. 5, 6, 7, and 8) prepared by consolidating from a slurry. As can be seen from the SWCCs of these samples of similar origins, the AEVs and the slopes of the curves separated from saturation are close. It is also that both the initial water content value and the AEV decreases with decreasing plasticity.
According to Figure 8, although the No. 1 sample has the highest clay content, it does not have the highest suction at the same gravimetric water content. On the other hand, the SWCC of No. 3, which has the lowest clay content, generally has higher suctions at the same water contents and is located further to the right than the other samples (excluding the residual zone in the SWCC of the sample at the wet of OWC). For example, the OWC sample of No. 3 at 10% water content has a suction above 104 kPa. Instead, the other samples have suction values of 103–104 kPa. Expressing the analysis in reverse, the No. 3 sample reaches a suction of 103 kPa at a water content of 14.5%. The water contents in this suction for No. 1, No. 2, and No. 4 are 11.2%, 10.5%, and 13.1%, respectively.
SWCCs of No. 3 are at the top due to high plasticity and activity. This result shows that it would be inaccurate to evaluate the SWCC location using only the clay ratio without considering the plasticity and activity values (Figure 8). No. 2′s curve is positioned at the bottom because of the lowest plasticity. In addition, among the samples with similar clay content, No. 4 has higher suction than No. 2 at the same water content because of higher plasticity and activity. For example, in OWC samples, No. 2, with a clay percentage of 29%, has a suction of 1500 kPa at 10% water content, while No. 4, with a clay percentage of 32%, has a suction of 6000 kPa (Figure 8a). In addition, the SWCCs of No. 1, No. 2, and No. 4, prepared by consolidating from the slurry, have a close water content-matric suction relationship in the saturated and the residual zones (Figure 8c). In contrast, No. 1, with a higher clay percentage and plasticity, reached the same suction at higher water content than No. 2 and No. 4 in the transition zone. Tinjum et al. (1997) stated that decreasing plasticity or activity increases the SWCC slope [17]. The plasticity effect on the SWCC slope (OWC and wet of OWC) determined in the study is consistent with this approach (Figure 8a,b). In addition, No. 2, with the lowest plasticity, has the highest curve slope.
The SWCCs of samples prepared with consolidation from the slurry examined in the study are given together (Figure 8c). As expected, these silty samples’ curves are below the clayey samples’ curves. The initial water content values and the characteristic curves are shifted downward as they move from high plasticity to low plasticity. Non-plastic soils are located at the bottom. In addition, the large pores formed in the silty soils cause decreasing water loss resistance of the soil as the fines content decreases. SWCCs are placed at the bottom, resulting in smaller suctions at the same water content (Figure 8c). Related to this, AEV decreases as the fine content or clay percentage decreases, as shown in Table 4. Furthermore, the residual water content values of the silts are significantly lower than those of the clayey samples. In addition, the slopes of the separation from the saturation zone are higher in the silty samples because of losing water more quickly as suction increases.
The fact that the clay percentages of the soils are different is insufficient to explain the difference in the SWCC shapes. The percentage of clay in the clayey soils alone is insufficient to explain SWCC shapes. Moreover, plasticity and activity differences are found to have a real effect on the shapes. On the other hand, the influence of fine content or clay percentage is more pronounced on the SWCC of the silty soils.

3.3. Effects of Initial Water Content on SWCCs

Samples compacted at OWC absorb more water during saturation than samples at the wet side of OWC. For example, the water contents of the OWC and wet of OWC samples of No. 3 were 14.7% and 20.7%, respectively. In comparison, the saturated water contents of these samples were 19.6% and 22.2% (Figure 8). The SWCCs of the compacted samples converged as the water content decreased during drying. Similar results were found by Vanapalli et al. (1999) and Marinho and Chandler (1993) [11,45]. However, Marinho and Stuermer (2000) stated that compacted soils at OWC have less suction than the wet side of OWC [12]. In this study, the pores in the samples compacted at the OWC are generally smaller than the wet of OWC. This led to greater suction at the same water content closer to the residual zone. For example, the compacted at OWC of the No. 3 sample has a suction of 12,000 kPa at 10% water content, and the compacted at wet of OWC sample has a soil suction of 3000 kPa.
Samples prepared from slurry have the highest saturated water content since the pores are larger than the compacted samples. For this reason, the SWCCs of the samples prepared from the slurry showed a different trace, and the AEVs for the slurry samples decreased. The SWCCs of the consolidated clayey samples from the slurry as the suction value increased in all soils and coincided in the residual zone (Figure 9c). A similar situation is valid for silty samples. The SWCC traces are separate in the capillary saturated and transition zone and close together in the residual zone.
It was stated that the SWCC becomes steep, and the AEV increases as the OWC is moved upwards [17]. A similar approach was used by Meerdink et al. (1996), who reported that reducing the compaction water content resulted in a lower AEV and a shallower form of SWCC [46]. In this study, SWCC slopes and AEVs of the samples compacted at wet OWC are higher in all soils. For example, the AEVs for No. 2 are 242 kPa and 392 kPa for OWC and wet of OWC, respectively. Similar results are valid in No. 1, No. 3, and No. 4. However, in No. 2 and No. 3 soils, the AEVs of the consolidated samples from slurry are the lowest, it is the highest in No. 1, and it is close to the OWC sample of No. 4. No. 3 sample prepared from the slurry separated from the other soil samples and positioned very high up to the residual zone. No. 3 remains at a higher water content than other soils during slurry preparation and consolidation due to its high water absorption mineral.

3.4. Effects of Soil Properties on SWCCs

It is stated that the clay percentage of the soil and its minerals affect the shape of SWCC [18]. Water-absorbing minerals such as smectites (e.g., montmorillonite) in the soil affect plasticity and activity [17]. These parameters are the distinctive features that determine the resistance of soils against water intake and loss and affect permeability and pore structures [20,21]. It has been reported that larger absorption values are correlated with increasing clay percentage [15]. Significant correlations with void ratio, clay percentage, liquid limit, and plasticity on the SWCCs of different soils are shown in Figure 9. The fitted equations to these relationships and corresponding R2 values are listed in Table 5, with values between 0.70 and 0.93. The air entry water content increased almost linearly as the void ratio increased (R2 = 0.99) (Figure 9a). A similar relationship is valid for the residual water content-void ratio relationship (No. 3 is not taken into account in the residual water content-void ratio relationship because of being separated from other samples according to activity properties). Increasing the liquid limit, plasticity index, and clay percentage causes the air entry and residual water contents to increase (Figure 9b–d).
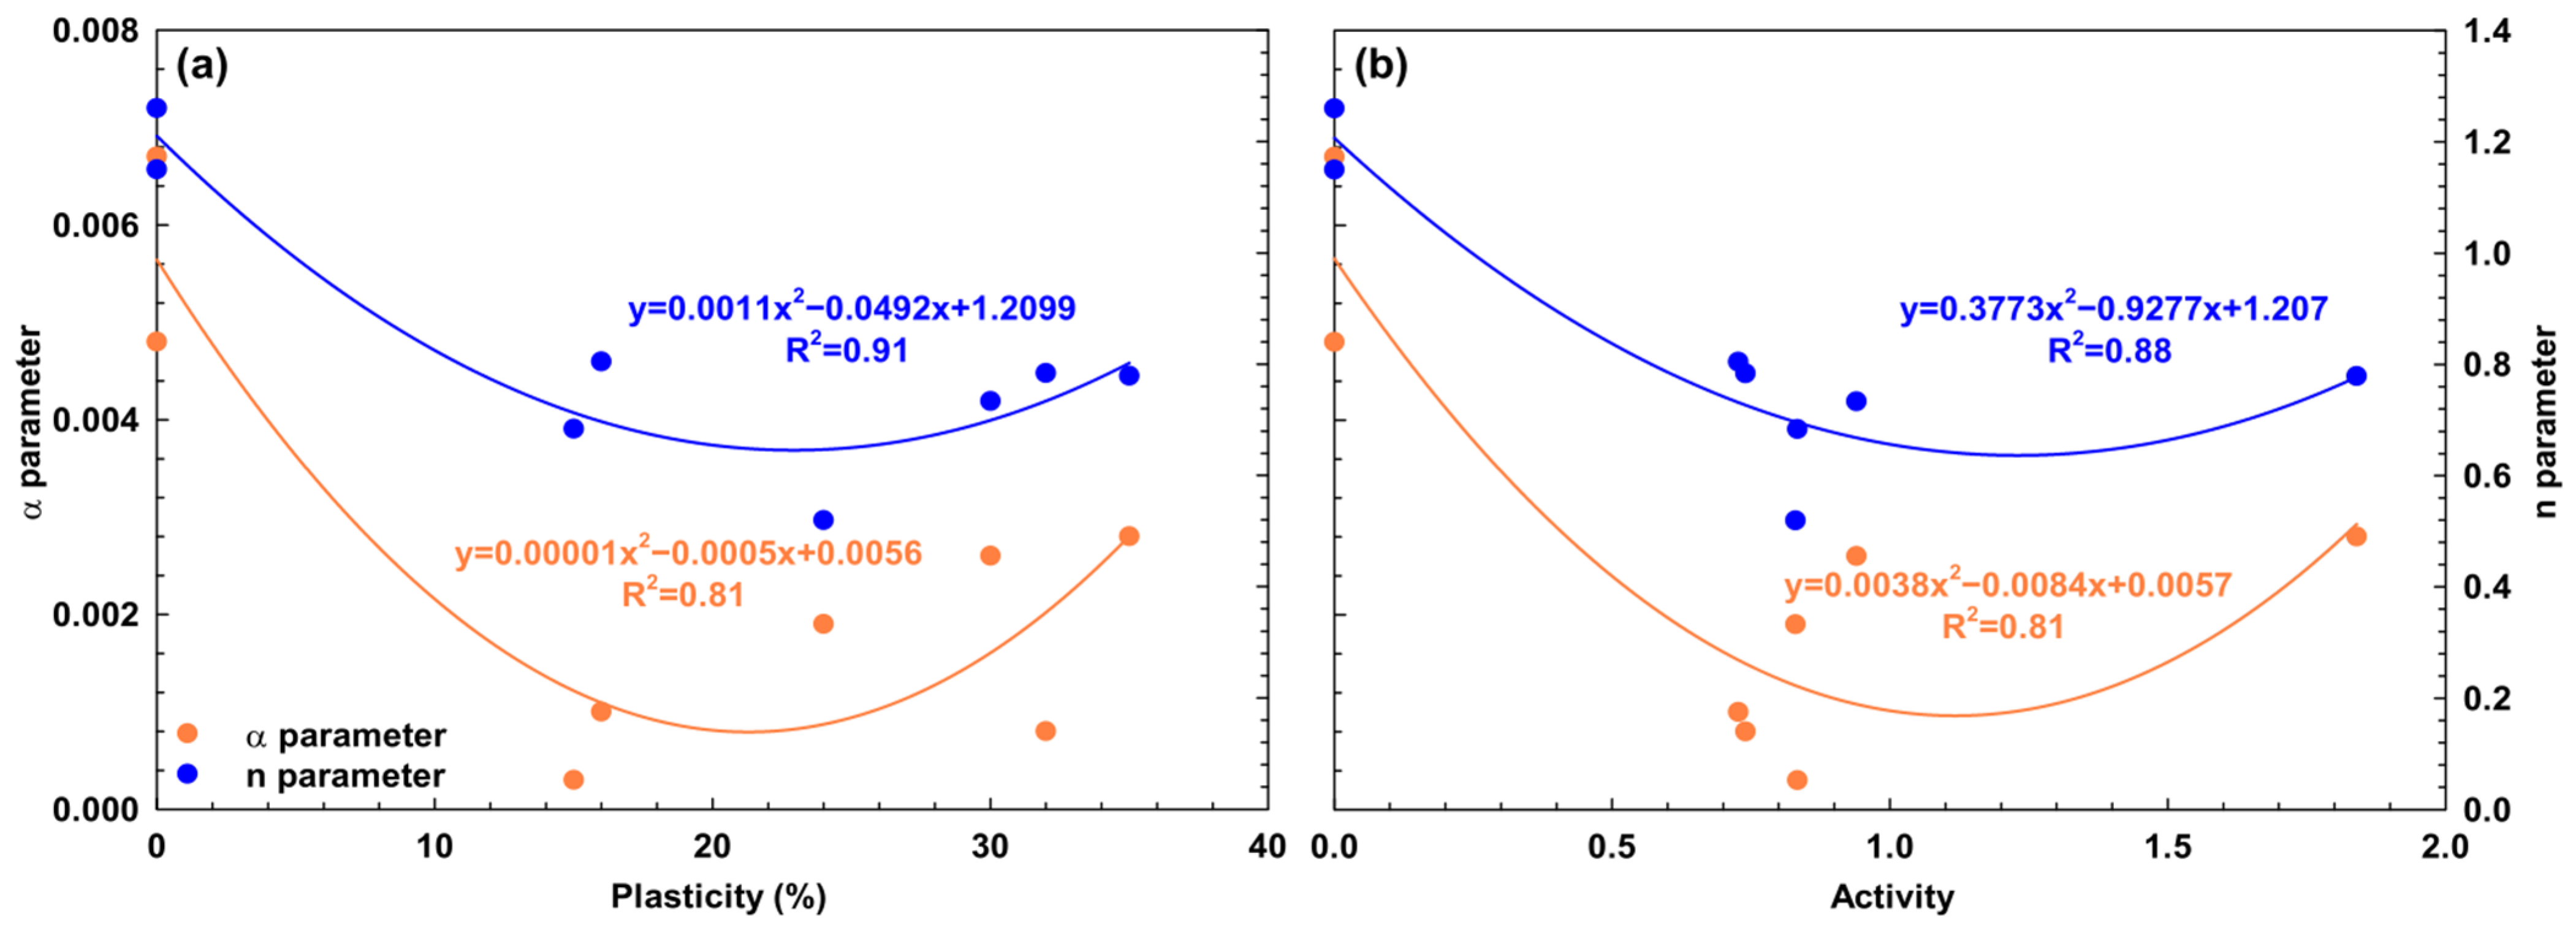
VG parameters “α” and particularly “n” significantly correlate with soil activity and plasticity (Figure 10). Parameters α and n display relatively large values in non-plastic and non-active soils. α and n values tend not to change after plasticity and activity reach 25 (%) and 1.0, respectively.

3.5. Pore-Size Distributions (with SEM Images)

The size, shape, and distribution of soil pores are critical features that determine soils’ engineering behavior. This study calculated the PSDs of soils from SWCC using a procedure proposed by Lu and Likos (2004) [23]. The PSDs were calculated by incremental and cumulative distributions. The Kelvin radius ( r k ) was calculated from the experimentally measured suction using Equation (4). Kelvin radius refers to the radius of the pore filled with air.
r k = 2 T s ( u a u w )
Ts is the surface tension, and (ua − uw) is the measured suction. The surface tension was given 72 MN/m for water at 25 °C (298.16 K) by Weast et al. (1981) [47]. The actual pore radius ( r p ) was calculated by Equation (5).
r p = r k + t
where t is the thickness of the water film adhered to the grain surface with matric suction and calculated with the Halsey equation (Equation (6)):
t = τ [ 5 l n ( R H ) ] 1 / 3
where τ is the effective water molecule diameter and is assumed as 2.77 × 10⁻⁴ µm [48,49].
In this study, the universal gas constant is taken as 8.314 J/molK at atmospheric pressure, and the molar volume of liquid water is taken as 0.018 m3/kmol.
The change in the pore volume (pore volume per unit mass) ( Δ V p ) with the increase in matric suction is calculated by Equation (7).
Δ V p = Δ w ρ w
where Δw is the change in water content, ρ w (1 g/cm3) is the density of water.
Zaffar and Lu (2015) stated that the peak values at incrementally obtained PSD correspond to the pore dimensions dominant in the soil [27]. They noted that the valleys between the peak values are the boundaries between the pore dimensions, and pore sizes smaller than 5 µm in clayey soils could be considered micropores. Pedarla et al. (2013) expressed 6–60 µm size gaps in the cumulative PSD relationship as large pores, 0.01–6 µm size range as medium pores, and 0.002–0.01 µm size range as small pores [20]. According to Wan et al. (1995), since the dimensions of the middle pores refer to the voids between the grains, they can be considered large pores [26]. The pore-size analysis in this study was made over the peak values of the PSD curves. Small pores refer to intragranular voids, and large pores indicate voids between grains. The first peak shows the small pore mode, and the second peak is the large pore mode.
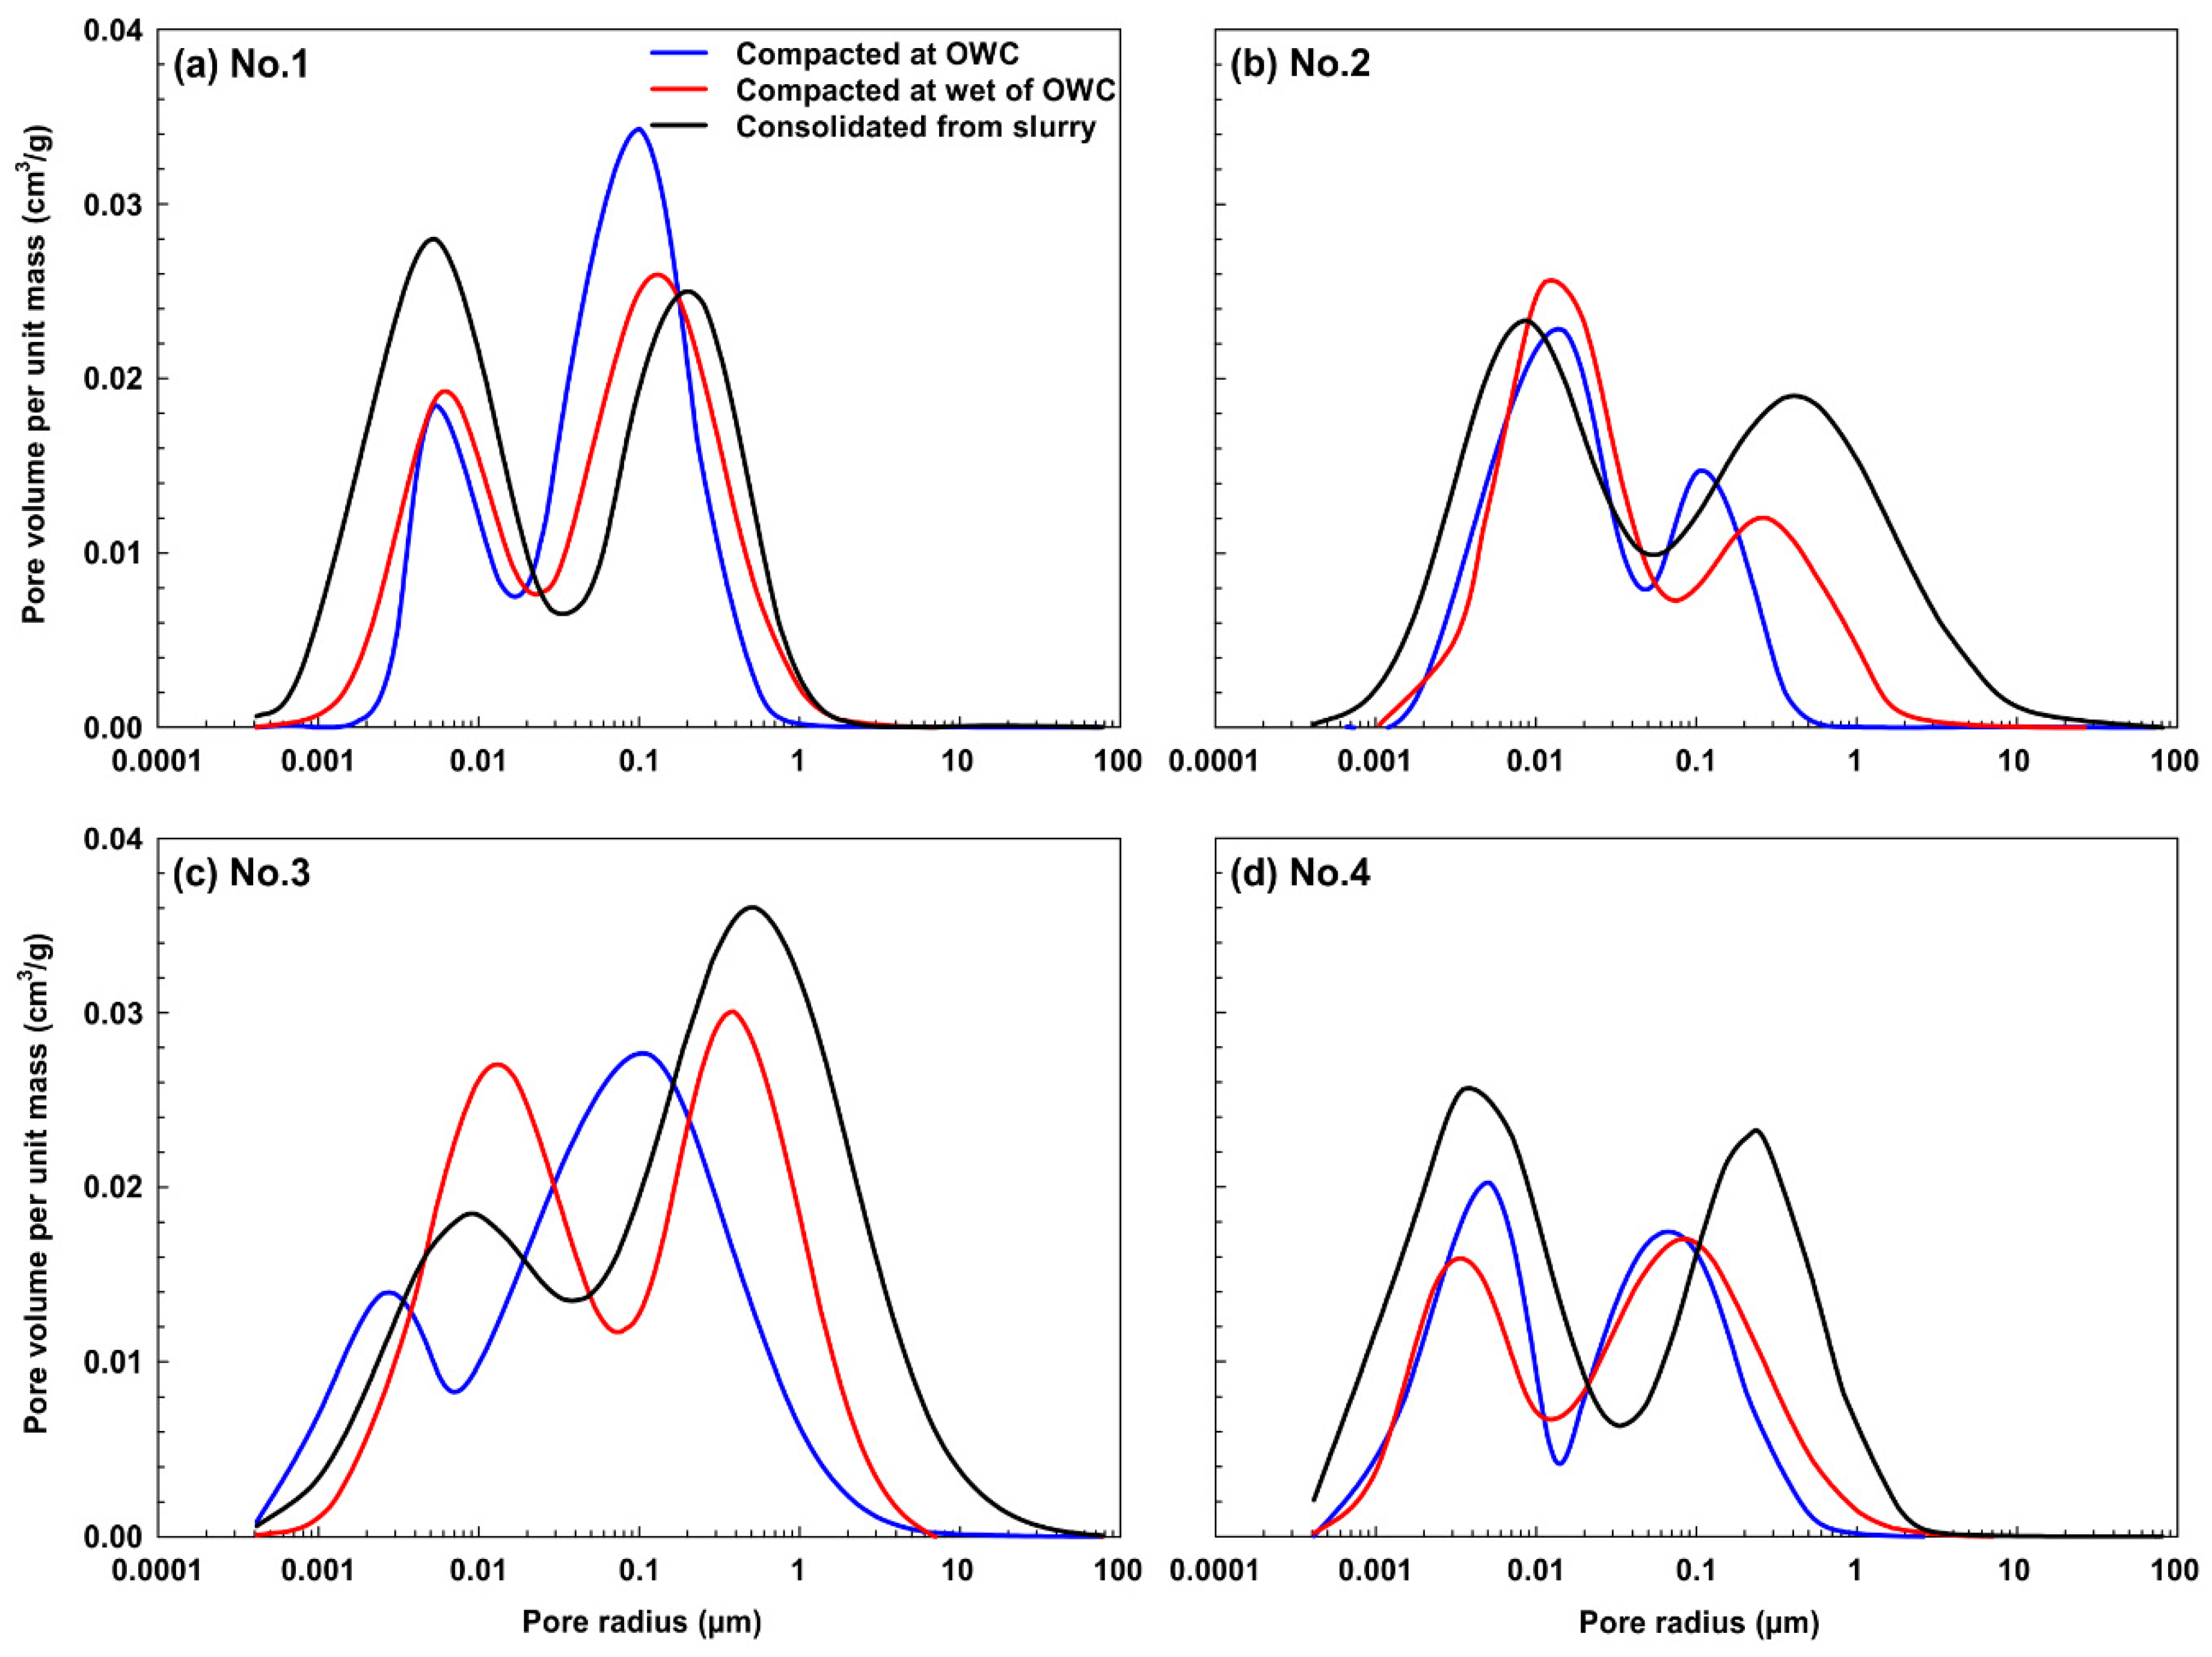
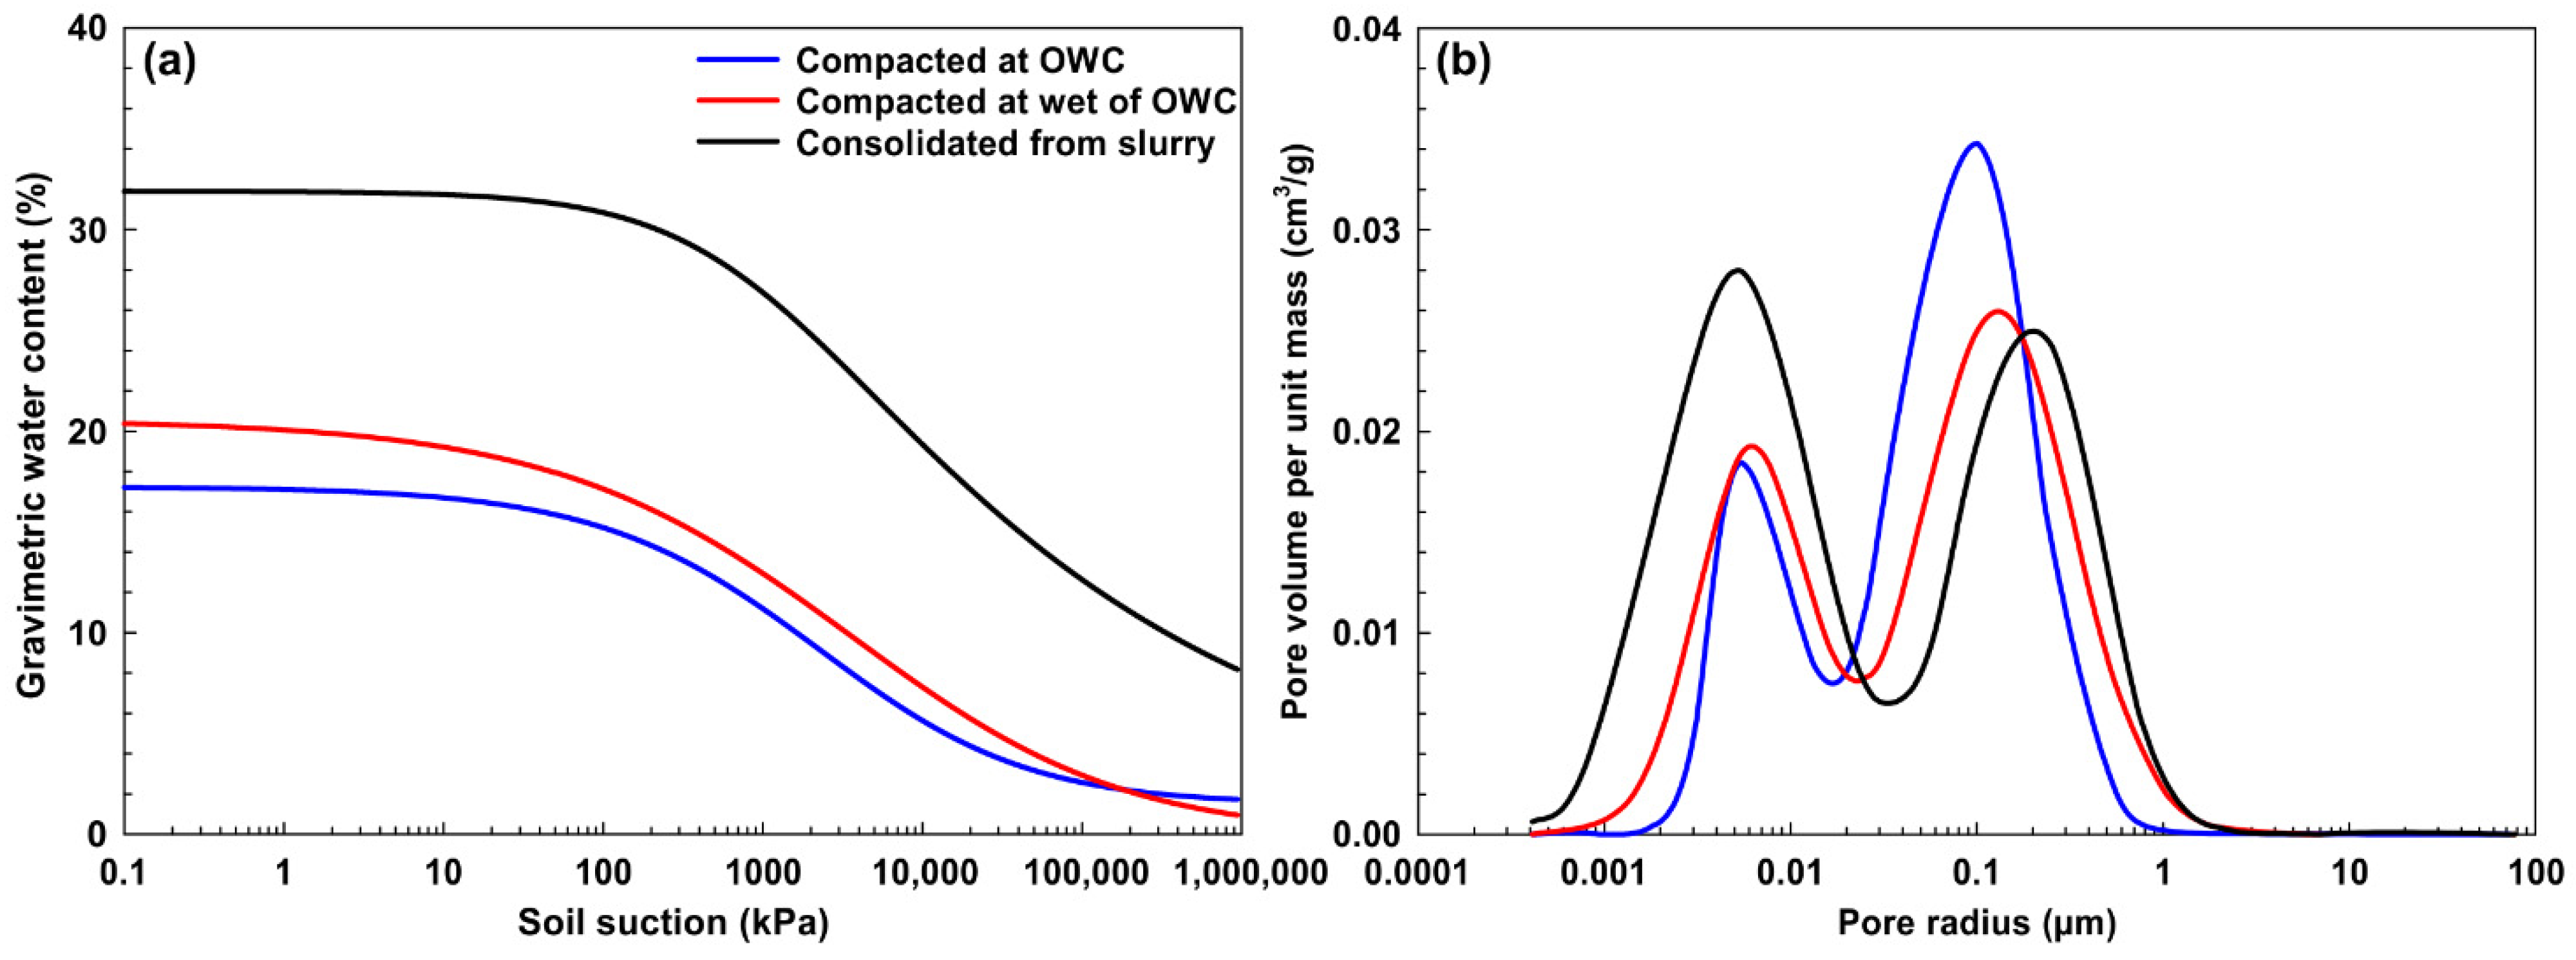
Incremental PSD fitting curves were obtained with the chi-square method from the data. The samples compacted or consolidated from slurry showed a bimodal PSD (Figure 11). This distribution indicates that the specimens have small and large pore modes. This result coincides with compacted clayey soils having a bimodal or multimodal pore structure, as Thom et al. (2007) reported [28]. PSD properties of soils are provided in Table 6.
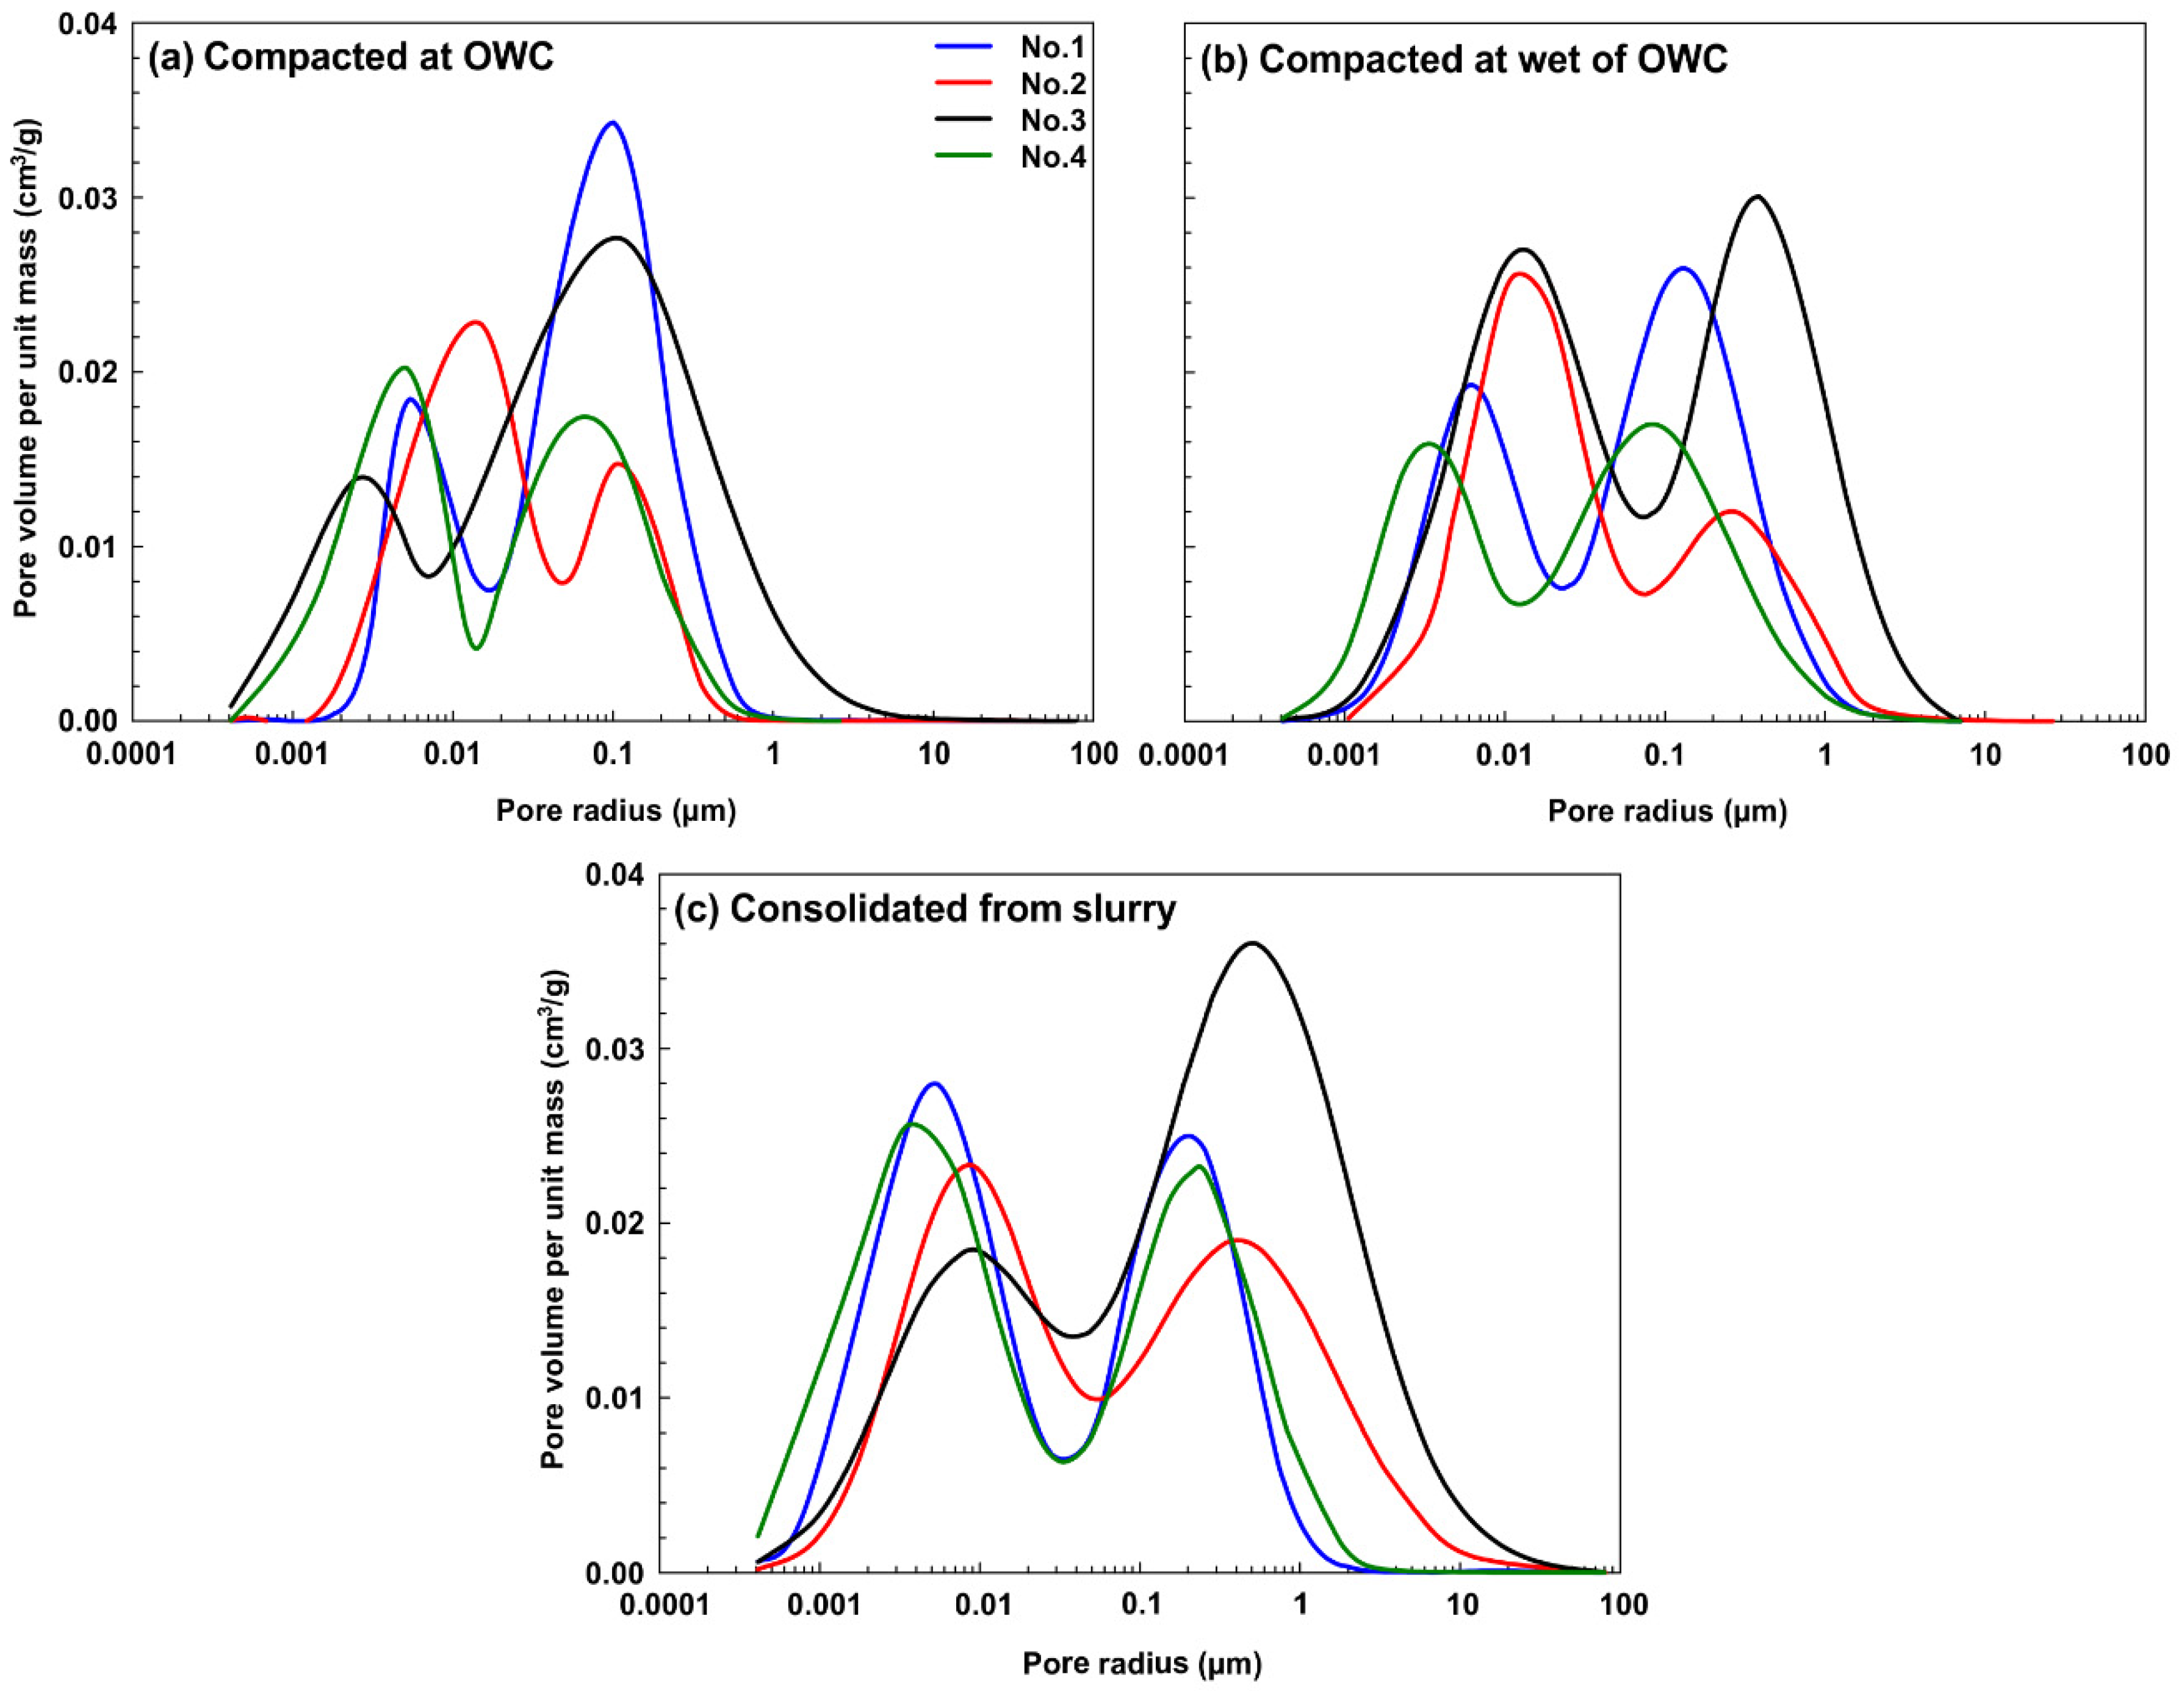
Different preparation methods of clayey samples (Nos. 1, 2, 3, 4) affected the PSDs. The largest intergranular pore radius (the second peak) was in the samples consolidated from the slurry. The samples compacted at wet of OWC generally have a bigger second peak radius than those compacted at OWC. It was determined that the peak values indicate that the intragranular pores involve pore radius close to each other for one soil. For example, the values showing the small pore modes of No. 1 (compacted at OWC, compacted at the wet side of OWC, consolidated from a slurry) are up to 0.013 µm, 0.025 µm, and 0.028 µm, respectively (Figure 11a). Large pore sizes begin from this valley point value. The second peak value indicates large voids increases from compacted samples to consolidated from the slurry. The first peak is close to each other for all three samples.
The intergranular pore radius of No. 3 is larger than about 0.008 μm, 0.075 μm, and 0.034 μm, respectively, for the samples compacted at OWC, wet of OWC, and consolidated from slurry (Figure 11c). No. 3 showed a different curve than the other samples. The large and small pore modes are shifted to the right in No. 3.
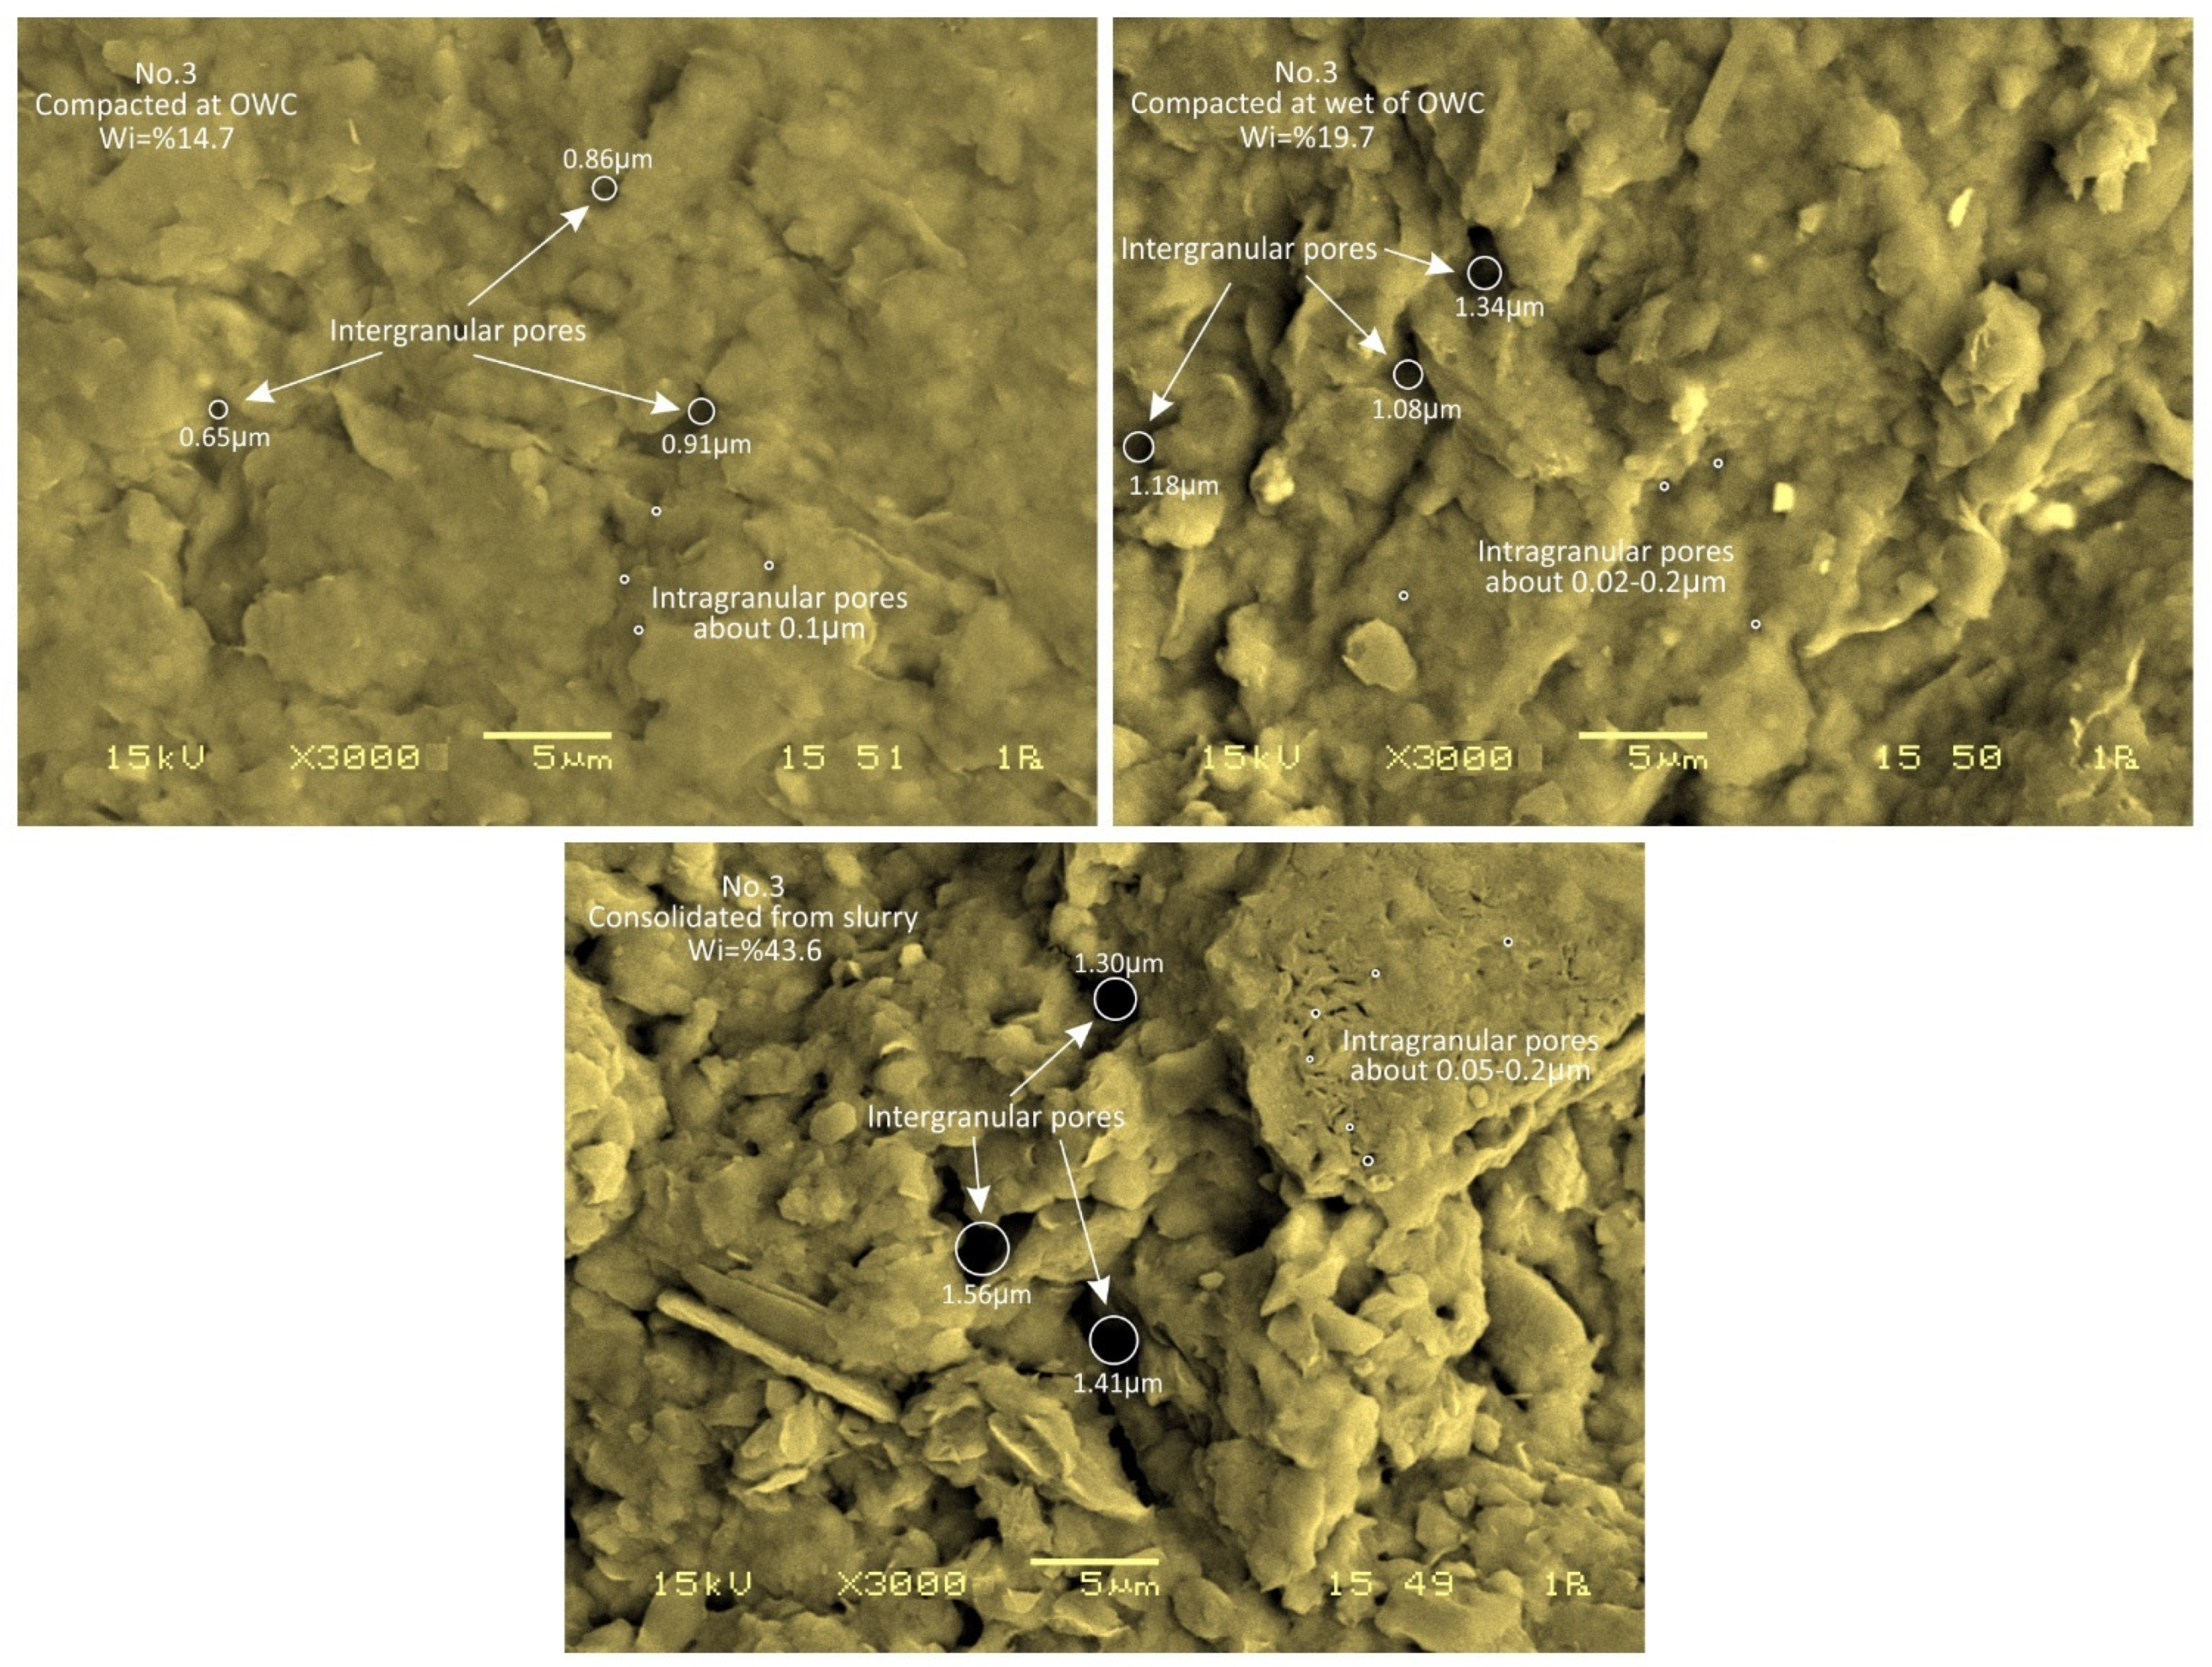
Electron microscope images of No. 3 at 3000× are given in Figure 12. SEM analyses for all samples used in this study confirmed that compacted soils have bimodal pore structures. It is seen that the pore sizes between the grains are 10–30 times the size of the intragranular pores. The images obtained for No. 3 generally confirm the pore size obtained from the SWCC. Like the pore sizes calculated from SWCC, the intergranular pore dimensions of the consolidated sample from the slurry are larger than those of the compacted samples. Similarly, the sample compacted at wet of OWC has a larger intergranular pore size than the sample compacted at OWC. There is no definite difference between the observed (SEM) and calculated pore sizes for intragranular pores. The sample preparation method and unit volume weight do not significantly affect the intragranular pore sizes. The intragranular pore analysis in this study is supported by Wan et al. (1995) [26]. In addition, the initial water content change does not substantially affect the intragranular pore sizes. Still, it increases the radius of intergranular pores (the second peak). This situation was also indicated by Thom et al. (2007) [28].
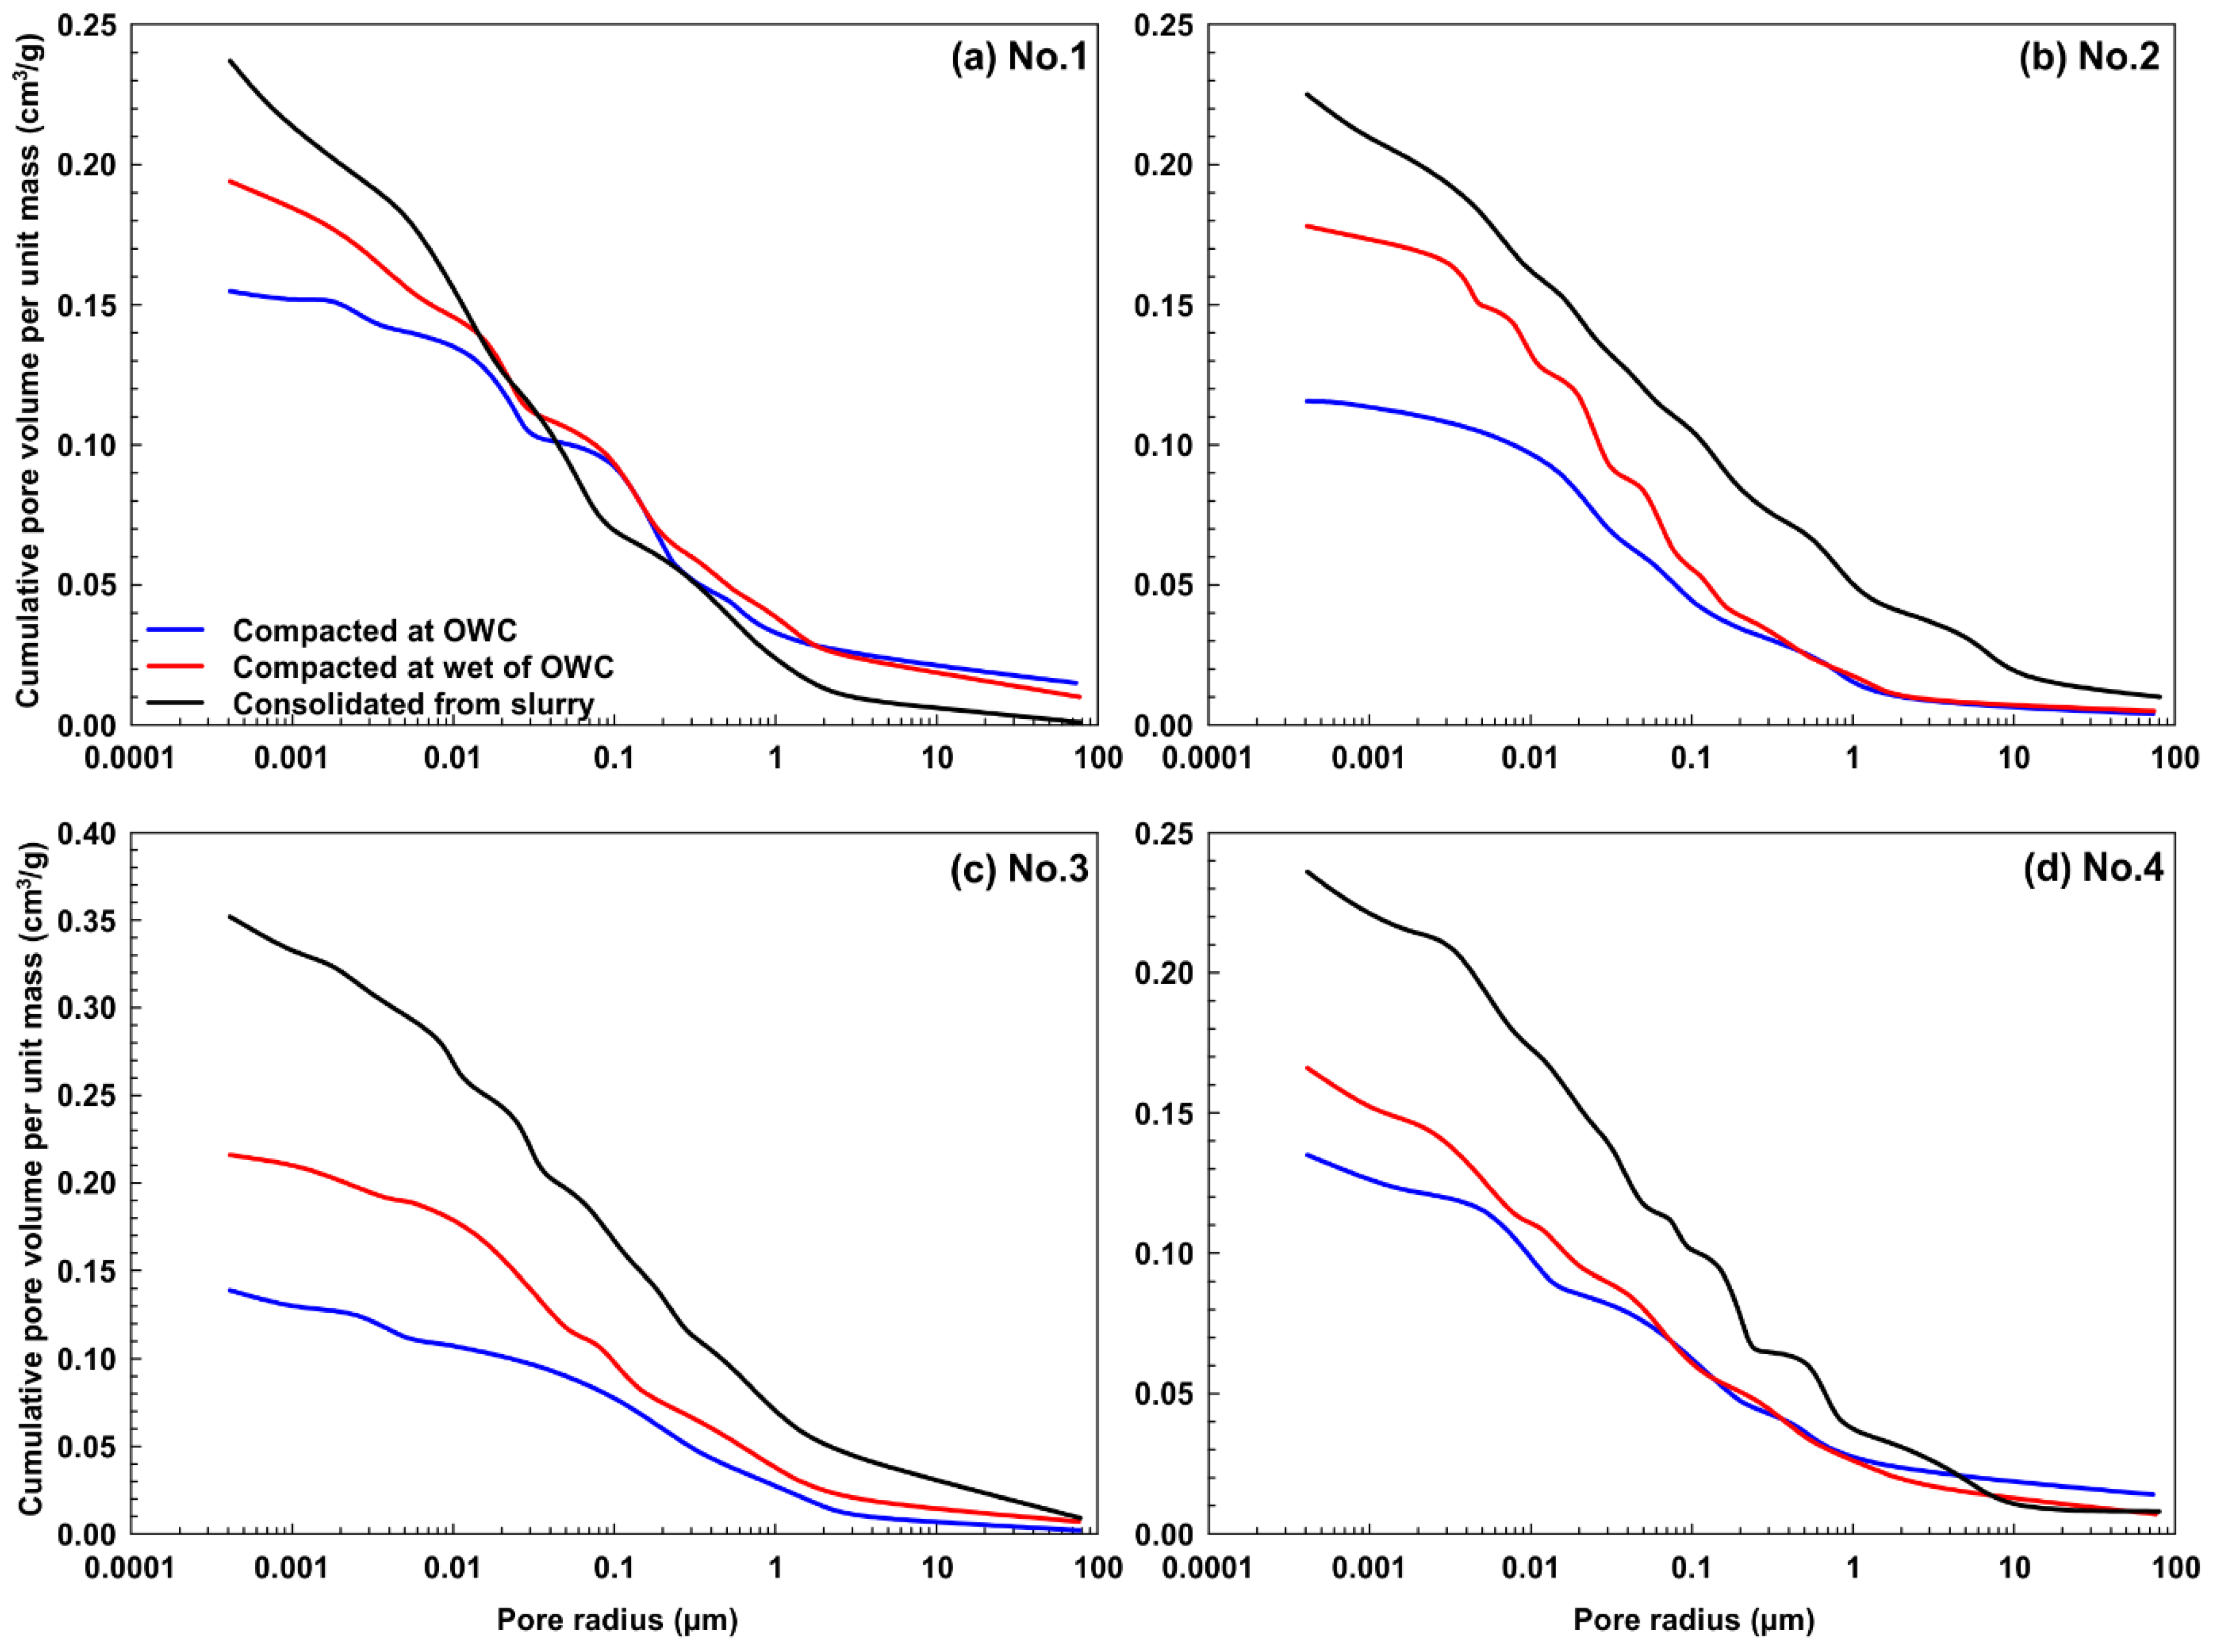
The cumulative PSDs are presented in Figure 13. The pore volume in the unit mass decreases for the samples prepared at the OWC and increases for the samples consolidated from a slurry. The cumulative pore volume increases as the void ratio increases. The samples consolidated from a slurry differ significantly from the compacted samples. This difference was limited to No. 1. However, the PSD curves after the valley point followed similar trends. Burton et al. (2014) stated that the cause of this situation is not known precisely, but sample preparation may be the cause [50]. The distinctness of the PSD of No. 1 may be due to the differences in grain sizes of the samples taken from the compaction and the impact of sample scalping.
PSD curves of clayey samples prepared with the same method are presented in Figure 14. The effect of void ratio on PSD curves decreased from slurry samples to samples prepared at OWC. No. 3 has a larger void ratio in all cases and has a close macropore size to other specimens compacted at OWC. Still, the PSDs of No. 3 are generally differentiated from other soil samples by shifting up and to the right at the level of macropores. The second peak values of No. 1 and No. 4, which have similar void ratios and initial water content, are close. This situation is also valid for samples prepared at OWC and the wet side of OWC of the same soils. These results show that soils have unique micro and macropore structure. Namely, the pore-size structure and distribution of different clayey soils with similar water content, void ratio, or unit weight per volume can be substantially different.
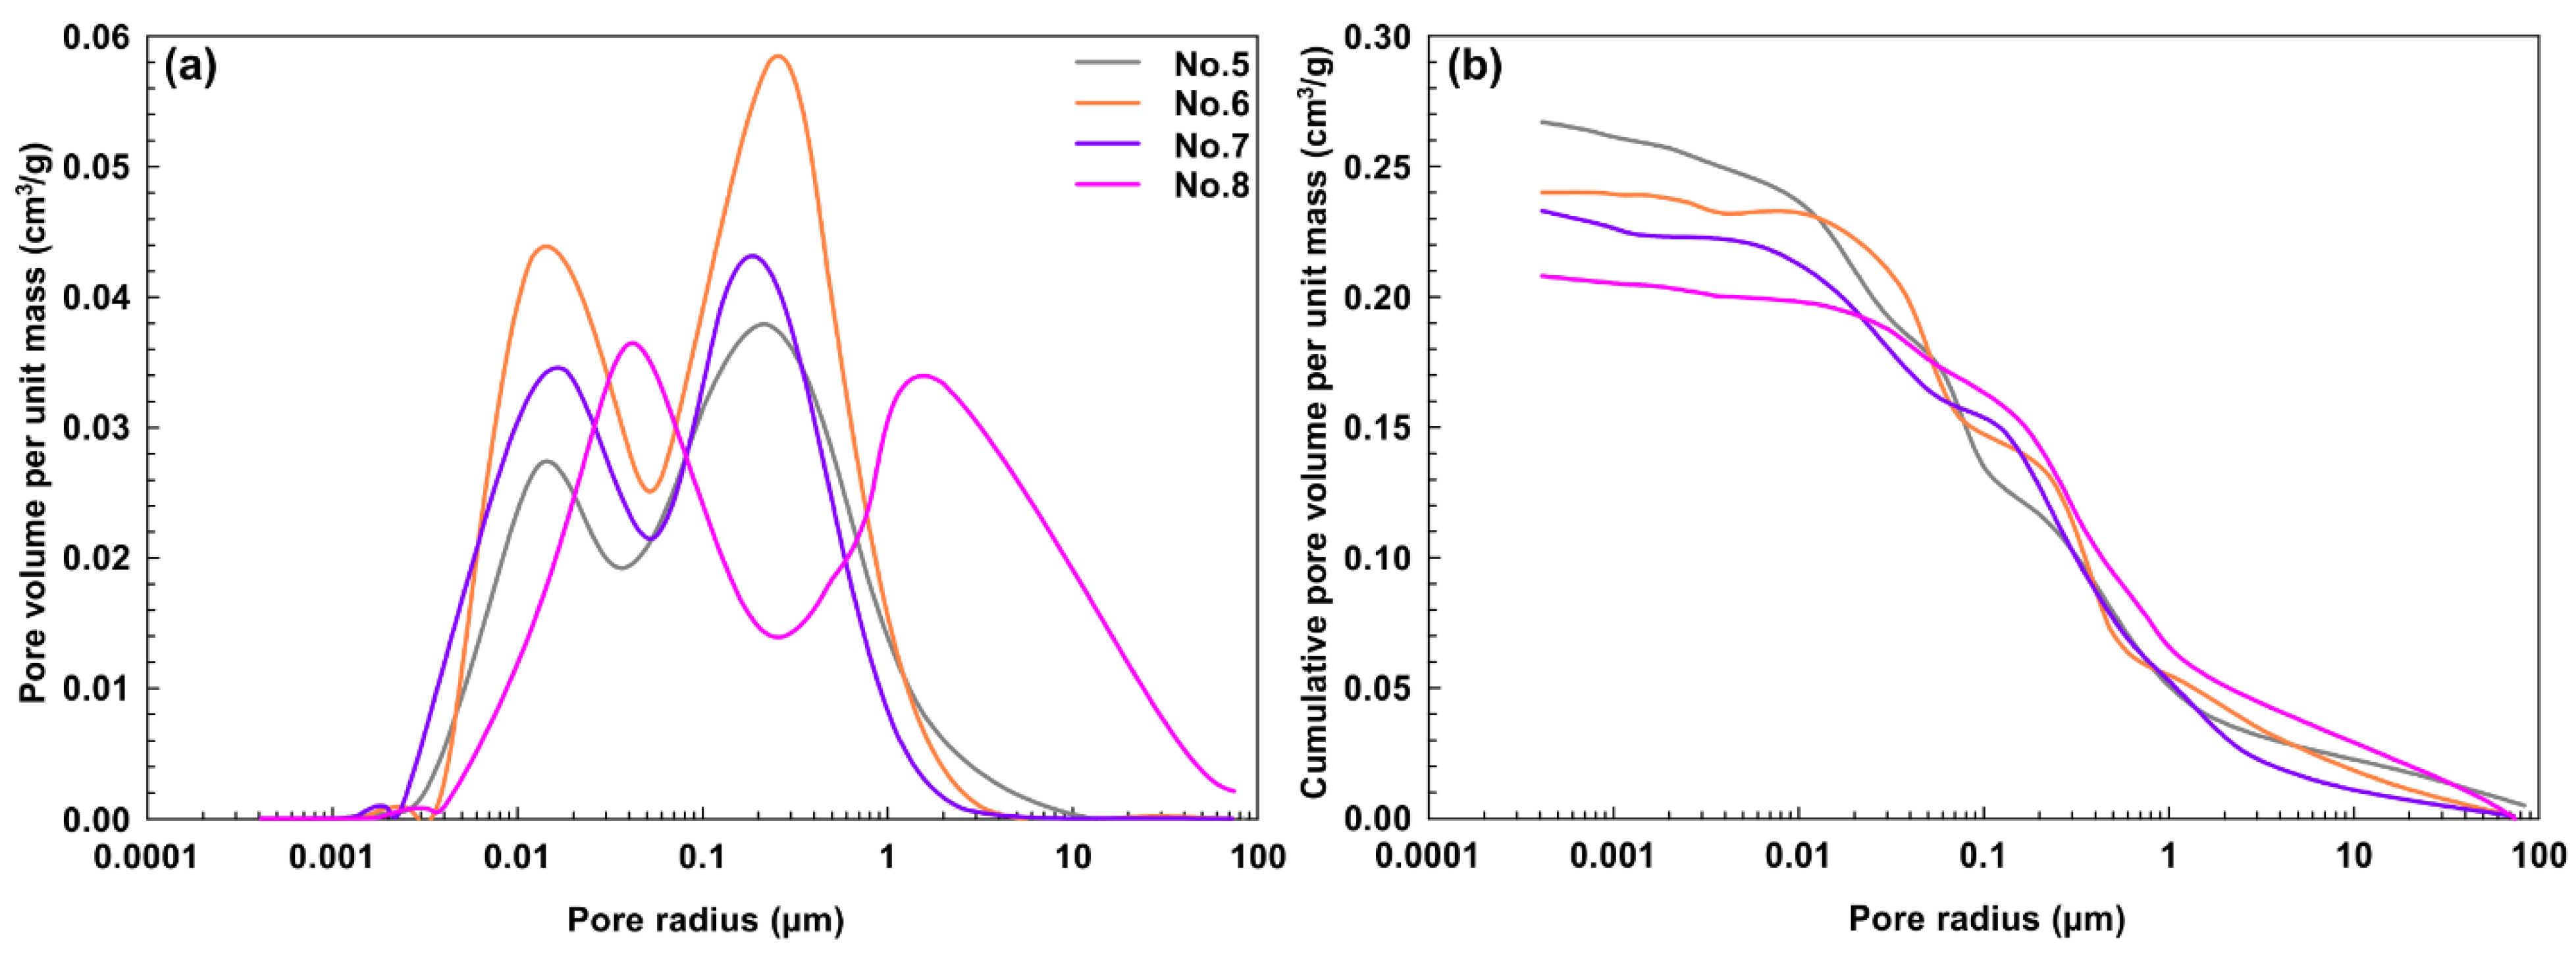
Differential and cumulative PSD curves of silty samples are given in Figure 15. The intragranular pores are larger in silty samples than in clayey samples. The pore sizes of silty samples are about 0.06 µm and smaller than 0.03 µm in clayey samples. No. 8 appears to be differentiated from other specimens. The void ratio is the lowest in No. 8, but the micro and macropore sizes are the largest. The PSD curves of silty samples generally showed a close distribution than clayey samples. In addition, decreasing the clay content minimized the cumulative void volume.
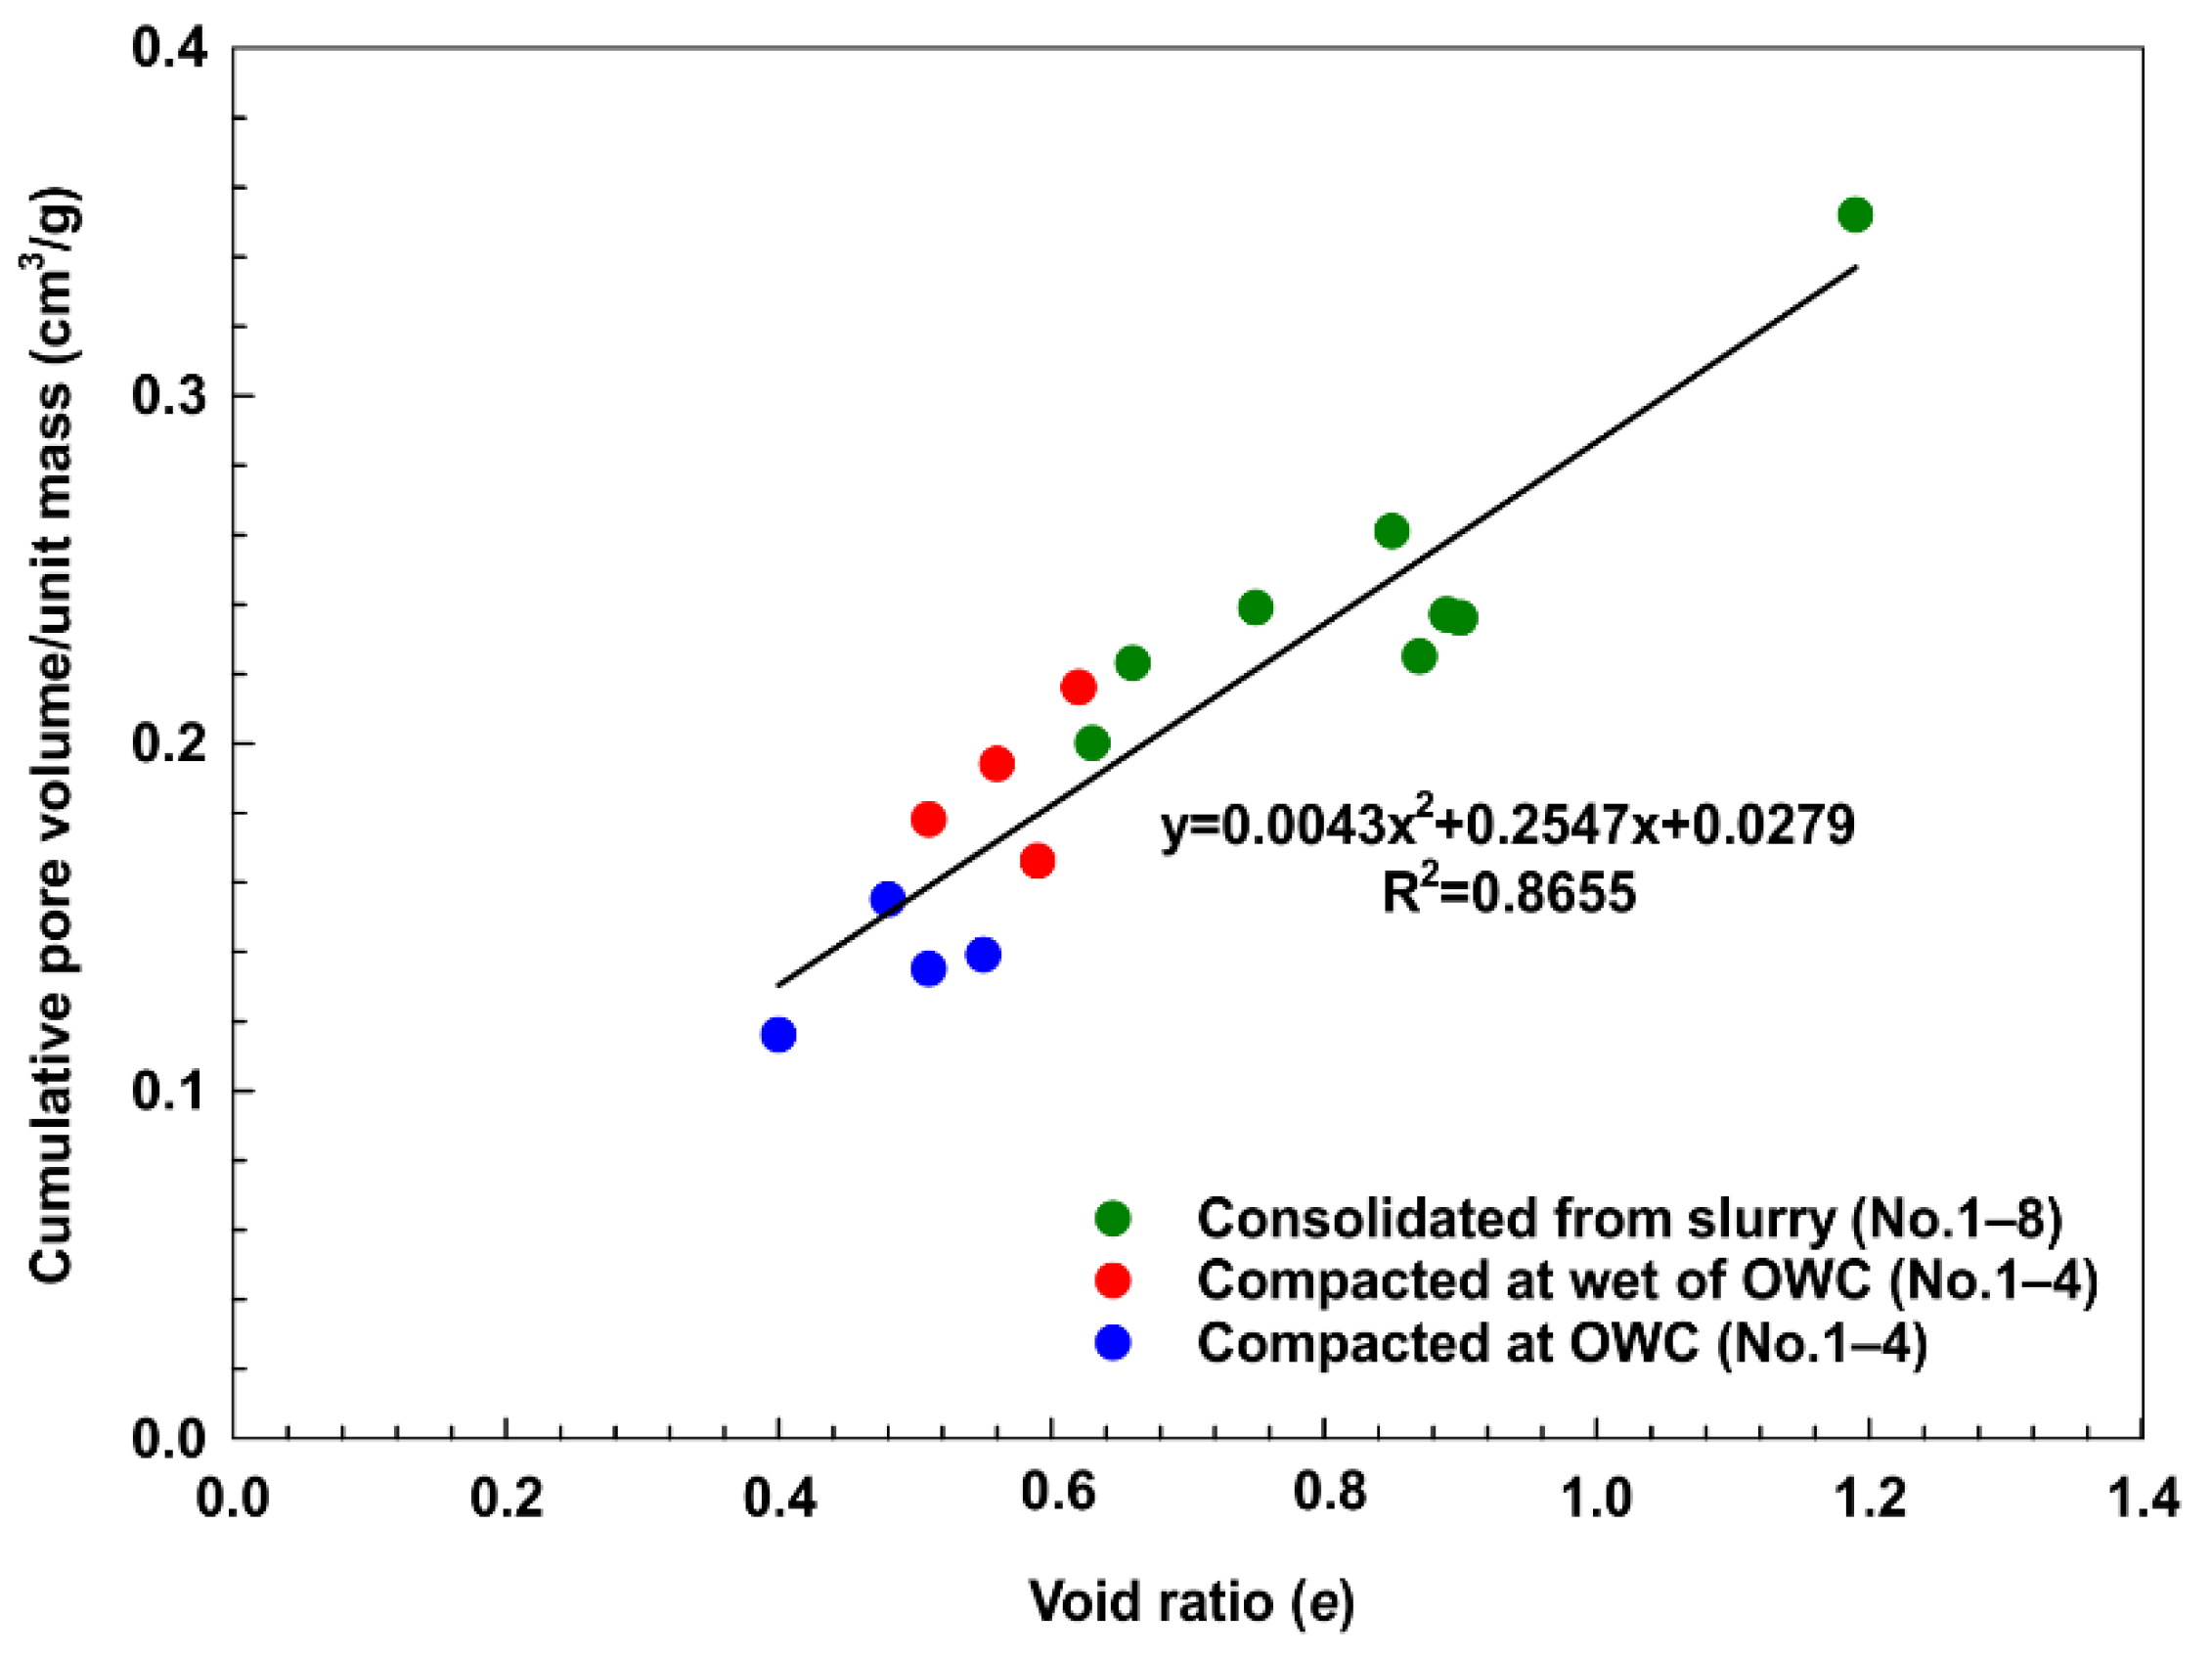
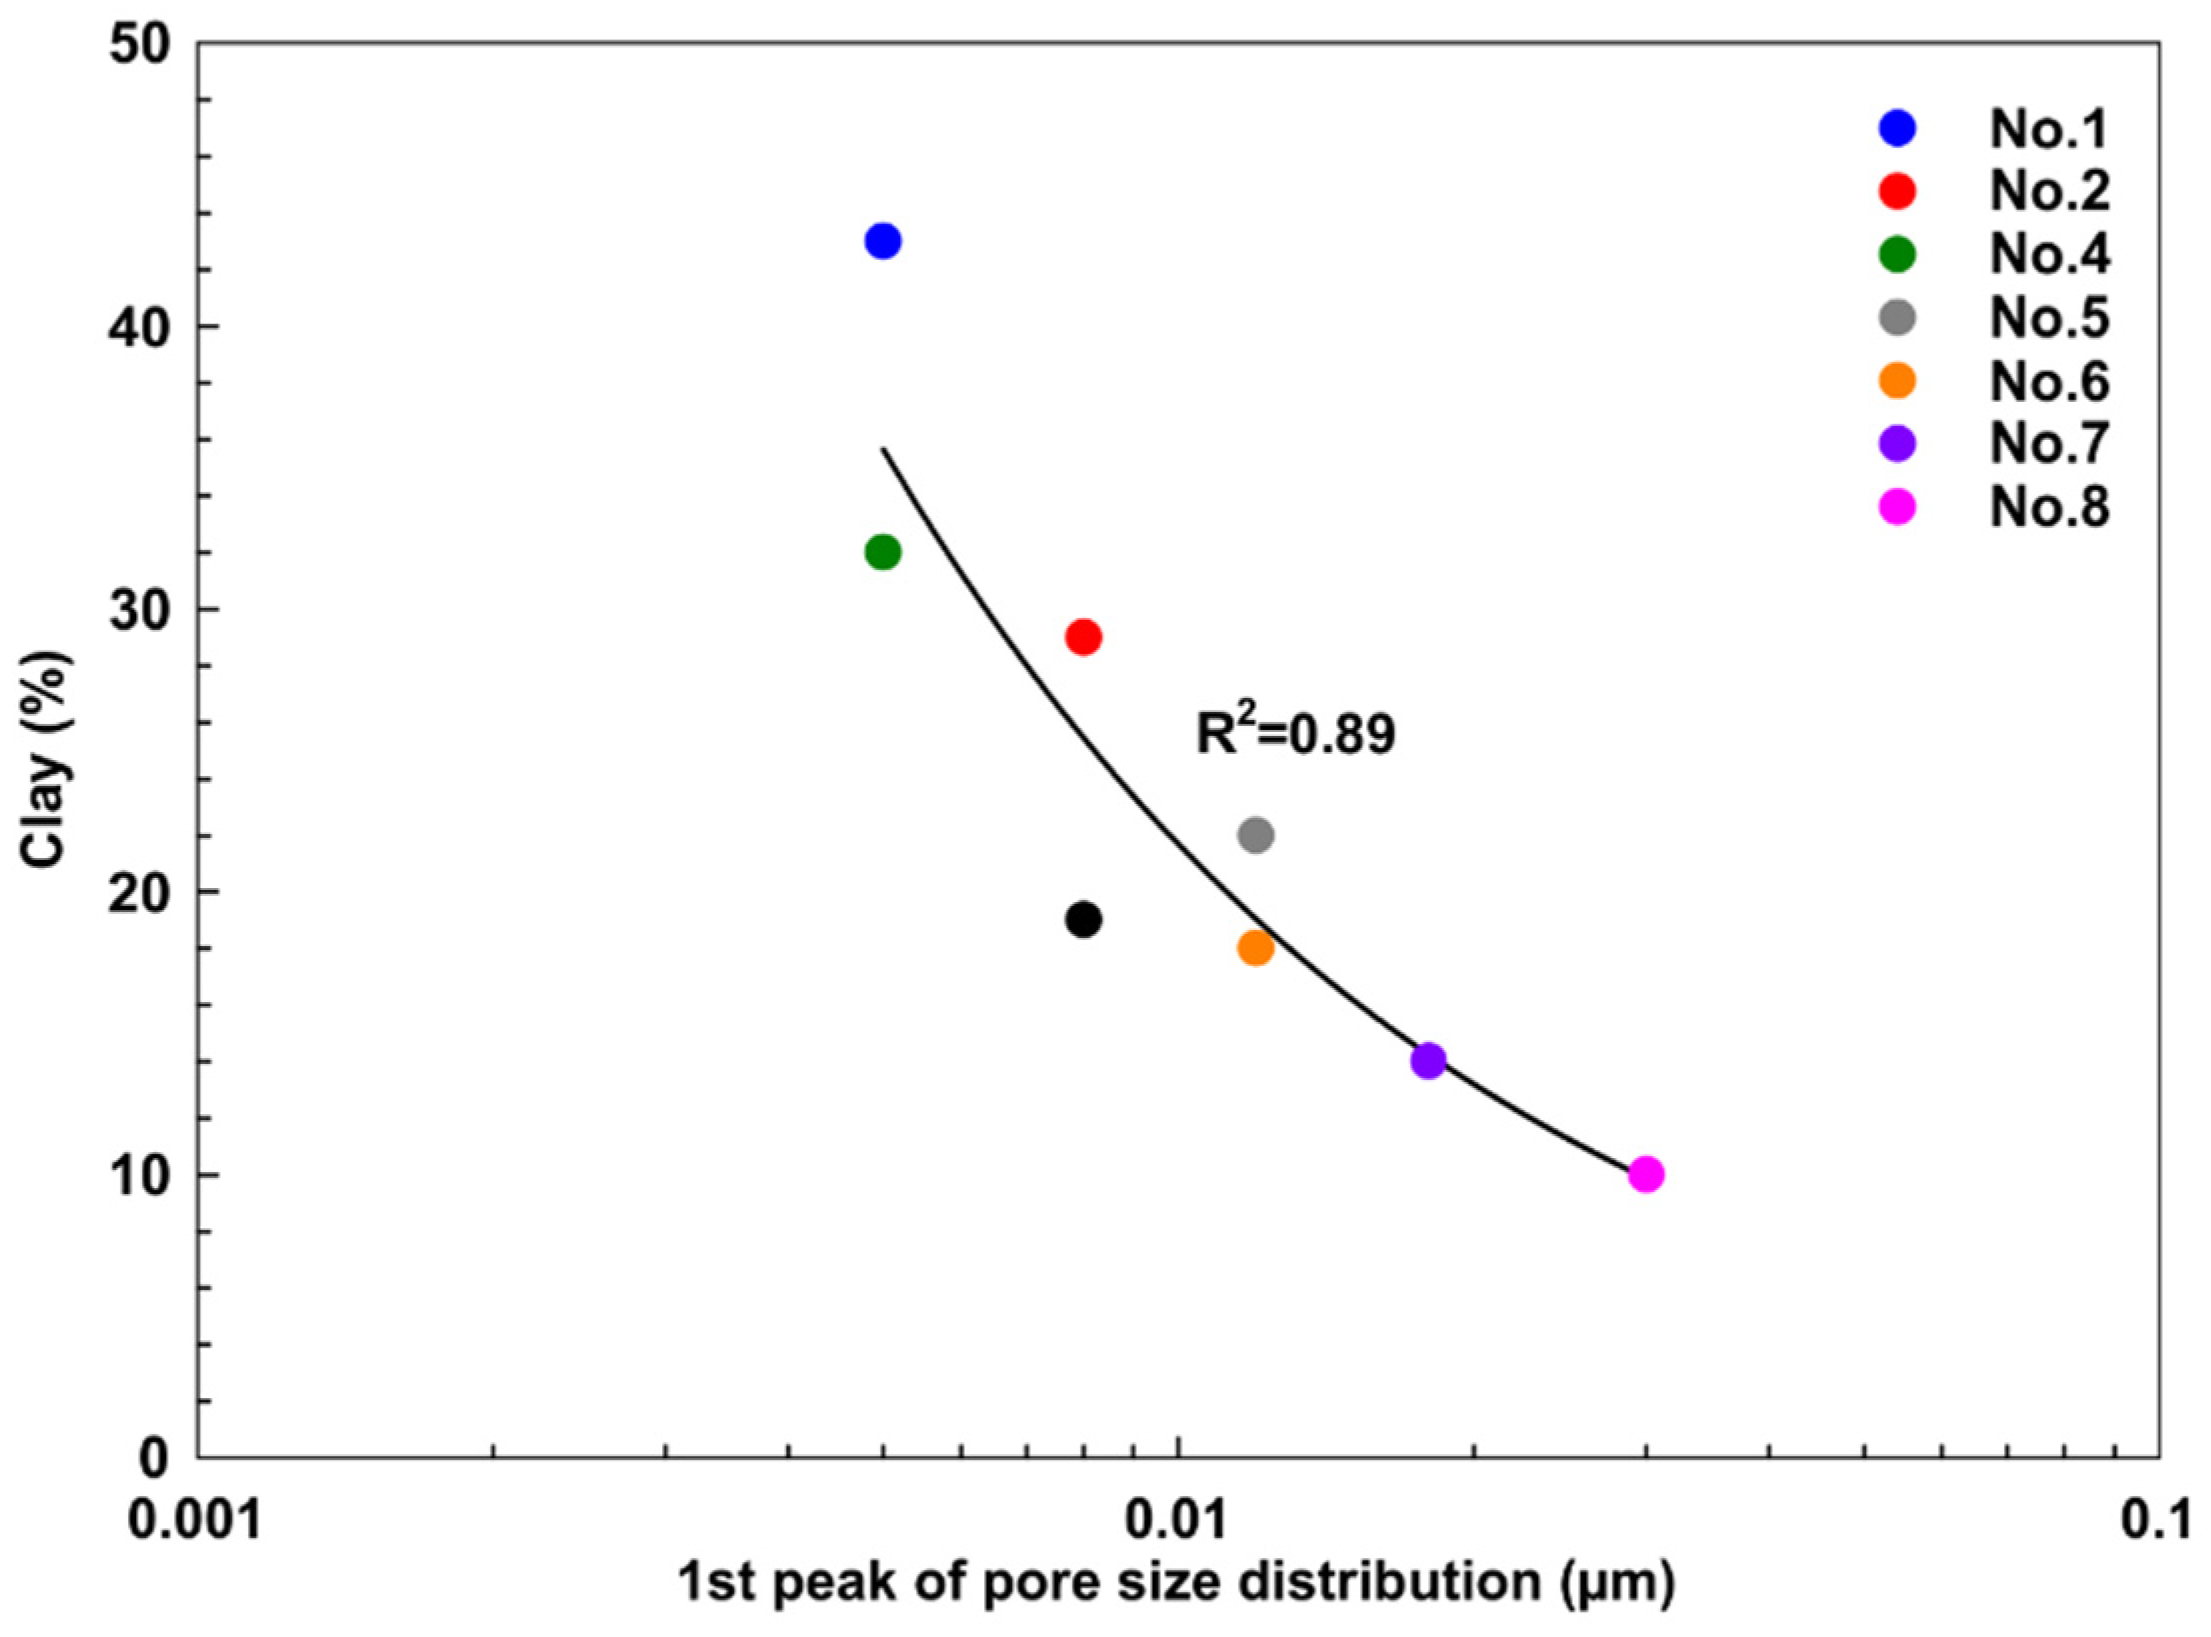
The cumulative pore volume rises with the increase in the void ratio (Figure 16). There was an almost linear increase in the void ratio-cumulative pore volume relationship from compacted at OWC to wet of OWC and consolidated from a slurry. It was possible to capture the closest relationship with a quadratic equation. The relationship between the clay fraction and the first peak value in the PSD is presented (Figure 17). The increase in the clay content leads to a decrease in the size of the first peak value.
The pore radius where the rapid matric suction change occurs and the water content range in which this change occurs were estimated by examining the SWCC and the PSD curve (Figure 18). No. 1, with 93% fine content, has an intergranular pore radius of less than 1.0 μm. The total pore volume of the sample consolidated from the slurry consists of 0.0004–1 µm radius pores, and the intergranular pore size is in the range of 0.03–1.0 μm. Matric suction showed a rapid change in the valley region (approximately 0.03 μm pore radius). This rapid change in matric suction occurred in 22–25% water content. The total pore volume of the sample prepared at wet of OWC consists of pores with a radius of 0.003–1.0 μm. Intergranular pore size is between 0.03 μm and 1.0 μm. The pores in the sample compacted at OWC have a radius of 0.002–1.0 μm, and the radii of intragranular pores are between 0.002 and 0.015 μm. The rapid change in the matric suction of both samples prepared by compaction occurred in a pore radius of 0.015–0.025 μm. The rapid matric suction change occurred at 4–8% water content for the OWC and 5–10% water content for the wet of OWC. Compacted samples showed rapid matric suction change at smaller pore sizes and lower water contents than the sample consolidated from the slurry. The change in water content decreased as it moved away from the valley regions toward the micropore peaks, and the suction values increased tremendously. The difference in water content continued with evaporation from the micropores after the residual value at which water drainage from the large pores was completed. In addition, micropores accelerated the matric suction change more than macropores.

4. Conclusions

SWCCs and PSDs of eight different fine-grained soils were investigated. The effects of the physical properties on the SWCC, micro and macropore structure, and the relationship between SWCC-PSD were examined. The samples were prepared by two different methods: compacted at OWC or wet of OWC (then saturated) and consolidated from slurry (assumed saturated). Matric suction and SWCC were measured using the filter paper method, and the VG mathematical model was fitted to the SWCC data. The PSDs were determined from the SWCCs using the procedure given by Lu and Likos (2004) [23]. SEM was used to observe the pore structure of the samples. XRD analysis was performed to determine the mineral types of the soils.
The following conclusions are advanced:
  • Clayey soils compacted at OWC have greater soil suction than soils compacted at wet of OWC. The SWCCs of the samples prepared at OWC and wet of OWC converged beyond the AEV;
  • The mineral type of the soil affects SWCC. Illite-type mineral-containing soil has a higher matric suction than that containing kaolin-type minerals;
  • The soil with high plasticity and activity reached a higher matric suction depending on its mineral type, although the clay content was lower. AEV decreased as plasticity decreased in cognate samples;
  • The effect of the clay percentage is more pronounced in silty soils than in plasticity. The lower the clay percentage in these soils, the lower the suction value at the same water content. The resistance to water loss and the AEV decreased as the clay content decreased. The SWCCs of the compacted samples converged as the water content decreased;
  • SWCCs of the clayey samples consolidated from slurry were located above the compacted samples. Notably, the SWCCs of the samples consolidated from the slurry in clayey and silty soils converge in the residual zone. The AEVs of these samples were lower than those of the compacted samples. Compaction properties affect the properties and shape of the SWCC;
  • The air entry and residual water contents rose as the void ratio, liquid limit, clay content, and plasticity increased. VG α and n parameters have high values in non-plastic or non-active soils. These values decreased up to 25% plasticity and 1.0 activity, after which they showed a partial increase or remained constant;
  • Samples prepared showed bimodal PSDs irrespective of the preparation method. SEM images of the samples confirmed that situation. Compaction conditions strongly affected the intergranular spaces, but this effect was limited to the intragranular pores. The largest intergranular pore radius was encountered in the sample consolidated from slurry, and the smallest intergranular pore radius in the compacted at OWC. This situation is also supported by SEM analysis. Macropore sizes in slurry samples are close to 100 times the micropore sizes. This ratio is around 10 in samples prepared with OWC;
  • The cumulative pore volume of the samples consolidated from the slurry is higher than that of the compaction samples. The pore sizes of silty samples dominating the micro and macropore modes are twice that of the clayey samples. The cumulative pore volume decreased as the clay content decreased in silty samples. There is a quadratic relationship between the void ratio and the cumulative pore volume. In addition, the micropore mode peak decreased with increasing clay content. An exponential relationship was found between them.

Author Contributions

Writing-original draft, K.K; conceptualization, A.O. and T.B.E.; supervision, A.O.; investigation, K.K.; methodology, K.K., A.O. and K.O.; data curation, K.K., T.B.E., E.B. and M.O.; writing-review and editing, T.B.E., E.B., S.S., K.O. and M.O. All authors have read and agreed to the published version of the manuscript.

Funding

This research received no external funding.

Data Availability Statement

Not Applicable.

Acknowledgments

We thank Pelin Ozener (Yildiz Technical University) for comments and suggestions.

Conflicts of Interest

The authors declare no conflict of interest.

References

  1. Fredlund, M.D.; Sillers, W.S.; Fredlund, D.G.; Wilson, G.W. Design of a knowledge-based system for unsaturated soil properties. In Proceedings of the Third Canadian Conference on Computing in Civil and Building Engineering, Montreal, QC, Canada, 26–28 August 1996; pp. 659–677. [Google Scholar]
  2. Barbour, S.L. Nineteenth Canadian Geotechnical Colloquium: The soil-water characteristic curve: A historical perspective. Can. Geotech. J. 1998, 35, 873–894. [Google Scholar] [CrossRef]
  3. Ng, C.W.; Pang, Y.W. Influence of stress state on soil-water characteristics and slope stability. J. Geotech. Geoenviron. Eng. 2000, 126, 157–166. [Google Scholar] [CrossRef]
  4. Vanapalli, S.K.; Salinas, L.M.; Avila, D.; Karube, D. Suction and storage characteristics of unsaturated soils. In Unsaturated Soils, Proceedings of the Third International Conference on Unsaturated Soils, Recife, Brazil, 10–13 March 2002; CRC Press: Boca Raton, FL, USA, 2004; Volume 3, p. 3. [Google Scholar]
  5. Fredlund, D.G.; Sheng, D.; Zhao, J. Estimation of soil suction from the soil-water characteristic curve. Can. Geotech. J. 2011, 48, 186–198. [Google Scholar] [CrossRef]
  6. Fredlund, D.G.; Rahardjo, H.; Fredlund, M.D. Unsaturated Soil Mechanics in Engineering Practice; John Wiley & Sons: Hoboken, NJ, USA, 2012. [Google Scholar] [CrossRef]
  7. Nam, S.; Gutierrez, M.; Diplas, P.; Petrie, J.; Wayllace, A.; Lu, N.; Muñoz, J.J. Comparison of testing techniques and models for establishing the swcc of riverbank soils. Eng. Geol. 2010, 110, 1–10. [Google Scholar] [CrossRef]
  8. Fleureau, J.M.; Verbrugge, J.C.; Huergo, P.J.; Correia, A.G.; Kheirbek-Saoud, S. Aspects of the behaviour of compacted clayey soils on drying and wetting paths. Can. Geotech. J. 2002, 39, 1341–1357. [Google Scholar] [CrossRef]
  9. Zhou, J.; Jian-Lin, Y. Influences affecting the soil-water characteristic curve. J. Zhejiang Univ.-Sci. A 2005, 6, 797–804. [Google Scholar] [CrossRef]
  10. Edil, T.B.; Motan, S.E. Soil-water potential and resilient behavior of subgrade soils. Transp. Res. Rec. 1979, 705, 54–63. [Google Scholar]
  11. Vanapalli, S.K.; Fredlund, D.G.; Pufahl, D.E. Influence of soil structure and stress history on the soil-water characteristics of a compacted till. Geotechnique 1999, 49, 143–159. [Google Scholar] [CrossRef] [Green Version]
  12. Marinho, F.A.; Stuermer, M.M. The influence of the compaction energy on the swcc of a residual soil. In Advances in Unsaturated Geotechnics; ASCE: Reston, VA, USA, 2000; pp. 125–141. [Google Scholar]
  13. Pham, H.Q.; Fredlund, D.G. Equations for the entire soil-water characteristic curve of a volume change soil. Can. Geotech. J. 2008, 45, 443–453. [Google Scholar] [CrossRef]
  14. Elkady, T.Y.; Al-Mahbashi, A.; Dafalla, M.; Al-Shamanic, M. Effect of compaction state on the soil-water characteristic curves of sand–natural expansive clay mixtures. Eur. J. Environ. Civ. Eng. 2015, 21, 289–302. [Google Scholar] [CrossRef]
  15. Kim, H.; Ganju, E.; Tang, D.; Prezzi, M.; Salgado, R. Matric suction measurements of compacted subgrade soils. Road Mater. Pavement Des. 2015, 16, 358–378. [Google Scholar] [CrossRef]
  16. Marinho, F.A. Nature of soil-water characteristic curve for plastic soils. J. Geotech. Geoenviron. Eng. 2005, 131, 654–661. [Google Scholar] [CrossRef]
  17. Tinjum, J.M.; Benson, C.H.; Blotz, L.R. Soil-water characteristic curves for compacted clays. J. Geotech. Geoenviron. Eng. 1997, 123, 1060–1069. [Google Scholar] [CrossRef]
  18. Miller, C.J.; Yesiller, N.; Yaldo, K.; Merayyan, S. Impact of soil type and compaction conditions on soil water characteristic. J. Geotech. Geoenviron. Eng. 2002, 128, 733–742. [Google Scholar] [CrossRef]
  19. Zhou, W.G.; Bao, Y.L.; Zhou, H.B. Research on soil-water characteristic curve of unsaturated mixed soil in west Sichuan. Appl. Mech. Mater. 2013, 353, 996–1000. [Google Scholar] [CrossRef]
  20. Pedarla, A.; Puppala, A.J.; Hoyos, L.R. Swelling behavior of expansive clays incorporating mineralogy and pore size distribution via SWCC. In Advances in Unsaturated Soil, 1st ed.; CRC Press: London, UK, 2013; p. 305. [Google Scholar]
  21. Xu, X.; Zhang, F.Y.; Gu, M. Experimental research on soil-water characteristic curve of unsaturated soils. Appl. Mech. Mater. 2013, 353, 554–557. [Google Scholar] [CrossRef]
  22. Pulat, H.F.; Yukselen-Aksoy, Y.; Egeli, I. The effect of soil mineralogy and pore fluid chemistry on the suction and swelling behavior of soils. Bull. Eng. Geol. Environ. 2014, 73, 37–42. [Google Scholar] [CrossRef] [Green Version]
  23. Lu, N.; Likos, W.J. Unsaturated Soil Mechanics; Wiley: Hoboken, NJ, USA, 2004. [Google Scholar]
  24. Sillers, W.S.; Fredlund, D.G.; Zakerzadeh, N. Mathematical attributes of some soil—Water characteristic curve models. In Unsaturated Soil Concepts and Their Application in Geotechnical Practice; Springer Science & Business Media: Dordrecht, The Netherlands, 2001; pp. 243–283. [Google Scholar] [CrossRef]
  25. Li, X.; Zhang, L.M. Characterization of dual-structure pore-size distribution of soil. Can. Geotech. J. 2009, 46, 129–141. [Google Scholar] [CrossRef] [Green Version]
  26. Wan, A.W.L.; Gray, M.N.; Graham, J. On the relations of suction, moisture content, and soil structure in compacted clays. In Unsaturated Soils, Proceedings of the First International Conference on Unsaturated Soils, Paris, France, 6–8 September 1995; Balkema: Rotterdam, The Netherlands; Volume 1, pp. 215–222.
  27. Zaffar, M.; Lu, S.-G. Pore size distribution of clayey soils and its correlation with soil organic matter. Pedosphere 2015, 25, 240–249. [Google Scholar] [CrossRef]
  28. Thom, R.; Sivakumar, R.; Sivakumar, V.; Murray, E.J.; Mackinnon, P. Pore size distribution of unsaturated compacted kaolin: The initial states and final states following saturation. Géotechnique 2007, 57, 469–474. [Google Scholar] [CrossRef]
  29. Thieu, N.T.M.; Fredlund, M.D.; Fredlund, D.G.; Hung, V.Q. Seepage modeling in a saturated/unsaturated soil system. In Proceedings of the International Conference on Management of the Land and Water Resources, Hanoi, Vietnam, 20–22 October 2001; pp. 20–22. [Google Scholar]
  30. Van Genuchten, M.T. A closed-form equation for predicting the hydraulic conductivity of unsaturated soils. Soil Sci. Soc. Am. J. 1980, 44, 892–898. [Google Scholar] [CrossRef] [Green Version]
  31. Fredlund, D.G.; Xing, A. Equations for the soil-water characteristic curve. Can. Geotech. J. 1994, 31, 521–532. [Google Scholar] [CrossRef]
  32. Wösten, J.H.M.; Lilly, A.; Nemes, A.; Le Bas, C. Development and use of a database of hydraulic properties of European soils. Geoderma 1999, 90, 169–185. [Google Scholar] [CrossRef]
  33. ASTM D854; Standard Test Method for Specific Gravity of Soil Solids by Water Pycnometer. ASTM: West Conshohocken, PA, USA, 2006.
  34. ASTM D4318; Standard Test Methods for Liquid Limit, Plastic Limit and Plasticity Index of Soils. ASTM: West Conshohocken, PA, USA, 2000.
  35. ASTM D6913; Standard Test Methods for Particle-Size Distribution (Gradation) of Soils Using Sieve Analysis. ASTM: West Conshohocken, PA, USA, 2009.
  36. ASTM D7928; Standard Test Method for Particle-Size Distribution (Gradation) of Fine-Grained Soils Using the Sedimentation (Hydrometer) Analysis. ASTM: West Conshohocken, PA, USA, 2017.
  37. ASTM D1557; Standard Test Methods for Laboratory Compaction Characteristics of Soil Using Modified Effort. ASTM: West Conshohocken, PA, USA, 2009.
  38. ASTM D2487; Standard Practice for Classification of Soils for Engineering Purposes (Unified Soil Classification System). ASTM: West Conshohocken, PA, USA, 2006.
  39. Skempton, A.W. The colloidal activity of clays. In Selected Papers on Soil Mechanics; Thomas Telford Publishing: London, UK, 1953; pp. 106–118. [Google Scholar]
  40. Kuerbis, R.; Vaid, Y.P. Sand sample preparation-the slurry deposition method. Soils Found. 1988, 28, 107–118. [Google Scholar] [CrossRef] [Green Version]
  41. Carraro, J.A.H.; Prezzi, M. A new slurry-based method of preparation of specimens of sand containing fines. Geotech. Test. J. 2008, 31, 1–11. [Google Scholar] [CrossRef] [Green Version]
  42. Krage, C.P.; Price, A.B.; Lukas, W.G.; DeJong, J.T.; DeGroot, D.J.; Boulanger, R.W. Slurry deposition method of low-plasticity intermediate soils for laboratory element testing. Geotech. Test. J. 2019, 43, 1269–1285. [Google Scholar] [CrossRef]
  43. Liu, W.; Tang, X.; Yang, Q. A slurry consolidation method for reconstitution of triaxial specimens. KSCE J. Civ. Eng. 2017, 21, 150–159. [Google Scholar] [CrossRef]
  44. ASTM D5298; Standard Test Method for Measurement of Soil Potential (Suction) Using Filter Paper. ASTM: West Conshohocken, PA, USA, 2010.
  45. Marinho, F.A.M.; Chandler, R.J. Aspects of the behavior of clays on drying. In Unsaturated Soils; ASCE: Reston, VA, USA, 1993; pp. 77–90. [Google Scholar]
  46. Meerdink, J.S.; Benson, C.H.; Khire, M.V. Unsaturated hydraulic conductivity of two compacted barrier soils. J. Geotech. Eng. 1996, 122, 565–576. [Google Scholar] [CrossRef]
  47. Weast, R.C.; Astle, M.J.; Beyer, W.H. CRC Handbook of Chemistry and Physics, 65th ed.; CRC Press: Boca Raton, FL, USA, 1981. [Google Scholar]
  48. Halsey, G. Physical adsorption on non-uniform surfaces. J. Chem. Phys. 1948, 16, 931–937. [Google Scholar] [CrossRef]
  49. Livingston, K. The cross-sectional areas of molecules adsorbed on solid surfaces. J. Colloid Sci. 1949, 4, 447–458. [Google Scholar] [CrossRef]
  50. Burton, G.J.; Sheng, D.; Campbell, C. Bimodal pore size distribution of a high-plasticity compacted clay. Géotechnique Lett. 2014, 4, 88–93. [Google Scholar] [CrossRef]
Figure 1. (a) Grain-size distribution and (b) textural triangle diagram of samples used in the study.
Water 14 03445 g001
Figure 2. Scanning electron microscope analysis of No. 1.
Water 14 03445 g002
Figure 3. Display of soils’ activities on Skempton chart.
Water 14 03445 g003
Figure 4. Preparation of reconstituted samples by consolidation from slurries.
Water 14 03445 g004
Figure 5. Saturation of (a) ceramic disc and (b) compacted samples in 15-bar pressure plate cell.
Water 14 03445 g005
Figure 6. Insertion of filter paper and protection of samples from evaporation.
Water 14 03445 g006
Figure 7. Initial suction of samples compacted at (a) OWC and (b) wet side of OWC and drying SWCC patterns after saturation.
Water 14 03445 g007
Figure 8. SWCCs of different soils with different sample preparation methods: (a) compacted at OWC, (b) compacted at the wet side of OWC, (c) consolidated from slurry.
Water 14 03445 g008
Figure 9. Relationship between SWCC water contents and soil properties: (a) void ratio, (b) clay (%), (c) liquid limit (%), (d) plasticity (%).
Water 14 03445 g009
Figure 10. Relationship between VG fitting parameters and mineralogical properties: (a) plasticity (%) and (b) activity.
Water 14 03445 g010
Figure 11. Effects of initial conditions on PSDs: (a) No. 1, (b) No. 2, (c) No. 3, and (d) No. 4.
Water 14 03445 g011
Figure 12. Measurement of pore diameters with a scanning electron microscope of No. 3.
Water 14 03445 g012
Figure 13. Cumulative pore volume-pore radius relationship of clayey samples: (a) No. 1, (b) No. 2, (c) No. 3, and (d) No. 4.
Water 14 03445 g013
Figure 14. PSDs of clayey samples: (a) compacted at OWC, (b) compacted at wet of OWC, and (c) consolidated from slurry.
Water 14 03445 g014
Figure 15. (a) Differential and (b) cumulative PSDs of silty samples (taken from Adapazarı).
Water 14 03445 g015
Figure 16. Cumulative pore volume-void ratio relationship for all samples.
Water 14 03445 g016
Figure 17. Clay content-small pore peak relationship of slurry samples.
Water 14 03445 g017
Figure 18. Relationship with (a) SWCC and (b) PSD of No. 1.
Water 14 03445 g018
Table 1. Physical properties of soils.
SoilLiquid Limit (LL)%Plastic Limit (PL)%Plasticity Index (PI)%Specific Gravity (Gs)%Clay%Silt%SandUSCS
Class
Optimum Water Content (wopt)%Max.Unit Weight (γk, max) kN/m3Activity (Ac)
No. 14816322.7843507CL11.519.30.74
No. 24016242.79295912CL11.020.70.83
No. 36025352.7519783CH15.018.21.84
No. 44414302.76324919CL15.018.20.94
No. 54024162.6622771CL 0.73
No. 63621152.7618784CL 0.83
No. 733NPNP2.67146818ML 0
No. 834NPNP2.78106723ML 0
Table 2. Mineralogical composition of soils.
Soil Mineral Composition
No. 1CalciteQuartzKaolinite
No. 2CalciteQuartzKaolinite
No. 3QuartzGlauconiteLizardite
No. 4QuartzGlauconiteLizardite
No. 5QuartzKaoliniteHematite
No. 6QuartzKaoliniteHematite
No. 7QuartzFeldsparKaolinite
No. 8QuartzFeldsparKaolinite
Table 3. Matric suction values at compacting water content for compacted samples.
SoilCompaction ConditionWater Content (%)Soil Suction (kPa)
No. 1OWC10.903080.10
Wet side of OWC16.20750.20
No. 2OWC11.101945.90
Wet side of OWC15.80575.80
No. 3OWC14.708651.30
Wet side of OWC20.701095.80
No. 4OWC15.204944.90
Wet side of OWC20.20510.40
Table 4. SWCC properties of soils (wae = air entry water content, AEV = air entry value, wr = residual water content, α and n = VG fitting parameters).
SoilPreparation Methodwae (%)AEV (kPa)wr (%)αn
No. 1Compacted at OWC17.2810.060.00160.7362
Compacted at wet of OWC19.81130.010.00040.5310
Consolidated from slurry31.92400.150.00080.7835
No. 2Compacted at OWC13.62420.130.00030.7344
Compacted at wet of OWC18.03920.010.00010.6914
Consolidated from slurry30.5330.150.00190.5188
No. 3Compacted at OWC19.6730.120.00521.0084
Compacted at wet of OWC22.21690.040.00020.6836
Consolidated from slurry43.6690.090.00280.7788
No. 4Compacted at OWC17.5620.030.00250.6494
Compacted at wet of OWC20.61070.010.00070.5575
Consolidated from slurry32.0750.100.00260.7336
No. 5Consolidated from slurry32.01140.070.00100.8046
No. 6Consolidated from slurry27.1980.050.00030.6835
No. 7Consolidated from slurry24.9700.010.00481.1498
No. 8Consolidated from slurry22.6490.030.00671.2594
Table 5. Correlations of SWCC parameters with soil properties.
RelationshipEquationR2Notes
Air entry water content (wae)-void ratio (e) 5.8023e2 + 25.704e + 4.7207 0.99
Residual water content(wr)-void ratio (e) 1.3633e2 − 1.6643e + 0.5277 0.77Except for No. 3
Air entry water content (wae)-liquid limit (LL) −0.0007LL2 + 0.7473LL + 0.6405 0.91
Residual water content (wr)-liquid limit (LL) −0.0005LL2 + 0.453LL − 0.9863 0.77Except for No. 3
Air entry water content (wae)-plasticity (PI) 0.0082PI2 + 0.1139PI + 24.153 0.73
Residual water content (wr)-plasticity (PI) −0.00007PI2 + 0.0053PI + 0.154 0.70
Air entry water content (wae)-clay (C%) −0.0159C2 + 1.1229C + 12.811 0.93Except for No. 3
Residual water content (wr)-clay (C%) −0.00008C2 + 0.0085C − 0.0646 0.79
VG α parameter-plasticity (PI) 0.00001PI2 − 0.0005PI + 0.0056 0.81
VG α parameter-activity (Ac) 0.0038Ac2 − 0.0084Ac + 0.0057 0.81
VG n parameter-plasticity (PI) 0.0011PI2 − 0.0492PI + 1.2099 0.91
VG n parameter-activity (Ac) 0.3773Ac2 − 0.9277Ac + 1.207 0.88
Table 6. Properties of PSD curves.
SoilClay (%)Preparation MethodVoid Ratio (e)Major Pore Radius (µm)Cumulative Pore Volume per Unit Mass (cm3/gr)Small Pores (%)Large Pores (%)
1st Peak2nd Peak
No. 1 Compacted at OWC0.480.0050.100.15514.885.2
43Compacted at wet of OWC0.560.0080.120.19436.064.0
Consolidated from slurry0.890.0050.200.23751.948.1
No. 2 Compacted at OWC0.400.0150.100.11650.849.2
29Compacted at wet of OWC0.510.0110.250.17863.536.5
Consolidated from slurry0.870.0080.400.22540.959.1
No. 3 Compacted at wet of OWC0.550.0030.110.13940.359.7
19Compacted at wet of OWC0.620.0120.380.21651.448.6
Consolidated from slurry1.190.0080.450.35242.657.4
No. 4 Compacted at wet of OWC0.510.0050.070.13557.043.0
32Compacted at wet of OWC0.590.0040.090.16663.236.8
Consolidated from slurry0.920.0050.220.23642.457.6
No. 522Consolidated from slurry0.850.0120.210.26127.972.1
No. 618Consolidated from slurry0.750.0120.220.23917.282.8
No. 714Consolidated from slurry0.660.0180.200.22328.371.7
No. 810Consolidated from slurry0.630.0301.500.20044.255.8
Publisher’s Note: MDPI stays neutral with regard to jurisdictional claims in published maps and institutional affiliations.