
A Bibliometric Analysis of Drought Indices, Risk, and Forecast as Components of Drought Early Warning Systems


Abstract
:1. Introduction
2. Materials and Methods
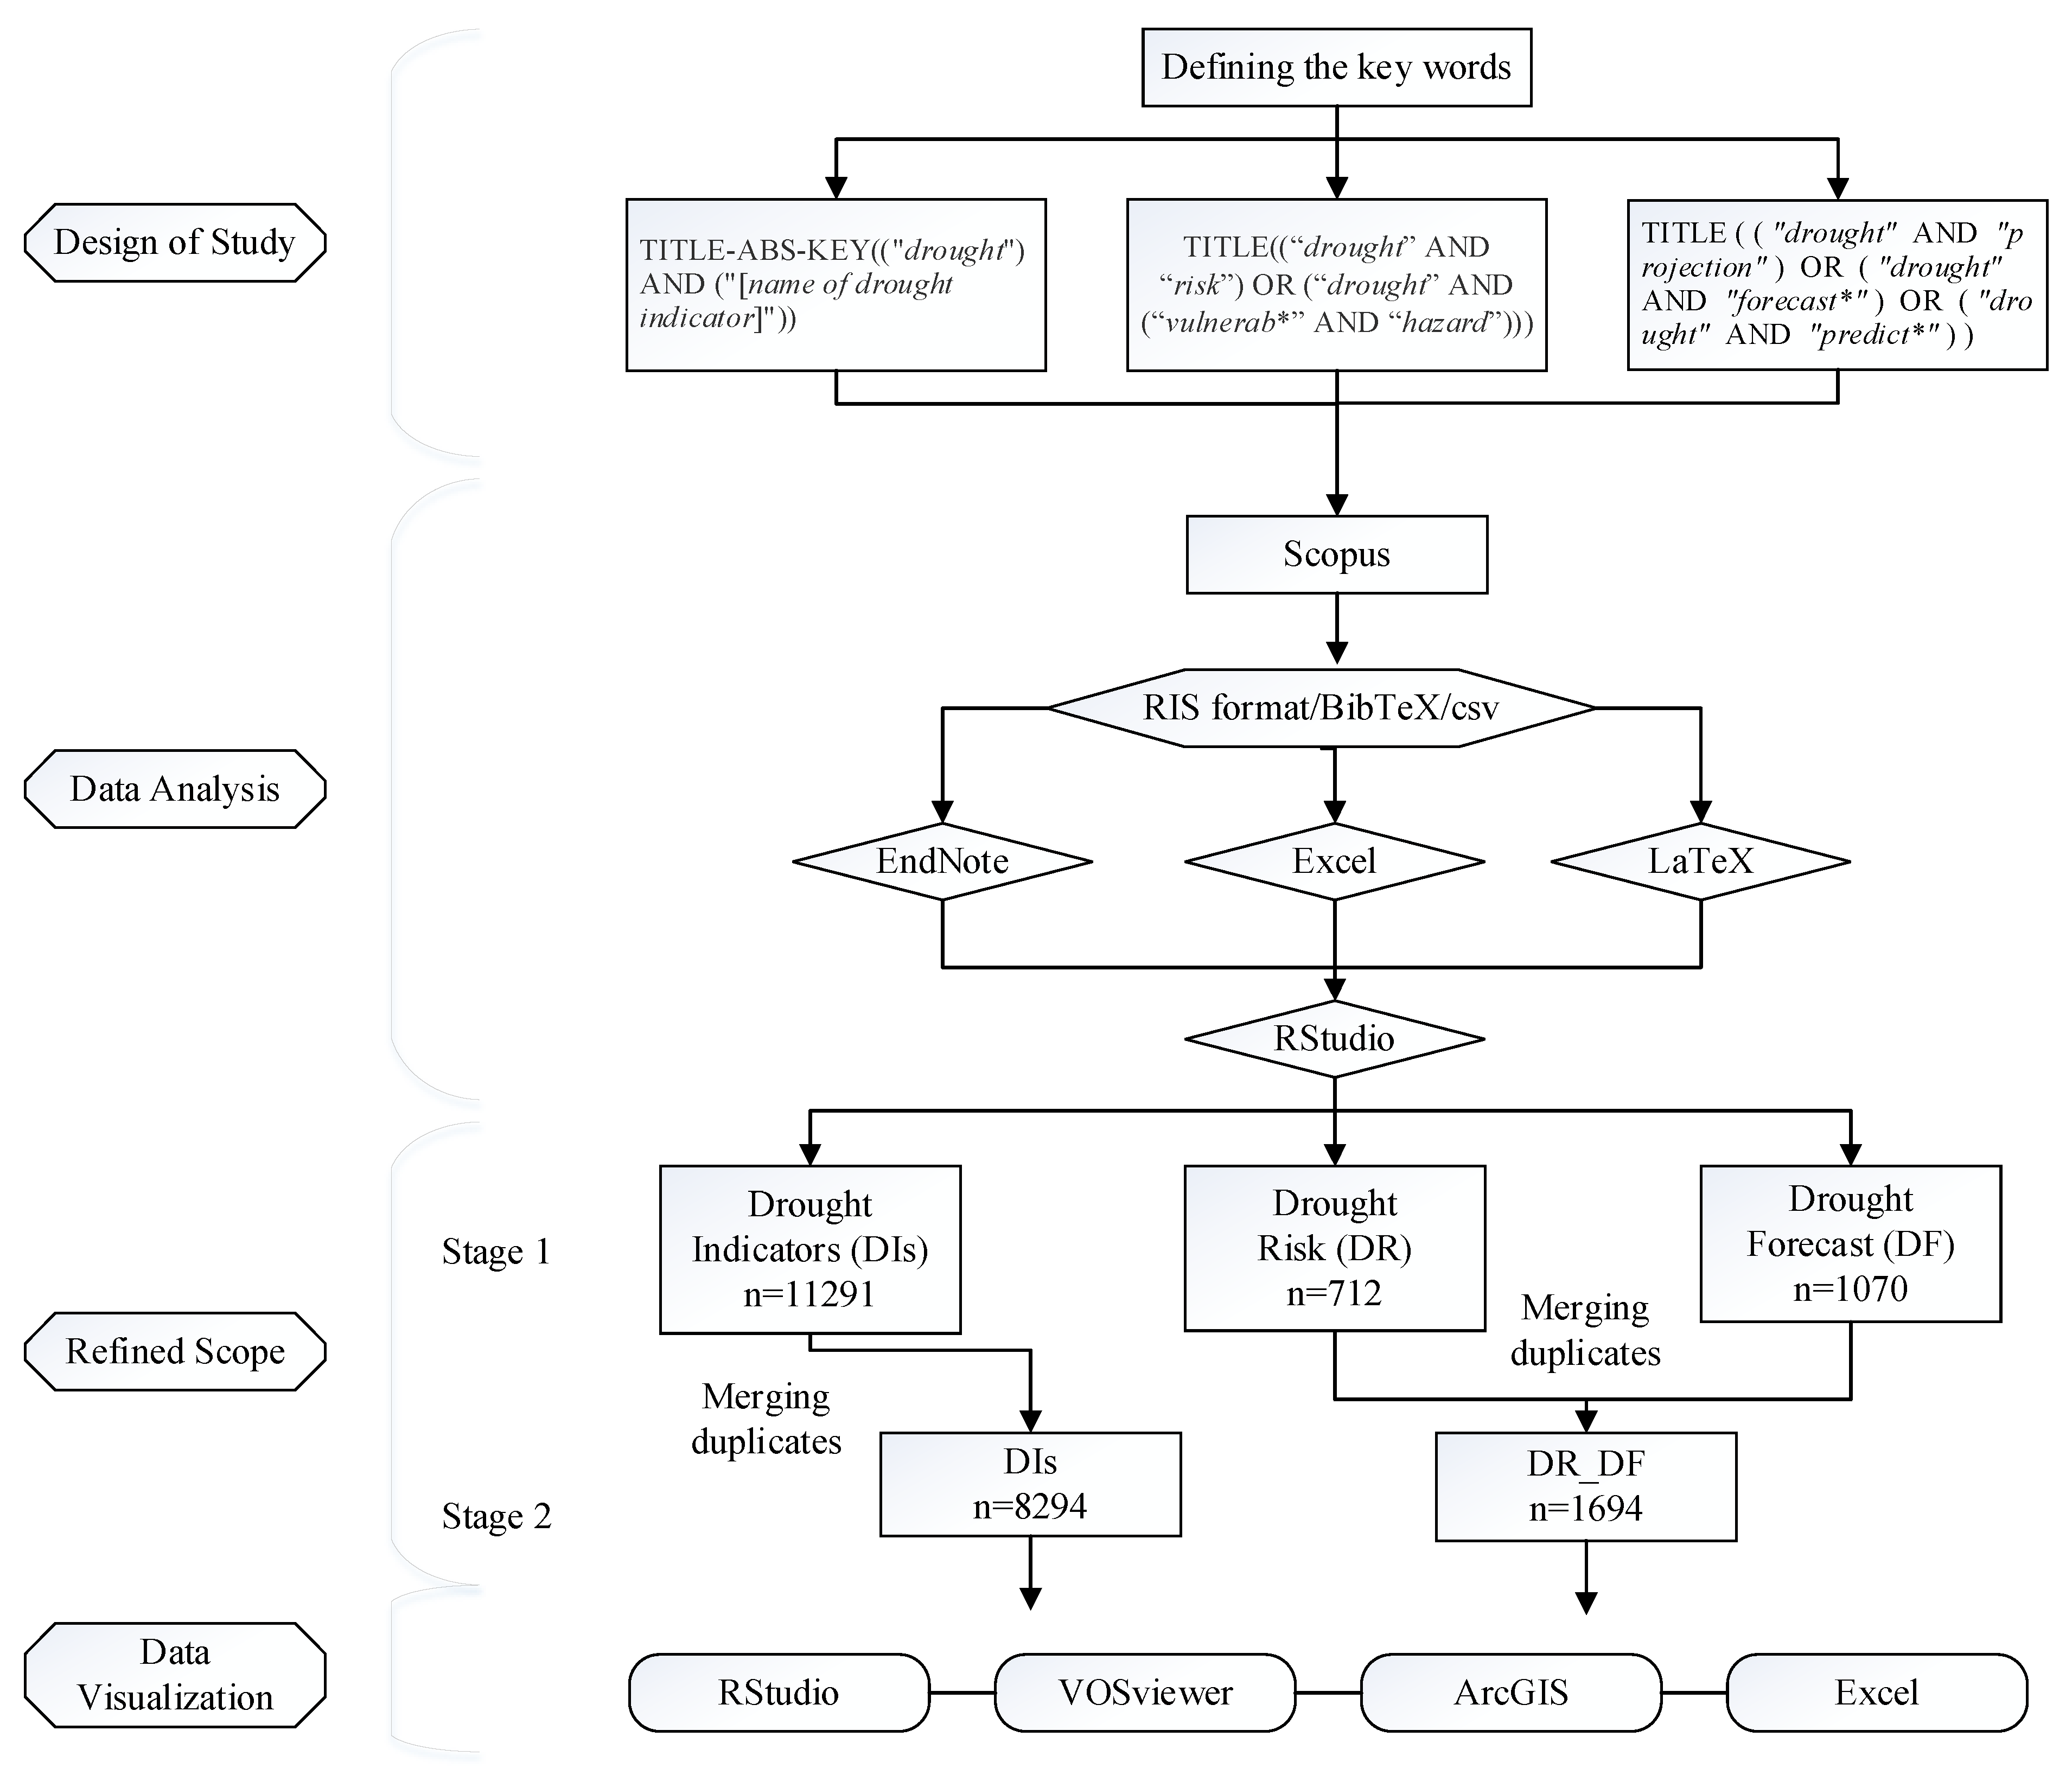
2.1. Design of Study
2.1.1. Drought Monitoring
2.1.2. Drought Risk
2.1.3. Drought Forecasting
2.2. Data Analysis
2.3. Refined Scope
2.4. Data Visualization
3. Results and Discussion
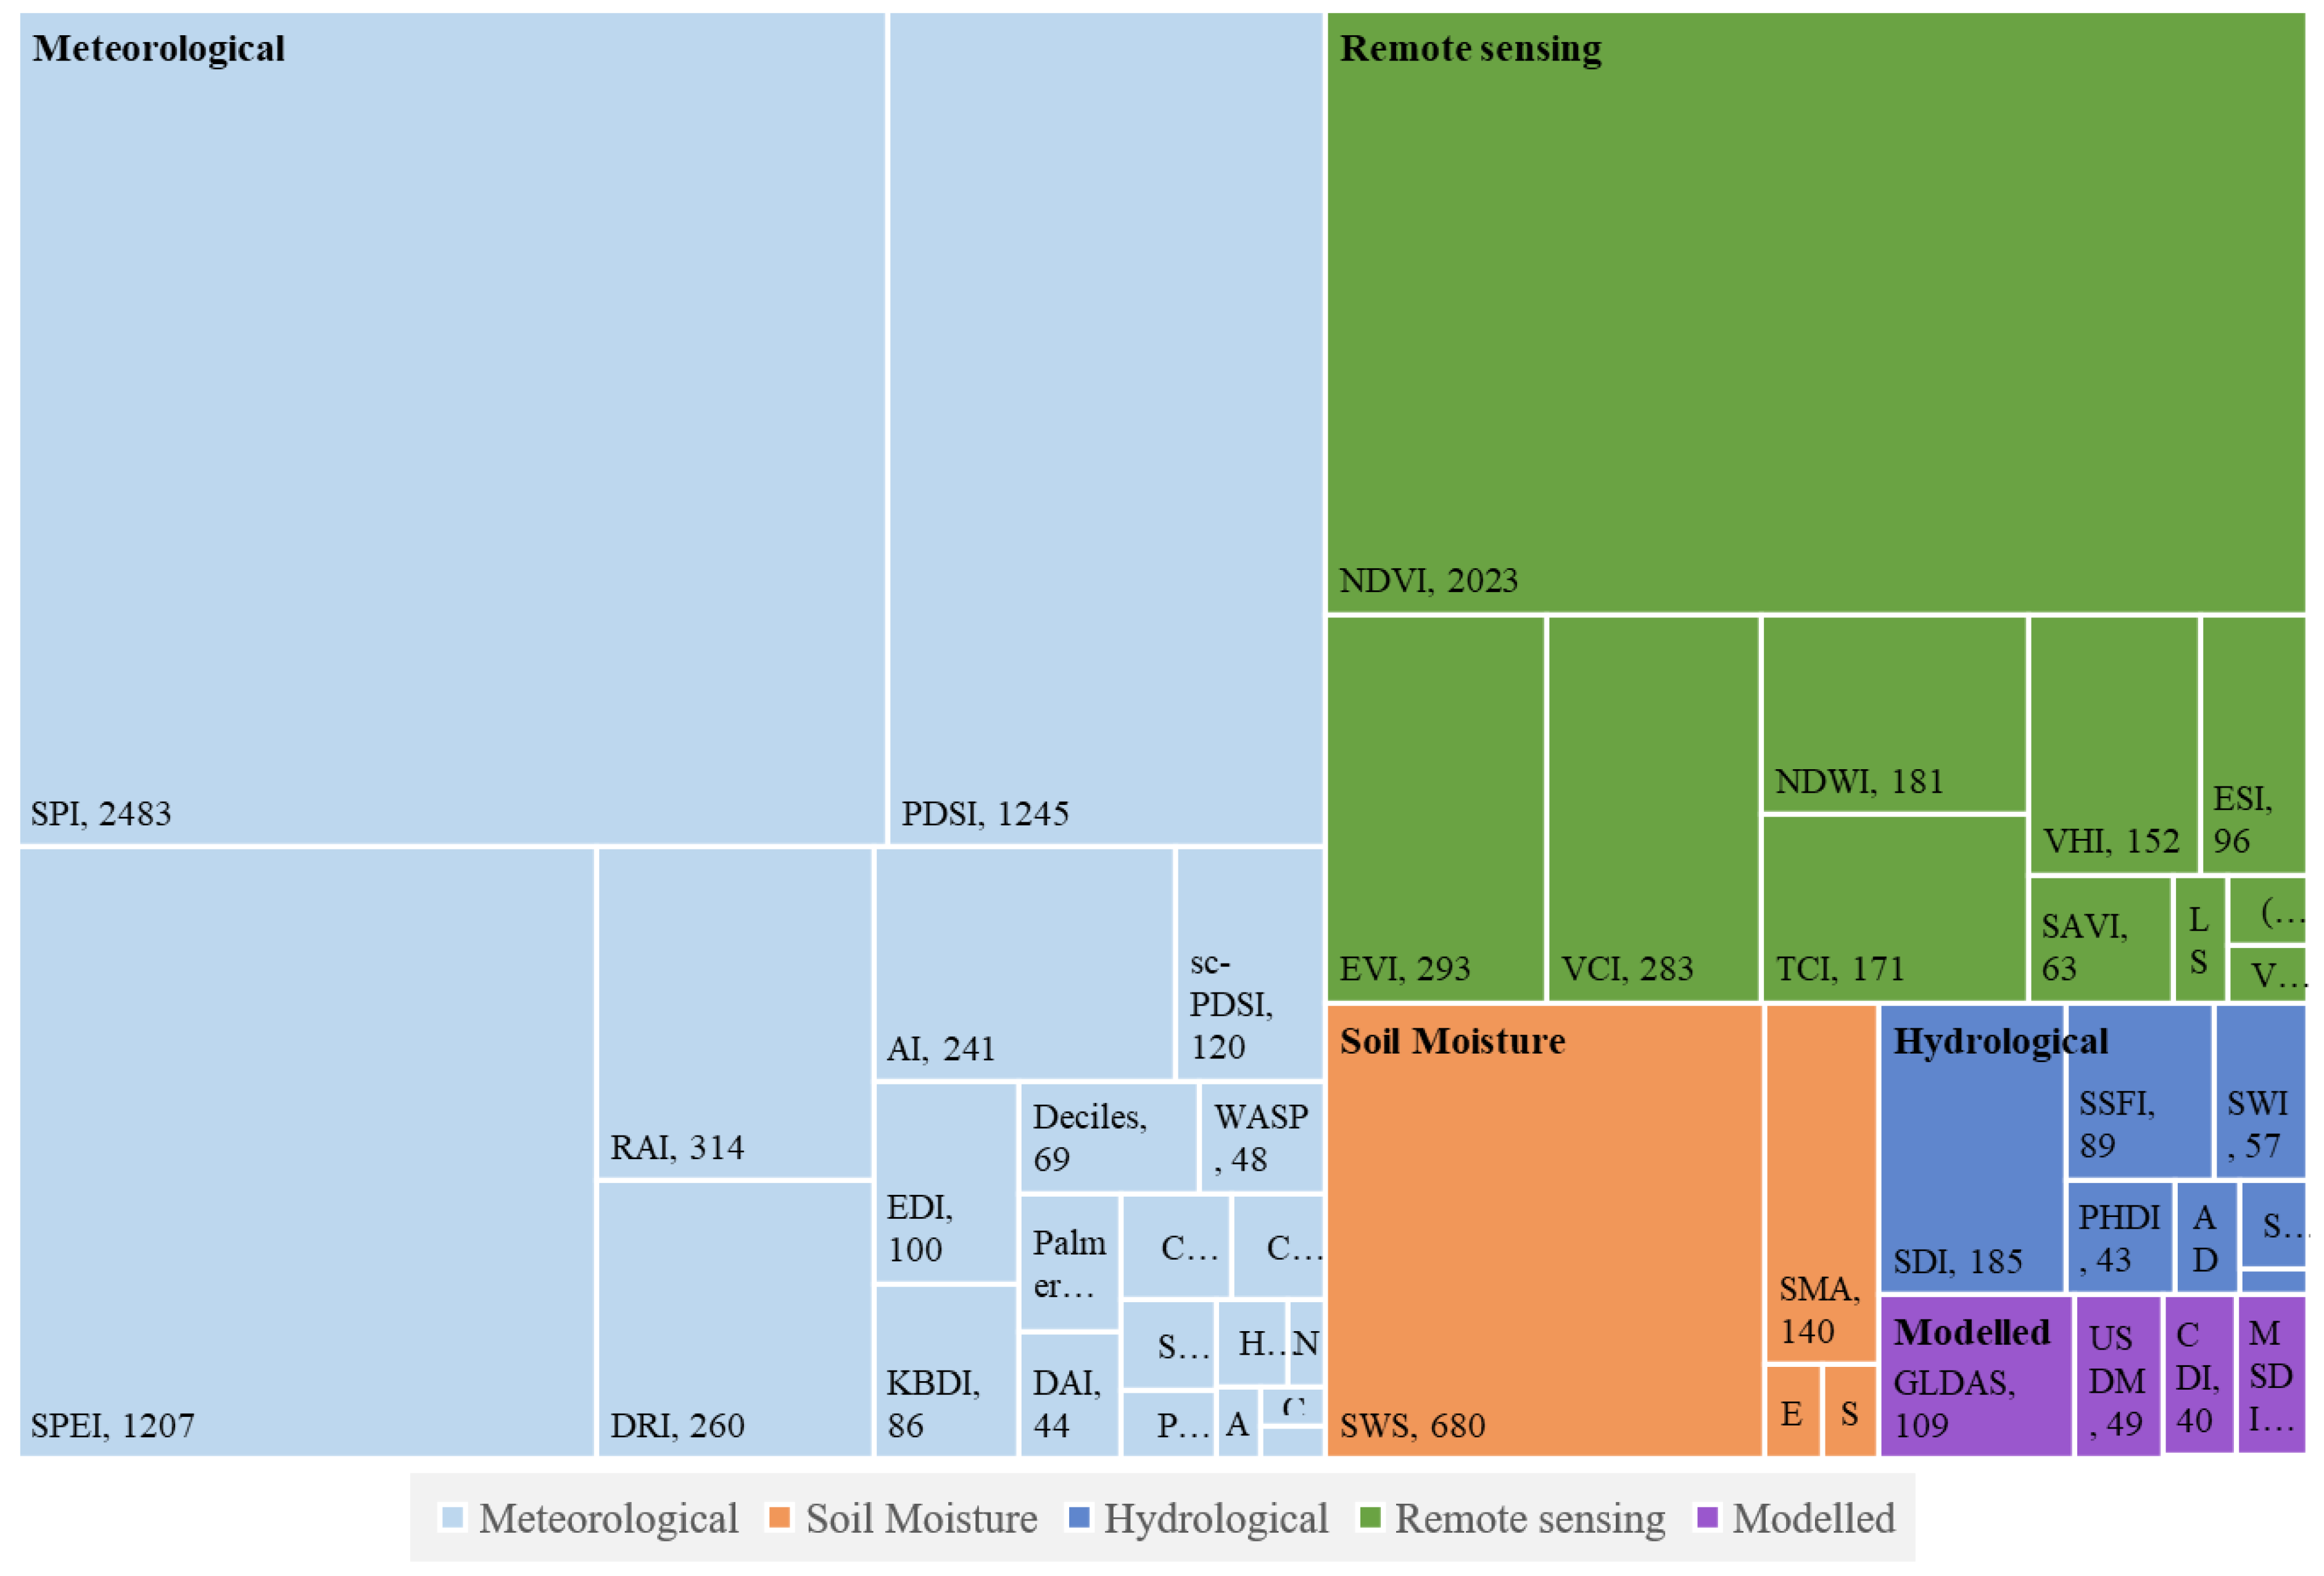
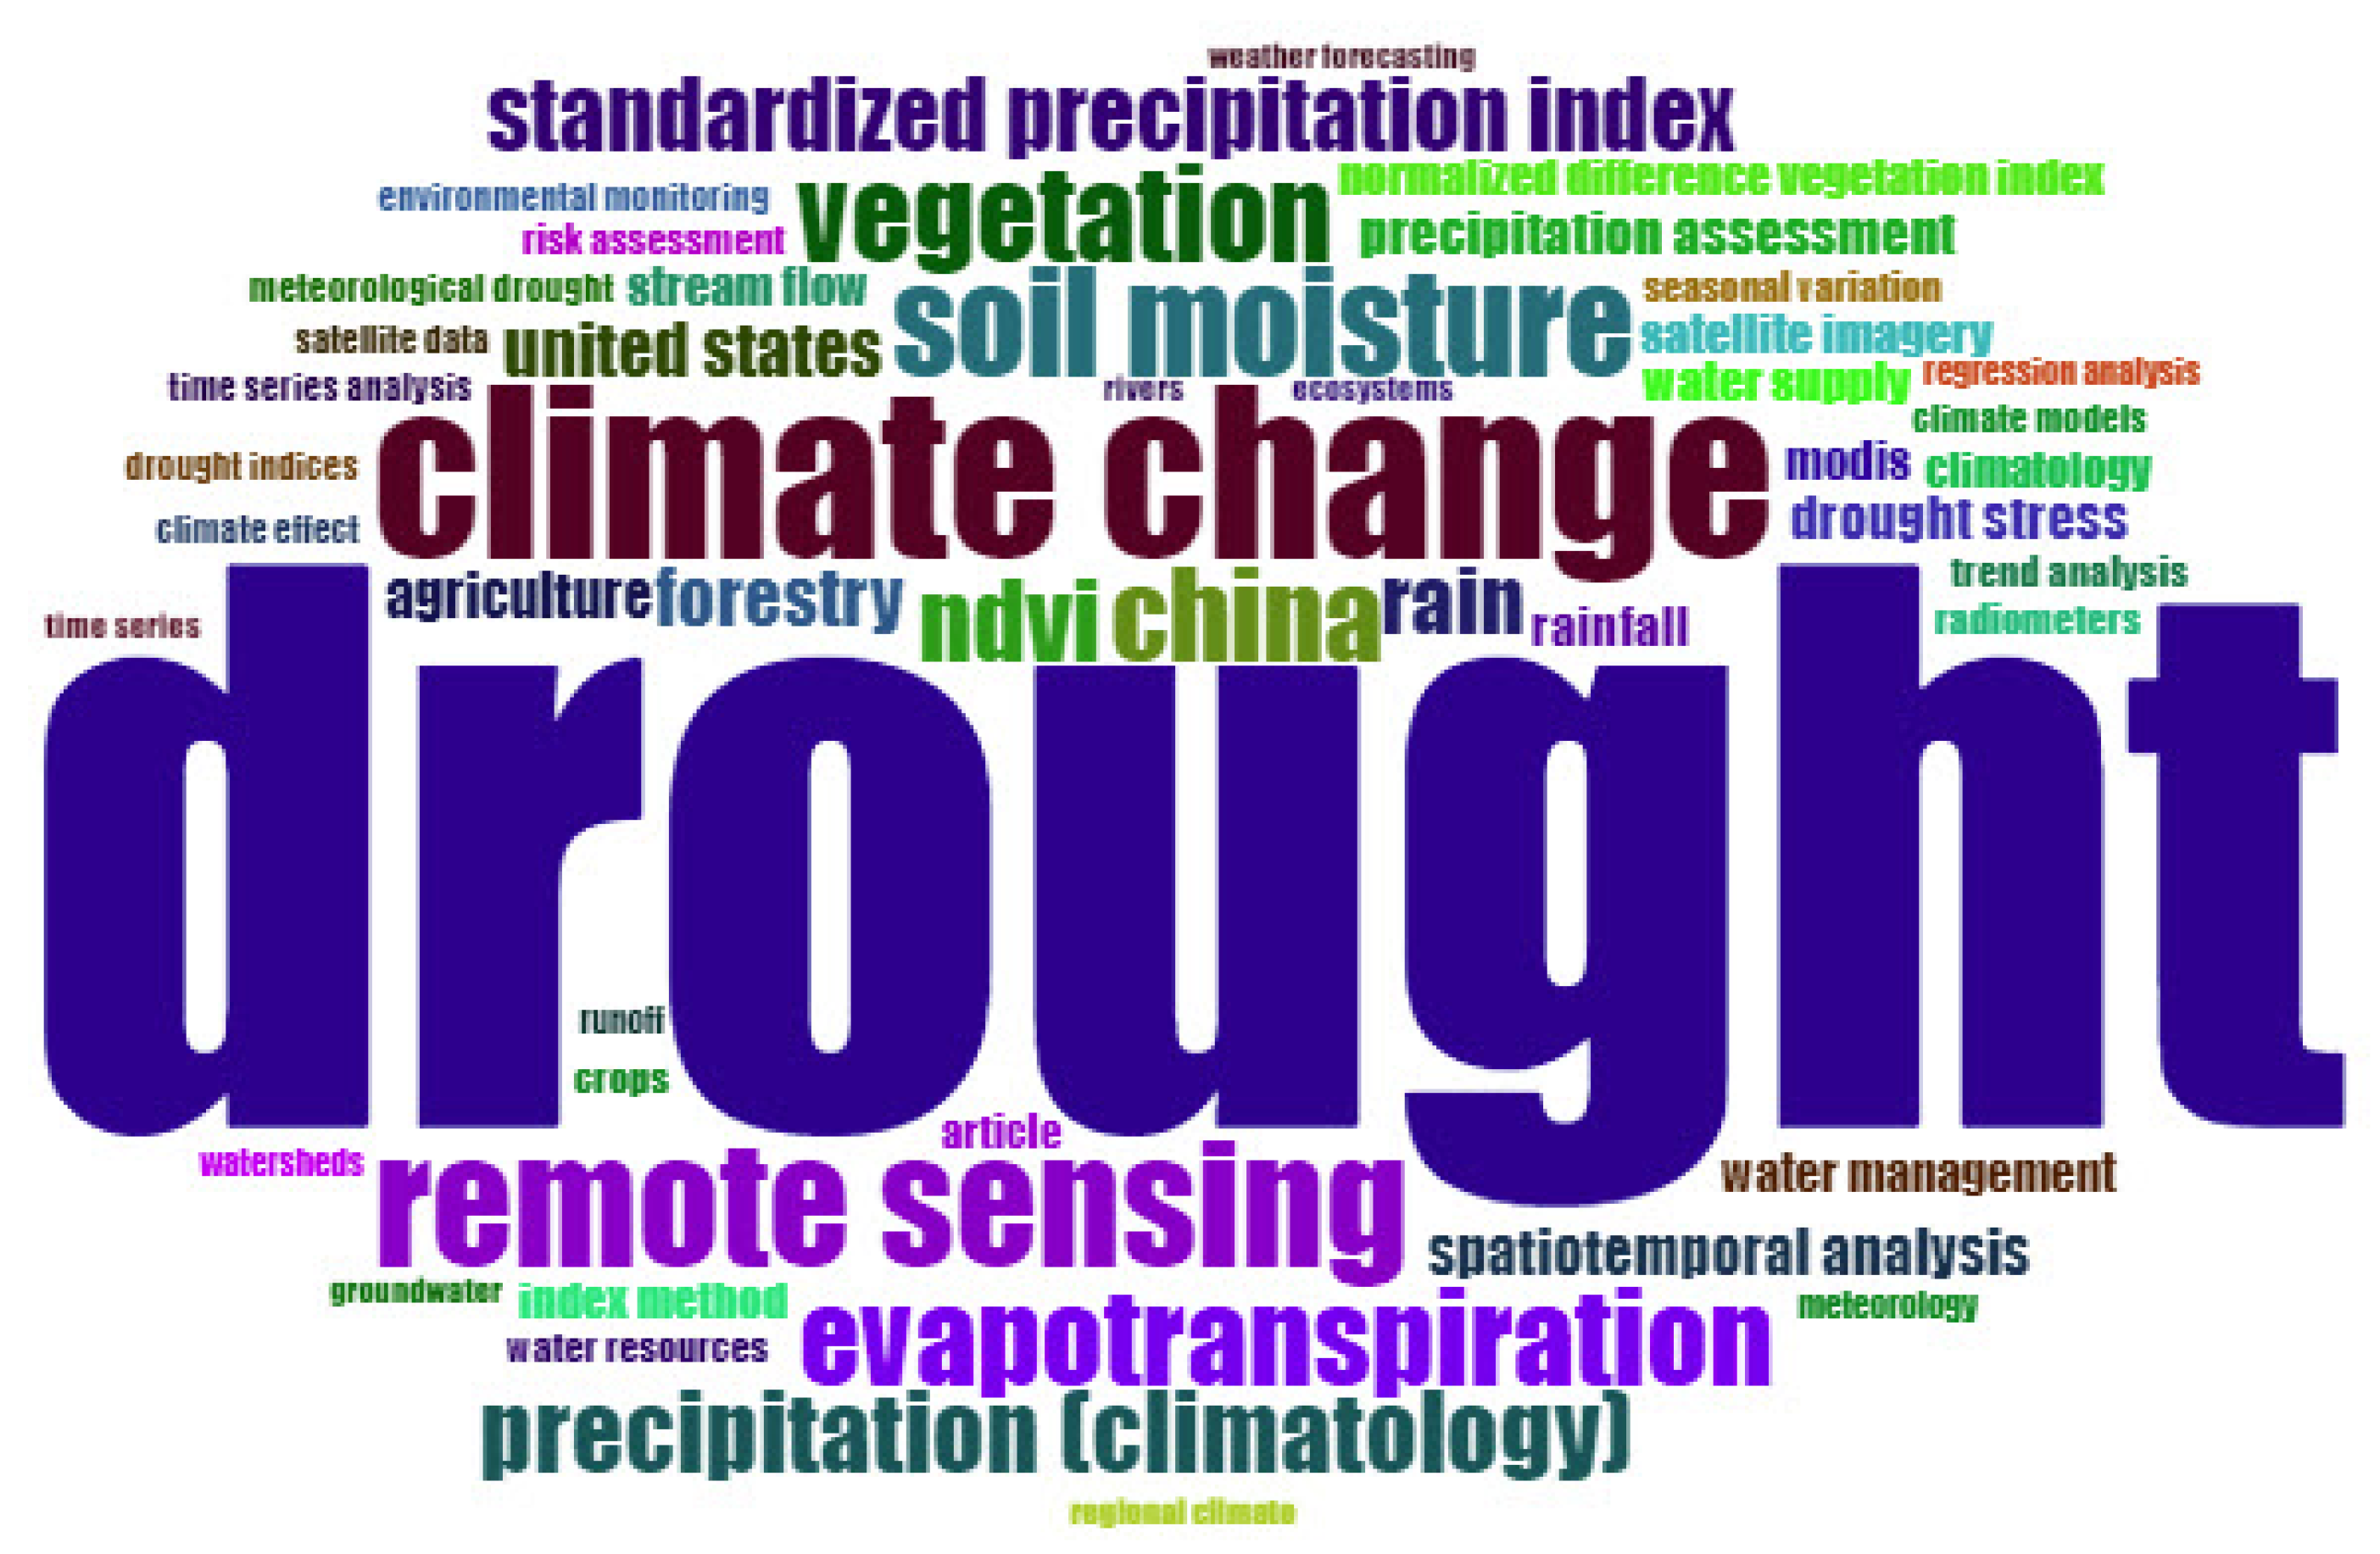
3.1. Drought Indices
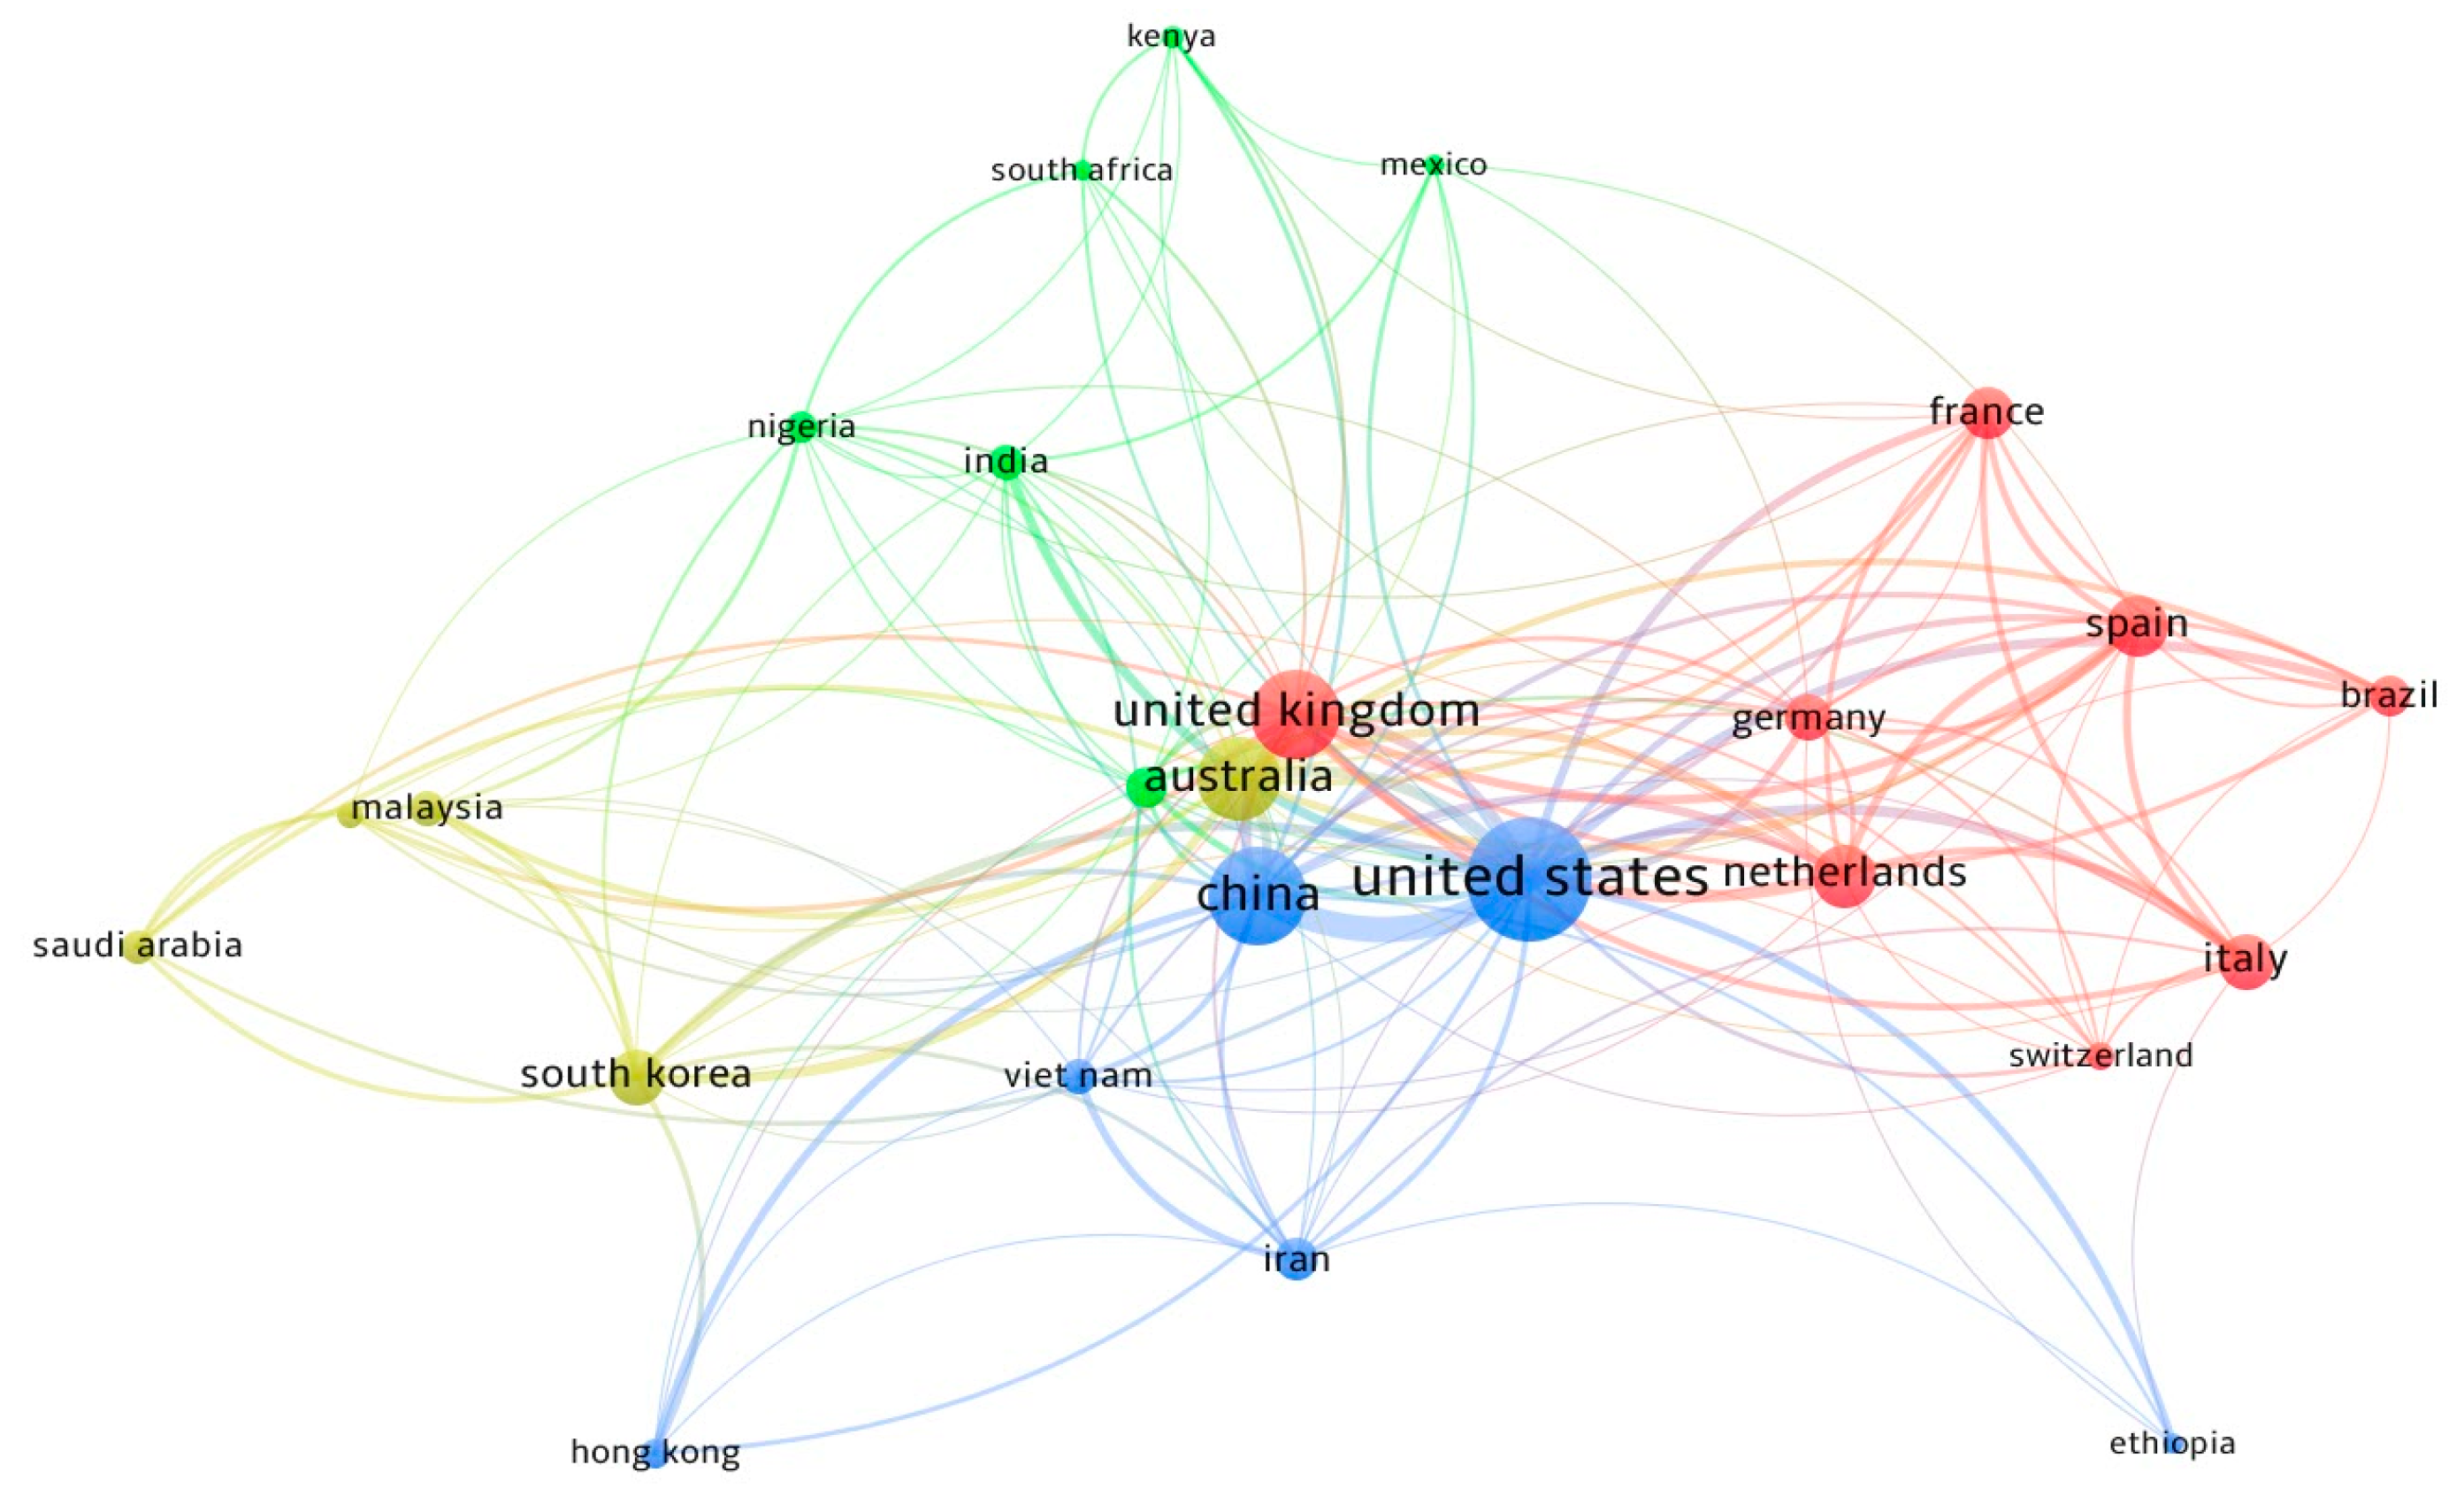
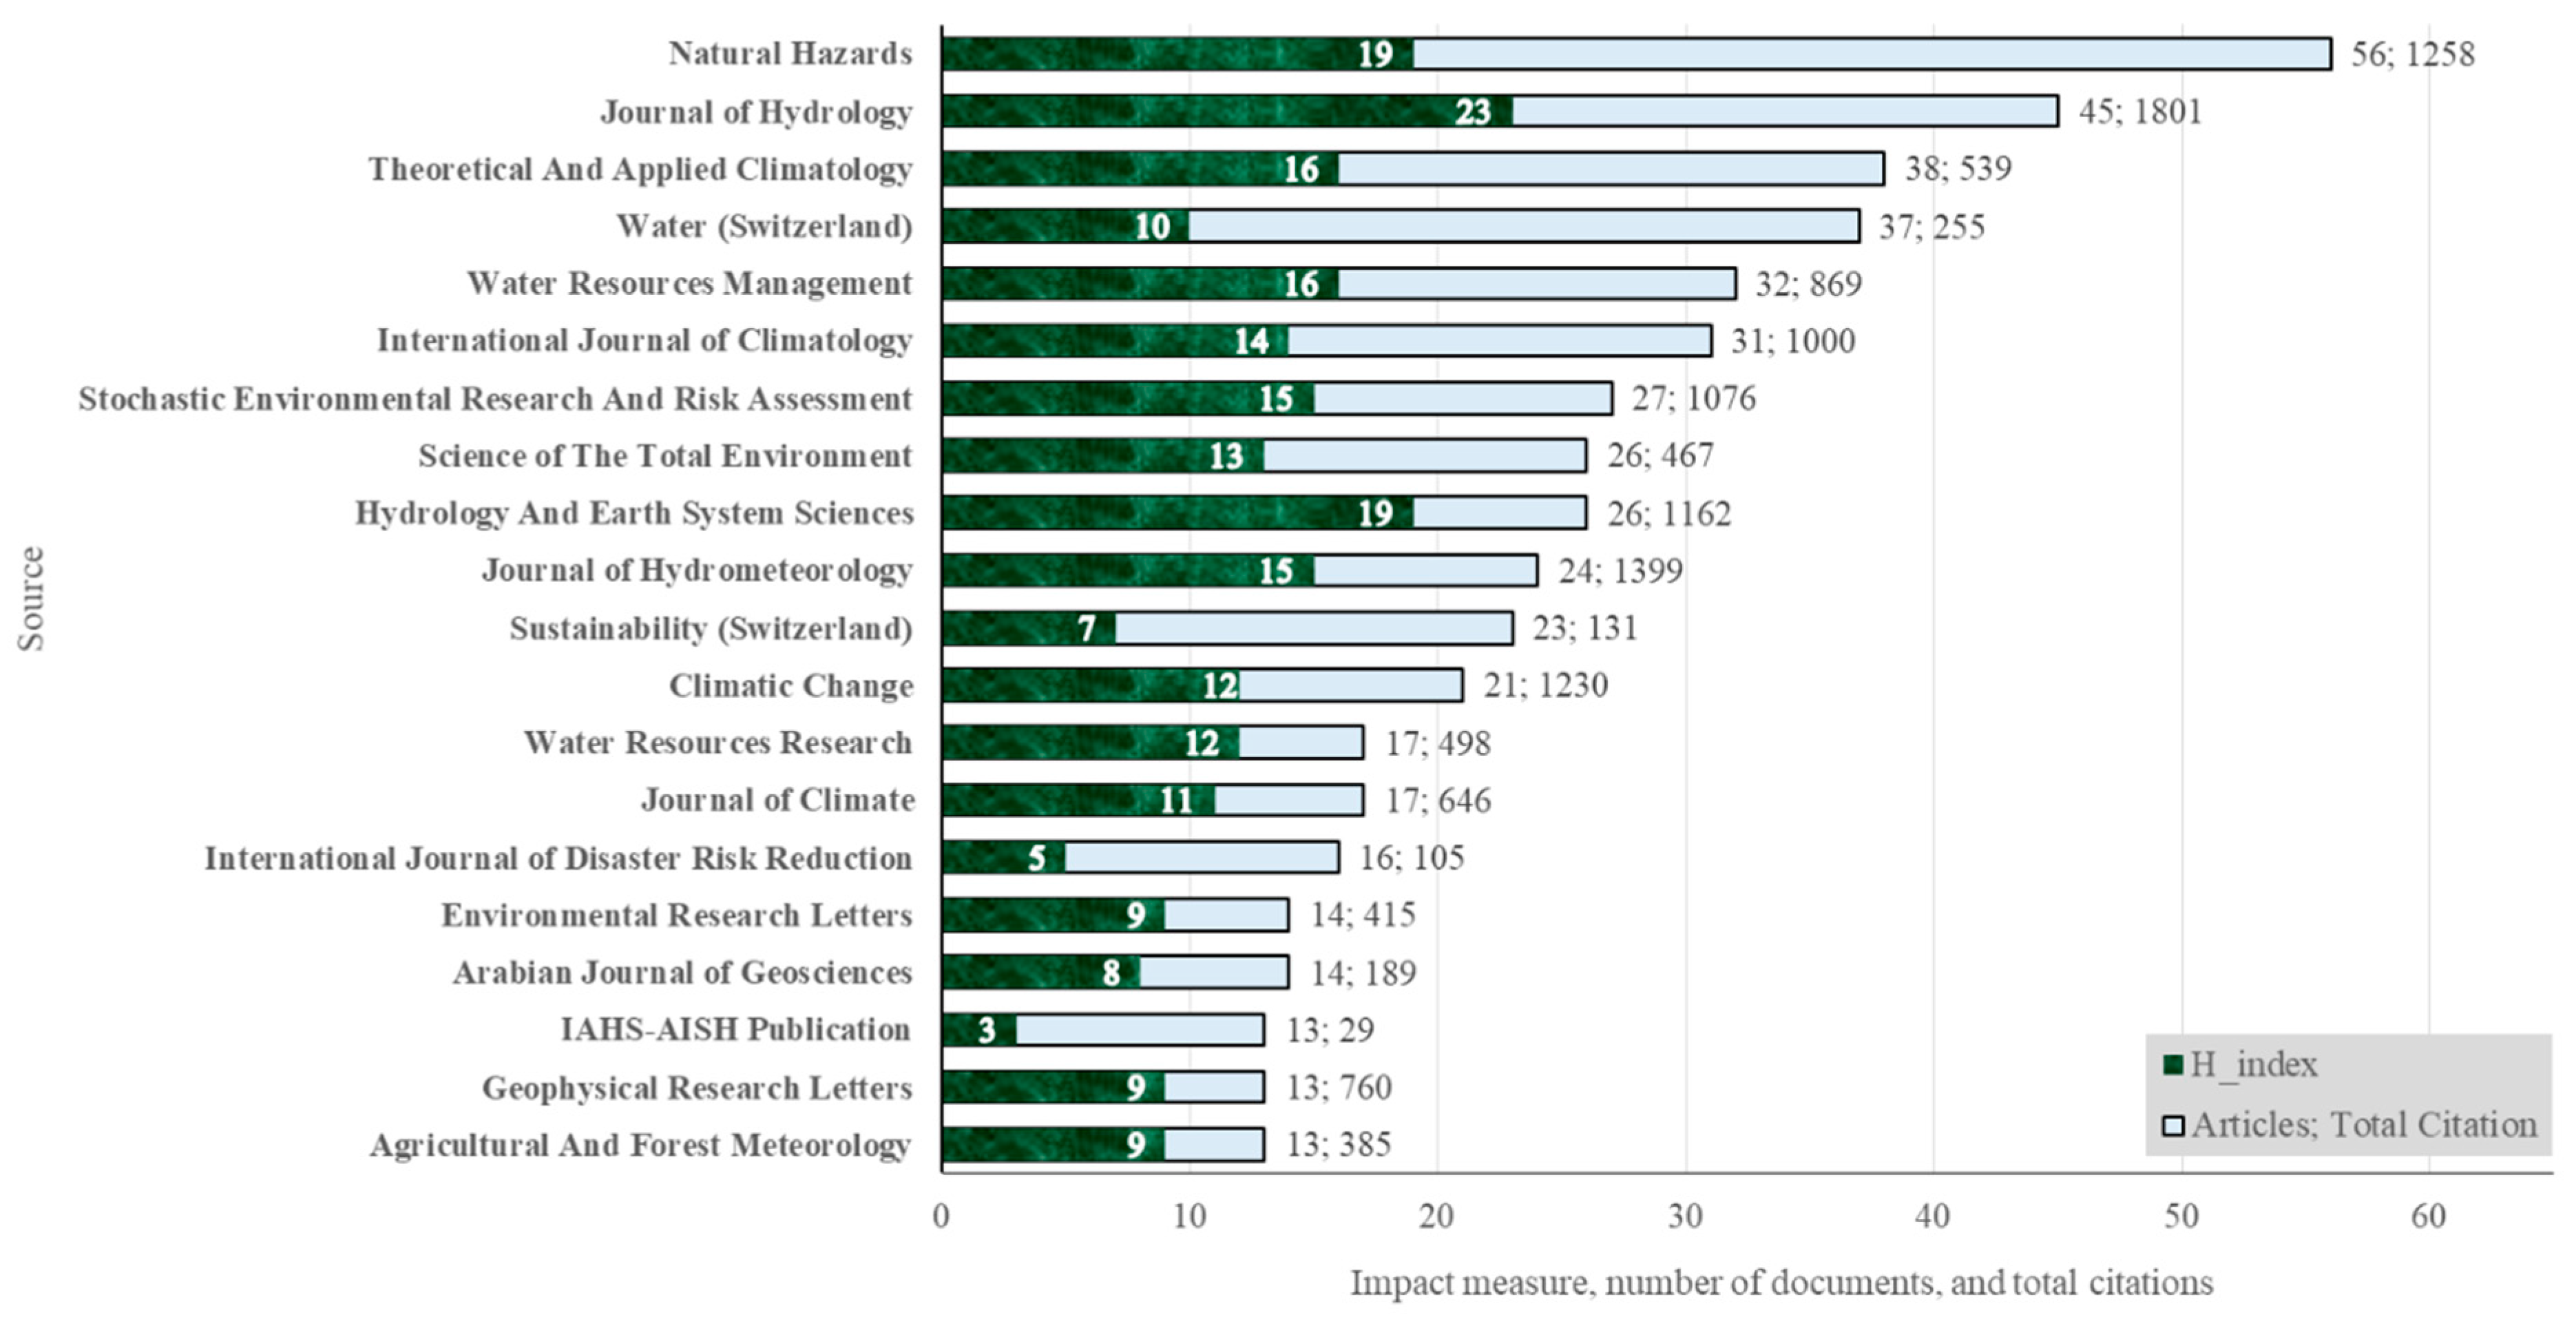
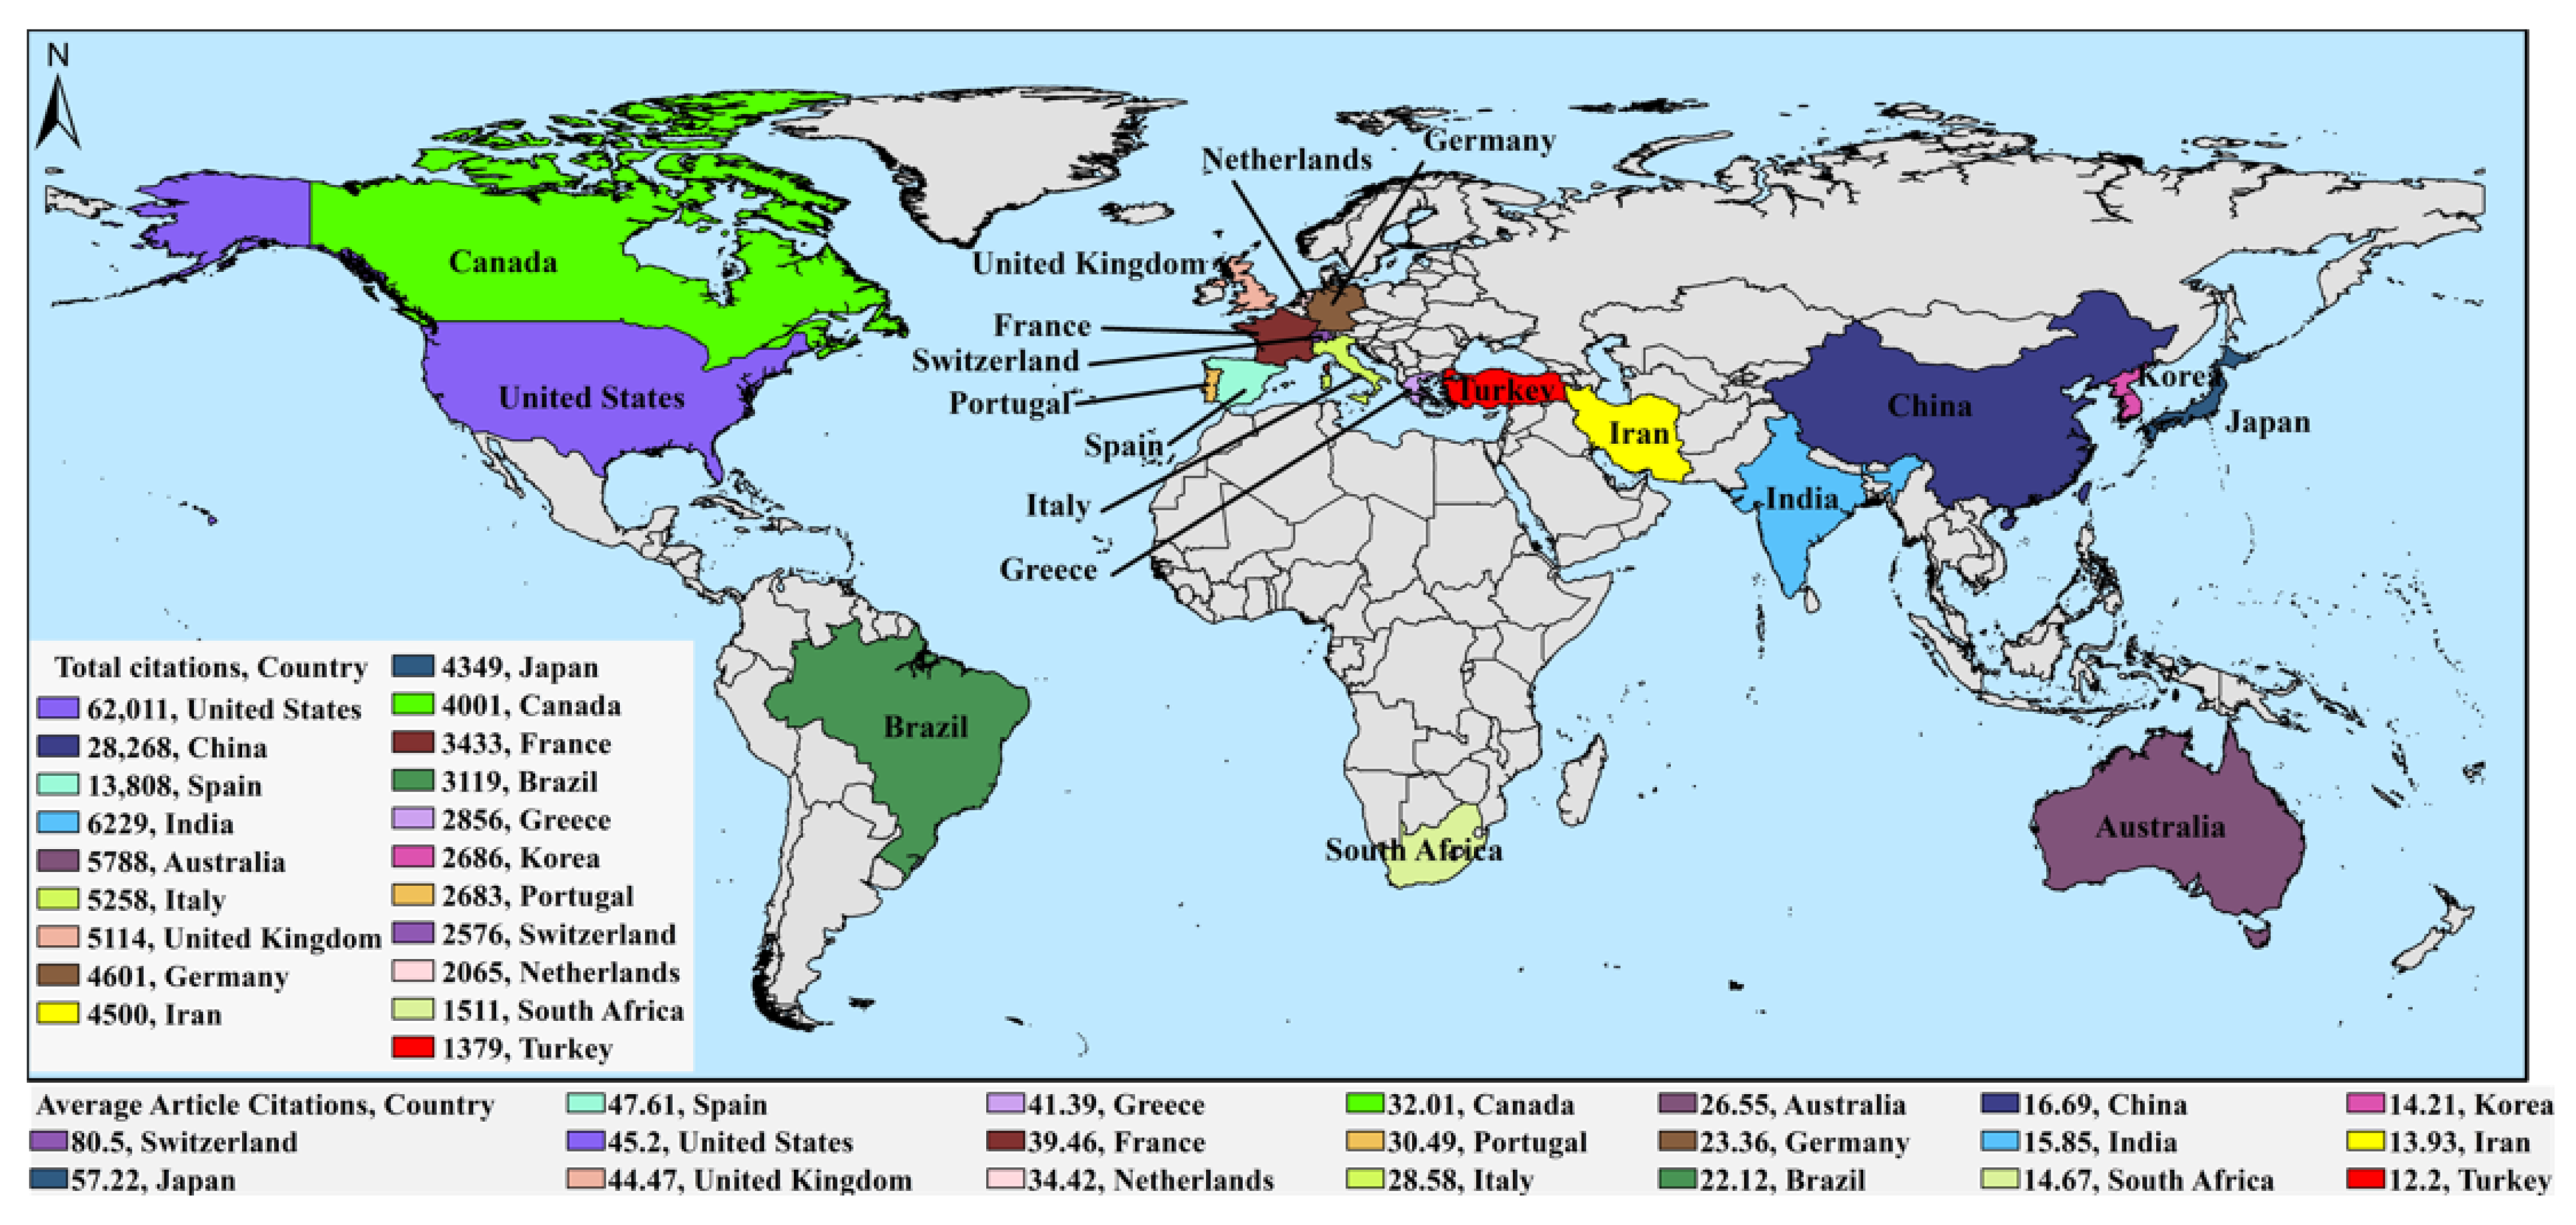
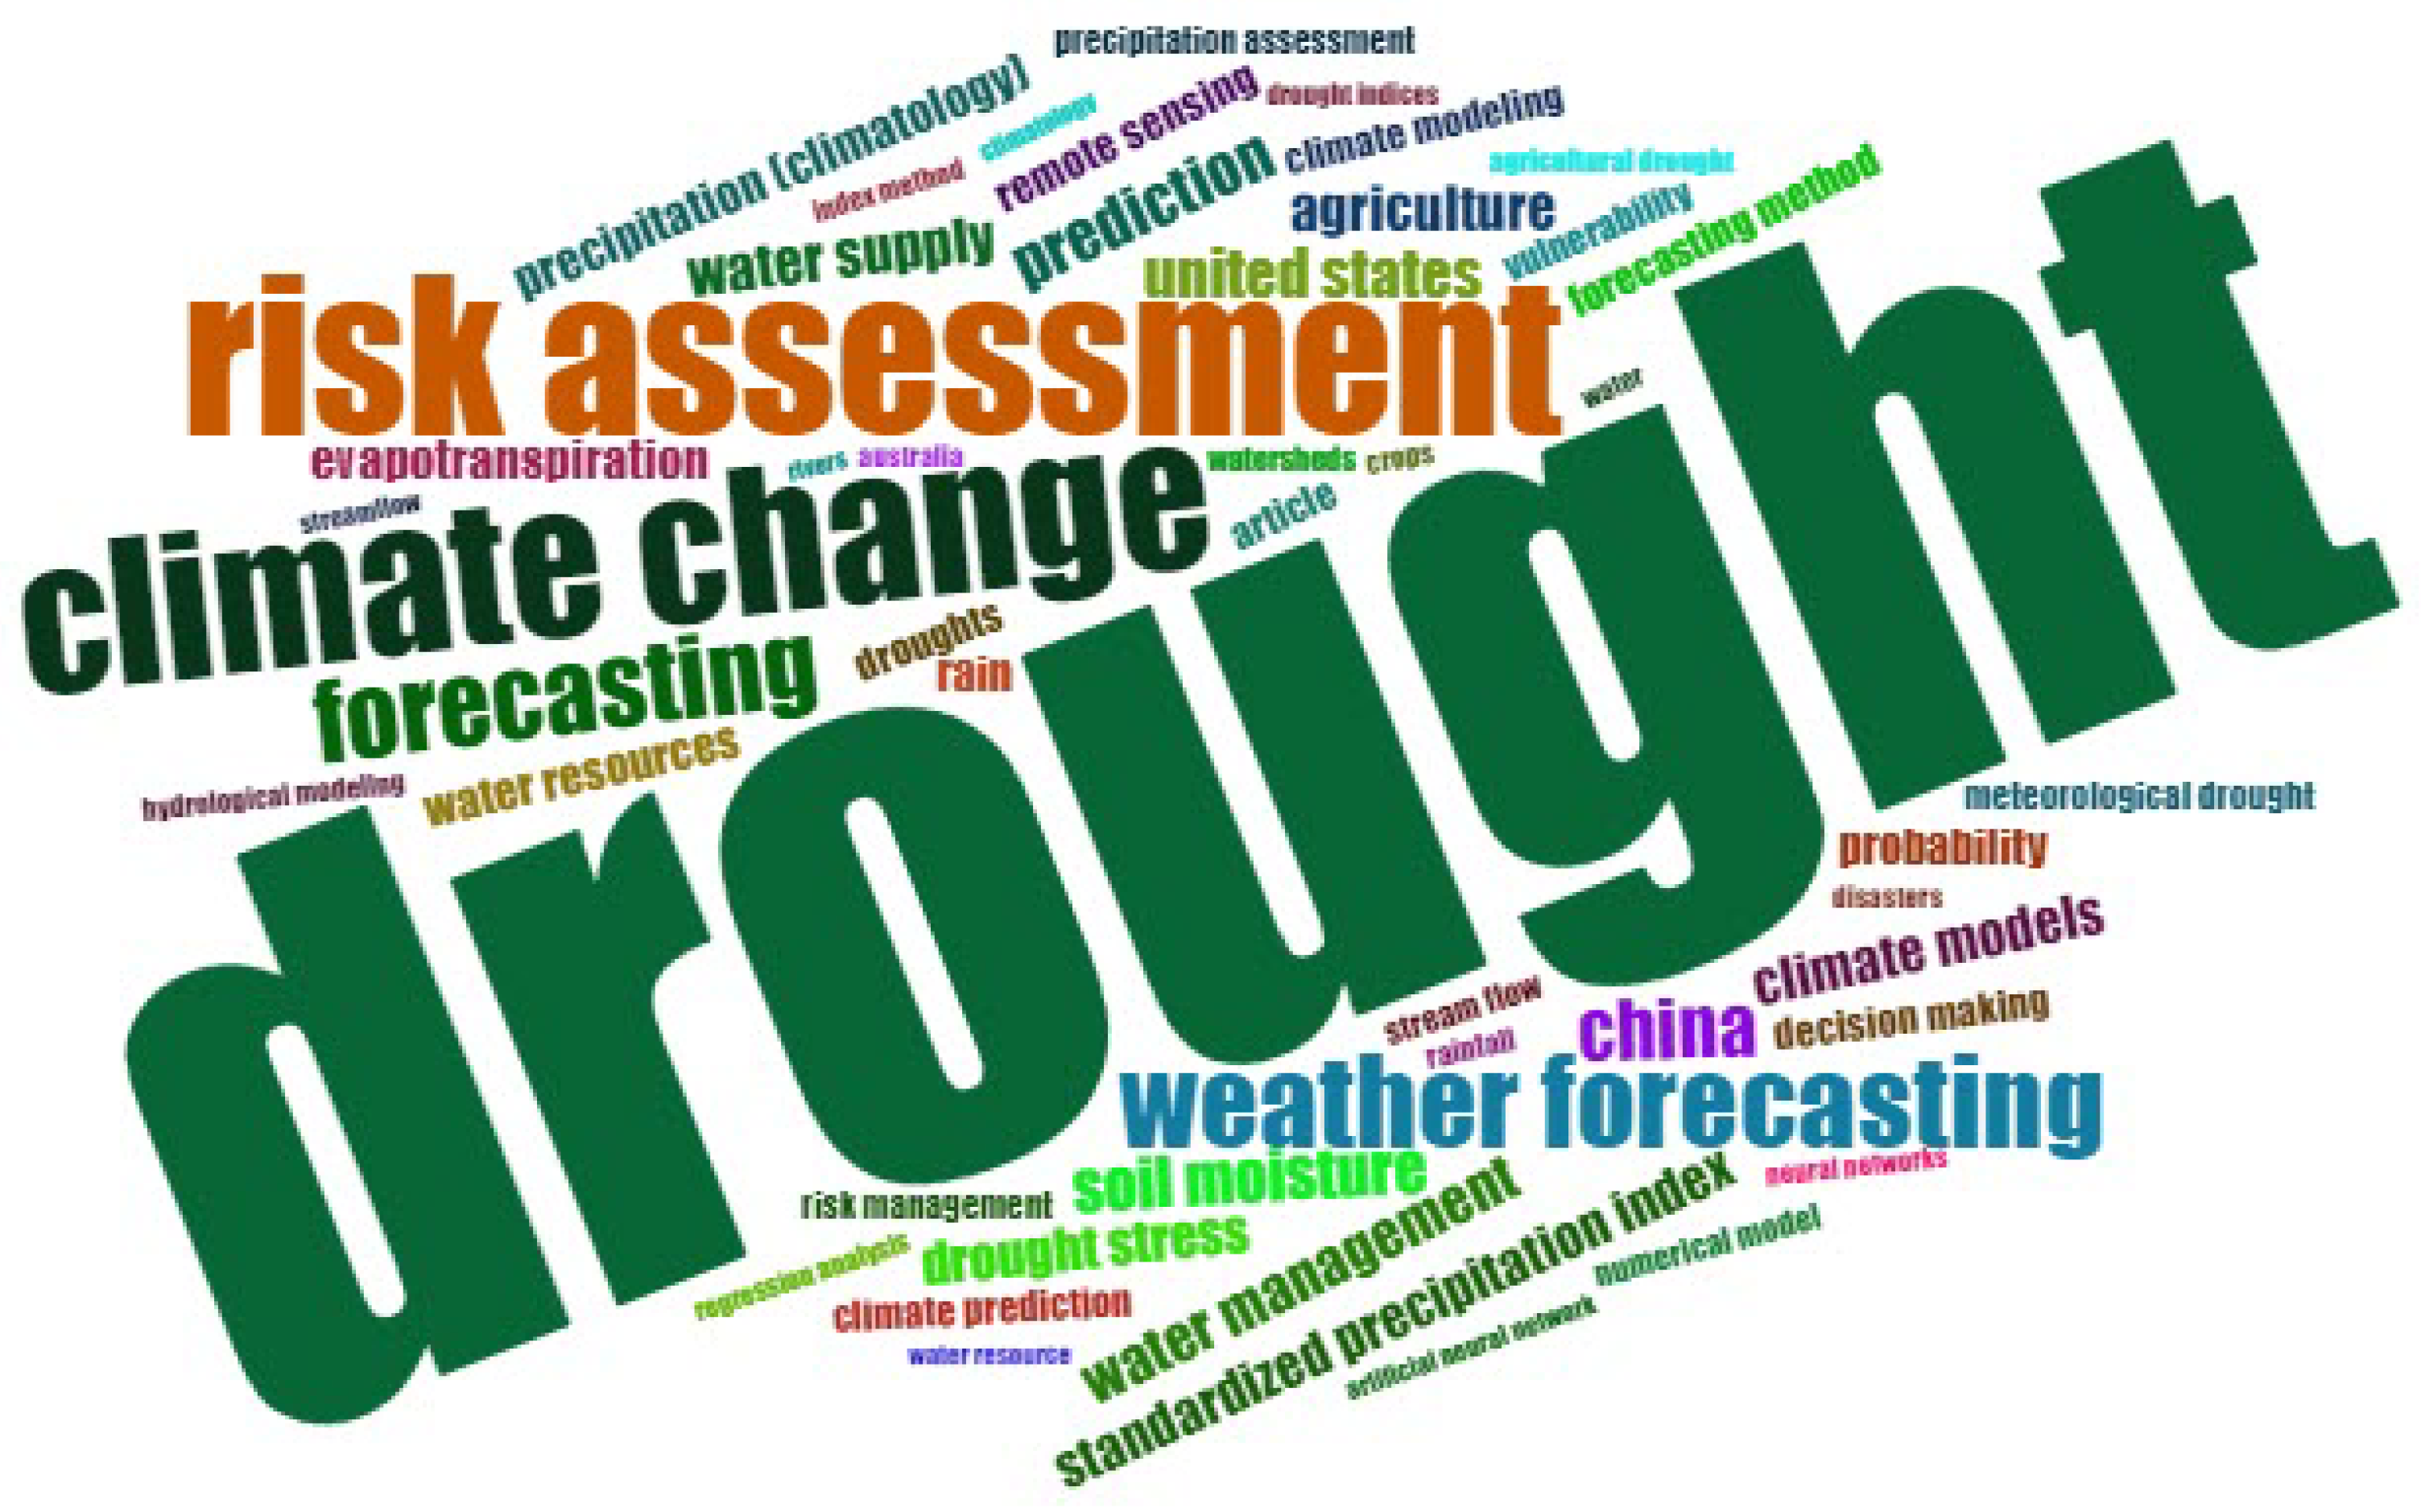
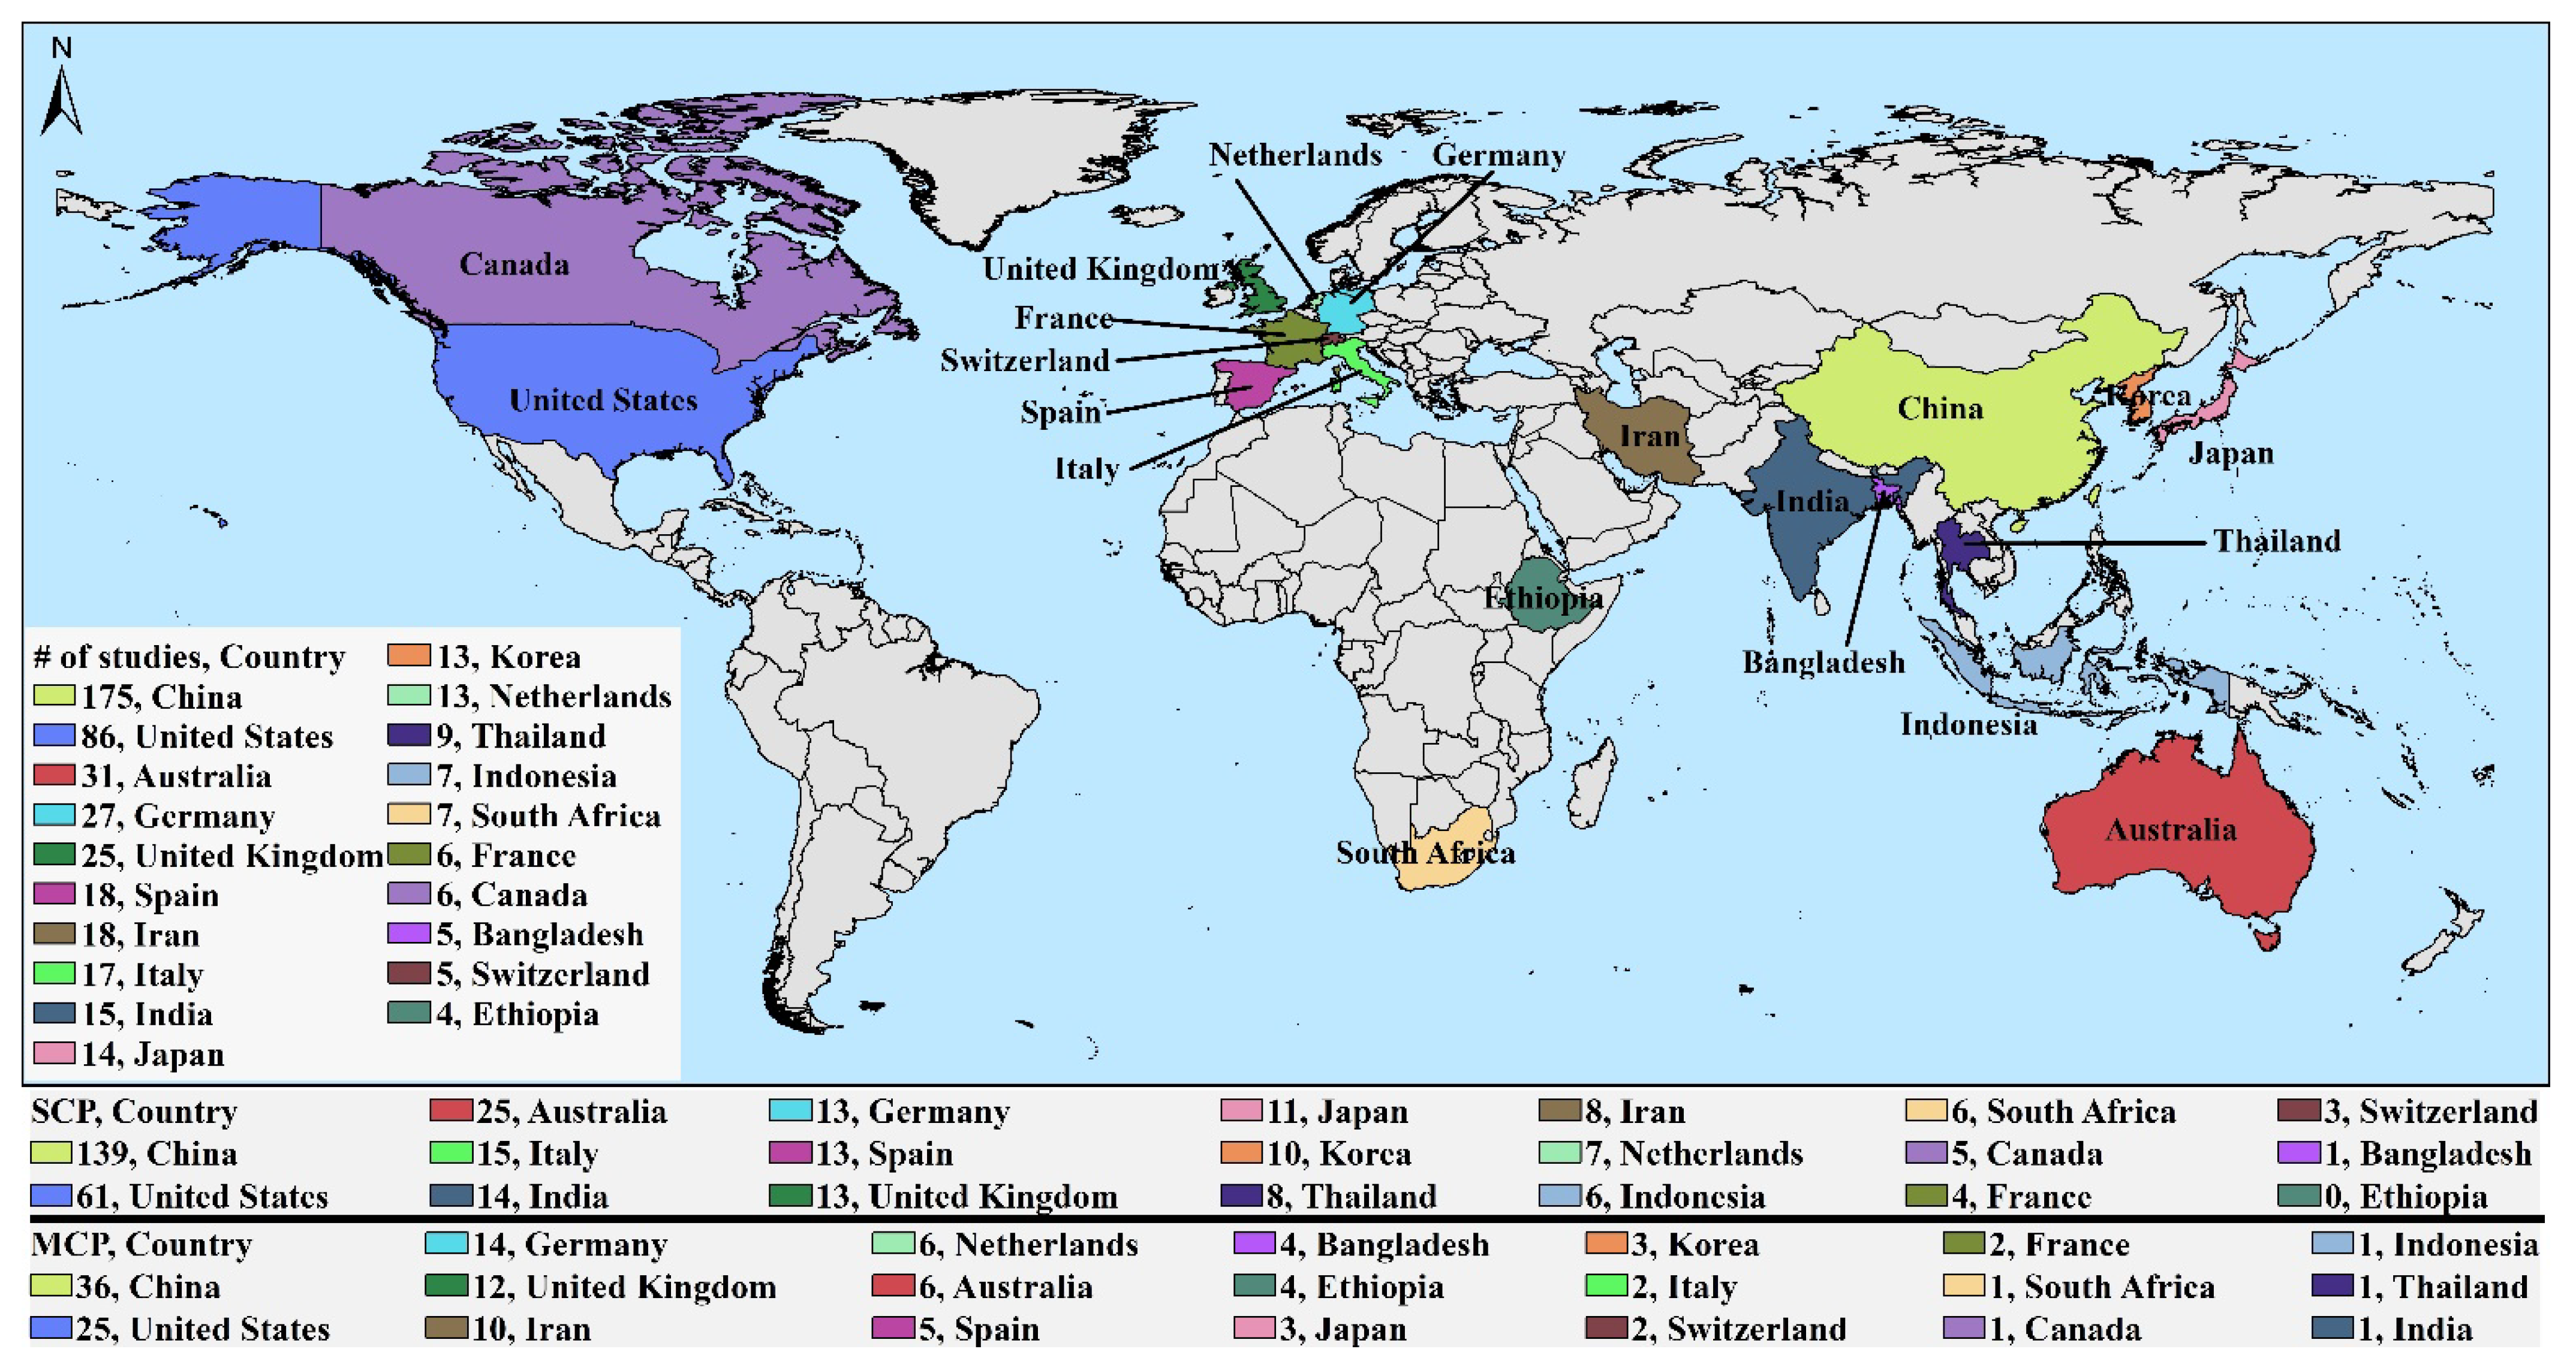
3.2. Drought Risk and Forecast
4. Conclusions
Supplementary Materials
Author Contributions
Funding
Institutional Review Board Statement
Informed Consent Statement
Data Availability Statement
Acknowledgments
Conflicts of Interest
References
- Schwalm, C.R.; Anderegg, W.R.L.; Michalak, A.M.; Fisher, J.B.; Biondi, F.; Koch, G.; Litvak, M.; Ogle, K.; Shaw, J.D.; Wolf, A.; et al. Global patterns of drought recovery. Nature 2017, 548, 202–205. [Google Scholar] [CrossRef]
- Herbst, P.; Bredenkamp, D.; Barker, H. A technique for the evaluation of drought from rainfall data. J. Hydrol. 1966, 4, 264–272. [Google Scholar] [CrossRef]
- Rahman, A. Social hydrology. In Handbook of Applied Hydrology; Chapter 155; Singh, V.P., Ed.; McGraw-Hill: New York, NY, USA, 2017; pp. 1–10. [Google Scholar]
- Wilhite, D.A. Drought as a natural hazard: Concepts and definitions. In Drought: A Global Assessment; Routledge: London, UK, 2000. [Google Scholar]
- Svoboda, M.; LeComte, D.; Hayes, M.; Heim, R.; Gleason, K.; Angel, J.; Rippey, B.; Tinker, R.; Palecki, M.; Stooksbury, D.; et al. The Drought Monitor. Bull. Am. Meteorol. Soc. 2002, 83, 1181–1190. [Google Scholar] [CrossRef]
- Yihdego, Y.; Vaheddoost, B.; Al-Weshah, R. Drought indices and indicators revisited. Arab. J. Geosci. 2019, 12, 69. [Google Scholar] [CrossRef]
- Wilhite, D.A.; Glantz, M.H. Understanding: The drought phenomenon: The role of definitions. Water Int. 1985, 10, 111–120. [Google Scholar] [CrossRef]
- Zargar, A.; Sadiq, R.; Naser, G.; Khan, F.I. A review of drought indices. Environ. Rev. 2011, 19, 333–349. [Google Scholar] [CrossRef]
- Wilhite, D.A. Drought and Water Crises: Science, Technology, and Management Issues; CRC Press: Boca Raton, FL, USA, 2005. [Google Scholar]
- Wilhite, D.A. Drought Monitoring as a Component of Drought Preparedness Planning. In Coping with Drought Risk in Agriculture and Water Supply Systems; Springer: Berlin/Heidelberg, Germany, 2009; pp. 3–19. [Google Scholar] [CrossRef]
- Eslamian, S. Handbook of Engineering Hydrology: Modeling, Climate Change, and Variability; CRC Press: Boca Raton, FL, USA, 2014. [Google Scholar]
- World Meteorological Organization (WMO); Global Water Partnership (GWP). Handbook of Drought Indicators and Indices; Svoboda, M., Fuchs, B.A., Eds.; Integrated Drought Management Programme (IDMP): Geneva, Switzerland, 2016. [Google Scholar]
- Hagenlocher, M. Drought vulnerability and risk assessments: State of the art, persistent gaps, and research agenda. Environ. Res. Lett. 2019, 14, 083002. [Google Scholar] [CrossRef]
- Orimoloye, I.R.; Ekundayo, T.C.; Ololade, O.O.; Belle, J.A. Systematic mapping of disaster risk management research and the role of innovative technology. Environ. Sci. Pollut. Res. 2020, 28, 4289–4306. [Google Scholar] [CrossRef] [PubMed]
- Orimoloye, I.R.; Belle, J.A.; Olusola, A.O.; Busayo, E.T.; Ololade, O.O. Spatial assessment of drought disasters, vulnerability, severity and water shortages: A potential drought disaster mitigation strategy. Nat. Hazards 2020, 105, 2735–2754. [Google Scholar] [CrossRef]
- Kchouk, S.; Melsen, L.A.; Walker, D.W.; Van Oel, P.R. A review of drought indices: Predominance of drivers over impacts and the importance of local context. Nat. Hazards Earth Syst. Sci. Discuss. 2021, in press. [Google Scholar]
- Wang, Z.; Zhao, Y.; Wang, B. A bibliometric analysis of climate change adaptation based on massive research literature data. J. Clean. Prod. 2018, 199, 1072–1082. [Google Scholar] [CrossRef]
- De Bakker, F.G.; Groenewegen, P.; den Hond, F. A Bibliometric Analysis of 30 Years of Research and Theory on Corporate Social Responsibility and Corporate Social Performance. Bus. Soc. 2005, 44, 283–317. [Google Scholar] [CrossRef]
- Aria, M.; Cuccurullo, C. bibliometrix: An R-tool for comprehensive science mapping analysis. J. Informetr. 2017, 11, 959–975. [Google Scholar] [CrossRef]
- Mishra, A.K.; Singh, V.P. Drought modelling—A review. J. Hydrol. 2011, 403, 157–175. [Google Scholar] [CrossRef]
- Van Eck, N.J.; Waltman, L. Software survey: VOSviewer, a computer program for bibliometric mapping. Scientometrics 2010, 84, 523–538. [Google Scholar] [CrossRef]
- Van Eck, N.J.; Waltman, L. CitNetExplorer: A new software tool for analyzing and visualizing citation networks. J. Inf. 2014, 8, 802–823. [Google Scholar] [CrossRef]
- Cobo, M.; López-Herrera, A.; Herrera-Viedma, E.; Herrera, F. SciMAT: A new science mapping analysis software tool. J. Am. Soc. Inf. Sci. Technol. 2012, 63, 1609–1630. [Google Scholar] [CrossRef]
- Persson, O.; Danell, R.; Schneider, J.W. How to use Bibexcel for various types of bibliometric analysis. In Celebrating Scholarly Communication Studies: A Festschrift for Olle Persson at His 60th Birthday; Omea University: Omea, Sweden, 2009; Volume 5, pp. 9–24. [Google Scholar]
- Chen, C.M. CiteSpace II: Detecting and visualizing emerging trends and transient patterns in scientific literature. J. Am. Soc. Inf. Sci. Technol. 2006, 57, 359–377. [Google Scholar] [CrossRef]
- Palmer, W.C. Meteorological Drought; Research Paper No. 45; US Department of Commerce, Weather Bureau: Silver Spring, MD, USA, 1965. [Google Scholar]
- Alley, W.M. The Palmer Drought Severity Index: Limitations and Assumptions. J. Clim. Appl. Meteorol. 1984, 23, 1100–1109. [Google Scholar] [CrossRef]
- Soulé, P.T. Spatial patterns of drought frequency and duration in the contiguous USA based on multiple drought event definitions. Int. J. Clim. 1992, 12, 11–24. [Google Scholar] [CrossRef]
- Weber, L.; Kkemdirim, L. Palmer’s drought indices revisited. Geogr. Ann. Ser. A Phys. Geogr. 1998, 80, 153–172. [Google Scholar] [CrossRef]
- Guttman, N.B. Comparing the palmer drought index and the standardized precipitation index. JAWRA J. Am. Water Resour. Assoc. 1998, 34, 113–121. [Google Scholar] [CrossRef]
- Mishra, A.K.; Singh, V.P. A review of drought concepts. J. Hydrol. 2010, 391, 202–216. [Google Scholar] [CrossRef]
- Hayes, M.J.; Svoboda, M.D.; Wiihite, D.A.; Vanyarkho, O.V. Monitoring the 1996 Drought Using the Standardized Precipitation Index. Bull. Am. Meteorol. Soc. 1999, 80, 429–438. [Google Scholar] [CrossRef]
- Vicente-Serrano, S.M.; Beguería, S.; López-Moreno, J.I. A Multiscalar Drought Index Sensitive to Global Warming: The Standardized Precipitation Evapotranspiration Index. J. Clim. 2010, 23, 1696–1718. [Google Scholar] [CrossRef]
- Tarpley, J.D.; Schneider, S.R.; Money, R.L. Global Vegetation Indices from the NOAA-7 Meteorological Satellite. J. Clim. Appl. Meteorol. 1984, 23, 491–494. [Google Scholar] [CrossRef]
- McKee, T.B.; Doesken, N.J.; Kleist, J. The relationship of drought frequency and duration to time scales. In Proceedings of the 8th Conference on Applied Climatology, Anaheim, CA, USA, 17–22 January 1993; Volume 17, pp. 179–183. [Google Scholar]
- Hayes, M.J.; Svoboda, M.; Wall, N.A.; Widhalm, M. The Lincoln Declaration on Drought Indices: Universal Meteorological Drought Index Recommended. Bull. Am. Meteorol. Soc. 2011, 92, 485–488. [Google Scholar] [CrossRef]
- Garfield, E. KeyWords Plus-ISI’s breakthrough retrieval method. 1. Expanding your searching power on current-contents on diskette. Curr. Contents 1990, 32, 5–9. [Google Scholar]
- Zhang, J.; Yu, Q.; Zheng, F.; Long, C.; Lu, Z.; Duan, Z. Comparing keywords plus of WOS and author keywords: A case study of patient adherence research. J. Assoc. Inf. Sci. Technol. 2015, 67, 967–972. [Google Scholar] [CrossRef]
- Mao, N.; Wang, M.-H.; Ho, Y.-S. A Bibliometric Study of the Trend in Articles Related to Risk Assessment Published inScience Citation Index. Hum. Ecol. Risk Assess. Int. J. 2010, 16, 801–824. [Google Scholar] [CrossRef]
- Li, J.; Wang, M.-H.; Ho, Y.-S. Trends in research on global climate change: A Science Citation Index Expanded-based analysis. Glob. Planet. Chang. 2011, 77, 13–20. [Google Scholar] [CrossRef]
- Hirsch, J.E. An index to quantify an individual’s scientific research output. Proc. Natl. Acad. Sci. USA 2005, 102, 16569–16572. [Google Scholar] [CrossRef]
- Molinari, J.-F.; Molinari, A. A new methodology for ranking scientific institutions. Scientometrics 2008, 75, 163–174. [Google Scholar] [CrossRef]
- Egghe, L. Theory and practise of the g-index. Scientometrics 2006, 69, 131–152. [Google Scholar] [CrossRef]
- Costas, R.; Bordons, M. Is g-index better than h-index? An exploratory study at the individual level. Scientometrics 2008, 77, 267–288. [Google Scholar] [CrossRef]
- Hirschfeld, H.O. A Connection between Correlation and Contingency. Math. Proc. Camb. Philos. Soc. 1935, 31, 520–524. [Google Scholar] [CrossRef]
- Horst, P. Measuring complex attitudes. J. Soc. Psychol. 1935, 6, 369–374. [Google Scholar] [CrossRef]
- Fisher, R.A. The Precision of Discriminant Functions. Ann. Eugen. 1940, 10, 422–429. [Google Scholar] [CrossRef]
- Cuccurullo, C.; Aria, M.; Sarto, F. Foundations and trends in performance management. A twenty-five years bibliometric analysis in business and public administration domains. Scientometrics 2016, 108, 595–611. [Google Scholar] [CrossRef]
- Boyack, K.W.; Klavans, R. Co-citation analysis, bibliographic coupling, and direct citation: Which citation approach represents the research front most accurately? J. Am. Soc. Inf. Sci. Technol. 2010, 61, 2389–2404. [Google Scholar] [CrossRef]
- Šubelj, L.; van Eck, N.J.; Waltman, L. Clustering Scientific Publications Based on Citation Relations: A Systematic Comparison of Different Methods. PLoS ONE 2016, 11, e0154404. [Google Scholar] [CrossRef]
- White, H.D.; McCain, K.W. Visualizing a discipline: An author co-citation analysis of information science, 1972–1995. J. Am. Soc. Inf. Sci. 1998, 49, 327–355. [Google Scholar]
- Andrews, J.E. An author co-citation analysis of medical informatics. J. Med Libr. Assoc. 2003, 91, 47–56. [Google Scholar]
- Fang, Y.; Yin, J.; Wu, B. Climate change and tourism: A scientometric analysis using CiteSpace. J. Sustain. Tour. 2017, 26, 108–126. [Google Scholar] [CrossRef]
- Kreuzman, H. A co-citation analysis of representative authors in philosophy: Examining the relationship between epistemologists and philosophers of science. Scientometrics 2001, 51, 525–539. [Google Scholar] [CrossRef]
- Ding, Y.; Yan, E.; Frazho, A.; Caverlee, J. PageRank for ranking authors in co-citation networks. J. Am. Soc. Inf. Sci. Technol. 2009, 60, 2229–2243. [Google Scholar] [CrossRef]
- Bibi, F.; Khan, H.U.; Iqbal, T.; Farooq, M.; Mehmood, I.; Nam, Y. Ranking Authors in an Academic Network Using Social Network Measures. Appl. Sci. 2018, 8, 1824. [Google Scholar] [CrossRef]
- Freeman, L.C. Centrality in social networks conceptual clarification. Soc. Netw. 1978, 1, 215–239. [Google Scholar] [CrossRef]
- Adams, J.D.; Black, G.C.; Clemmons, J.R.; Stephan, P.E. Scientific teams and institutional collaborations: Evidence from U.S. universities, 1981–1999. Res. Policy 2005, 34, 259–285. [Google Scholar] [CrossRef]
- Bordons, M.; Gómez, I. Collaboration networks in science. In The Web of Knowledge: A Festschrift in Honor of Eugene Garfield; Information Today Inc.: Medford, NJ, USA, 2000; pp. 197–213. [Google Scholar]
- Glänzel, W. National characteristics in international scientific co-authorship relations. Scientometrics 2001, 51, 69–115. [Google Scholar] [CrossRef]
- Laudel, G. Collaboration, creativity and rewards: Why and how scientists collaborate. Int. J. Technol. Manag. 2001, 22, 762. [Google Scholar] [CrossRef]
- Australian Bureau of Statistics. Droughts, Fires, Cyclones, Hailstorms and a Pandemic—The March Quarter 2020. Available online: https://www.abs.gov.au/articles?page=5 (accessed on 28 July 2021).
- King, A.D.; Pitman, A.J.; Henley, B.J.; Ukkola, A.M.; Brown, J.R. The role of climate variability in Australian drought. Nat. Clim. Chang. 2020, 10, 177–179. [Google Scholar] [CrossRef]
- Tian, F.; Wu, J.; Liu, L.; Leng, S.; Yang, J.; Zhao, W.; Shen, Q. Exceptional Drought across Southeastern Australia Caused by Extreme Lack of Precipitation and Its Impacts on NDVI and SIF in 2018. Remote Sens. 2019, 12, 54. [Google Scholar] [CrossRef]
- Kemter, M.; Fischer, M.; Luna, L.V.; Schönfeldt, E.; Vogel, J.; Banerjee, A.; Korup, O.; Thonicke, K. Cascading Hazards in the Aftermath of Australia’s 2019/2020 Black Summer Wildfires. Earth Futur. 2021, 9, e2020EF001884. [Google Scholar] [CrossRef]
- Bond, N.R.; Lake, P.S.; Arthington, A.H. The impacts of drought on freshwater ecosystems: An Australian perspective. Hydrobiologia 2008, 600, 3–16. [Google Scholar] [CrossRef]
- van Dijk, A.I.J.M.; Beck, H.E.; Crosbie, R.S.; de Jeu, R.A.M.; Liu, Y.Y.; Podger, G.M.; Timbal, B.; Viney, N.R. The Millennium Drought in southeast Australia (2001–2009): Natural and human causes and implications for water resources, ecosystems, economy, and society. Water Resour. Res. 2013, 49, 1040–1057. [Google Scholar] [CrossRef]
- Cobo, M.J.; Lopez-Herrera, A.G.; Herrera-Viedma, E.; Herrera, F. An approach for detecting, quantifying, and visualizing the evolution of a research field: A practical application to the Fuzzy Sets Theory field. J. Inf. 2011, 5, 146–166. [Google Scholar] [CrossRef]
- Cobo, M.; López-Herrera, A.; Herrera-Viedma, E.; Herrera, F. Science mapping software tools: Review, analysis, and cooperative study among tools. J. Am. Soc. Inf. Sci. Technol. 2011, 62, 1382–1402. [Google Scholar] [CrossRef]


| Rank | Country | Publications | Freq (%) | SCP | MCP | MCP_Ratio |
|---|---|---|---|---|---|---|
| 1 | China | 1694 | 24.01 | 1685 | 9 | 0.0053 |
| 2 | USA | 1372 | 19.44 | 1366 | 6 | 0.0044 |
| 3 | India | 393 | 5.57 | 390 | 3 | 0.0076 |
| 4 | Iran | 323 | 4.58 | 318 | 5 | 0.0155 |
| 5 | Spain | 290 | 4.11 | 287 | 3 | 0.0103 |
| 6 | Australia | 218 | 3.09 | 217 | 1 | 0.0046 |
| 7 | Germany | 197 | 2.79 | 196 | 1 | 0.0051 |
| 8 | Korea | 189 | 2.68 | 188 | 1 | 0.0053 |
| 9 | Italy | 184 | 2.61 | 184 | 0 | 0.0000 |
| 10 | Brazil | 141 | 2.00 | 141 | 0 | 0.0000 |
| 11 | Canada | 125 | 1.77 | 125 | 0 | 0.0000 |
| 12 | United Kingdom | 115 | 1.63 | 115 | 0 | 0.0000 |
| 13 | Turkey | 113 | 1.60 | 111 | 2 | 0.0177 |
| 14 | South Africa | 103 | 1.46 | 102 | 1 | 0.0097 |
| 15 | Portugal | 88 | 1.25 | 87 | 1 | 0.0114 |
| 16 | France | 87 | 1.23 | 84 | 3 | 0.0345 |
| 17 | Japan | 76 | 1.08 | 72 | 4 | 0.0526 |
| 18 | Greece | 69 | 0.98 | 69 | 0 | 0.0000 |
| 19 | Mexico | 67 | 0.95 | 67 | 0 | 0.0000 |
| 20 | Netherlands | 60 | 0.85 | 59 | 1 | 0.0167 |
| Rank | Sources | TP | PR (%) | H-Index | g-Index | TC | CPP | PY_Start |
|---|---|---|---|---|---|---|---|---|
| 1 | International Journal of Climatology | 261 | 3.15 | 54 | 99 | 11,244 | 43.08 | 1989 |
| 2 | Remote Sensing | 240 | 2.89 | 28 | 41 | 2840 | 11.83 | 2010 |
| 3 | Theoretical and Applied Climatology | 200 | 2.41 | 31 | 51 | 3601 | 18.01 | 1987 |
| 4 | Journal of Hydrology | 195 | 2.35 | 49 | 79 | 7519 | 38.56 | 1998 |
| 5 | Water (Switzerland) | 171 | 2.06 | 18 | 26 | 1389 | 8.12 | 2011 |
| 6 | Science of The Total Environment | 140 | 1.69 | 29 | 46 | 2829 | 20.21 | 2008 |
| 7 | Agricultural and Forest Meteorology | 130 | 1.57 | 43 | 69 | 5398 | 41.52 | 1988 |
| 8 | Natural Hazards | 129 | 1.56 | 29 | 51 | 3125 | 24.22 | 2003 |
| 9 | Water Resources Management | 120 | 1.45 | 36 | 70 | 5360 | 44.67 | 1999 |
| 10 | Remote Sensing of Environment | 118 | 1.42 | 54 | 90 | 8399 | 71.18 | 1987 |
| 11 | International Journal of Remote Sensing | 117 | 1.41 | 33 | 64 | 4568 | 39.04 | 1986 |
| 12 | International Geoscience and Remote Sensing Symposium (IGARSS) | 101 | 1.22 | 8 | 13 | 289 | 2.86 | 1993 |
| 13 | Proceedings of SPIE—The International Society for Optical Engineering | 101 | 1.22 | 5 | 6 | 133 | 1.32 | 1990 |
| 14 | Journal of Climate | 99 | 1.19 | 45 | 98 | 12,114 | 122.36 | 1993 |
| 15 | Hydrology and Earth System Sciences | 91 | 1.10 | 34 | 56 | 3350 | 36.81 | 1998 |
| 16 | Agricultural Water Management | 89 | 1.07 | 25 | 41 | 1963 | 22.06 | 1996 |
| 17 | IOP Conference Series: Earth and Environmental Science | 87 | 1.05 | 7 | 8 | 133 | 1.53 | 2014 |
| 18 | Geophysical Research Letters | 84 | 1.01 | 38 | 76 | 5849 | 69.63 | 1998 |
| 19 | Climate Dynamics | 79 | 0.95 | 33 | 53 | 2950 | 37.34 | 1992 |
| 20 | Environmental Research Letters | 79 | 0.95 | 25 | 43 | 1979 | 25.05 | 2007 |
| Type | Index | Australia | Brazil | Canada | China | Germany | India | Iran | Italy | Korea | Portugal | South Africa | Spain | Turkey | United Kingdom | USA |
|---|---|---|---|---|---|---|---|---|---|---|---|---|---|---|---|---|
| M | AI | 7 | 3 | 2 | 51 | 12 | 10 | 13 | 6 | 2 | 2 | 4 | 6 | 3 | 1 | 13 |
| DRI | 7 | 2 | - | 27 | 6 | 16 | 33 | 7 | 7 | 4 | 4 | 20 | 7 | 7 | 11 | |
| EDI | 4 | - | 2 | 11 | 3 | 9 | 13 | 2 | 24 | 1 | 4 | - | 2 | - | 1 | |
| PDSI | 11 | 5 | 32 | 308 | 26 | 16 | 14 | 7 | 17 | 5 | 5 | 13 | 12 | 21 | 448 | |
| RAI | 25 | 22 | - | 36 | 8 | 25 | 5 | 3 | 2 | - | 5 | 6 | 5 | 7 | 49 | |
| sc-PDSI | 1 | - | 2 | 54 | 7 | - | 1 | 3 | - | - | 2 | 1 | 4 | 3 | 16 | |
| SPEI | 19 | 7 | 19 | 430 | 34 | 44 | 31 | 21 | 32 | 23 | 24 | 88 | 13 | 8 | 86 | |
| SPI | 49 | 46 | 33 | 407 | 45 | 175 | 200 | 88 | 92 | 41 | 41 | 72 | 71 | 37 | 214 | |
| SM | SMA | 5 | 3 | 5 | 23 | 2 | 2 | 7 | 7 | 2 | - | - | 2 | - | 4 | 30 |
| SWS | 30 | 17 | 5 | 137 | 33 | 23 | 12 | 10 | 2 | 8 | 7 | 63 | 4 | 12 | 81 | |
| H | SSFI | - | 3 | - | 30 | 2 | 5 | 3 | 1 | 1 | - | 1 | 5 | 3 | 3 | 8 |
| SDI | 5 | 2 | 1 | 21 | - | 8 | 25 | 6 | 8 | 1 | 1 | 10 | 3 | 2 | 18 | |
| RS | EVI | 8 | 16 | 6 | 72 | 8 | 3 | 3 | 3 | 1 | - | 3 | 8 | - | 7 | 63 |
| ESI | 5 | 2 | - | 15 | 3 | 3 | 2 | 4 | 10 | 1 | - | 3 | 1 | 1 | 22 | |
| NDVI | 48 | 24 | 35 | 399 | 50 | 116 | 46 | 48 | 28 | 22 | 28 | 56 | 16 | 24 | 357 | |
| NDWI | 2 | 6 | 5 | 31 | 4 | 14 | 4 | 5 | 6 | 2 | 7 | 1 | - | 4 | 24 | |
| TCI | - | - | - | 55 | 1 | 22 | 6 | 2 | 3 | 7 | 2 | - | 1 | - | 12 | |
| VCI | 2 | 3 | 2 | 62 | 6 | 42 | 9 | 2 | 3 | 6 | 8 | - | 2 | 1 | 26 | |
| VHI | 2 | 5 | - | 38 | 1 | 16 | 2 | 2 | 8 | 4 | 1 | - | 2 | - | 19 | |
| CM | GLDAS | 5 | 4 | 1 | 46 | 2 | 4 | 4 | 2 | 5 | - | 1 | - | 2 | 1 | 12 |
| Rank | Drought Risk (DR) | Rank | Drought Forecast (DF) | ||||
|---|---|---|---|---|---|---|---|
| Country | TC | AAC | Country | TC | AAC | ||
| 1 | USA | 7526 | 87.51 | 1 | USA | 5354 | 27.89 |
| 2 | China | 2128 | 12.16 | 2 | China | 2100 | 12.00 |
| 3 | Germany | 1087 | 40.26 | 3 | Australia | 1566 | 33.32 |
| 4 | Australia | 815 | 26.29 | 4 | United Kingdom | 1528 | 50.93 |
| 5 | United Kingdom | 542 | 21.68 | 5 | Iran | 1259 | 16.14 |
| 6 | Japan | 455 | 32.50 | 6 | India | 982 | 26.54 |
| 7 | Italy | 440 | 25.88 | 7 | Italy | 727 | 51.93 |
| 8 | Netherlands | 278 | 21.38 | 8 | Canada | 643 | 32.15 |
| 9 | Spain | 258 | 14.33 | 9 | France | 464 | 35.69 |
| 10 | India | 172 | 11.47 | 10 | Spain | 453 | 25.17 |
| 11 | Korea | 140 | 10.77 | 11 | Korea | 404 | 8.24 |
| 12 | France | 113 | 18.83 | 12 | Turkey | 341 | 21.31 |
| 13 | Canada | 100 | 16.67 | 13 | Portugal | 335 | 41.88 |
| 14 | Ethiopia | 90 | 22.50 | 14 | Brazil | 314 | 20.93 |
| 15 | South Africa | 86 | 12.29 | 15 | Switzerland | 310 | 62.00 |
| 16 | Iran | 81 | 4.50 | 16 | Japan | 260 | 52.00 |
| 17 | Egypt | 77 | 38.50 | 17 | Germany | 241 | 18.54 |
| 18 | Switzerland | 71 | 14.20 | 18 | Finland | 143 | 47.67 |
| 19 | Slovakia | 70 | 70.00 | 19 | Malaysia | 138 | 10.62 |
| 20 | Greece | 69 | 23.00 | 20 | Netherlands | 138 | 10.62 |
| Rank | Drought Risk (DR) | Drought Forecast (DF) | ||||||||
|---|---|---|---|---|---|---|---|---|---|---|
| Authors | Articles | AF | H-Index | TC | Authors | Articles | AF | H-Index | TC | |
| 1 | Zhang Q | 20 | 4.41 | 11 | 398 | Singh VP | 15 | 4.00 | 12 | 700 |
| 2 | Wang J | 19 | 4.13 | 9 | 238 | Wang Y | 15 | 3.04 | 7 | 174 |
| 3 | Wang Y | 19 | 3.32 | 4 | 166 | Kim TW | 13 | 3.84 | 6 | 385 |
| 4 | Zhang J | 15 | 4.18 | 8 | 277 | Yuan X | 11 | 3.43 | 8 | 563 |
| 5 | Zhang L | 13 | 2.78 | 6 | 194 | Chen J | 11 | 2.92 | 5 | 107 |
| 6 | Chen J | 11 | 3.43 | 5 | 141 | Wood EF | 10 | 2.90 | 9 | 662 |
| 7 | Liu X | 10 | 2.09 | 5 | 91 | Hao Z | 10 | 2.06 | 7 | 481 |
| 8 | Wilhite DA | 9 | 5.67 | 7 | 448 | Svoboda M | 10 | 1.30 | 8 | 316 |
| 9 | Zhang Y | 9 | 1.74 | 4 | 108 | Deo RC | 9 | 2.67 | 8 | 565 |
| 10 | Kim TW | 9 | 2.09 | 4 | 87 | Dutra E | 9 | 1.51 | 7 | 410 |
| 11 | Singh VP | 8 | 1.85 | 5 | 196 | Wetterhall F | 9 | 1.72 | 6 | 374 |
| 12 | Zhang X | 8 | 1.45 | 5 | 171 | Wang L | 9 | 2.06 | 4 | 358 |
| 13 | Wang C | 8 | 1.48 | 3 | 60 | Tadesse T | 9 | 2.21 | 7 | 207 |
| 14 | Li J | 8 | 1.79 | 3 | 47 | Liu Y | 9 | 2.34 | 4 | 72 |
| 15 | Li Y | 7 | 1.36 | 4 | 161 | Kumar A | 8 | 1.73 | 7 | 434 |
| 16 | Wang L | 7 | 1.20 | 5 | 123 | Kisi O | 8 | 1.88 | 4 | 200 |
| 17 | Huang Q | 7 | 1.31 | 4 | 108 | Rhee J | 8 | 2.89 | 4 | 146 |
| 18 | Shaw R | 7 | 3.17 | 5 | 81 | Masinde M | 8 | 4.42 | 4 | 66 |
| 19 | Hayes MJ | 6 | 1.47 | 4 | 68 | Panu US | 8 | 3.67 | 4 | 50 |
| 20 | Bao Y | 6 | 1.29 | 3 | 47 | Lee JH | 8 | 1.93 | 4 | 48 |
Publisher’s Note: MDPI stays neutral with regard to jurisdictional claims in published maps and institutional affiliations. |
© 2022 by the authors. Licensee MDPI, Basel, Switzerland. This article is an open access article distributed under the terms and conditions of the Creative Commons Attribution (CC BY) license (https://creativecommons.org/licenses/by/4.0/).
Share and Cite
Yildirim, G.; Rahman, A.; Singh, V.P. A Bibliometric Analysis of Drought Indices, Risk, and Forecast as Components of Drought Early Warning Systems. Water 2022, 14, 253. https://doi.org/10.3390/w14020253
Yildirim G, Rahman A, Singh VP. A Bibliometric Analysis of Drought Indices, Risk, and Forecast as Components of Drought Early Warning Systems. Water. 2022; 14(2):253. https://doi.org/10.3390/w14020253
Chicago/Turabian StyleYildirim, Gokhan, Ataur Rahman, and Vijay P. Singh. 2022. "A Bibliometric Analysis of Drought Indices, Risk, and Forecast as Components of Drought Early Warning Systems" Water 14, no. 2: 253. https://doi.org/10.3390/w14020253
APA StyleYildirim, G., Rahman, A., & Singh, V. P. (2022). A Bibliometric Analysis of Drought Indices, Risk, and Forecast as Components of Drought Early Warning Systems. Water, 14(2), 253. https://doi.org/10.3390/w14020253