
Application of Artificial Neural Networks for Mangrove Mapping Using Multi-Temporal and Multi-Source Remote Sensing Imagery

 ,
,  ,
,  ,
,  and
and 
Abstract
:1. Introduction
2. Study Area and Data Sets
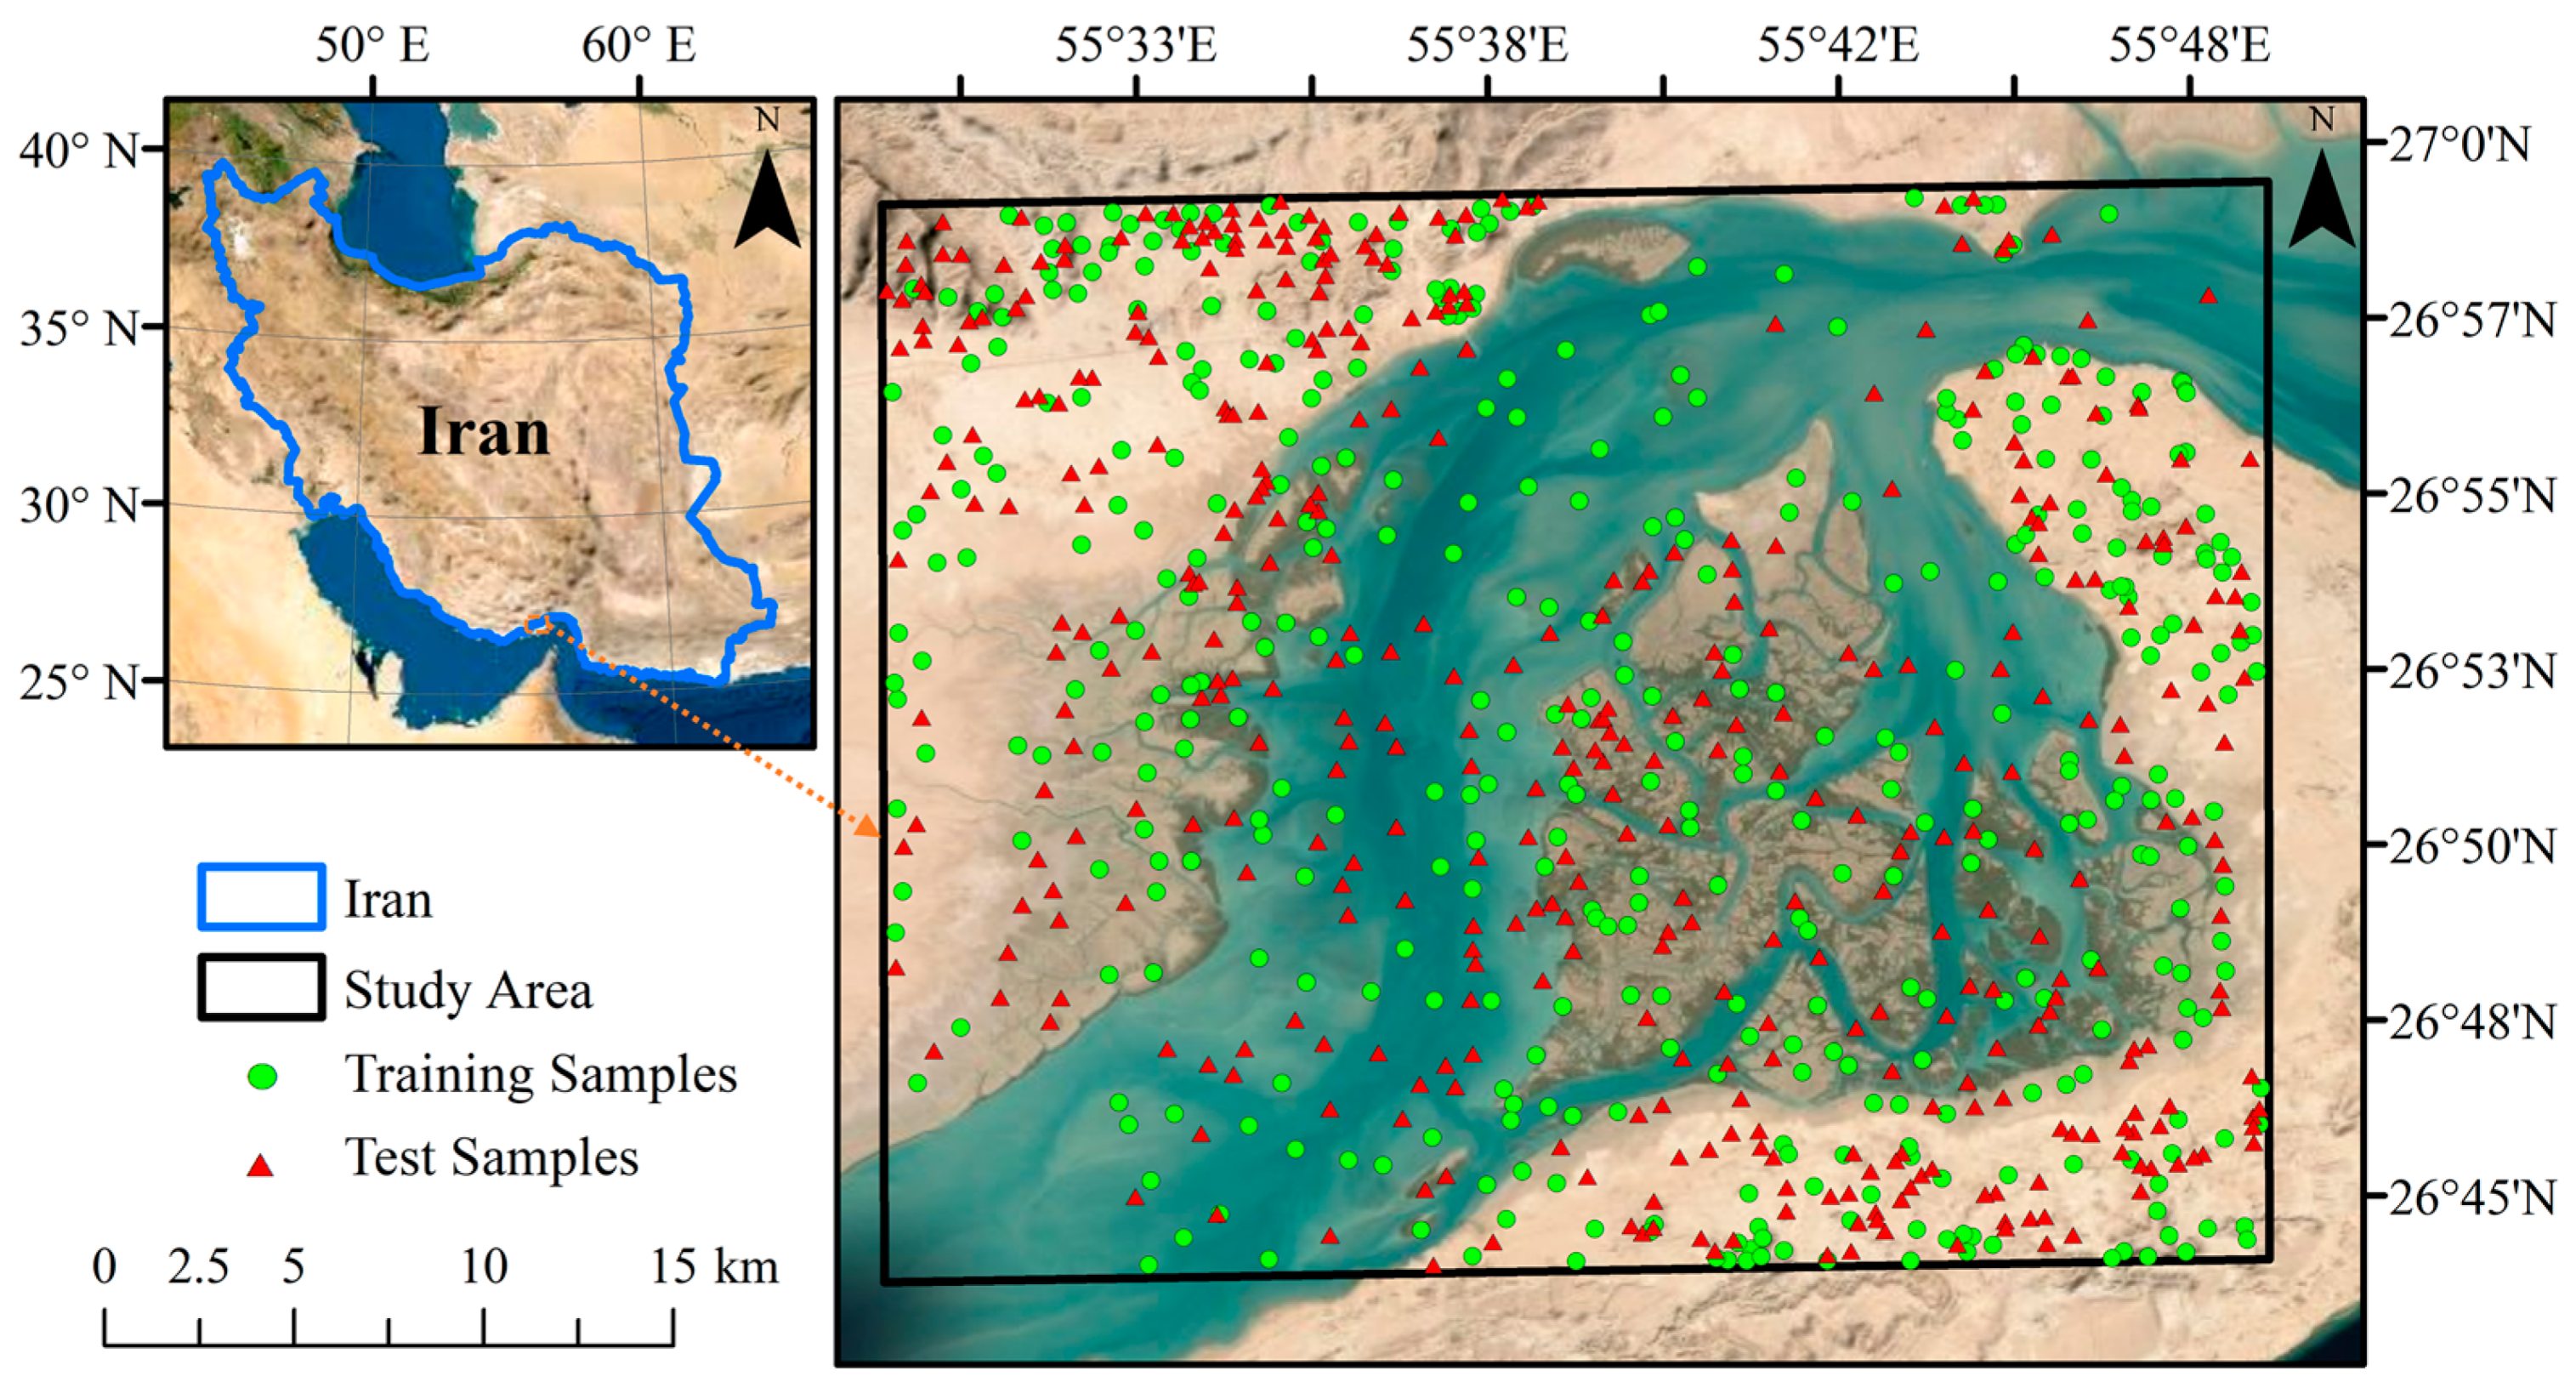
2.1. Study Area
2.2. Reference Samples
2.3. Satellite Images
3. Methodology
3.1. Satellite Images Preprocessing
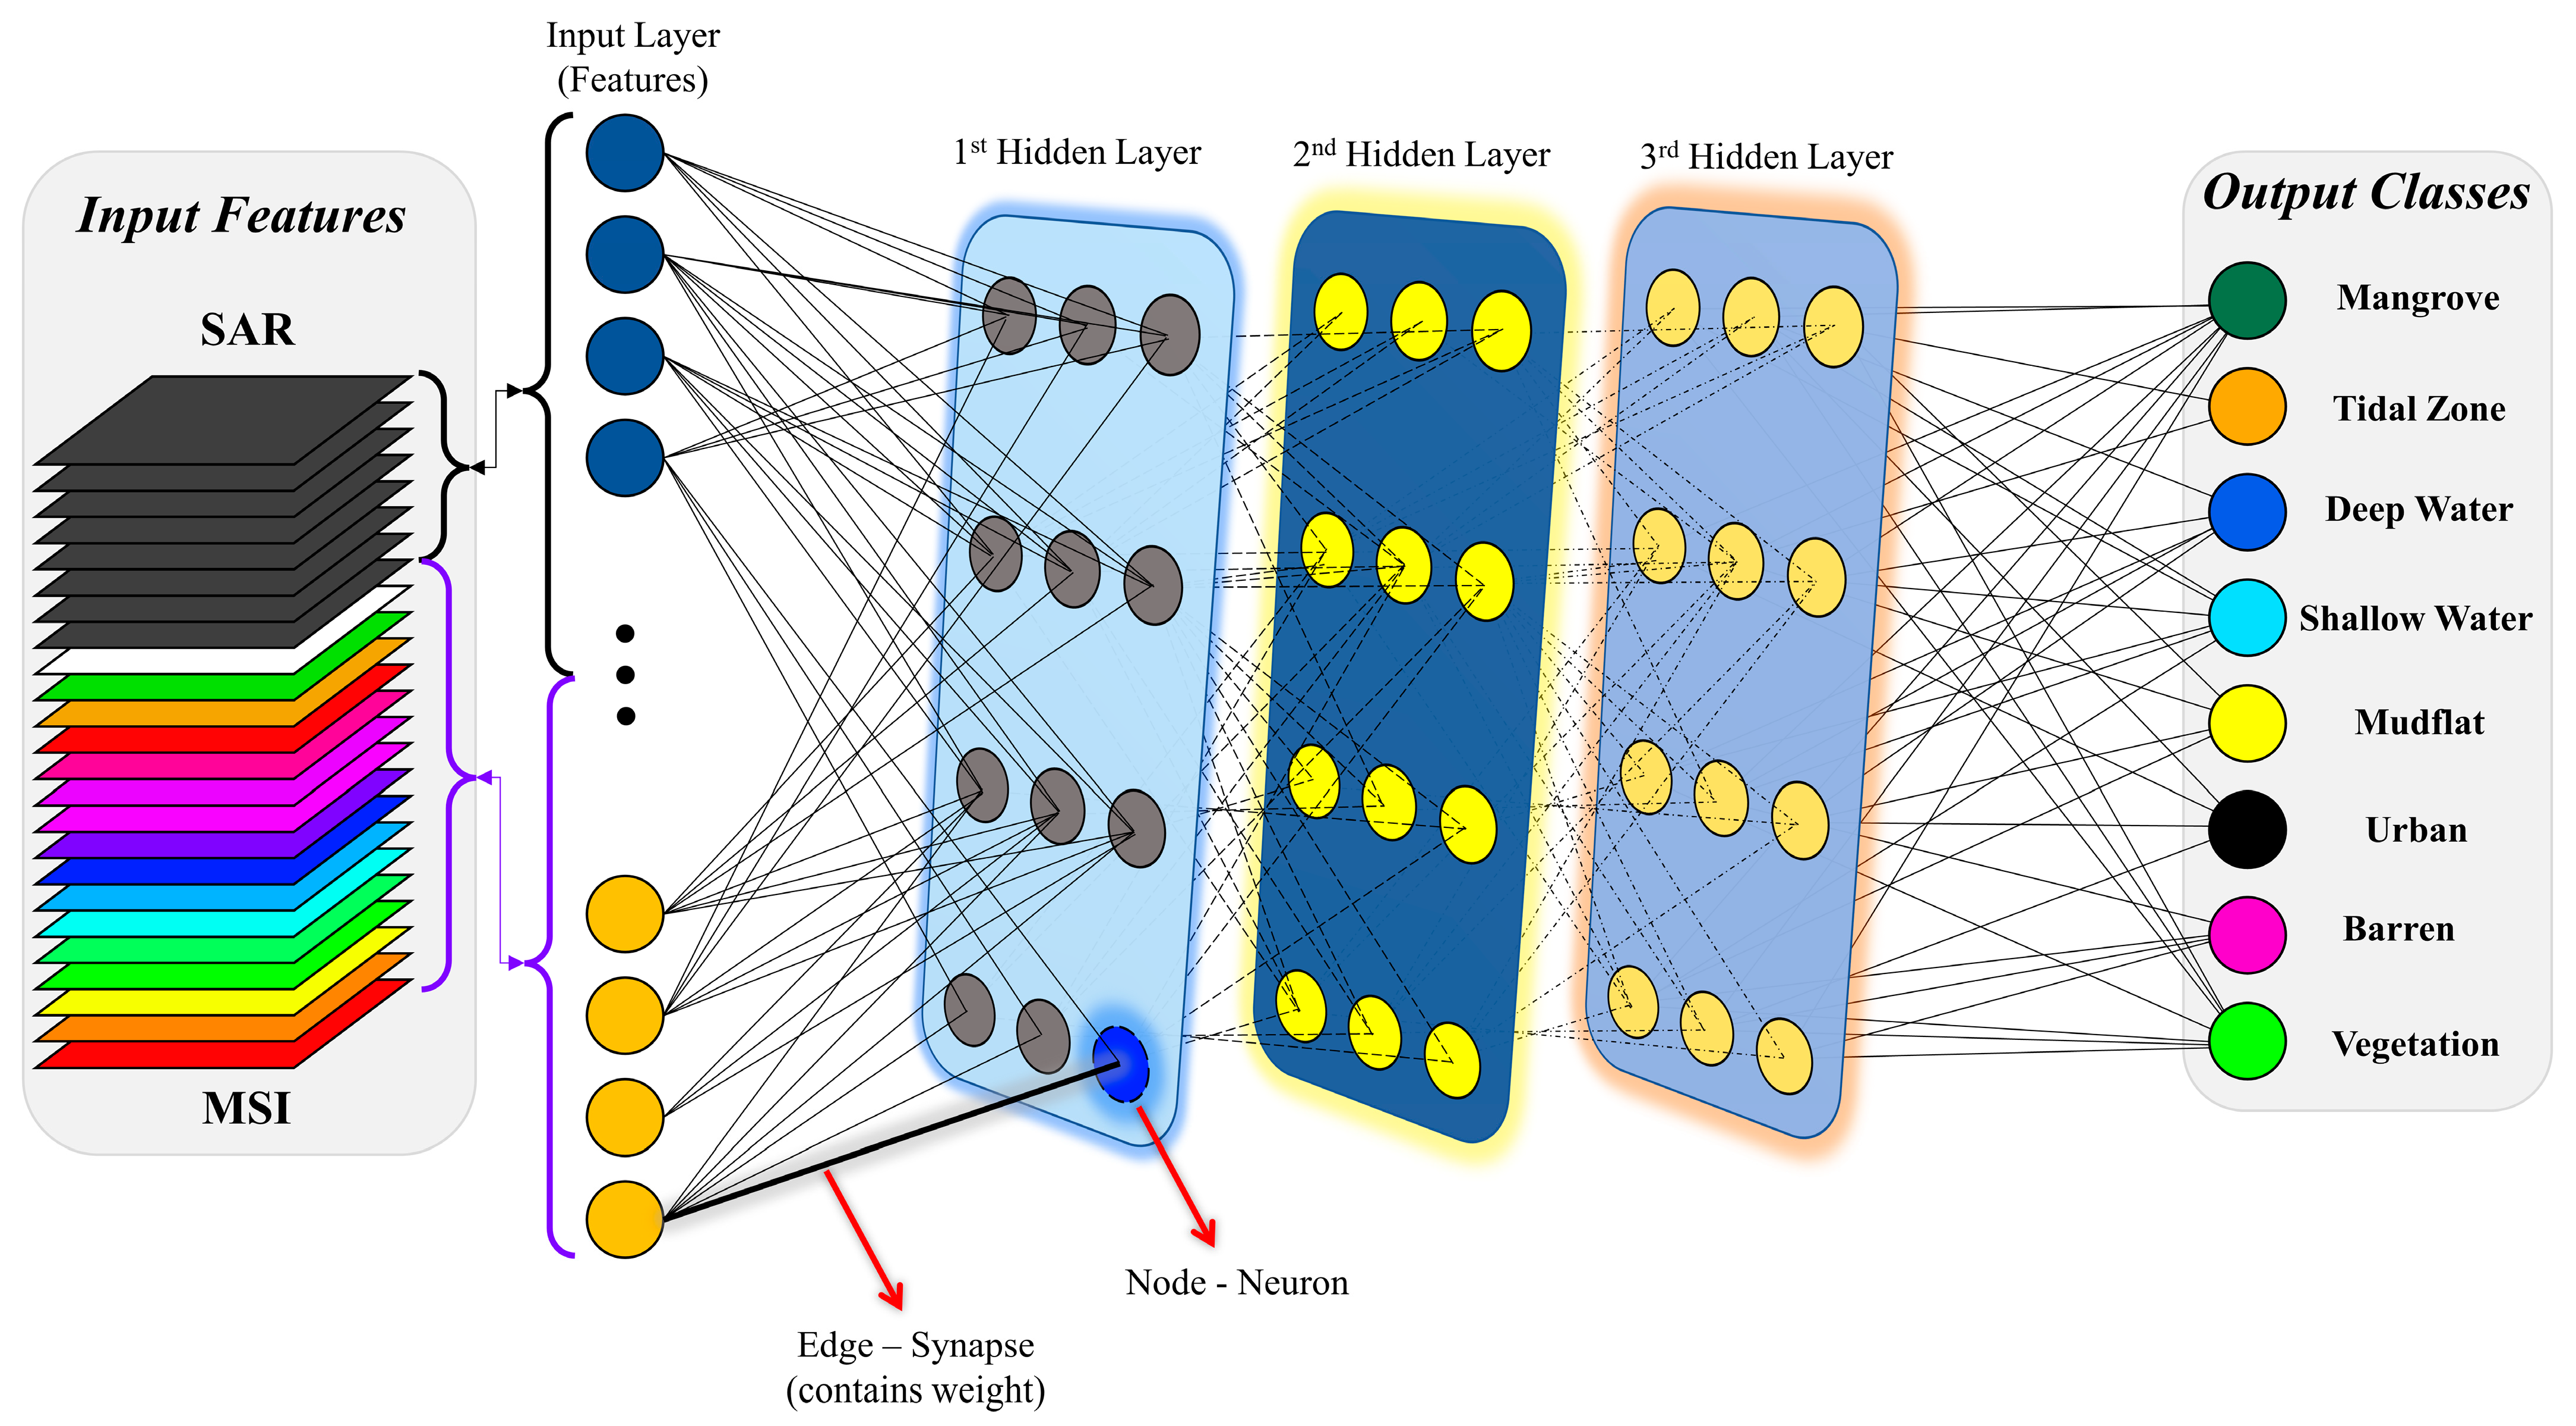
3.2. ANN Models and Classification
3.3. Accuracy Assessment
4. Results
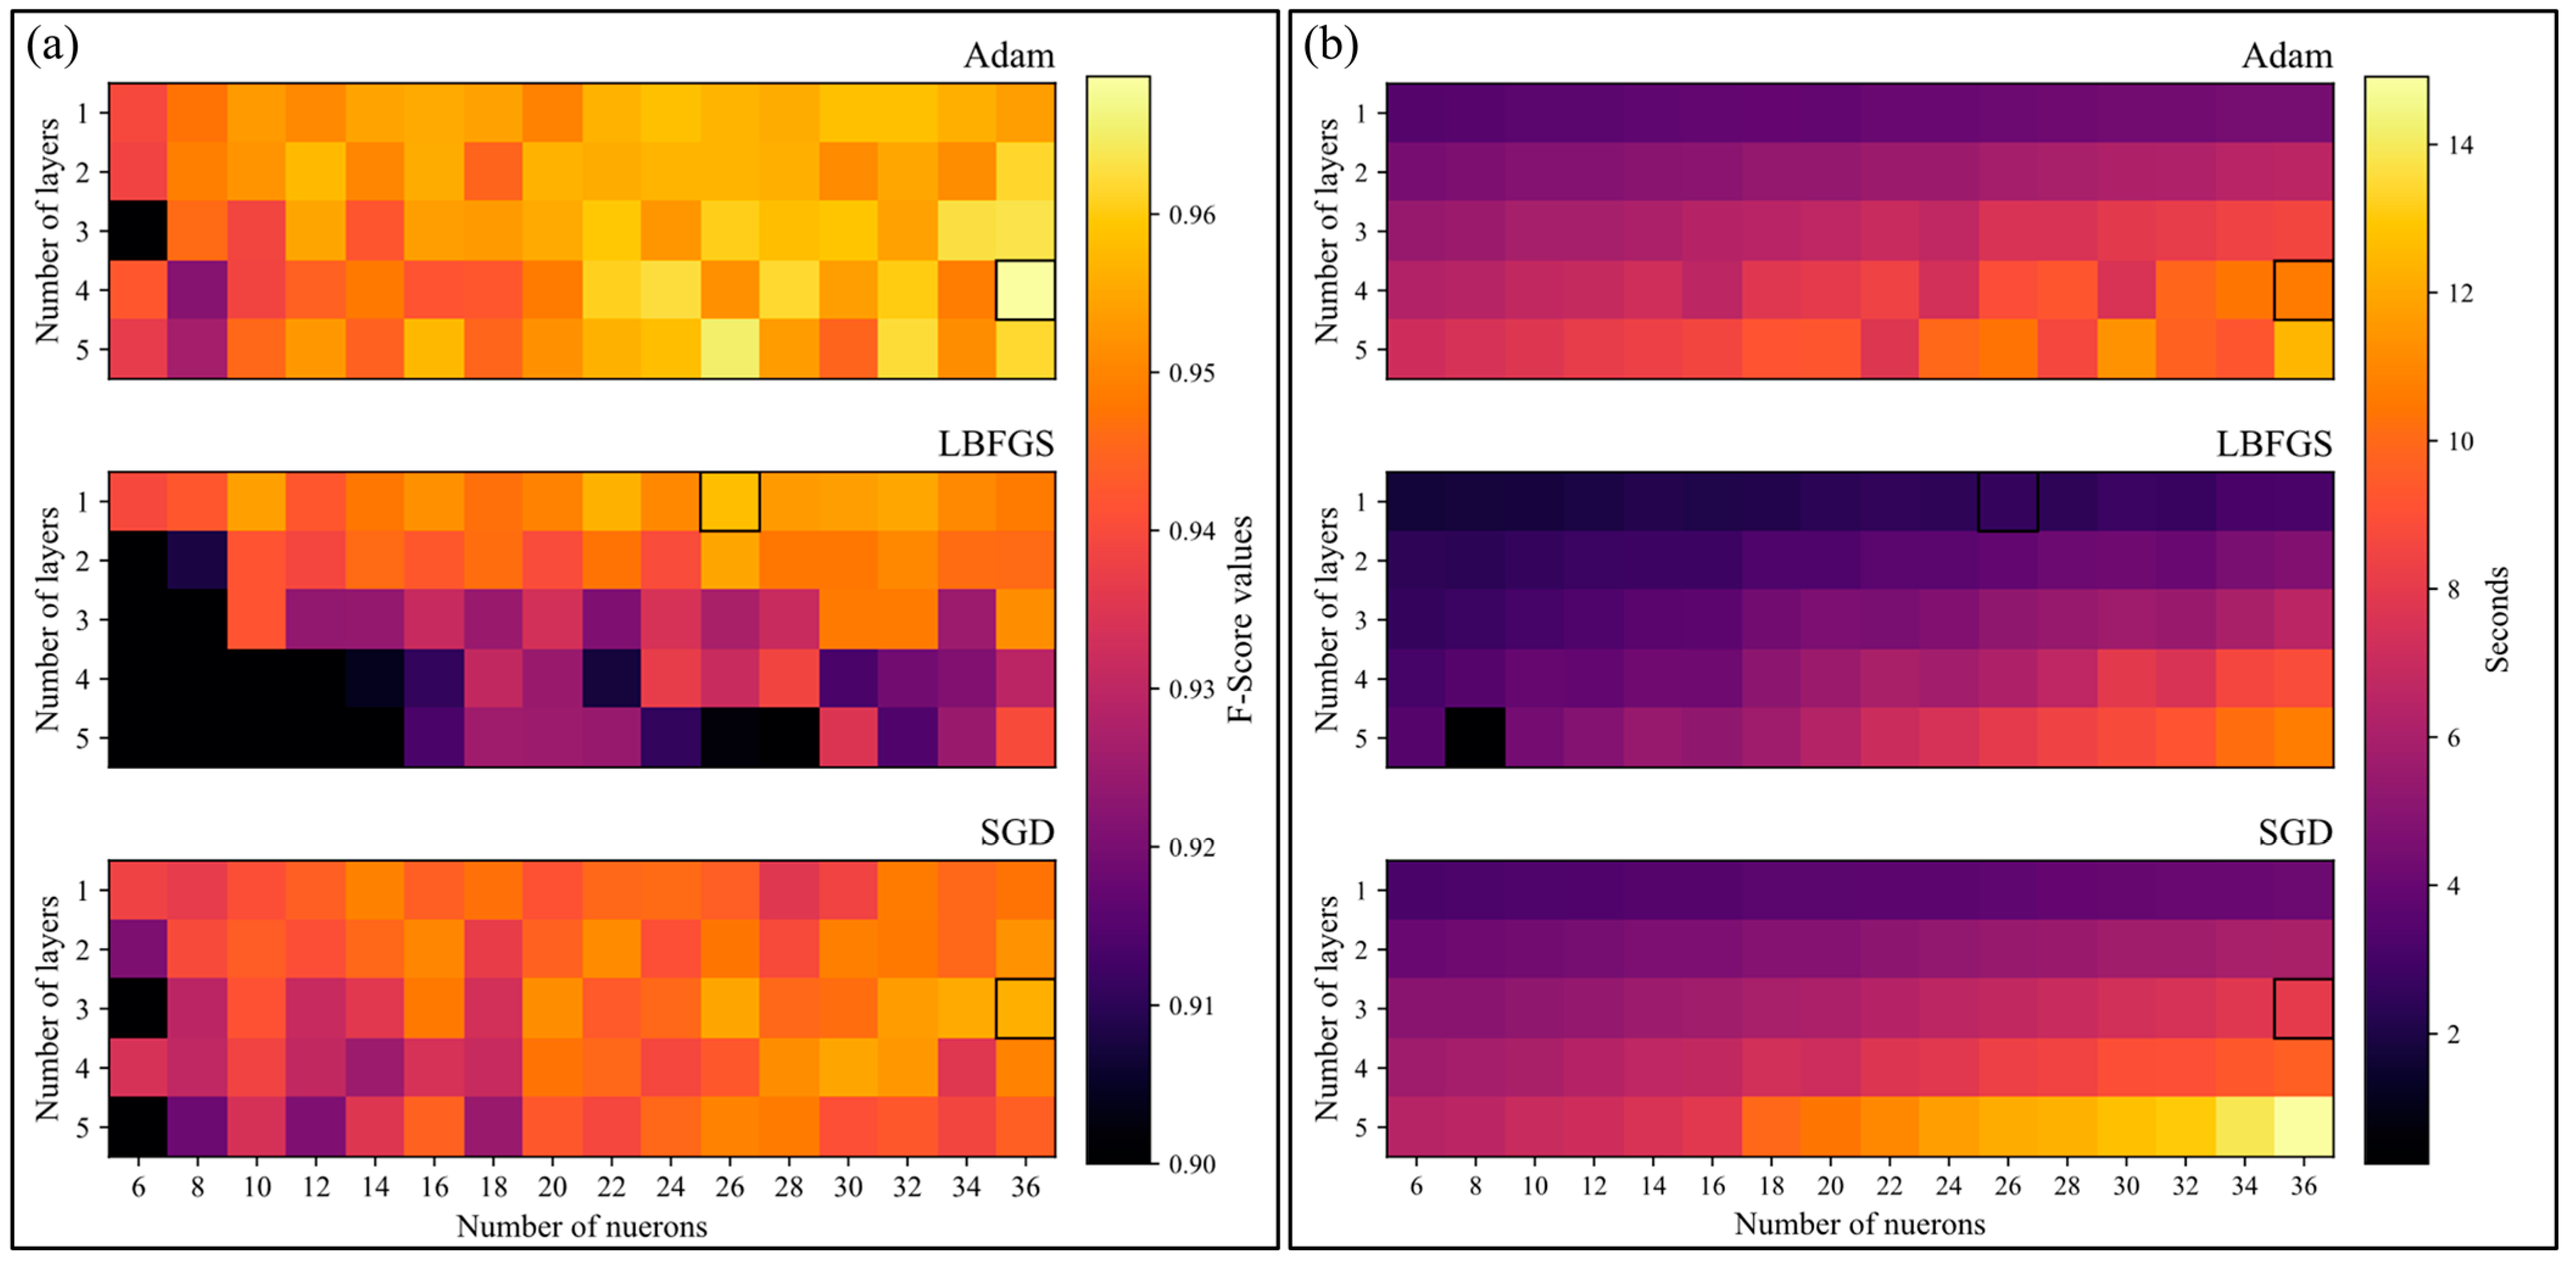
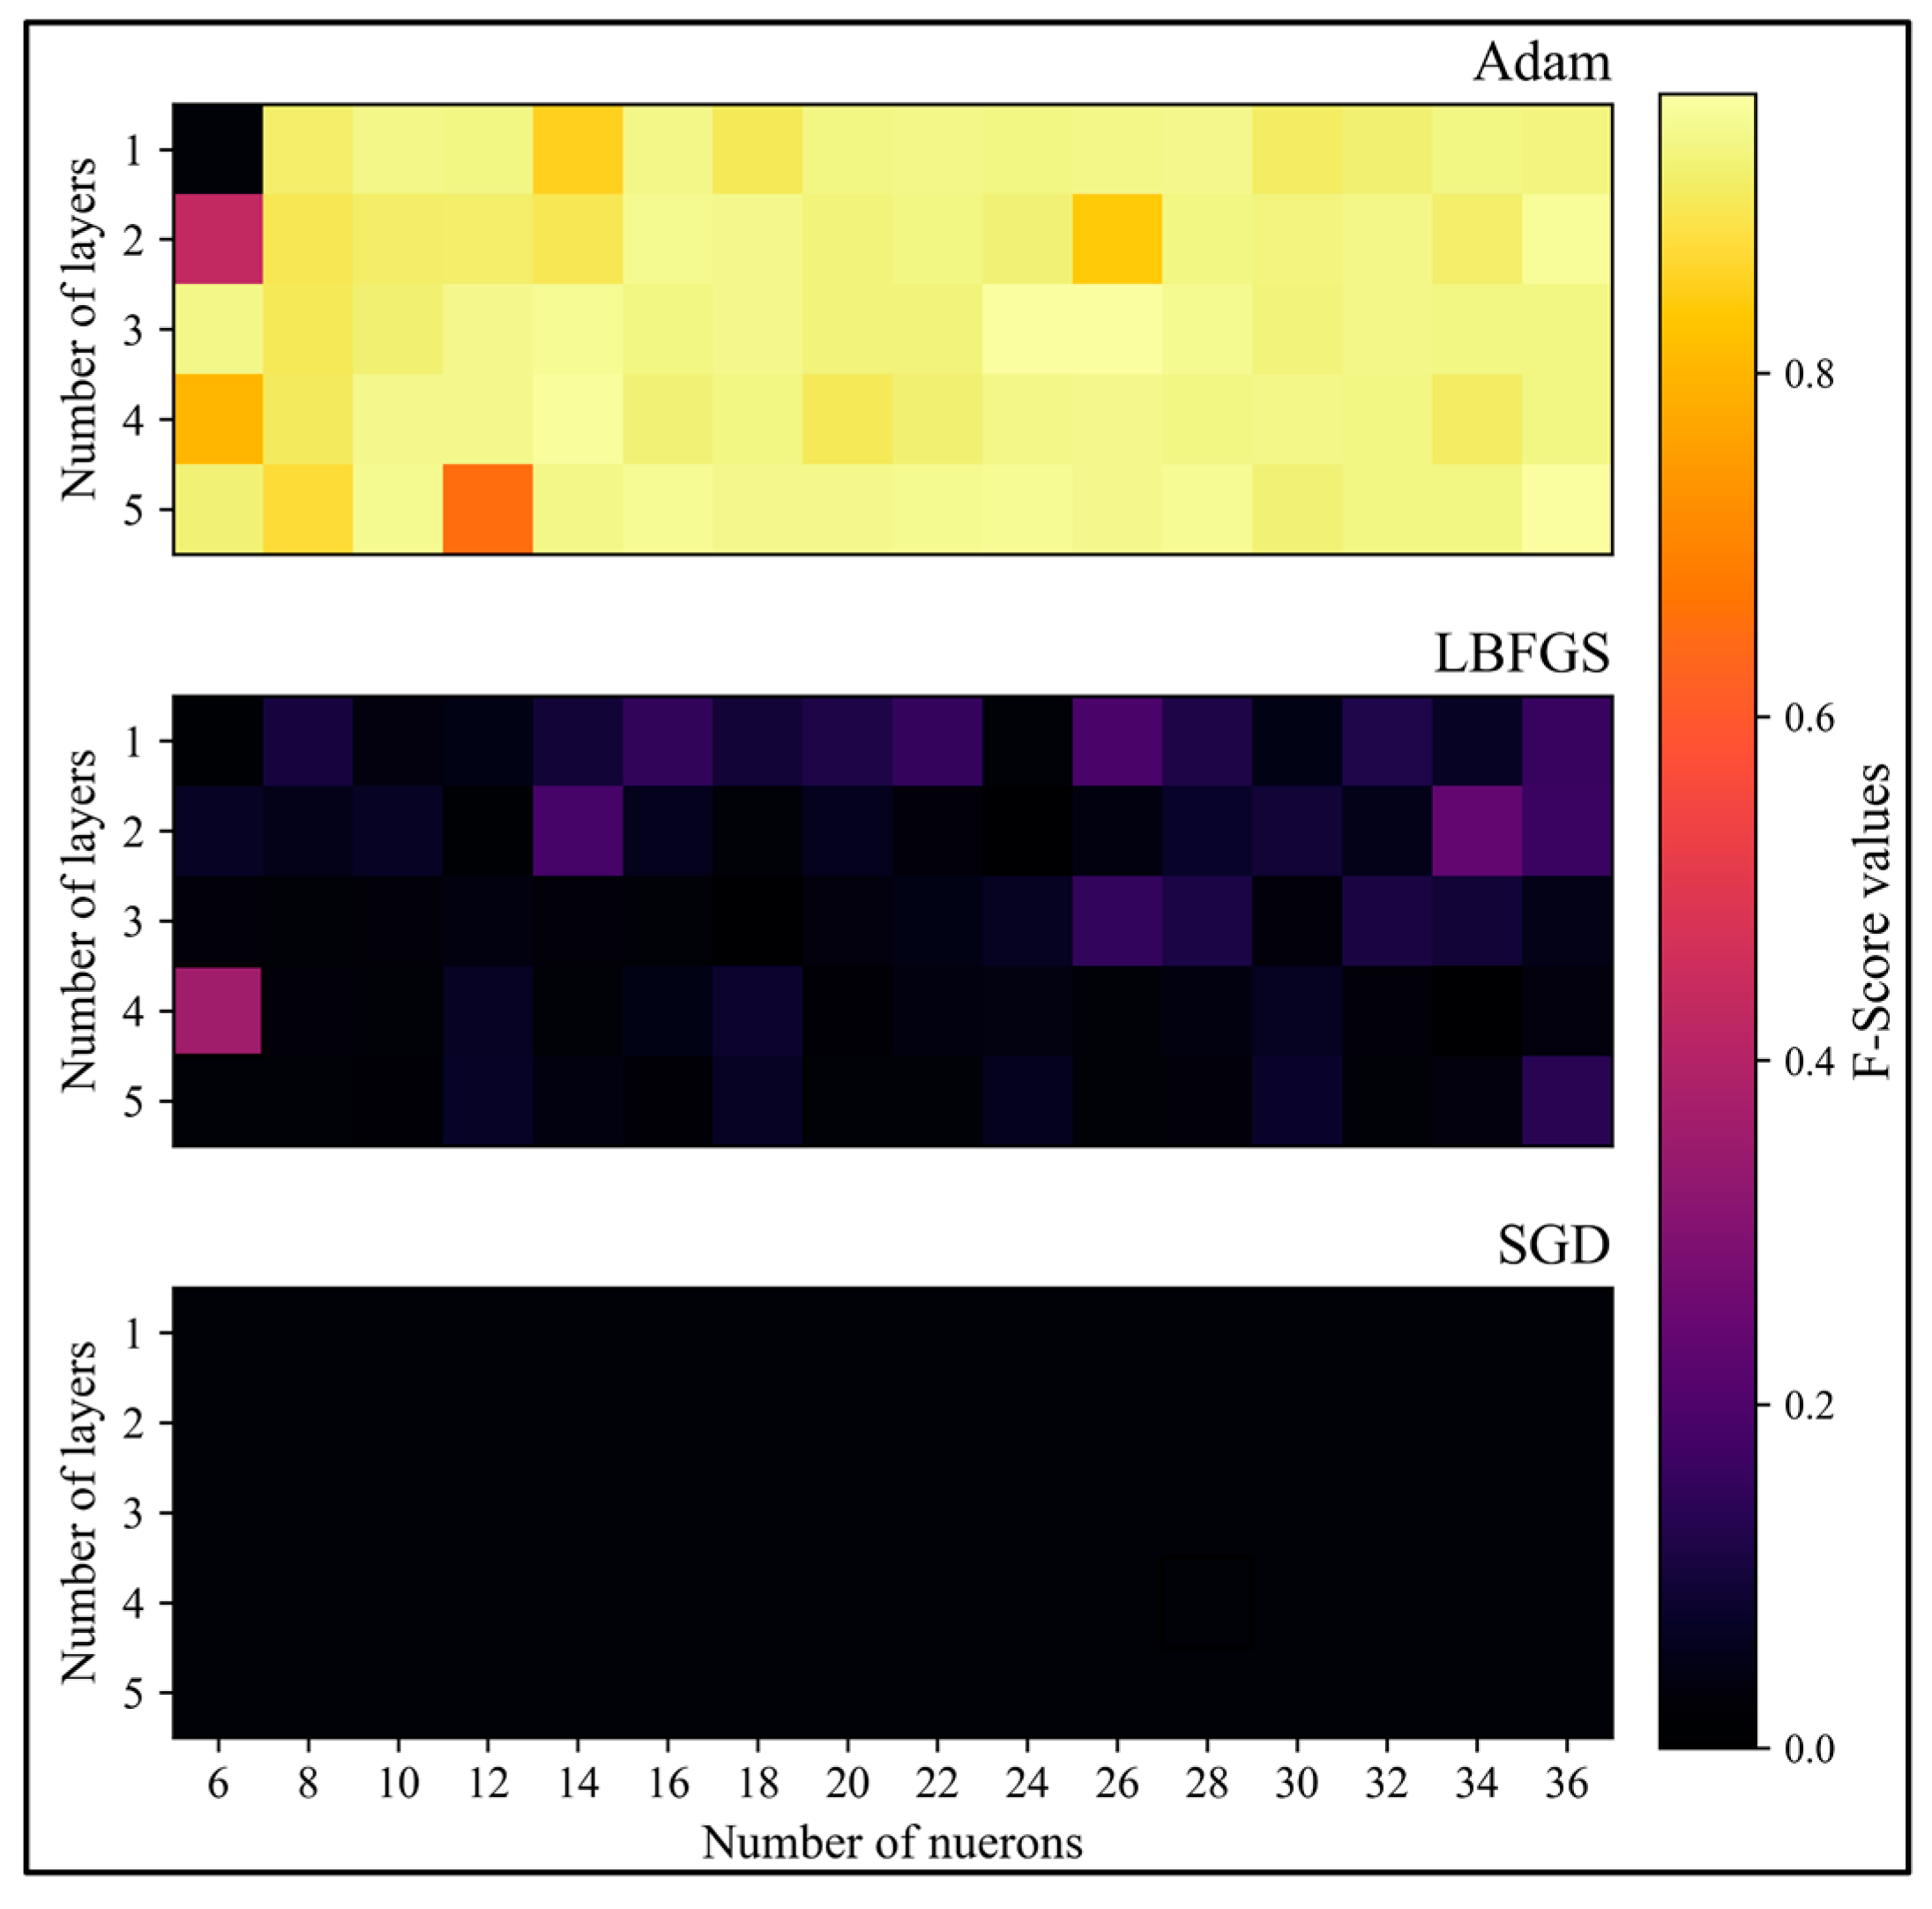
4.1. Number of Layers and Neurons
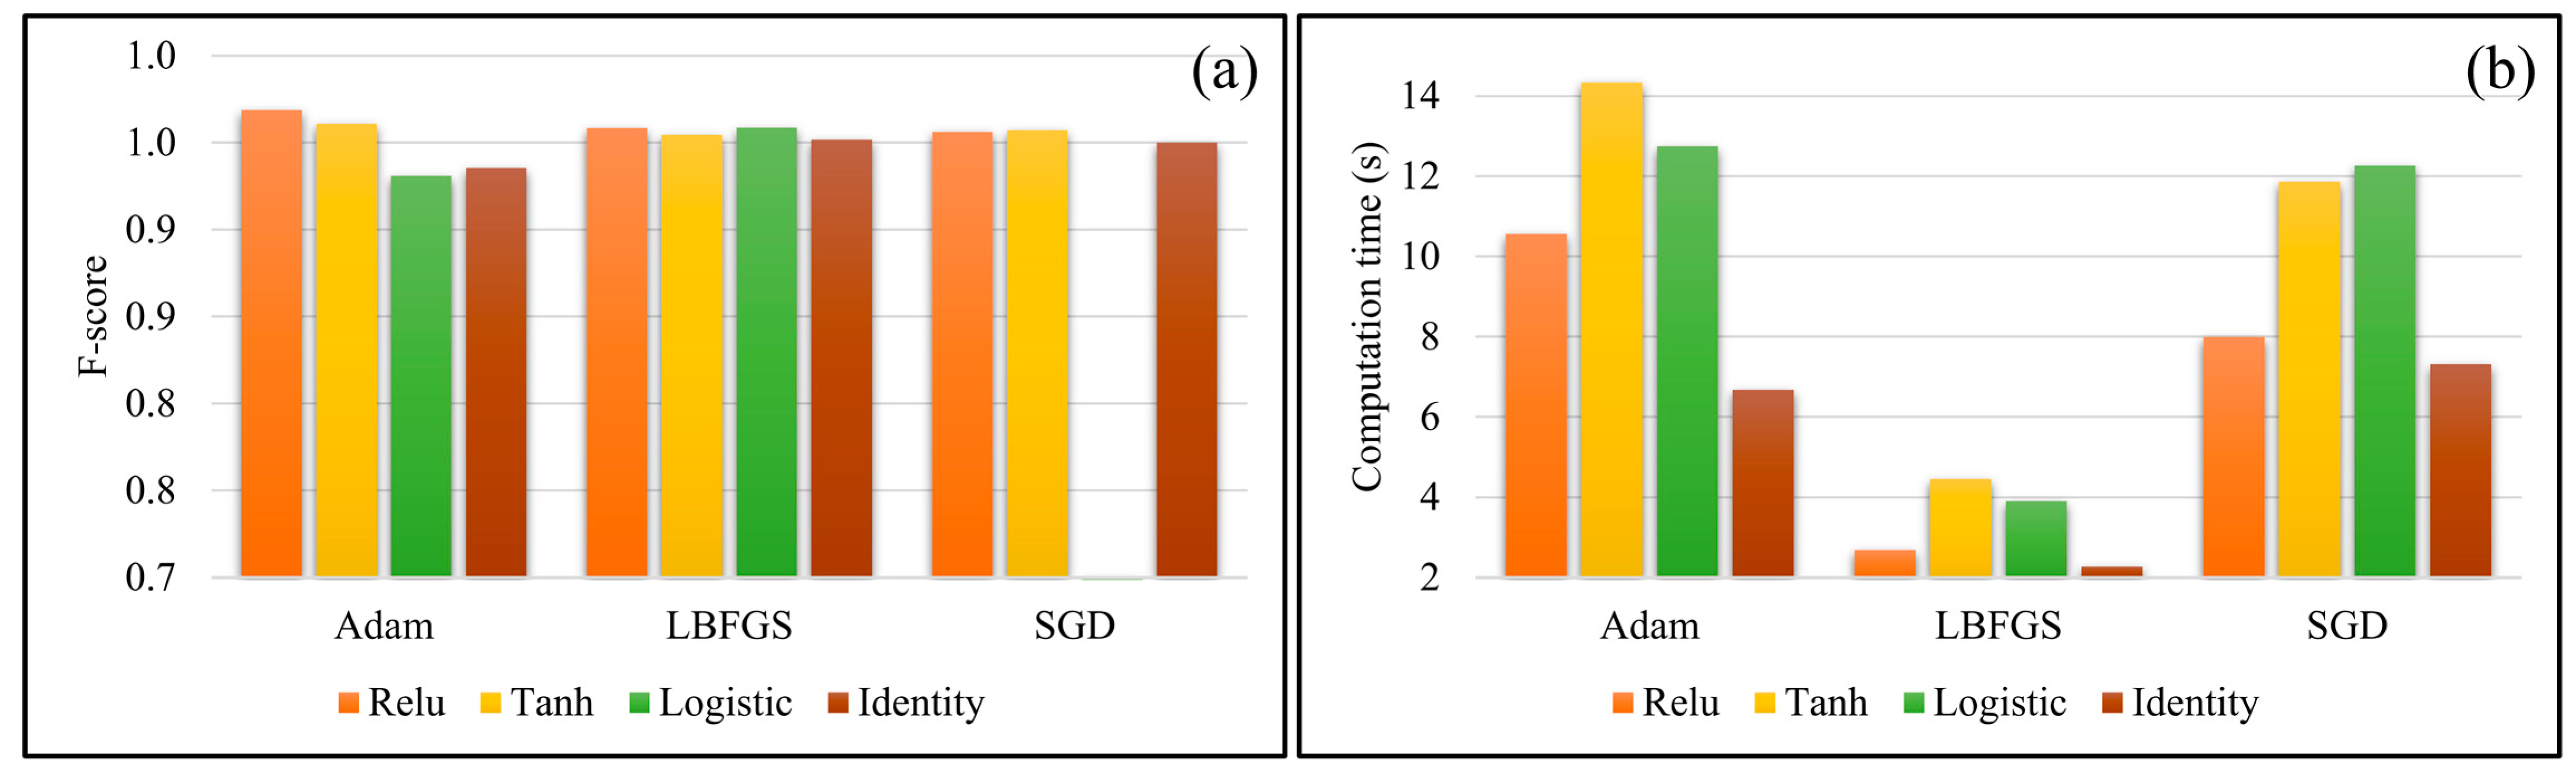
4.2. Activation Function
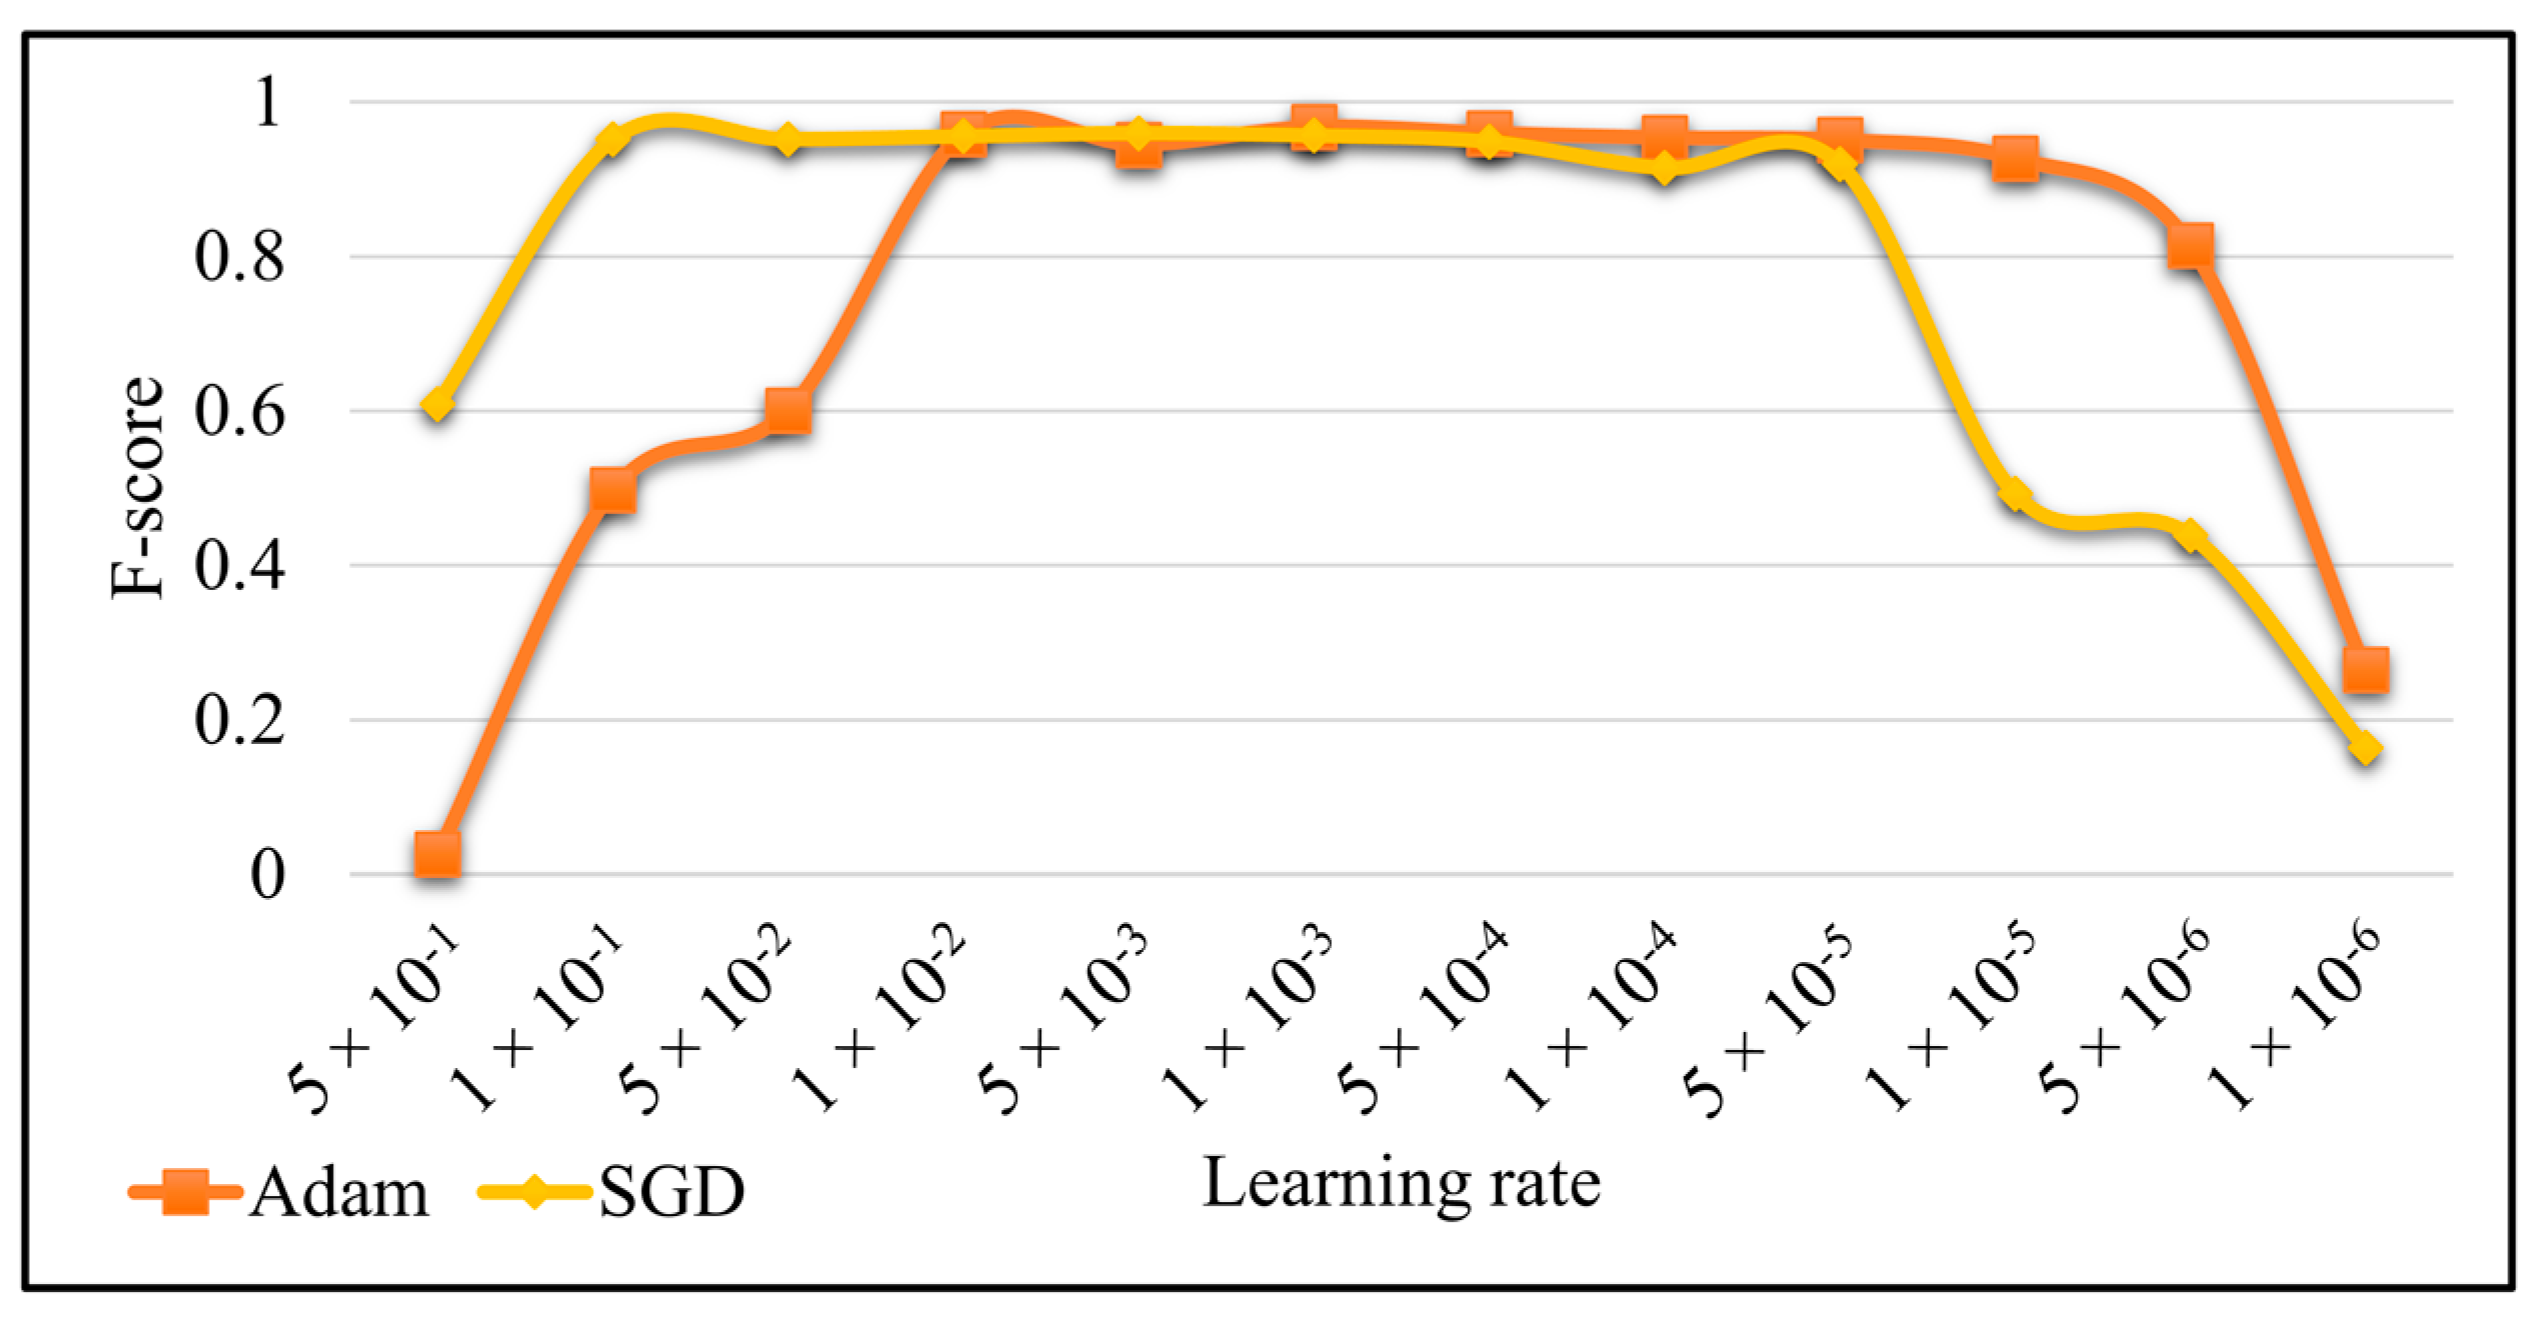
4.3. Learning Rate
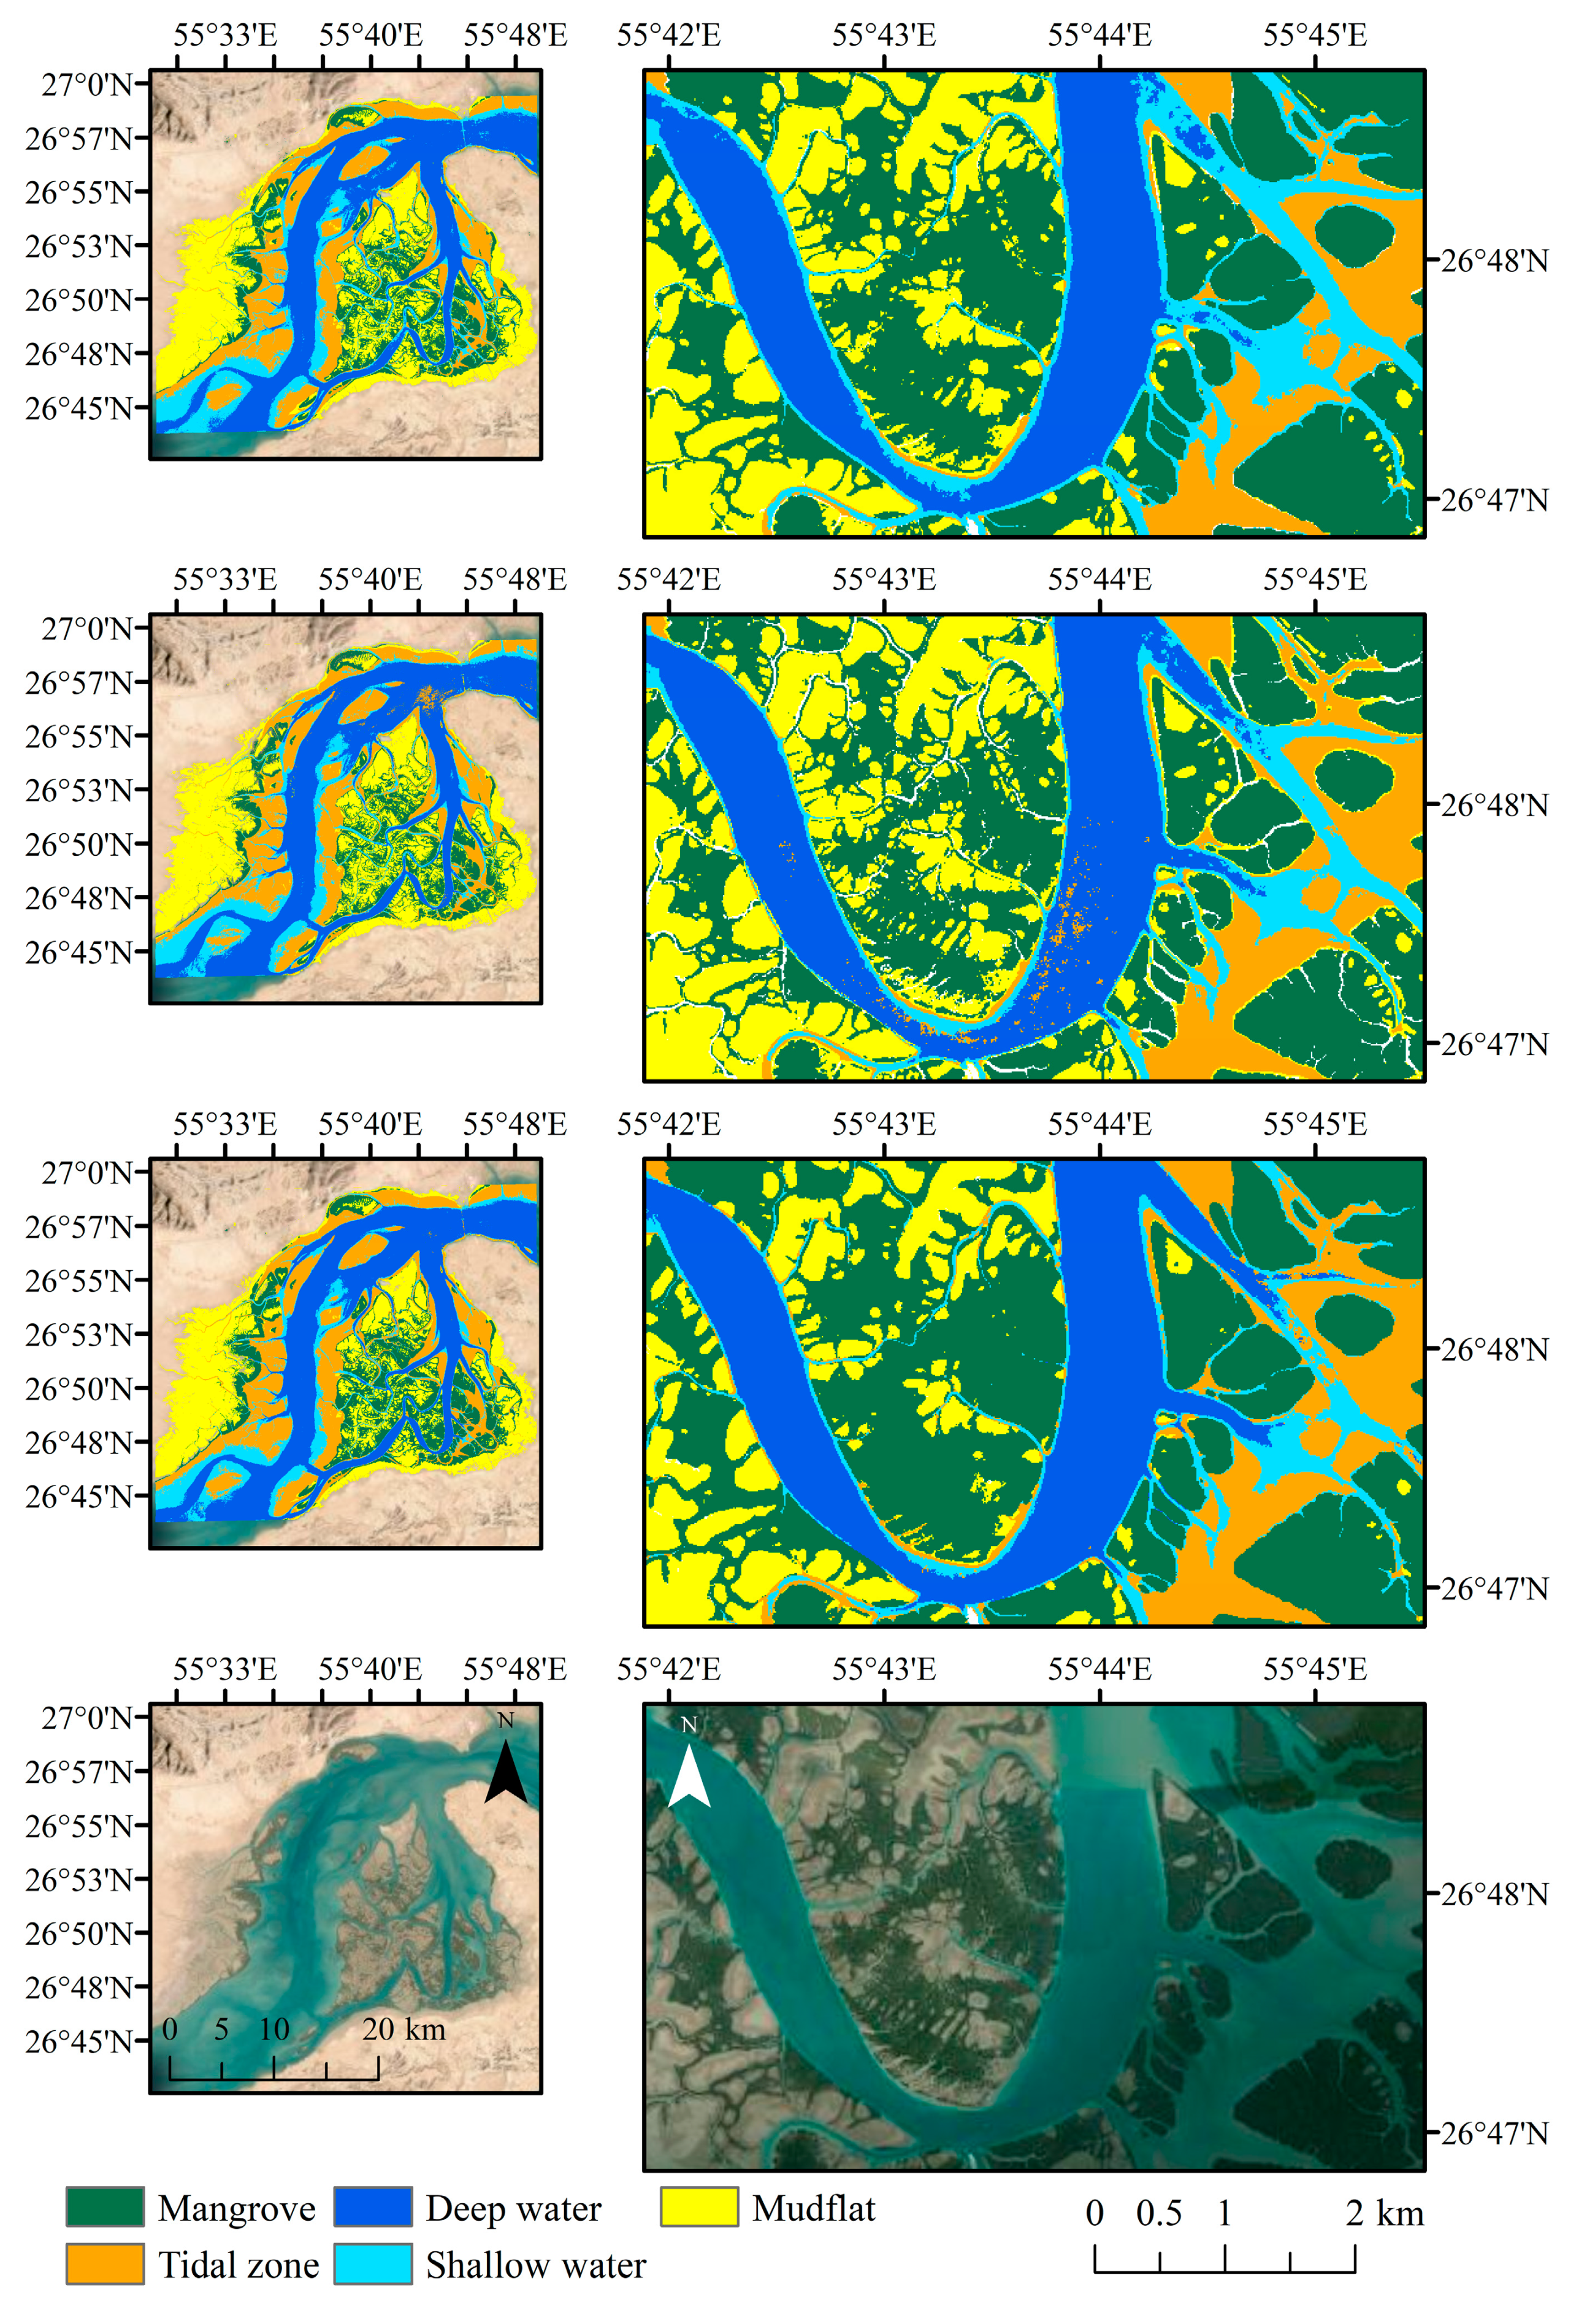
4.4. Mangrove Ecosystem Maps
5. Discussion
5.1. General Remarks
5.2. Impact of Data Standardization
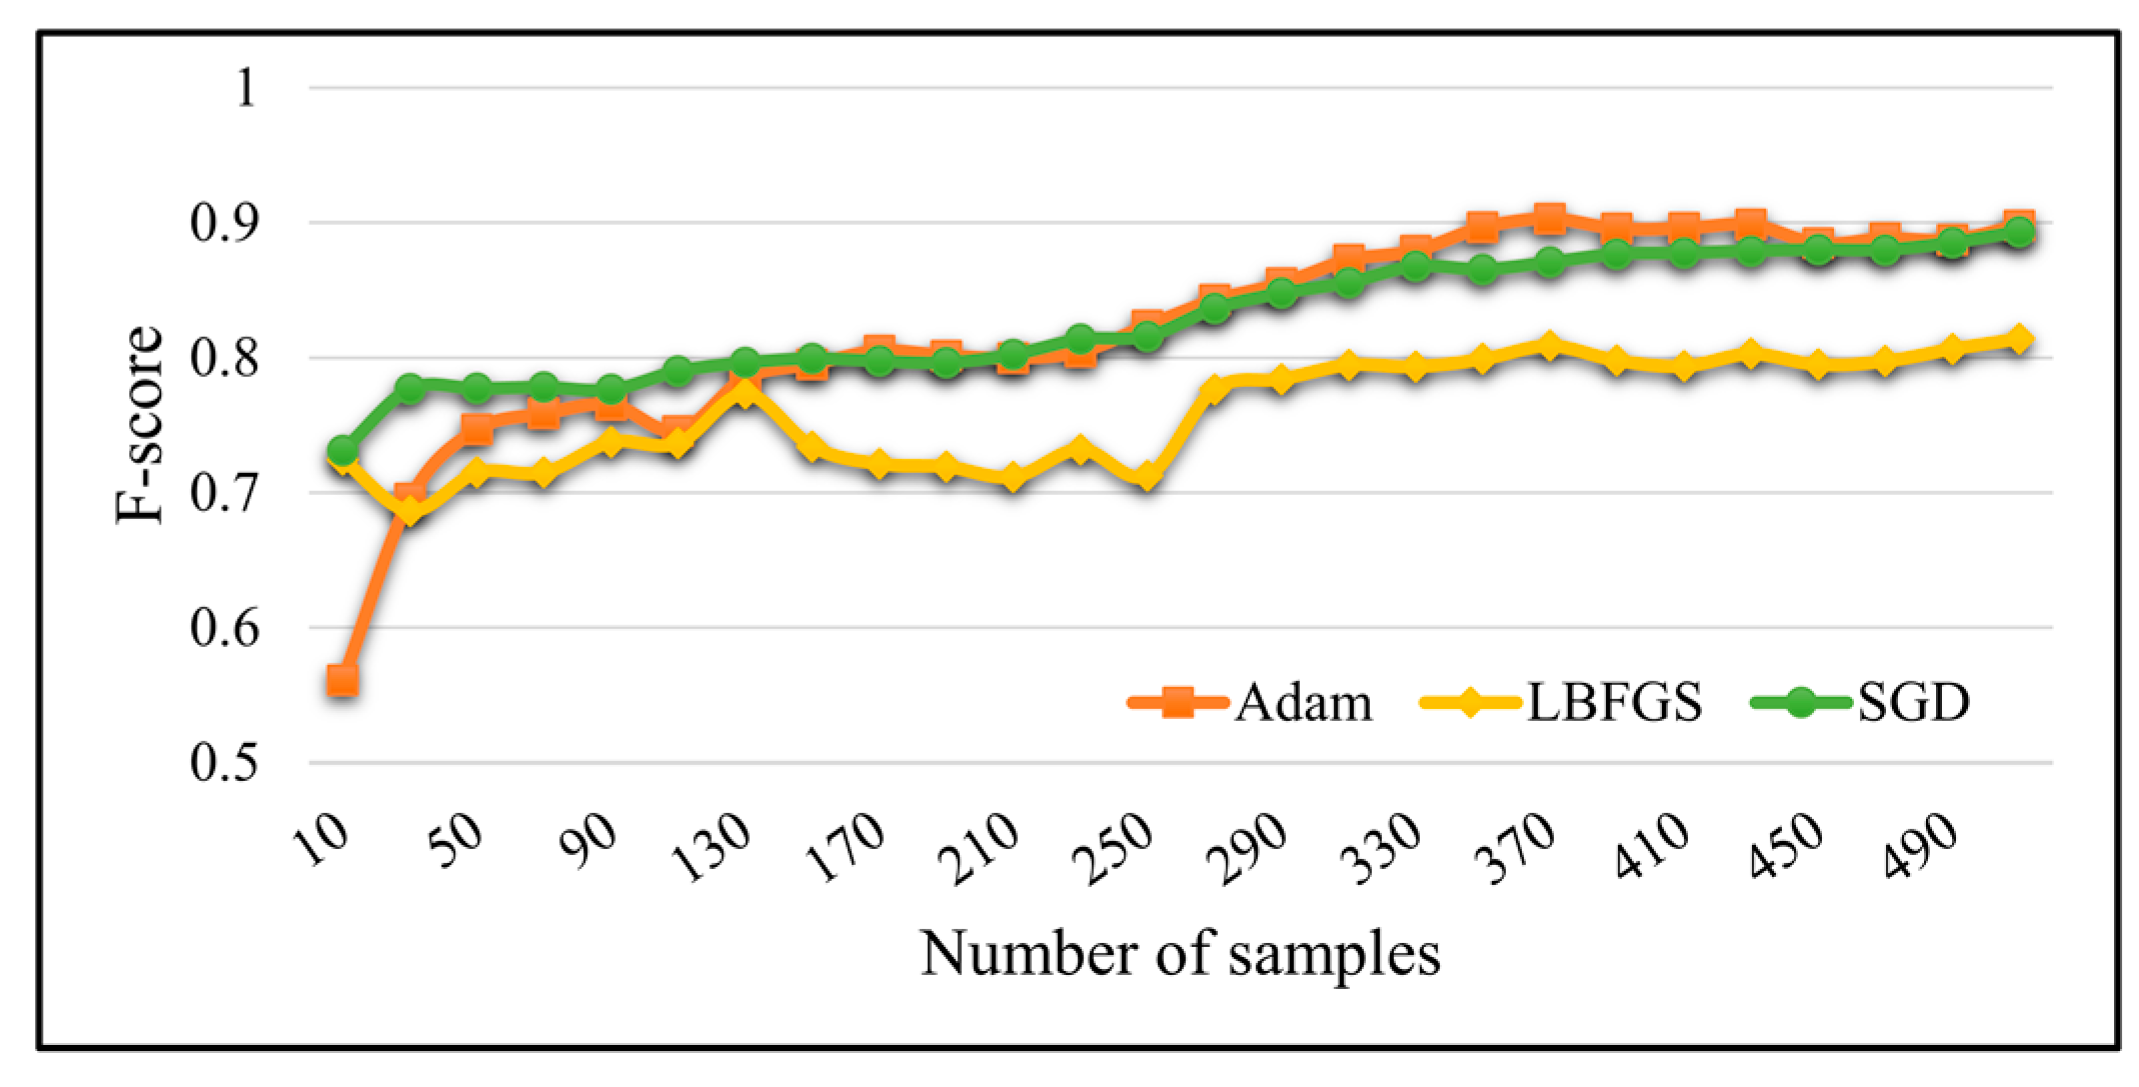
5.3. Impact of Limited Training Samples
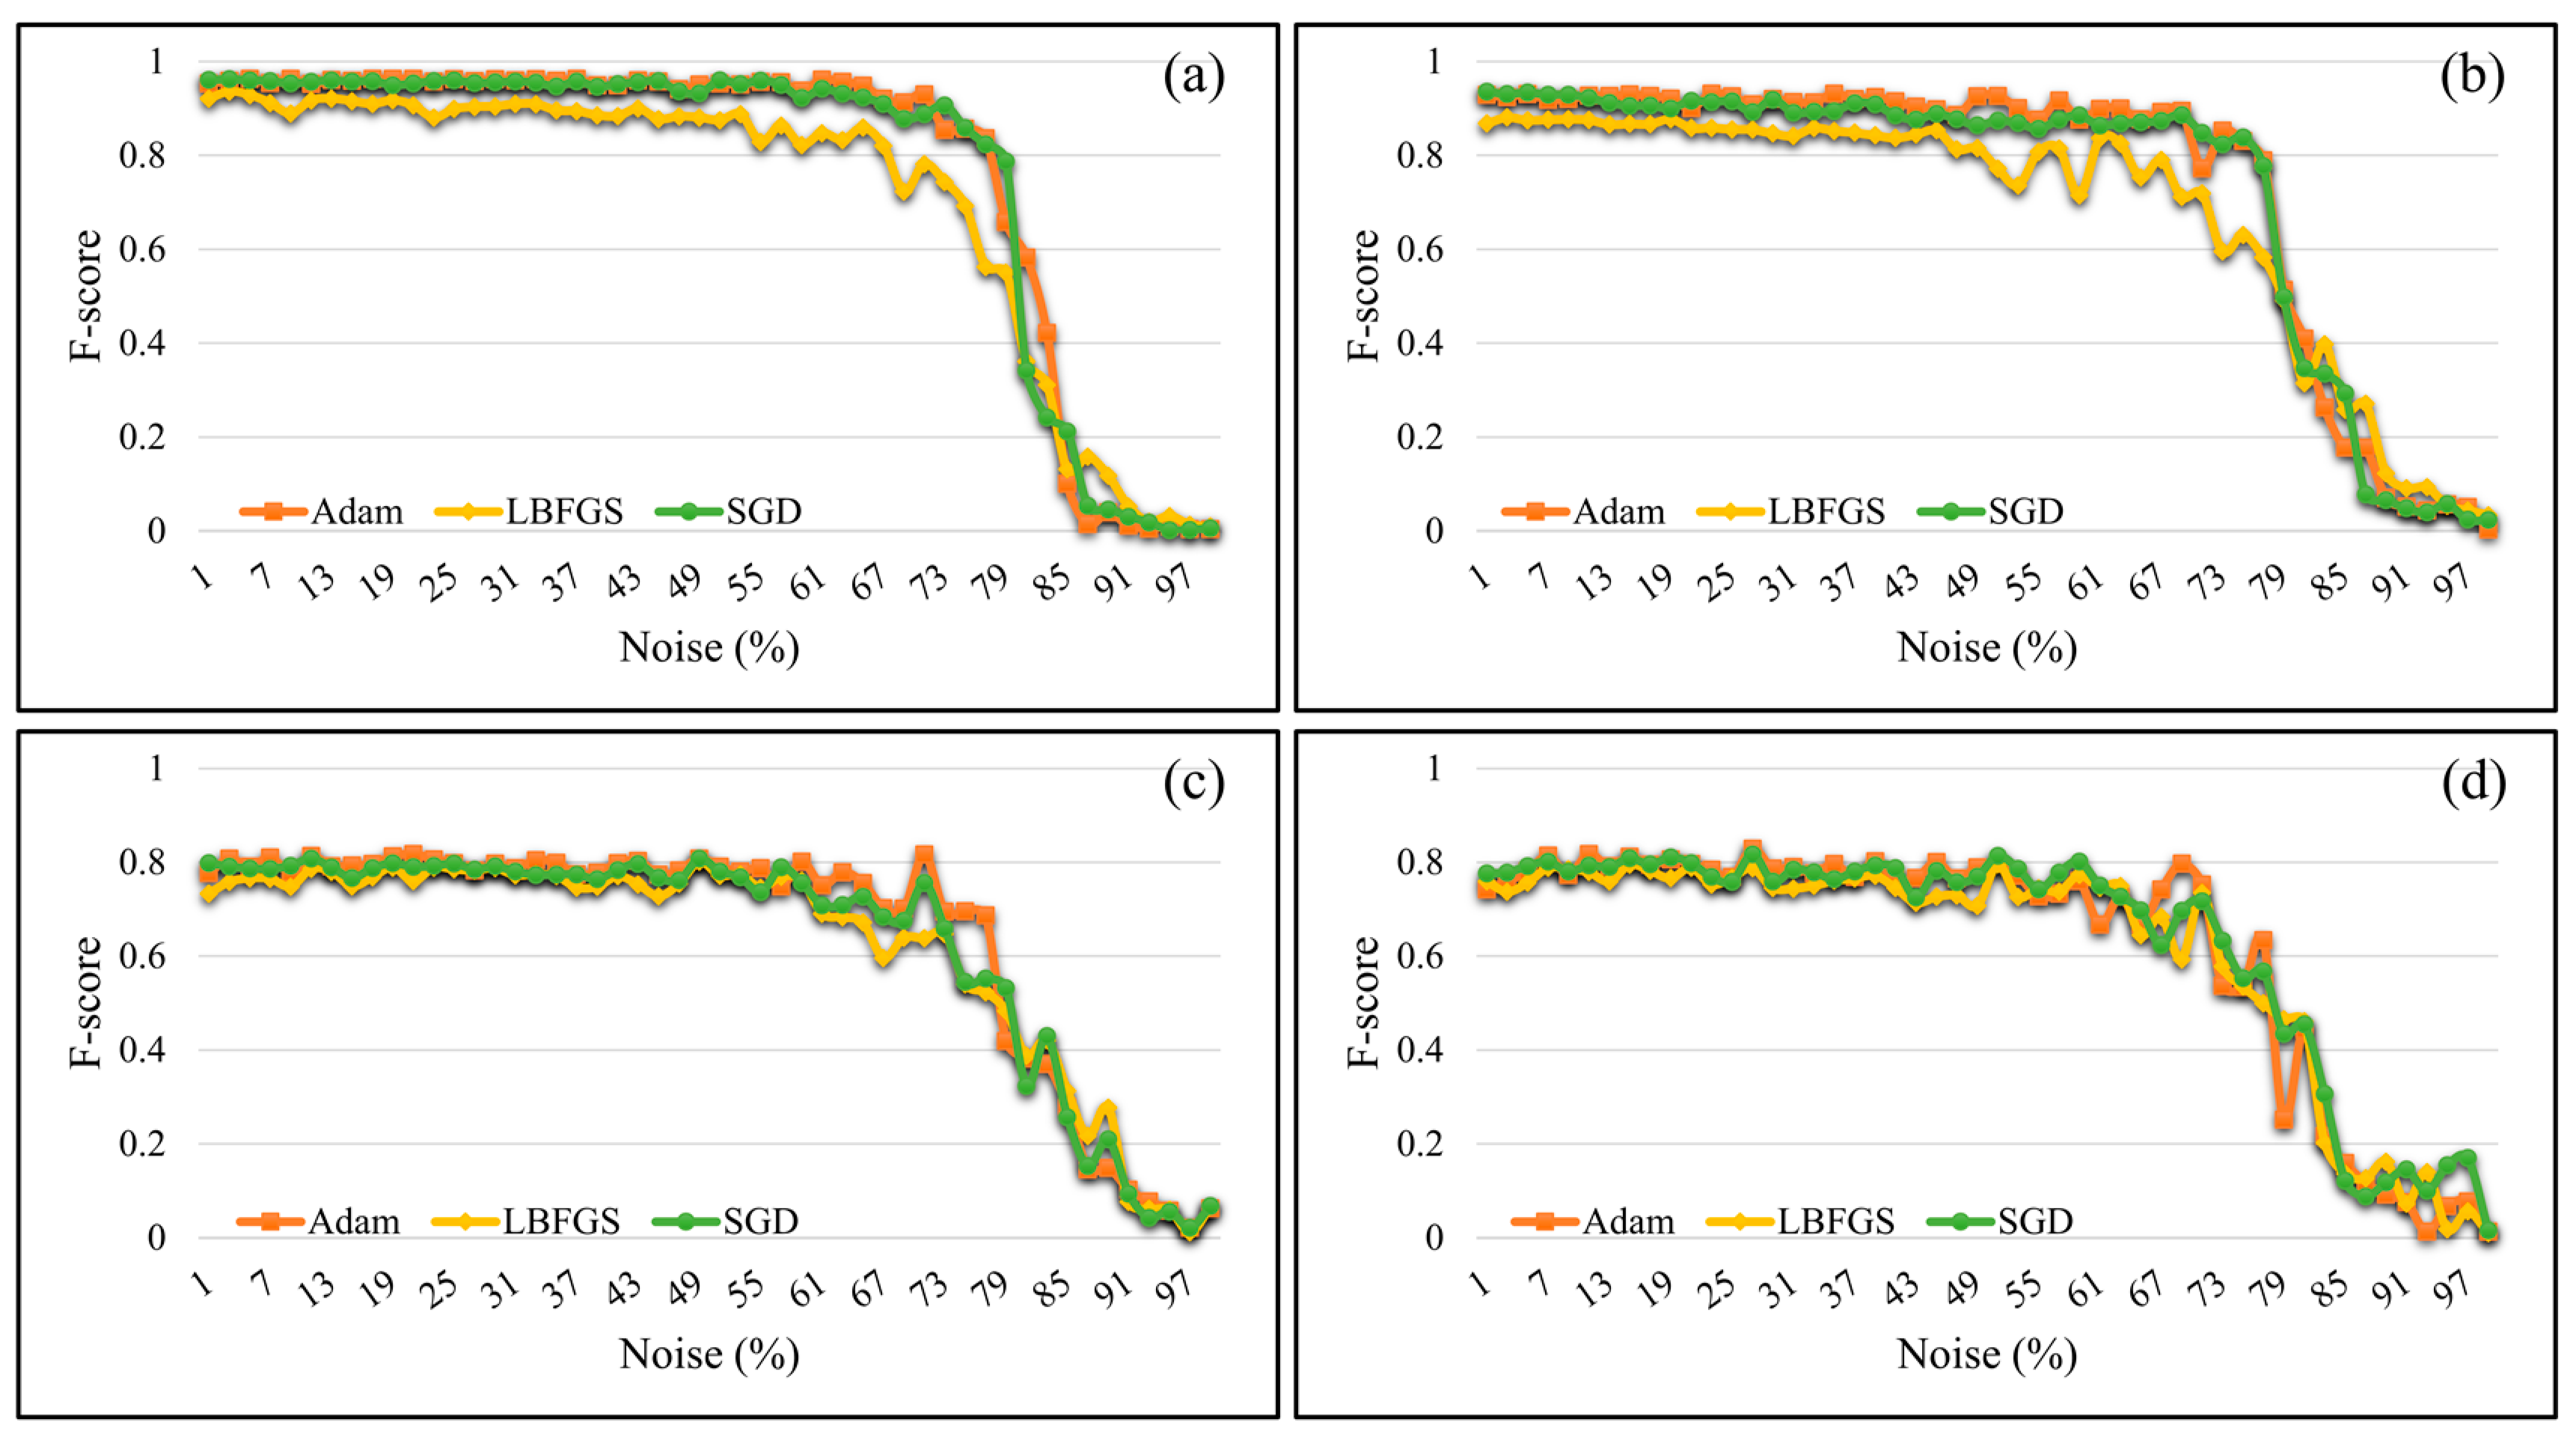
5.4. Impact of Noise Labels
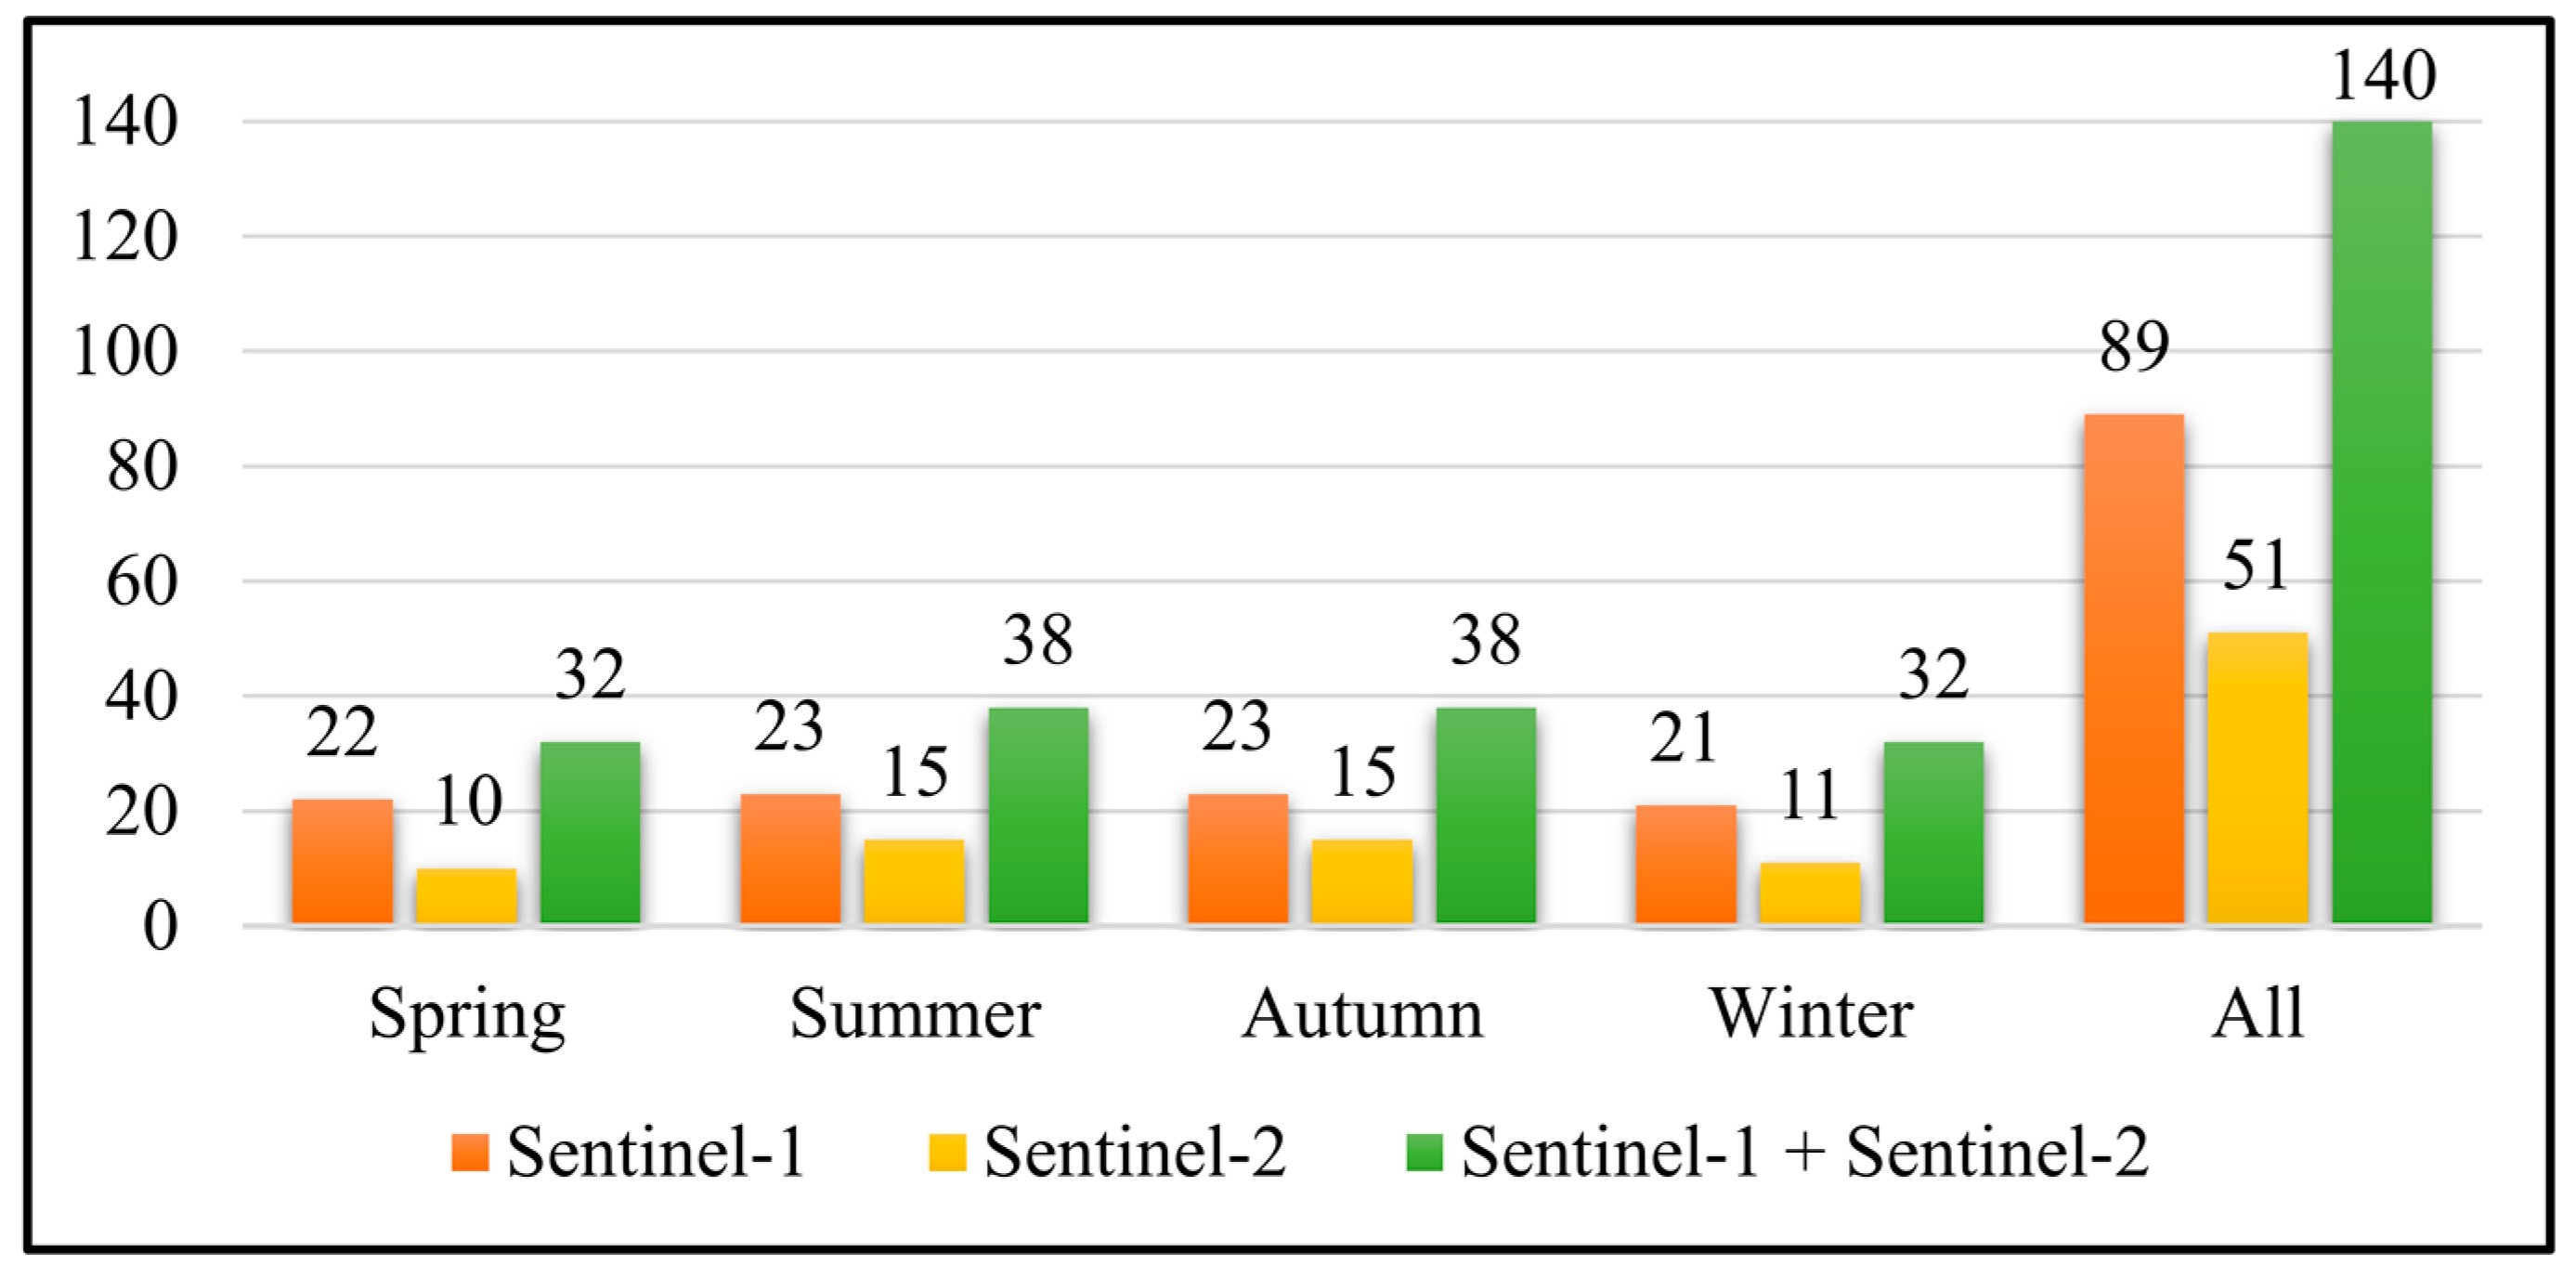
5.5. Contribution of Multi-Temporal and Multi-Source Images
6. Conclusions
Author Contributions
Funding
Data Availability Statement
Acknowledgments
Conflicts of Interest
References
- Lee, W.K.; Tay, S.H.X.; Ooi, S.K.; Friess, D.A. Potential short wave attenuation function of disturbed mangroves. Estuar. Coast. Shelf Sci. 2021, 248, 106747. [Google Scholar] [CrossRef]
- Maria, M.; Losada, I.J. Predicting the evolution of coastal protection service with mangrove forest age. Coast. Eng. 2021, 168, 103922. [Google Scholar]
- Kandasamy, K.; Rajendran, N.; Balakrishnan, B.; Thiruganasambandam, R.; Narayanasamy, R. Carbon sequestration and storage in planted mangrove stands of Avicennia marina. Reg. Stud. Mar. Sci. 2021, 43, 101701. [Google Scholar] [CrossRef]
- Rovai, A.S.; Coelho-Jr, C.; de Almeida, R.; Cunha-Lignon, M.; Menghini, R.P.; Twilley, R.R.; Cintrón-Molero, G.; Schaeffer-Novelli, Y. Ecosystem-level carbon stocks and sequestration rates in mangroves in the Cananéia-Iguape lagoon estuarine system, southeastern Brazil. For. Ecol. Manag. 2021, 479, 118553. [Google Scholar] [CrossRef]
- Sundaramanickam, A.; Nithin, A.; Balasubramanian, T. Role of Mangroves in Pollution Abatement. In Mangroves: Ecology, Biodiversity and Management; Springer: Berlin, Germany, 2021; pp. 257–278. [Google Scholar]
- Mafi Gholami, D.; Baharlouii, M. Monitoring long-term mangrove shoreline changes along the northern coasts of the Persian Gulf and the Oman Sea. Emerg. Sci. J. 2019, 3, 88–100. [Google Scholar] [CrossRef] [Green Version]
- Thatoi, H.; Samantaray, D.; Das, S.K. The genus Avicennia, a pioneer group of dominant mangrove plant species with potential medicinal values: A review. Front. Life Sci. 2016, 9, 267–291. [Google Scholar] [CrossRef] [Green Version]
- Baishya, S.; Banik, S.K.; Choudhury, M.D.; Talukdar, D.D.; Talukdar, A.D. Therapeutic Potentials of Littoral Vegetation: An Antifungal Perspective. In Biotechnological Utilization of Mangrove Resources; Elsevier: Amsterdam, The Netherlands, 2020; pp. 275–292. [Google Scholar]
- Rahman, K.-S.; Islam, M.N.; Ahmed, M.U.; Bosma, R.H.; Debrot, A.O.; Ahsan, M.N. Selection of mangrove species for shrimp based silvo-aquaculture in the coastal areas of Bangladesh. J. Coast. Conserv. 2020, 24, 59. [Google Scholar] [CrossRef]
- Seary, R.; Spencer, T.; Bithell, M.; McOwen, C. Measuring mangrove-fishery benefits in the Peam Krasaop Fishing Community, Cambodia. Estuar. Coast. Shelf Sci. 2021, 248, 106918. [Google Scholar] [CrossRef]
- Eddy, S.; Milantara, N.; Sasmito, S.D.; Kajita, T.; Basyuni, M. Anthropogenic drivers of mangrove loss and associated carbon emissions in South Sumatra, Indonesia. Forests 2021, 12, 187. [Google Scholar] [CrossRef]
- Goldberg, L.; Lagomasino, D.; Thomas, N.; Fatoyinbo, T. Global declines in human-driven mangrove loss. Glob. Chang. Biol. 2020, 26, 5844–5855. [Google Scholar] [CrossRef]
- Sippo, J.Z.; Lovelock, C.E.; Santos, I.R.; Sanders, C.J.; Maher, D.T. Mangrove mortality in a changing climate: An overview. Estuar. Coast. Shelf Sci. 2018, 215, 241–249. [Google Scholar] [CrossRef]
- Polidoro, B.A.; Carpenter, K.E.; Collins, L.; Duke, N.C.; Ellison, A.M.; Ellison, J.C.; Farnsworth, E.J.; Fernando, E.S.; Kathiresan, K.; Koedam, N.E.; et al. The loss of species: Mangrove extinction risk and geographic areas of global concern. PLoS ONE 2010, 5, e10095. [Google Scholar] [CrossRef]
- Sathish, C.; Dayaram, N.A.; Bharti, V.S.; Jaiswar, A.K.; Deshmukhe, G. Estimation of extent of the mangrove defoliation caused by insect Hyblaea puera (Cramer, 1777) around Dharamtar creek, India using Sentinel 2 images. Reg. Stud. Mar. Sci. 2021, 48, 102054. [Google Scholar] [CrossRef]
- Belenok, V.; Noszczyk, T.; Hebryn-Baidy, L.; Kryachok, S. Investigating anthropogenically transformed landscapes with remote sensing. Remote Sens. Appl. Soc. Environ. 2021, 24, 100635. [Google Scholar] [CrossRef]
- Maurya, K.; Mahajan, S.; Chaube, N. Remote sensing techniques: Mapping and monitoring of mangrove ecosystem—A review. Complex Intell. Syst. 2021, 7, 2797–2818. [Google Scholar] [CrossRef]
- Pham, T.D.; Xia, J.; Ha, N.T.; Bui, D.T.; Le, N.N.; Tekeuchi, W. A review of remote sensing approaches for monitoring blue carbon ecosystems: Mangroves, seagrassesand salt marshes during 2010–2018. Sensors 2019, 19, 1933. [Google Scholar] [CrossRef] [PubMed] [Green Version]
- Thakur, S.; Mondal, I.; Ghosh, P.B.; Das, P.; De, T.K. A review of the application of multispectral remote sensing in the study of mangrove ecosystems with special emphasis on image processing techniques. Spat. Inf. Res. 2020, 28, 39–51. [Google Scholar] [CrossRef]
- Amani, M.; Mahdavi, S.; Kakooei, M.; Ghorbanian, A.; Brisco, B.; Delancey, E.; Toure, S.; Reyes, E.L. Wetland Change Analysis in Alberta, Canada using Four Decades of Landsat Imagery. IEEE J. Sel. Top. Appl. Earth Obs. Remote Sens. 2021, 14, 10314–10335. [Google Scholar] [CrossRef]
- Zhao, C.; Qin, C.-Z. 10-m-resolution mangrove maps of China derived from multi-source and multi-temporal satellite observations. ISPRS J. Photogramm. Remote Sens. 2020, 169, 389–405. [Google Scholar] [CrossRef]
- Wang, L.; Jia, M.; Yin, D.; Tian, J. A review of remote sensing for mangrove forests: 1956–2018. Remote Sens. Environ. 2019, 231, 111223. [Google Scholar] [CrossRef]
- Hati, J.P.; Samanta, S.; Chaube, N.R.; Misra, A.; Giri, S.; Pramanick, N.; Gupta, K.; Majumdar, S.D.; Chanda, A.; Mukhopadhyay, A.; et al. Mangrove classification using airborne hyperspectral AVIRIS-NG and comparing with other spaceborne hyperspectral and multispectral data. Egypt. J. Remote Sens. Space Sci. 2021, 24, 273–281. [Google Scholar]
- Purwanto, A.D.; Asriningrum, W. Identification of mangrove forests using multispectral satellite imageries. Int. J. Remote Sens. Earth Sci. 2019, 16, 63–86. [Google Scholar] [CrossRef]
- Li, Q.; Wong, F.K.K.; Fung, T. Mapping multi-layered mangroves from multispectral, hyperspectral, and LiDAR data. Remote Sens. Environ. 2021, 258, 112403. [Google Scholar] [CrossRef]
- Abdel-Hamid, A.; Dubovyk, O.; El-Magd, A.; Menz, G. Mapping mangroves extents on the Red Sea coastline in Egypt using polarimetric SAR and high resolution optical remote sensing data. Sustainability 2018, 10, 646. [Google Scholar] [CrossRef] [Green Version]
- Chen, N. Mapping mangrove in Dongzhaigang, China using Sentinel-2 imagery. J. Appl. Remote Sens. 2020, 14, 14508. [Google Scholar] [CrossRef]
- Osei Darko, P.; Kalacska, M.; Arroyo-Mora, J.P.; Fagan, M.E. Spectral Complexity of Hyperspectral Images: A New Approach for Mangrove Classification. Remote Sens. 2021, 13, 2604. [Google Scholar] [CrossRef]
- Ashiagbor, G.; Asante, W.A.; Quaye-Ballard, J.A.; Forkuo, E.K.; Acheampong, E.; Foli, E. Mangrove mapping using Sentinel-1 data for improved decision support on sustainable conservation and restoration interventions in the Keta Lagoon Complex Ramsar Site, Ghana. Mar. Freshw. Res. 2021, 72, 1588–1601. [Google Scholar] [CrossRef]
- Bindu, G.; Rajan, P.; Jishnu, E.S.; Joseph, K.A. Carbon stock assessment of mangroves using remote sensing and geographic information system. Egypt. J. Remote Sens. Sp. Sci. 2020, 23, 1–9. [Google Scholar] [CrossRef]
- Komiyama, A.; Poungparn, S.; Kato, S. Common allometric equations for estimating the tree weight of mangroves. J. Trop. Ecol. 2005, 21, 471–477. [Google Scholar] [CrossRef]
- Hu, T.; Zhang, Y.; Su, Y.; Zheng, Y.; Lin, G.; Guo, Q. Mapping the global mangrove forest aboveground biomass using multisource remote sensing data. Remote Sens. 2020, 12, 1690. [Google Scholar] [CrossRef]
- Lucas, R.; Van De Kerchove, R.; Otero, V.; Lagomasino, D.; Fatoyinbo, L.; Omar, H.; Satyanarayana, B.; Dahdouh-Guebas, F. Structural characterisation of mangrove forests achieved through combining multiple sources of remote sensing data. Remote Sens. Environ. 2020, 237, 111543. [Google Scholar] [CrossRef]
- Halder, S.; Samanta, K.; Das, S.; Pathak, D. Monitoring the inter-decade spatial--temporal dynamics of the Sundarban mangrove forest of India from 1990 to 2019. Reg. Stud. Mar. Sci. 2021, 44, 101718. [Google Scholar] [CrossRef]
- Parida, B.R.; Kumar, P. Mapping and dynamic analysis of mangrove forest during 2009–2019 using landsat-5 and sentinel-2 satellite data along Odisha Coast. Trop. Ecol. 2020, 61, 538–549. [Google Scholar] [CrossRef]
- Elmahdy, S.I.; Ali, T.A.; Mohamed, M.M.; Howari, F.M.; Abouleish, M.; Simonet, D. Spatiotemporal Mapping and Monitoring of Mangrove Forests Changes From 1990 to 2019 in the Northern Emirates, UAE Using Random Forest, Kernel Logistic Regression and Naive Bayes Tree Models. Front. Environ. Sci. 2020, 8, 102. [Google Scholar] [CrossRef]
- Behera, M.D.; Barnwal, S.; Paramanik, S.; Das, P.; Bhattyacharya, B.K.; Jagadish, B.; Roy, P.S.; Ghosh, S.M.; Behera, S.K. Species-Level Classification and Mapping of a Mangrove Forest Using Random Forest—Utilisation of AVIRIS-NG and Sentinel Data. Remote Sens. 2021, 13, 2027. [Google Scholar] [CrossRef]
- Kamal, M.; Phinn, S.; Johansen, K. Object-based approach for multi-scale mangrove composition mapping using multi-resolution image datasets. Remote Sens. 2015, 7, 4753–4783. [Google Scholar] [CrossRef] [Green Version]
- Mondal, P.; Liu, X.; Fatoyinbo, T.E.; Lagomasino, D. Evaluating combinations of sentinel-2 data and machine-learning algorithms for mangrove mapping in West Africa. Remote Sens. 2019, 11, 2928. [Google Scholar] [CrossRef] [Green Version]
- Maung, W.S.; Sasaki, J. Assessing the Natural Recovery of Mangroves after Human Disturbance Using Neural Network Classification and Sentinel-2 Imagery in Wunbaik Mangrove Forest, Myanmar. Remote Sens. 2021, 13, 52. [Google Scholar] [CrossRef]
- Zhang, X.; Treitz, P.M.; Chen, D.; Quan, C.; Shi, L.; Li, X. Mapping mangrove forests using multi-tidal remotely-sensed data and a decision-tree-based procedure. Int. J. Appl. Earth Obs. Geoinf. 2017, 62, 201–214. [Google Scholar] [CrossRef]
- Toosi, N.B.; Soffianian, A.R.; Fakheran, S.; Pourmanafi, S.; Ginzler, C.; Waser, L.T. Comparing different classification algorithms for monitoring mangrove cover changes in southern Iran. Glob. Ecol. Conserv. 2019, 19, e00662. [Google Scholar] [CrossRef]
- Held, A.; Ticehurst, C.; Lymburner, L.; Williams, N. High resolution mapping of tropical mangrove ecosystems using hyperspectral and radar remote sensing. Int. J. Remote Sens. 2003, 24, 2739–2759. [Google Scholar] [CrossRef]
- Xia, J.; Yokoya, N.; Pham, T.D. Probabilistic mangrove species mapping with multiple-source remote-sensing datasets using label distribution learning in Xuan Thuy National Park, Vietnam. Remote Sens. 2020, 12, 3834. [Google Scholar] [CrossRef]
- Zhang, H.; Wang, T.; Liu, M.; Jia, M.; Lin, H.; Chu, L.M.; Devlin, A.T. Potential of combining optical and dual polarimetric SAR data for improving mangrove species discrimination using rotation forest. Remote Sens. 2018, 10, 467. [Google Scholar] [CrossRef] [Green Version]
- Ghorbanian, A.; Zaghian, S.; Asiyabi, R.M.; Amani, M.; Mohammadzadeh, A.; Jamali, S. Mangrove Ecosystem Mapping Using Sentinel-1 and Sentinel-2 Satellite Images and Random Forest Algorithm in Google Earth Engine. Remote Sens. 2021, 13, 2565. [Google Scholar] [CrossRef]
- Guo, M.; Yu, Z.; Xu, Y.; Huang, Y.; Li, C. ME-Net: A Deep Convolutional Neural Network for Extracting Mangrove Using Sentinel-2A Data. Remote Sens. 2021, 13, 1292. [Google Scholar] [CrossRef]
- Wan, L.; Zhang, H.; Lin, G.; Lin, H. A small-patched convolutional neural network for mangrove mapping at species level using high-resolution remote-sensing image. Ann. GIS 2019, 25, 45–55. [Google Scholar] [CrossRef]
- Wang, L.; Silván-Cárdenas, J.L.; Sousa, W.P. Neural network classification of mangrove species from multi-seasonal Ikonos imagery. Photogramm. Eng. Remote Sens. 2008, 74, 921–927. [Google Scholar] [CrossRef] [Green Version]
- Alireza, S.M.; Mansour, J.B. Satellite based assessment of the area and changes in the Mangrove ecosystem of the QESHM Island, Iran. J. Environ. Res. Dev. 2012, 7, 1052–1060. [Google Scholar]
- Sharifi, N.; Danehkar, A.; Robati, M.; Khorasani, N.A.; Rajaee, T. Developing decision algorithm for determination of protection zones in protected areas (case study: Hara Protected Area). Int. J. Environ. Sci. Technol. 2021, 18, 2237–2250. [Google Scholar] [CrossRef]
- Ghasemi, S.; Moghaddam, S.S.; Rahimi, A.; Damalas, C.A.; Naji, A. Phytomanagement of trace metals in mangrove sediments of Hormozgan, Iran, using gray mangrove (Avicennia marina). Environ. Sci. Pollut. Res. 2018, 25, 28195–28205. [Google Scholar] [CrossRef]
- Vahidi, F.; Fatemi, S.M.R.; Danehkar, A.; Moradi, A.M.; Nadushan, R.M. Patterns of mollusks (Bivalvia and Gastropoda) distribution in three different zones of Harra Biosphere Reserve, the Persian Gulf, Iran. Iran. J. Fish. Sci. 2021, 20, 1336–1353. [Google Scholar]
- Hajializadeh, P.; Safaie, M.; Naderloo, R.; Shojaei, M.G.; Gammal, J.; Villnäs, A.; Norkko, A. Species composition and functional traits of macrofauna in different mangrove habitats in the Persian gulf. Front. Mar. Sci. 2020, 7, 809. [Google Scholar] [CrossRef]
- Dadashi, M.; Ghaffari, S.; Bakhtiari, A.R.; Tauler, R. Multivariate curve resolution of organic pollution patterns in mangrove forest sediment from Qeshm Island and Khamir Port—Persian Gulf, Iran. Environ. Sci. Pollut. Res. 2018, 25, 723–735. [Google Scholar] [CrossRef] [PubMed]
- Zarezadeh, R.; Rezaee, P.; Lak, R.; Masoodi, M.; Ghorbani, M. Distribution and accumulation of heavy metals in sediments of the northern part of mangrove in Hara Biosphere Reserve, Qeshm Island (Persian Gulf). Soil Water Res. 2017, 12, 86–95. [Google Scholar] [CrossRef] [Green Version]
- Kazemi, A.; Bakhtiari, A.R.; Kheirabadi, N.; Barani, H.; Haidari, B. Distribution patterns of metals contamination in sediments based on type regional development on the intertidal coastal zones of the Persian Gulf, Iran. Bull. Environ. Contam. Toxicol. 2012, 88, 100–103. [Google Scholar] [CrossRef]
- Bunting, P.; Rosenqvist, A.; Lucas, R.M.; Rebelo, L.-M.; Hilarides, L.; Thomas, N.; Hardy, A.; Itoh, T.; Shimada, M.; Finlayson, C.M. The global mangrove watch—A new 2010 global baseline of mangrove extent. Remote Sens. 2018, 10, 1669. [Google Scholar] [CrossRef] [Green Version]
- Murray, N.J.; Phinn, S.R.; DeWitt, M.; Ferrari, R.; Johnston, R.; Lyons, M.B.; Clinton, N.; Thau, D.; Fuller, R.A. The global distribution and trajectory of tidal flats. Nature 2019, 565, 222–225. [Google Scholar] [CrossRef] [PubMed]
- Lohr, S.L. Sampling: Design and Analysis; CRC Press: Bocaton, FL, USA, 2019. [Google Scholar]
- Geiß, C.; Pelizari, P.A.; Schrade, H.; Brenning, A.; Taubenböck, H. On the effect of spatially non-disjoint training and test samples on estimated model generalization capabilities in supervised classification with spatial features. IEEE Geosci. Remote Sens. Lett. 2017, 14, 2008–2012. [Google Scholar]
- Sentinel Overview. Available online: https://sentinels.copernicus.eu/web/sentinel/missions (accessed on 31 October 2021).
- Gorelick, N.; Hancher, M.; Dixon, M.; Ilyushchenko, S.; Thau, D.; Moore, R. Google Earth Engine: Planetary-scale geospatial analysis for everyone. Remote Sens. Environ. 2017, 202, 18–27. [Google Scholar] [CrossRef]
- Amani, M.; Ghorbanian, A.; Ahmadi, S.A.; Kakooei, M.; Moghimi, A.; Mirmazloumi, S.M.; Moghaddam, S.H.A.; Mahdavi, S.; Ghahremanloo, M.; Parsian, S.; et al. Google Earth Engine Cloud Computing Platform for Remote Sensing Big Data Applications: A Comprehensive Review. IEEE J. Sel. Top. Appl. Earth Obs. Remote Sens. 2020, 13, 5326–5350. [Google Scholar] [CrossRef]
- Mahdavi, S.; Salehi, B.; Amani, M.; Granger, J.; Brisco, B.; Huang, W. A dynamic classification scheme for mapping spectrally similar classes: Application to wetland classification. Int. J. Appl. Earth Obs. Geoinf. 2019, 83, 101914. [Google Scholar] [CrossRef]
- Fekri, E.; Latifi, H.; Amani, M.; Zobeidinezhad, A. A Training Sample Migration Method for Wetland Mapping and Monitoring Using Sentinel Data in Google Earth Engine. Remote Sens. 2021, 13, 4169. [Google Scholar] [CrossRef]
- He, Y.; Dong, J.; Liao, X.; Sun, L.; Wang, Z.; You, N.; Li, Z.; Fu, P. Examining rice distribution and cropping intensity in a mixed single-and double-cropping region in South China using all available Sentinel 1/2 images. Int. J. Appl. Earth Obs. Geoinf. 2021, 101, 102351. [Google Scholar] [CrossRef]
- Ghorbanian, A.; Kakooei, M.; Amani, M.; Mahdavi, S.; Mohammadzadeh, A.; Hasanlou, M. Improved land cover map of Iran using Sentinel imagery within Google Earth Engine and a novel automatic workflow for land cover classification using migrated training samples. ISPRS J. Photogramm. Remote Sens. 2020, 167, 276–288. [Google Scholar] [CrossRef]
- Torres, R.; Snoeij, P.; Geudtner, D.; Bibby, D.; Davidson, M.; Attema, E.; Potin, P.; Rommen, B.; Floury, N.; Brown, M.; et al. GMES Sentinel-1 mission. Remote Sens. Environ. 2012, 120, 9–24. [Google Scholar] [CrossRef]
- Liu, X.; Fatoyinbo, T.E.; Thomas, N.M.; Guan, W.W.; Zhan, Y.; Mondal, P.; Lagomasino, D.; Simard, M.; Trettin, C.C.; Deo, R.; et al. Large-scale High-resolution Coastal Mangrove Forests Mapping across West Africa with Machine Learning Ensemble and Satellite Big Data. Front. Earth Sci. 2021, 8, 677. [Google Scholar] [CrossRef]
- Mullissa, A.; Vollrath, A.; Odongo-Braun, C.; Slagter, B.; Balling, J.; Gou, Y.; Gorelick, N.; Reiche, J. Sentinel-1 SAR Backscatter Analysis Ready Data Preparation in Google Earth Engine. Remote Sens. 2021, 13, 1954. [Google Scholar] [CrossRef]
- Google Developers Sentinel-1 Algorithms. Available online: https://developers.google.com/earth-engine/guides/sentinel1 (accessed on 31 October 2021).
- Hasan, S.F.; Shareef, M.A.; Hassan, N.D. Speckle filtering impact on land use/land cover classification area using the combination of Sentinel-1A and Sentinel-2B (a case study of Kirkuk city, Iraq). Arab. J. Geosci. 2021, 14, 276. [Google Scholar] [CrossRef]
- Lee, J.-S.; Wen, J.-H.; Ainsworth, T.L.; Chen, K.-S.; Chen, A.J. Improved sigma filter for speckle filtering of SAR imagery. IEEE Trans. Geosci. Remote Sens. 2008, 47, 202–213. [Google Scholar]
- Anchang, J.Y.; Prihodko, L.; Ji, W.; Kumar, S.S.; Ross, C.W.; Yu, Q.; Lind, B.; Sarr, M.A.; Diouf, A.A.; Hanan, N.P. Toward operational mapping of woody canopy cover in tropical savannas using Google Earth Engine. Front. Environ. Sci. 2020, 8, 4. [Google Scholar] [CrossRef] [Green Version]
- ESA. European Space Agency (ESA) Sentinel-2 User Handbook; ESA Standard Document; 2015; Available online: https://sentinels.copernicus.eu/web/sentinel/user-guides/document-library/-/asset_publisher/xlslt4309D5h/content/sentinel-2-user-handbook (accessed on 19 November 2021).
- Naboureh, A.; Li, A.; Bian, J.; Lei, G.; Amani, M. A Hybrid Data Balancing Method for Classification of Imbalanced Training Data within Google Earth Engine: Case Studies from Mountainous Regions. Remote Sens. 2020, 12, 3301. [Google Scholar] [CrossRef]
- Ouma, Y.O.; Okuku, C.O.; Njau, E.N. Use of artificial neural networks and multiple linear regression model for the prediction of dissolved oxygen in rivers: Case study of hydrographic basin of River Nyando, Kenya. Complexity 2020, 2020, 9570789. [Google Scholar] [CrossRef]
- Ahad, N.; Qadir, J.; Ahsan, N. Neural networks in wireless networks: Techniques, applications and guidelines. J. Netw. Comput. Appl. 2016, 68, 1–27. [Google Scholar] [CrossRef]
- Amani, M.; Kakooei, M.; Moghimi, A.; Ghorbanian, A.; Ranjgar, B.; Mahdavi, S.; Davidson, A.; Fisette, T.; Rollin, P.; Brisco, B.; et al. Application of Google Earth Engine Cloud Computing Platform, Sentinel Imagery, and Neural Networks for Crop Mapping in Canada. Remote Sens. 2020, 12, 3561. [Google Scholar] [CrossRef]
- Heidari, E.; Sobati, M.A.; Movahedirad, S. Accurate prediction of nanofluid viscosity using a multilayer perceptron artificial neural network (MLP-ANN). Chemom. Intell. Lab. Syst. 2016, 155, 73–85. [Google Scholar] [CrossRef]
- Berberoglu, S.; Curran, P.J.; Lloyd, C.D.; Atkinson, P.M. Texture classification of Mediterranean land cover. Int. J. Appl. Earth Obs. Geoinf. 2007, 9, 322–334. [Google Scholar] [CrossRef]
- Hecht-Nielsen, R. Theory of the Backpropagation Neural Network. In Neural Networks for Perception; Elsevier: Amsterdam, The Netherlands, 1992; pp. 65–93. [Google Scholar]
- Nezhad, S.S.A.; Zoej, M.J.V.; Ghorbanian, A. A fast non-iterative method for the object to image space best scanline determination of spaceborne linear array pushbroom images. Adv. Space Res. 2021, 68, 3584–3593. [Google Scholar] [CrossRef]
- Kingma, D.P.; Ba, J. Adam: A method for stochastic optimization. arXiv 2014, arXiv:1412.6980. [Google Scholar]
- Ketkar, N. Stochastic Gradient Descent. In Deep Learning with Python; Apress: Berkeley, CA, USA, 2017; pp. 113–132. [Google Scholar]
- Livieris, I.E. An advanced active set L-BFGS algorithm for training weight-constrained neural networks. Neural Comput. Appl. 2020, 32, 6669–6684. [Google Scholar] [CrossRef]
- Stehman, S.V. Sampling designs for accuracy assessment of land cover. Int. J. Remote Sens. 2009, 30, 5243–5272. [Google Scholar] [CrossRef]
- Berger, A.; Guda, S. Threshold optimization for F measure of macro-averaged precision and recall. Pattern Recognit. 2020, 102, 107250. [Google Scholar] [CrossRef]
- Liang, X.; Xu, J. Biased ReLU neural networks. Neurocomputing 2021, 423, 71–79. [Google Scholar] [CrossRef]
- Yu, Y.; Adu, K.; Tashi, N.; Anokye, P.; Wang, X.; Ayidzoe, M.A. Rmaf: Relu-memristor-like activation function for deep learning. IEEE Access 2020, 8, 72727–72741. [Google Scholar] [CrossRef]
- Kathiresan, K. Importance of mangrove ecosystem. Int. J. Mar. Sci. 2012, 2, 70–89. [Google Scholar] [CrossRef] [Green Version]
- Heumann, B.W. Satellite remote sensing of mangrove forests: Recent advances and future opportunities. Prog. Phys. Geogr. 2011, 35, 87–108. [Google Scholar] [CrossRef]
- Kuenzer, C.; Bluemel, A.; Gebhardt, S.; Quoc, T.V.; Dech, S. Remote sensing of mangrove ecosystems: A review. Remote Sens. 2011, 3, 878–928. [Google Scholar] [CrossRef] [Green Version]
- Heumann, B.W. An object-based classification of mangroves using a hybrid decision tree—Support vector machine approach. Remote Sens. 2011, 3, 2440–2460. [Google Scholar] [CrossRef] [Green Version]
- Cárdenas, N.Y.; Joyce, K.E.; Maier, S.W. Monitoring mangrove forests: Are we taking full advantage of technology? Int. J. Appl. Earth Obs. Geoinf. 2017, 63, 1–14. [Google Scholar] [CrossRef] [Green Version]
- Shanker, M.; Hu, M.Y.; Hung, M.S. Effect of data standardization on neural network training. Omega 1996, 24, 385–397. [Google Scholar] [CrossRef]
- Lei, G.; Li, A.; Bian, J.; Yan, H.; Zhang, L.; Zhang, Z.; Nan, X. OIC-MCE: A practical land cover mapping approach for limited samples based on multiple classifier ensemble and iterative classification. Remote Sens. 2020, 12, 987. [Google Scholar] [CrossRef] [Green Version]
- Ghorbanian, A.; Mohammadzadeh, A. An unsupervised feature extraction method based on band correlation clustering for hyperspectral image classification using limited training samples. Remote Sens. Lett. 2018, 9, 982–991. [Google Scholar] [CrossRef]
- Chen, B.; Xu, B.; Zhu, Z.; Yuan, C.; Suen, H.P.; Guo, J.; Xu, N.; Li, W.; Zhao, Y.; Yang, J.; et al. Stable classification with limited sample: Transferring a 30-m resolution sample set collected in 2015 to mapping 10-m resolution global land cover in 2017. Sci. Bull. 2019, 64, 370–373. [Google Scholar]
- Elmes, A.; Alemohammad, H.; Avery, R.; Caylor, K.; Eastman, J.R.; Fishgold, L.; Friedl, M.A.; Jain, M.; Kohli, D.; Bayas, J.C.L.; et al. Accounting for training data error in machine learning applied to Earth observations. Remote Sens. 2020, 12, 1034. [Google Scholar] [CrossRef] [Green Version]
- Amani, M.; Salehi, B.; Mahdavi, S.; Granger, J.; Brisco, B. Wetland classification in Newfoundland and Labrador using multi-source SAR and optical data integration. GISci. Remote Sens. 2017, 54, 779–796. [Google Scholar] [CrossRef]
- Mahdavi, S.; Salehi, B.; Amani, M.; Granger, J.E.; Brisco, B.; Huang, W.; Hanson, A. Object-based classification of wetlands in Newfoundland and Labrador using multi-temporal PolSAR data. Can. J. Remote Sens. 2017, 43, 432–450. [Google Scholar] [CrossRef]


| ID | Class | Training Samples | Test Samples | Total | |||
|---|---|---|---|---|---|---|---|
| Polygon | Area (ha) | Polygon | Area (ha) | Polygon | Area (ha) | ||
| 1 | Mangrove | 50 | 17.29 | 73 | 24.76 | 123 | 42.05 |
| 2 | Tidal zone | 33 | 20.05 | 30 | 18.85 | 63 | 38.90 |
| 3 | Deep water | 27 | 16.09 | 26 | 20.23 | 53 | 36.32 |
| 4 | Shallow water | 28 | 15.18 | 26 | 15.69 | 54 | 30.87 |
| 5 | Mudflat | 67 | 18.58 | 59 | 21.09 | 126 | 39.67 |
| 6 | Urban | 28 | 16.00 | 29 | 19.88 | 57 | 35.88 |
| 7 | Barren | 139 | 25.37 | 136 | 24.45 | 275 | 49.82 |
| 8 | Vegetation | 37 | 15.61 | 36 | 15.15 | 73 | 30.76 |
| Total | 409 | 144.17 | 415 | 160.1 | 824 | 304.27 | |
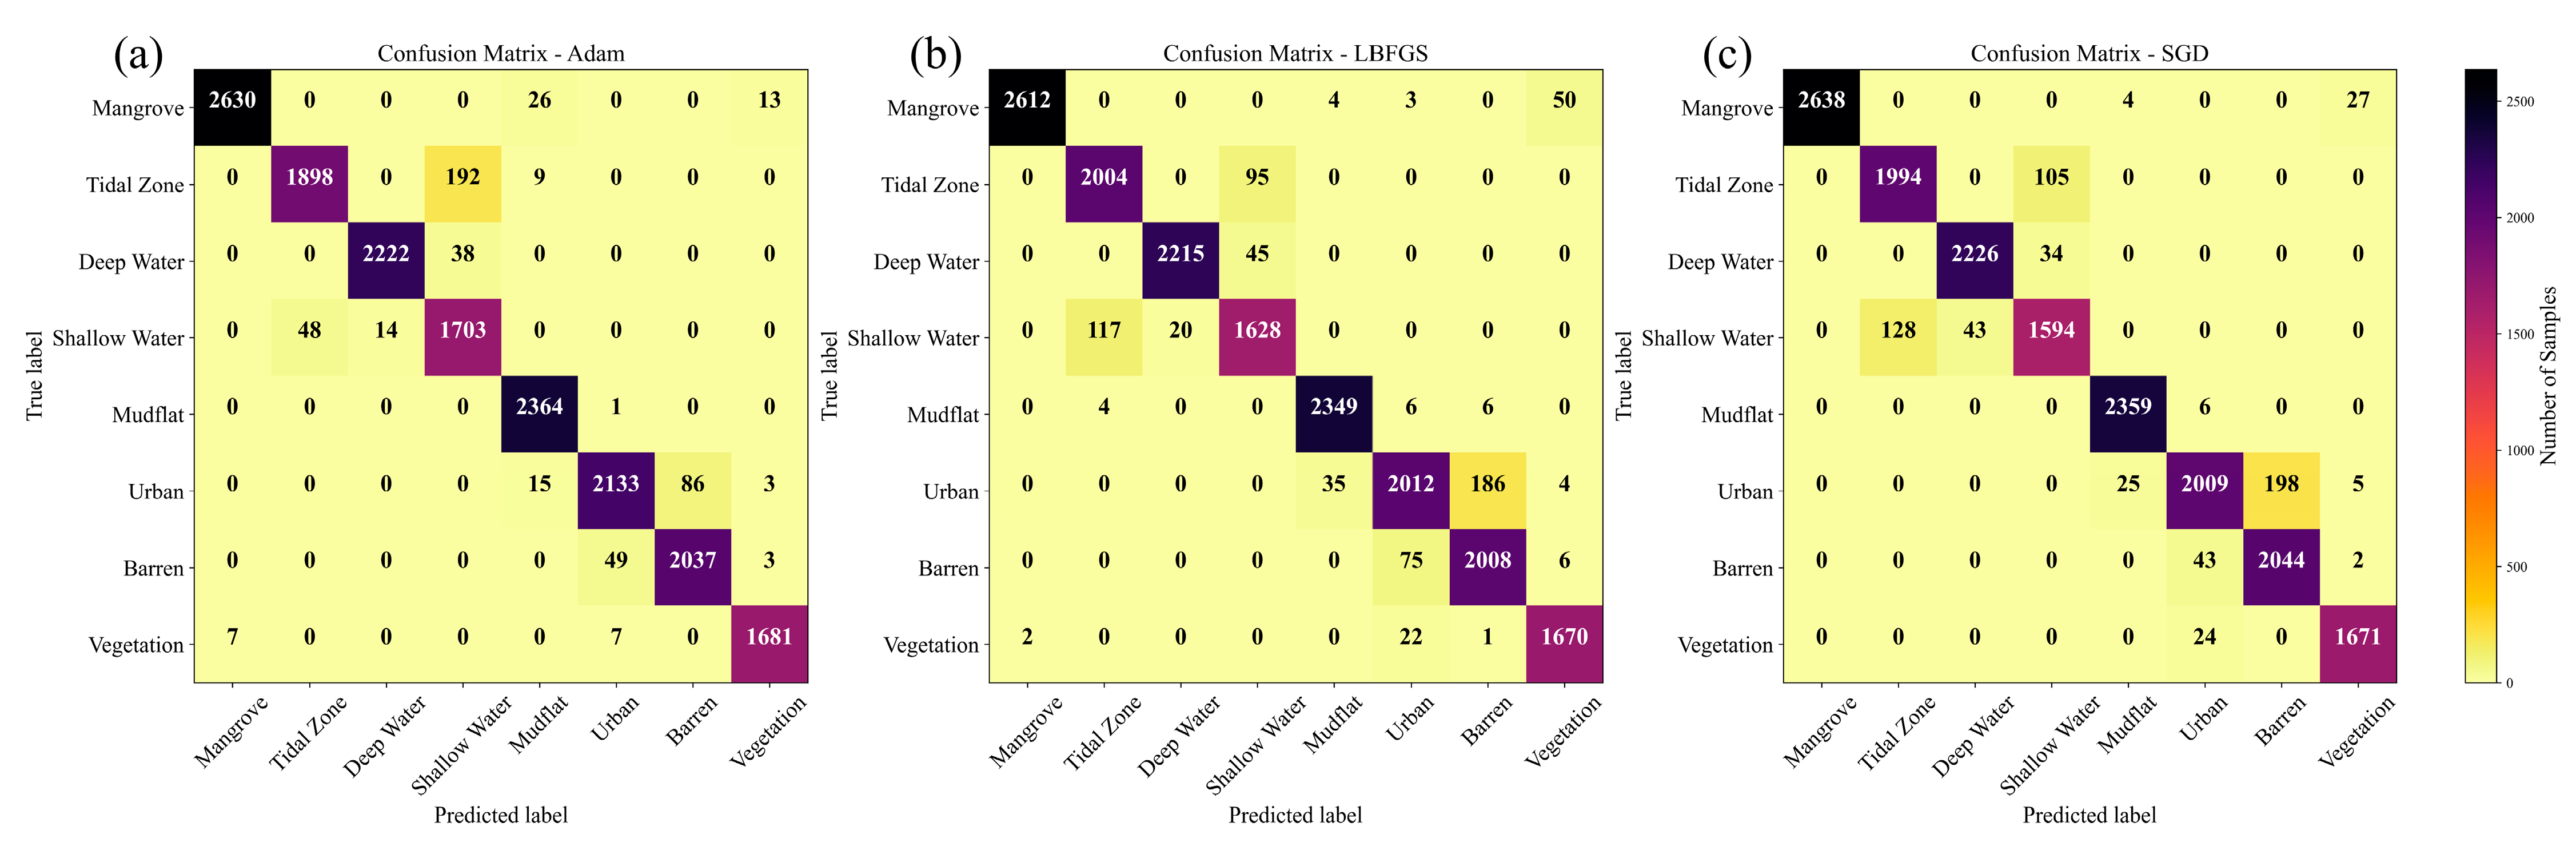
| ID | Class | ANN Models with Learning Algorithms | |||||
|---|---|---|---|---|---|---|---|
| Adam | LBFGS | SGD | |||||
| PA | UA | PA | UA | PA | UA | ||
| 1 | Mangrove | 98.5 | 99.7 | 97.9 | 99.9 | 98.8 | 100 |
| 2 | Tidal zone | 90.4 | 97.5 | 95.5 | 94.3 | 95.0 | 94.0 |
| 3 | Deep water | 98.3 | 99.4 | 98.0 | 99.1 | 98.5 | 98.1 |
| 4 | Shallow water | 96.5 | 88.1 | 92.2 | 92.1 | 90.3 | 92.0 |
| 5 | Mudflat | 100 | 97.9 | 99.3 | 98.4 | 99.7 | 98.8 |
| 6 | Urban | 95.4 | 97.4 | 89.9 | 95.0 | 89.8 | 96.5 |
| 7 | Barren | 97.5 | 95.9 | 96.1 | 91.2 | 97.8 | 91.2 |
| 8 | Vegetation | 99.2 | 98.9 | 98.5 | 96.5 | 98.6 | 98.0 |
| OA = 97.02 and KC = 0.97 | OA = 96.00 and KC = 0.95 | OA = 96.30 and KC = 0.96 | |||||
Publisher’s Note: MDPI stays neutral with regard to jurisdictional claims in published maps and institutional affiliations. |
© 2022 by the authors. Licensee MDPI, Basel, Switzerland. This article is an open access article distributed under the terms and conditions of the Creative Commons Attribution (CC BY) license (https://creativecommons.org/licenses/by/4.0/).
Share and Cite
Ghorbanian, A.; Ahmadi, S.A.; Amani, M.; Mohammadzadeh, A.; Jamali, S. Application of Artificial Neural Networks for Mangrove Mapping Using Multi-Temporal and Multi-Source Remote Sensing Imagery. Water 2022, 14, 244. https://doi.org/10.3390/w14020244
Ghorbanian A, Ahmadi SA, Amani M, Mohammadzadeh A, Jamali S. Application of Artificial Neural Networks for Mangrove Mapping Using Multi-Temporal and Multi-Source Remote Sensing Imagery. Water. 2022; 14(2):244. https://doi.org/10.3390/w14020244
Chicago/Turabian StyleGhorbanian, Arsalan, Seyed Ali Ahmadi, Meisam Amani, Ali Mohammadzadeh, and Sadegh Jamali. 2022. "Application of Artificial Neural Networks for Mangrove Mapping Using Multi-Temporal and Multi-Source Remote Sensing Imagery" Water 14, no. 2: 244. https://doi.org/10.3390/w14020244
APA StyleGhorbanian, A., Ahmadi, S. A., Amani, M., Mohammadzadeh, A., & Jamali, S. (2022). Application of Artificial Neural Networks for Mangrove Mapping Using Multi-Temporal and Multi-Source Remote Sensing Imagery. Water, 14(2), 244. https://doi.org/10.3390/w14020244