1. Introduction
Lakes are nodes for interactions between the various components of the terrestrial surface system. As they serve as important freshwater reservoirs, flood-regulating reservoirs, and species gene pools on Earth, lakes play irreplaceable roles in maintaining the ecological balance of watersheds, conserving water sources, holding soil and water, preventing floods and droughts, regulating climate, and maintaining biodiversity [
1,
2,
3]. China has a vast territory and contains a large number of lakes, including 2759 lakes with individual areas of more than 1 km
2 and a total combined area of 91,019.6 km
2, according to the Records of Chinese Lakes [
4]. These lakes are mainly distributed in five major lake areas: the East Plain, Qinghai–Tibet Plateau, Yunnan–Guizhou Plateau, Mongolia–Xinjiang Plateau, and Northeast Plain and mountains [
5,
6]. In recent years, climate change and continuous rapid socioeconomic development coupled with irrational exploitation by humans have prompted lake shrinkage and even disappearance [
7,
8,
9]. Statistics [
10] show that the areas of 229 lakes in China with individual areas greater than 10 km
2 have shrunk by a total of 13,776 km
2, including 89 dried-up lakes that had a combined area of 4289 km
2. In addition, nearly 1000 natural lakes in China have disappeared due to the country’s nationwide lake reclamation project.
Inner Mongolia, located on the Mongolian Plateau within the hinterland of the Eurasian continent, mostly comprises arid and semi-arid zones, with a typical mid-temperate monsoon climate. Owing to its special geographical conditions, it is home to several particularly vulnerable lake ecosystems in China [
11,
12]. In recent years, the areas of the lakes in this region have been shrinking due to climate change and human activities, and some lakes have even dried up. For example, a study by Academician Fang focusing on the shrinkage of lakes on the Mongolian Plateau [
13] revealed that the number of lakes in Inner Mongolia has decreased by 145 (34.0%) over the past 30 years, whereas the total area of lakes has decreased by about 30.3%, from 4160 km
2 around 1987 to 2901 km
2 in 2010, exhibiting a rapidly decreasing trend. Furthermore, numerous studies conducted in Inner Mongolia and lakes have found stark decreases in the total lake areas over the past 50 years. Zhang et al. [
14] found that the lake area in the hinterland of the Badain Jaran Desert decreased by 3.69 km
2 during 1973–2010. In another study, Wang et al. [
15] showed that the area of the Wuliangsuhai Lake decreased by about 20 km
2 during 1960–2010. Liu et al. [
16] discovered that the area of the Daihai Lake decreased by 89.01 km
2 during 1976–2015. Bai et al. [
17] found that the area of the lakes in the Hunsandake Sandy Land decreased by 198.62 km
2 during 1969–2013. In their study, Yang et al. [
18] reported that the area of the Dalai Nur Lake decreased by 25 km
2 during 1985–2014. Additionally, Zhao et al. [
19] showed that the area of the Hulun Lake decreased by 436.06 km
2 during 1986–2012. Jia et al. [
20] found that the area of lakes in the dune–meadow ecotone of the Horqin Sandy Land decreased by 9.378 km
2 during 1986–2012.
Along with the declining water levels and shrinkage of the lake areas in Inner Mongolia, wetland area shrinkage, lake water imbalance, land desertification, and eco-environmental deterioration are becoming increasingly severe problems. In fact, the lakes are gradually proving themselves to be the most vulnerable, influential, and difficult-to-manage geographical unit in terms of the interactions between human society and the natural environment [
21,
22,
23]. In this study, we examined 546 lakes in Inner Mongolia using multi period remote sensing data, measured the lake number, area, and distribution during seven specific years since 1990, analyzed the lakes’ change characteristics, and discussed the impacts of climate change and human activities on these changes, as well as the precipitation, temperature data, and the main modes of human production activities in Inner Mongolia. The findings from this study can improve our understanding of the current situation and the changing lake trends in this region. Notably, this is important for maintaining human survival and environmental security in the region.
2. Description of the Study Area
Inner Mongolia is located along the northern border of China, extending obliquely from the northeast to the southwest in a narrow fashion, with a length of about 2400 km from east to west and spanning more than 1700 km from north to south at its maximum, covering a total area of 1.183 million km2. Due to its geographical location and topography, the entire region has a complex and diverse climate, dominated mainly by a temperate continental monsoon climate with an annual precipitation of 100–500 mm and generally more than 2700 h of sunshine per year.
There are more than 1000 rivers in Inner Mongolia, of which 107 have a watershed area of more than 1000 km2 each. The Yellow River, Argun River, Nengjiang River, and West Liaohe River are the four major rivers. The lakes in Inner Mongolia span a large geographical area and are scattered throughout the region, but they are mainly located in the Hulun Buir Plateau, the West Liaohe Plain, the Xilingole Plateau, the Wulanchabu Plateau, the Hetao Plain, and the Ordos Plateau, as well as in the hilly areas. Most of the lakes in Inner Mongolia are small and shallow. A few are freshwater lakes, but most are salt lakes. Only a few lakes that receive river runoff and groundwater recharge have large surface areas and depths. In particular, the only lake with an area greater than 1000 km2 is the Hulun Lake; the Buir Lake has an area of 500–1000 km2 and is shared by China and Mongolia; the other large lakes are the Wuliangsuhai Lake, Dalinuoer Lake, Chagannor Lake, Daihai Lake, and Huangqihai Lake, which have areas ranging from 100–500 km2. Notably, more than 80% of the lakes in Inner Mongolia are salt lakes, making this an important distribution area of salt lakes in China.
3. Data and Methods
3.1. Data Sources
Landsat thematic mapper/enhanced thematic mapper/orbital land imager (TM/ETM/OLI) remote sensing images with 30 m resolution and covering the entire region were collected for 29 consecutive years (1989–2018). In order to estimate the maximum area of each lake in each year, the high-water period from June–August in Inner Mongolia was selected as the monitoring period for all years. To better analyze the change process and development trend of the lakes throughout a certain period of time and to consider the lake changes between different years, seven years (1990, 1995, 2000, 2005, 2010, 2015, and 2018) were selected for region-wide data analysis. The meteorological data were obtained from the China Meteorological Data Sharing Network, and the annual average precipitation and temperature data were procured from 69 meteorological stations active across the region from 1970–2017.
3.2. Lake Analysis
Due to the cloudy weather characteristic of the high-water period from June–August, images with low or no cloud cover for a given geographical site within this period could only be obtained by synthesizing images of the same geographical site during the same period over 3 consecutive years. For example, the synthesized images for 1995 were based on the raw images acquired in June–August of 1994, 1995, and 1996 (though mainly 1995), and the synthesized images for 2018 were based on the raw images acquired in 2017 and 2018, primarily during the period of May–August.
By analyzing 7 years’ image data, such as by feature image construction, water sample selection, intelligent detection of water bodies, classification post-processing (removal and correction of false spots), manual editing optimization, and summary statistics, information on 546 lakes was compiled from the lake images captured by Landsat. The water census data for 2010 and 1:250,000 geological maps were used as references. Of the 546 lakes, 468 were included in the census data and 78 were new lakes identified by interpretating the remote sensing images.
4. Results
4.1. Changes in the Area of the Lakes
The total lake areas in 1990, 1995, 2000, 2005, 2010, 2015, and 2018 are listed in
Table 1. It is evident that the total lake area generally exhibited a decreasing trend, with a decrease of 859.43 km
2 (17.31%) during 1990–2010, i.e., from 4965.35 km
2 in 1990 to 4105.92 km
2 in 2010. The lake areas increased slightly during 2010–2018, with an increase of 186.46 km
2 (4.54%). In summary, the net decrease during 1990–2018 was 672.97 km
2, with a mean annual decrease of 24.03 km
2 (13.55%).
From 1990 to 2018, the total area of the lakes with individual areas of >1 km2 exhibited a general decline, decreasing from 4905.24 km2 in 1990 to 4014.97 km2 in 2010, and then rebounding to 4187.45 km2 in 2018, with a net decrease of 14.63%. Among these lakes, the following trends were observed: (1) The total area of one lake with an area of >500 km2 decreased and then increased, reaching a minimum in 2010 and then rebounding and essentially recovering to its normal state. (2) The total area of six lakes with individual areas of 100–500 km2 decreased annually and reached a minimum in 2015, with a net decrease of 563.82 km2 (45.84%). (3) Conversely, the total area of 25 lakes with individual areas of 10–100 km2 generally increased, with a net growth of 125.86 km (21.62%). (4) The total areas of 50 lakes with individual areas of 5–10 km2 and of 243 lakes with individual areas of 1–3 km2 exhibited decreasing trends, shrinking by 175.2 km2 and 87.34 km2 (48.85% and 21.45%), respectively. (5) Lastly, the total area of 58 lakes with individual areas of 3–5 km2 exhibited a minimal net change, as the lakes experienced an increase from 1990–2000, a decrease from 2000–2010, and then a rebound from 2010–2018.
During the period of 1990–2018, the total area of the lakes with individual areas of <1 km2 generally increased, from 60.11 km2 in 1990 to 104.93 km2 in 2018, a net increase of 74.56%.
4.2. Changes in the Number of Lakes
The analysis results (
Table 2) revealed that the total number of lakes with individual areas of >1 km
2 increased and then subsequently decreased during 1990–2018, increasing from 384 in 1990 to 397 in 2000, and then decreasing to 323 in 2010 and 301 in 2018, with net decreases of 61 (15.9%) and 83 (21.6%) during 1990–2010 and 1990–2018, respectively. Additionally, the total number of lakes in 2018 was 29.5% lower than that reported in 1987 [
13]. Compared with the data for 1987, the following changes were observed in 2018: (1) The number of lakes with individual areas of >500 km
2 remained unchanged (i.e., one). (2) Conversely, the number of lakes with individual areas of 100–500 km
2 decreased from six to three. (3) The number of lakes with individual areas of 10–100 km
2 remained basically unchanged. (4) Additionally, the number of lakes with individual areas of 5–10 km
2 decreased annually, with a total decrease of 24 since 1990. (5) The number of lakes with individual areas of 3–5 km
2 fluctuated. (6) Lastly, the number of lakes with individual areas of 1–3 km
2 decreased the most (by 57), accounting for 68.67% of the total decrease in the combined number of lakes.
From 1990 to 2018, the number of lakes with individual areas of <1 km2 increased, from 129 in 1990 to 226 in 2018, a net gain of 75.19%. In particular, the number of lakes with water surface areas of <0.5 km2 decreased from 69 in 1990 to 59 in 2000, and then rose to 119 in 2018, a net increase of 72.46%. The number of lakes with water surface areas of <0.2 km2 (nearly or completely dried-up) also exhibited a decreasing–increasing trend, i.e., initially decreasing from 44 in 1990 to 31 in 2000, and then rebounding to 63 in 2018, with an overall net increase of 43.18% in 1990–2018.
4.3. Changes in Lakes in Different Geomorphological Units
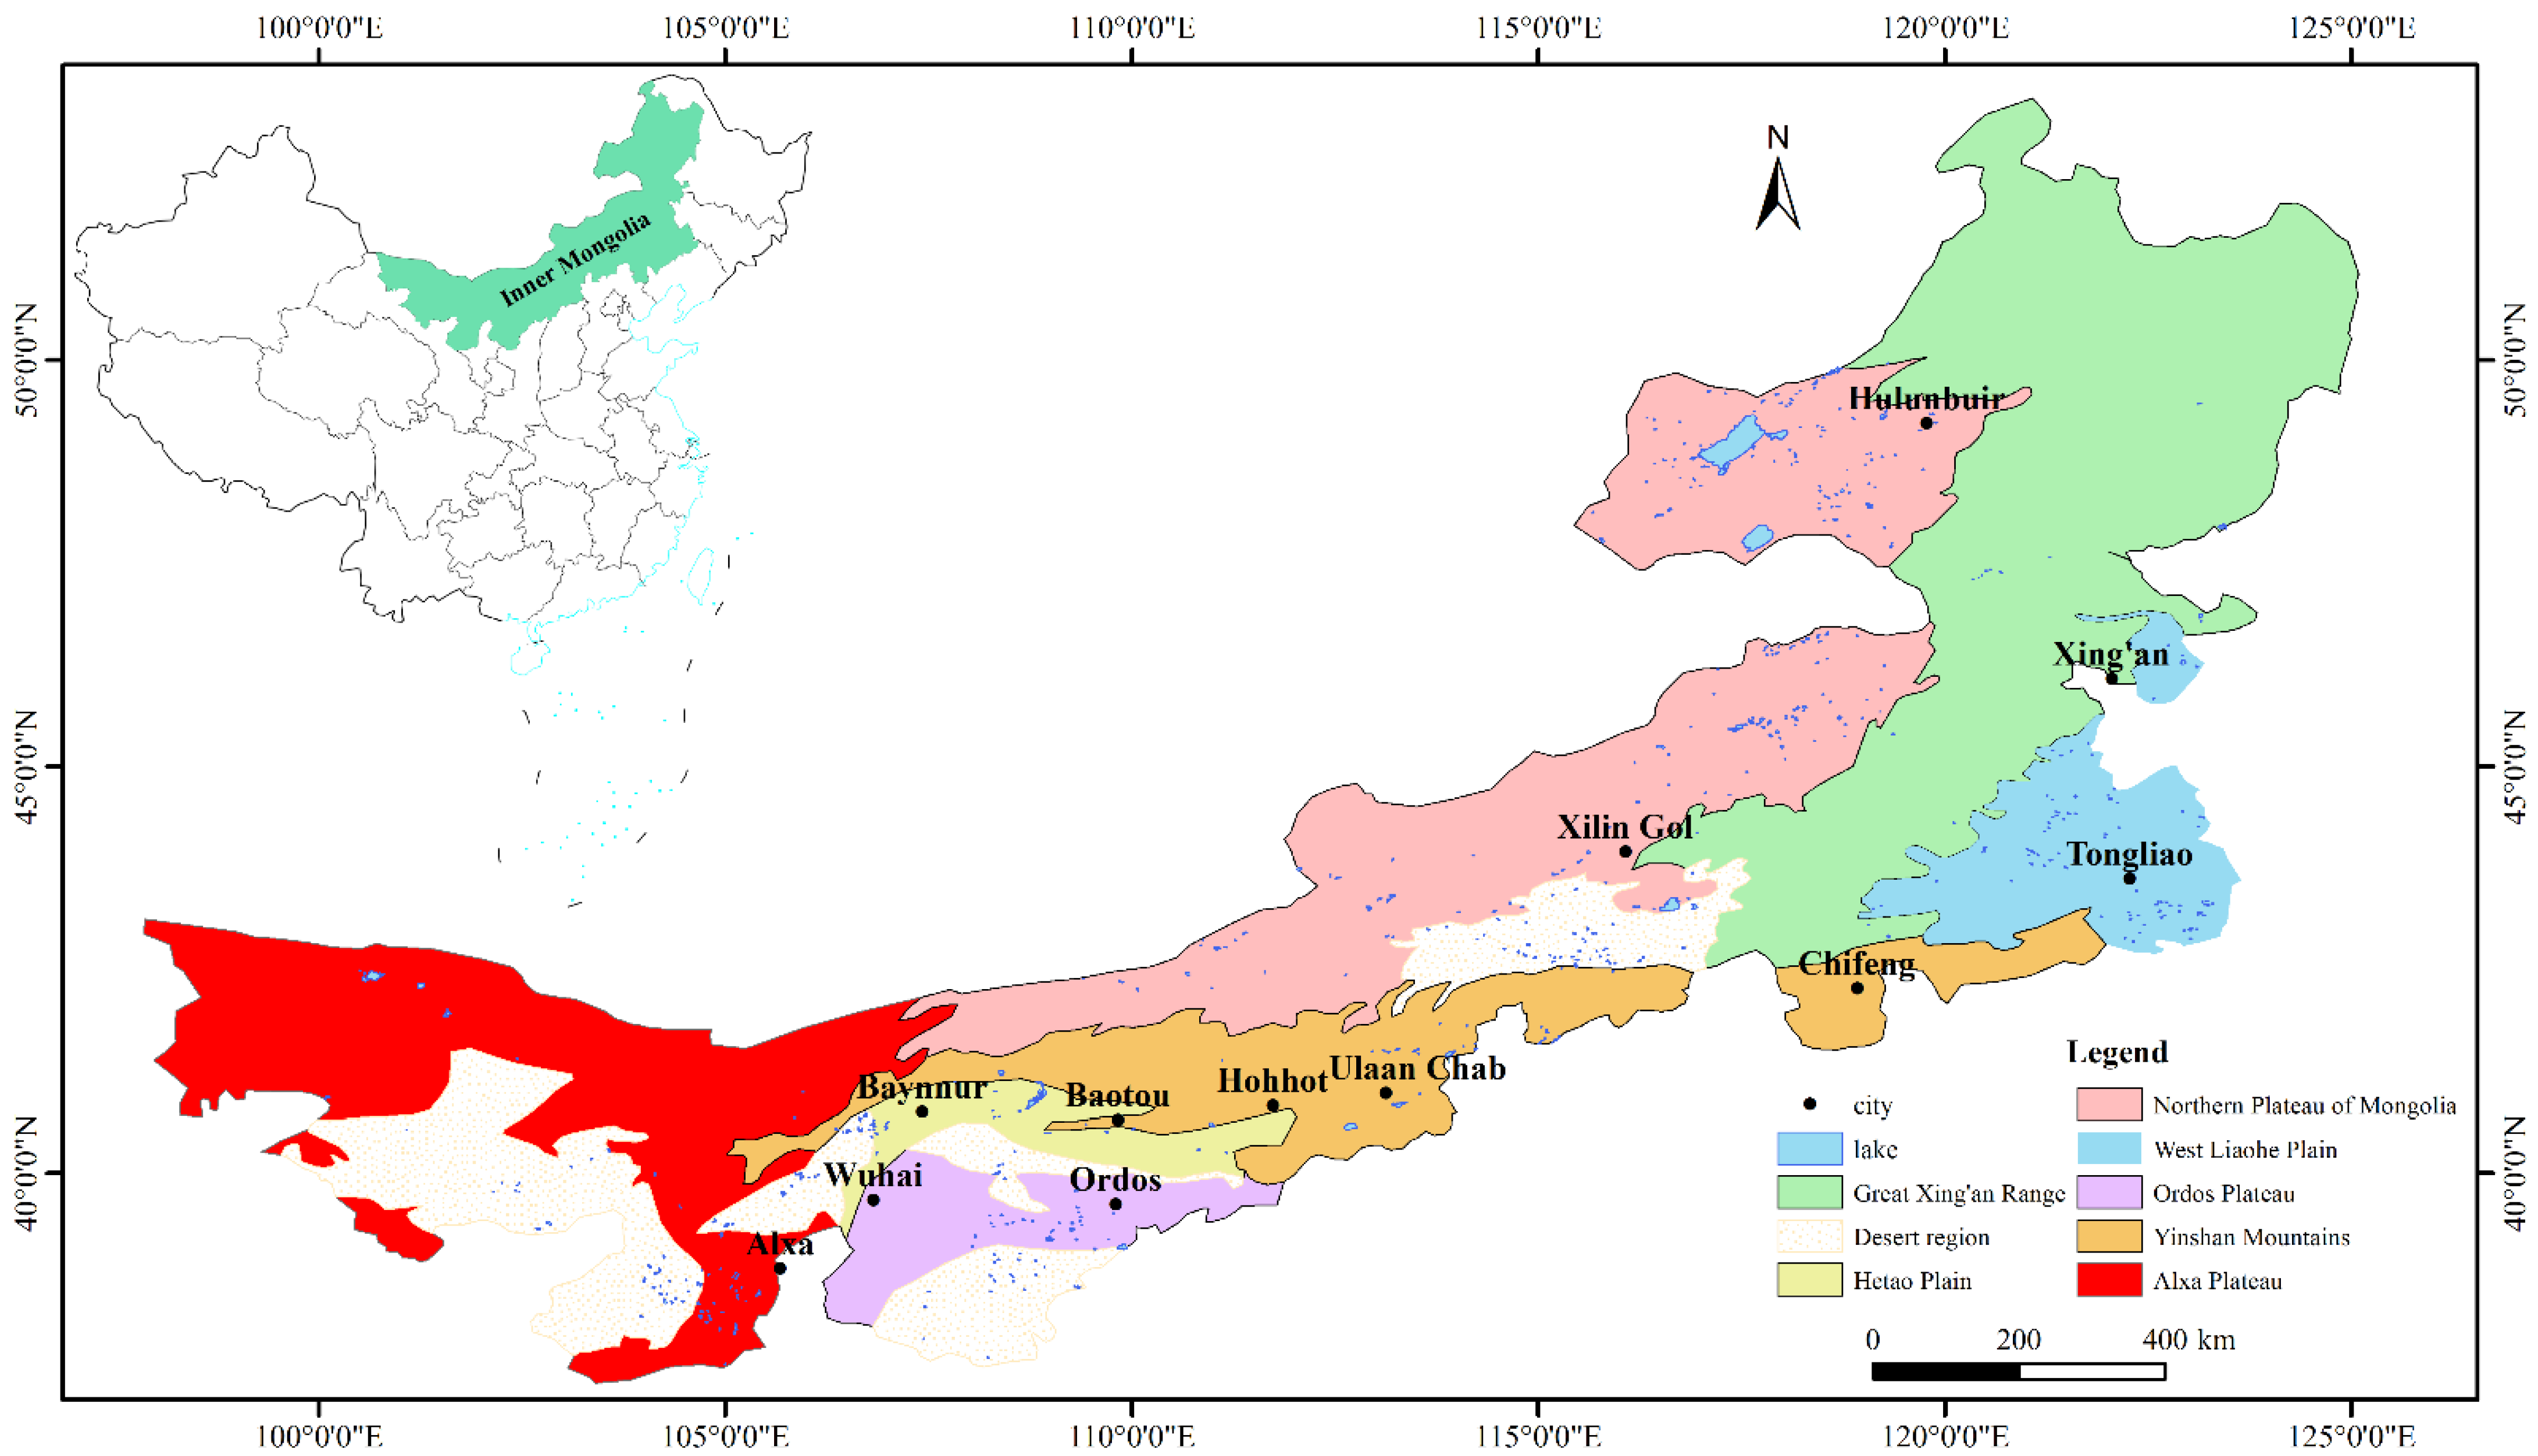
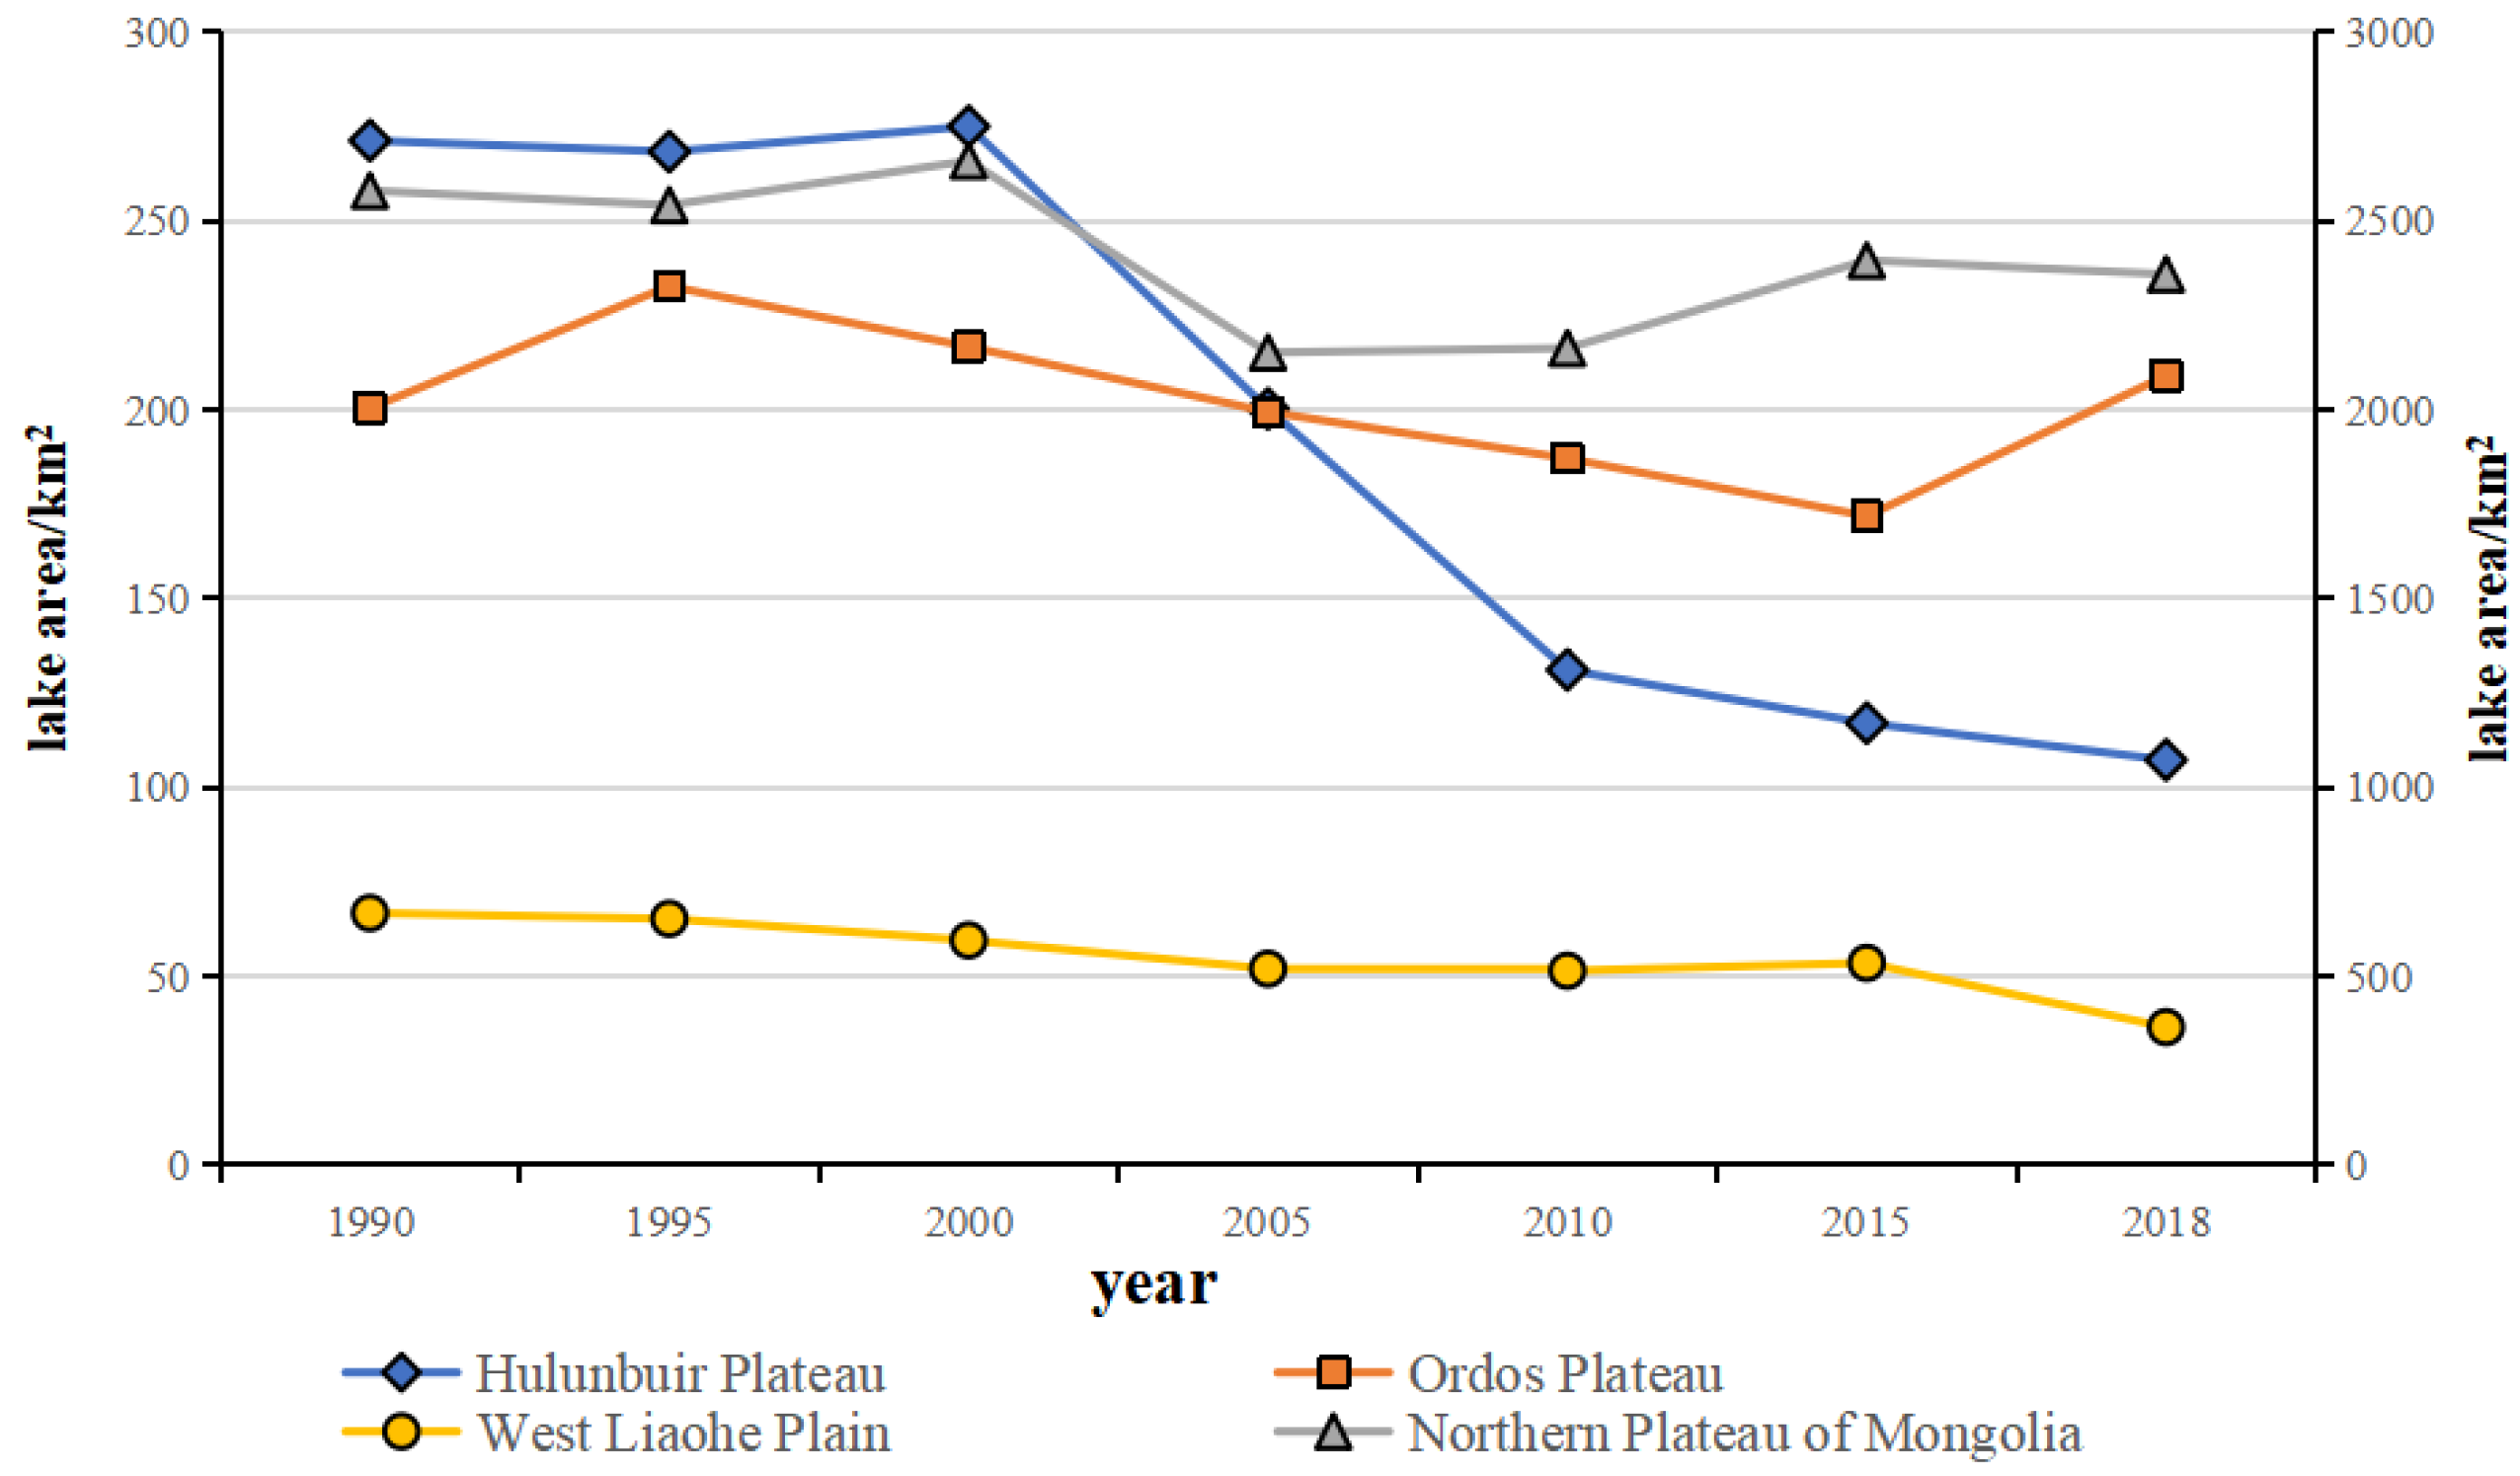
Inner Mongolia is divided into eight geomorphological units, namely, the Daxinganling Mountains, the West Liaohe Plain, the northern Inner Mongolian Plateau, the Yinshan Mountains, the Hetao Plain, the Ordos Plateau, the Alxa Plateau, and the deserts [
24,
25], with each unit having a characteristic pattern of temporal variations in the number and area of its lakes (
Figure 1).
As for the temporal variations in the number of lakes within the different geomorphic units (
Table 3), during 1990–2018, the number of lakes with individual areas of >1 km
2 decreased in the northern Inner Mongolian Plateau region, the desert zone, the West Liaohe Plain, the Yinshan Mountains, and the Daxinganling Mountains. Among these regions, the number of lakes in the West Liaohe Plain experienced the most significant decrease of 79 to 36 (54.43%), followed by that on the northern Inner Mongolian Plateau, which declined from 149 to 117 (21.47%). The temporal trend associated with the number of lakes within the desert zone consisted of two stages. Stage 1 involved an annually increasing trend during 1990–2000, with an overall increase of eight in the entire desert region, four of which occurred in the Mu Us Desert. Stage 2 was characterized by an annually decreasing trend during 2000–2018, with an overall decrease of 17 throughout the entire desert region, where the greatest decrease (of four lakes) occurred in the Hunshandake Desert. The overall trend associated with the number of lakes within the Yinshan Mountains also consisted of two stages. In Stage 1, the number of lakes increased during 1990–2005; in stage 2, it decreased during 2005–2018. The number of lakes on the Hetao Plain, the Ordos Plateau, and the Alxa Plateau all increased, with the Alxa Plateau experiencing the largest gain of seven lakes (87.5%), from eight in 1990 to 15 in 2018.
As is shown by the temporal distribution of the lake areas throughout the different geomorphological units (
Table 4), the total area of the lakes with individual areas of >1 km
2 decreased during 1990–2018, except for that on the Hetao Plain and the Ordos Plateau, where the total area remained generally stable. In particular, the lake area on the West Liaohe Plain decreased most significantly, by nearly 50% (i.e., 49.18%). During 1990–2010, the total area of the lakes with individual areas of >1 km
2 decreased by different degrees depending on the geomorphological units, with the greatest reduction occurring on the northern Inner Mongolian Plateau, where the lake area decreased from 3121.81 km
2 to 2527.85 km
2 (19.03%). During 2010–2018, the lake area continued to decline in the Daxinganling Mountains, the West Liaohe Plain, the Yinshan Mountains, and the desert zone. Specifically, the Yinshan Mountains experienced the largest decrease of 54.98 km
2 (24.41%), from 225.25 km
2 to 170.27 km
2. Contrastingly, on the northern Inner Mongolian Plateau, the total lake area increased by 189.09 km
2 (7.48%), from 2527.85 km
2 to 2716.94 km
2.
4.4. Changes in Lakes in Different Climatic Zones
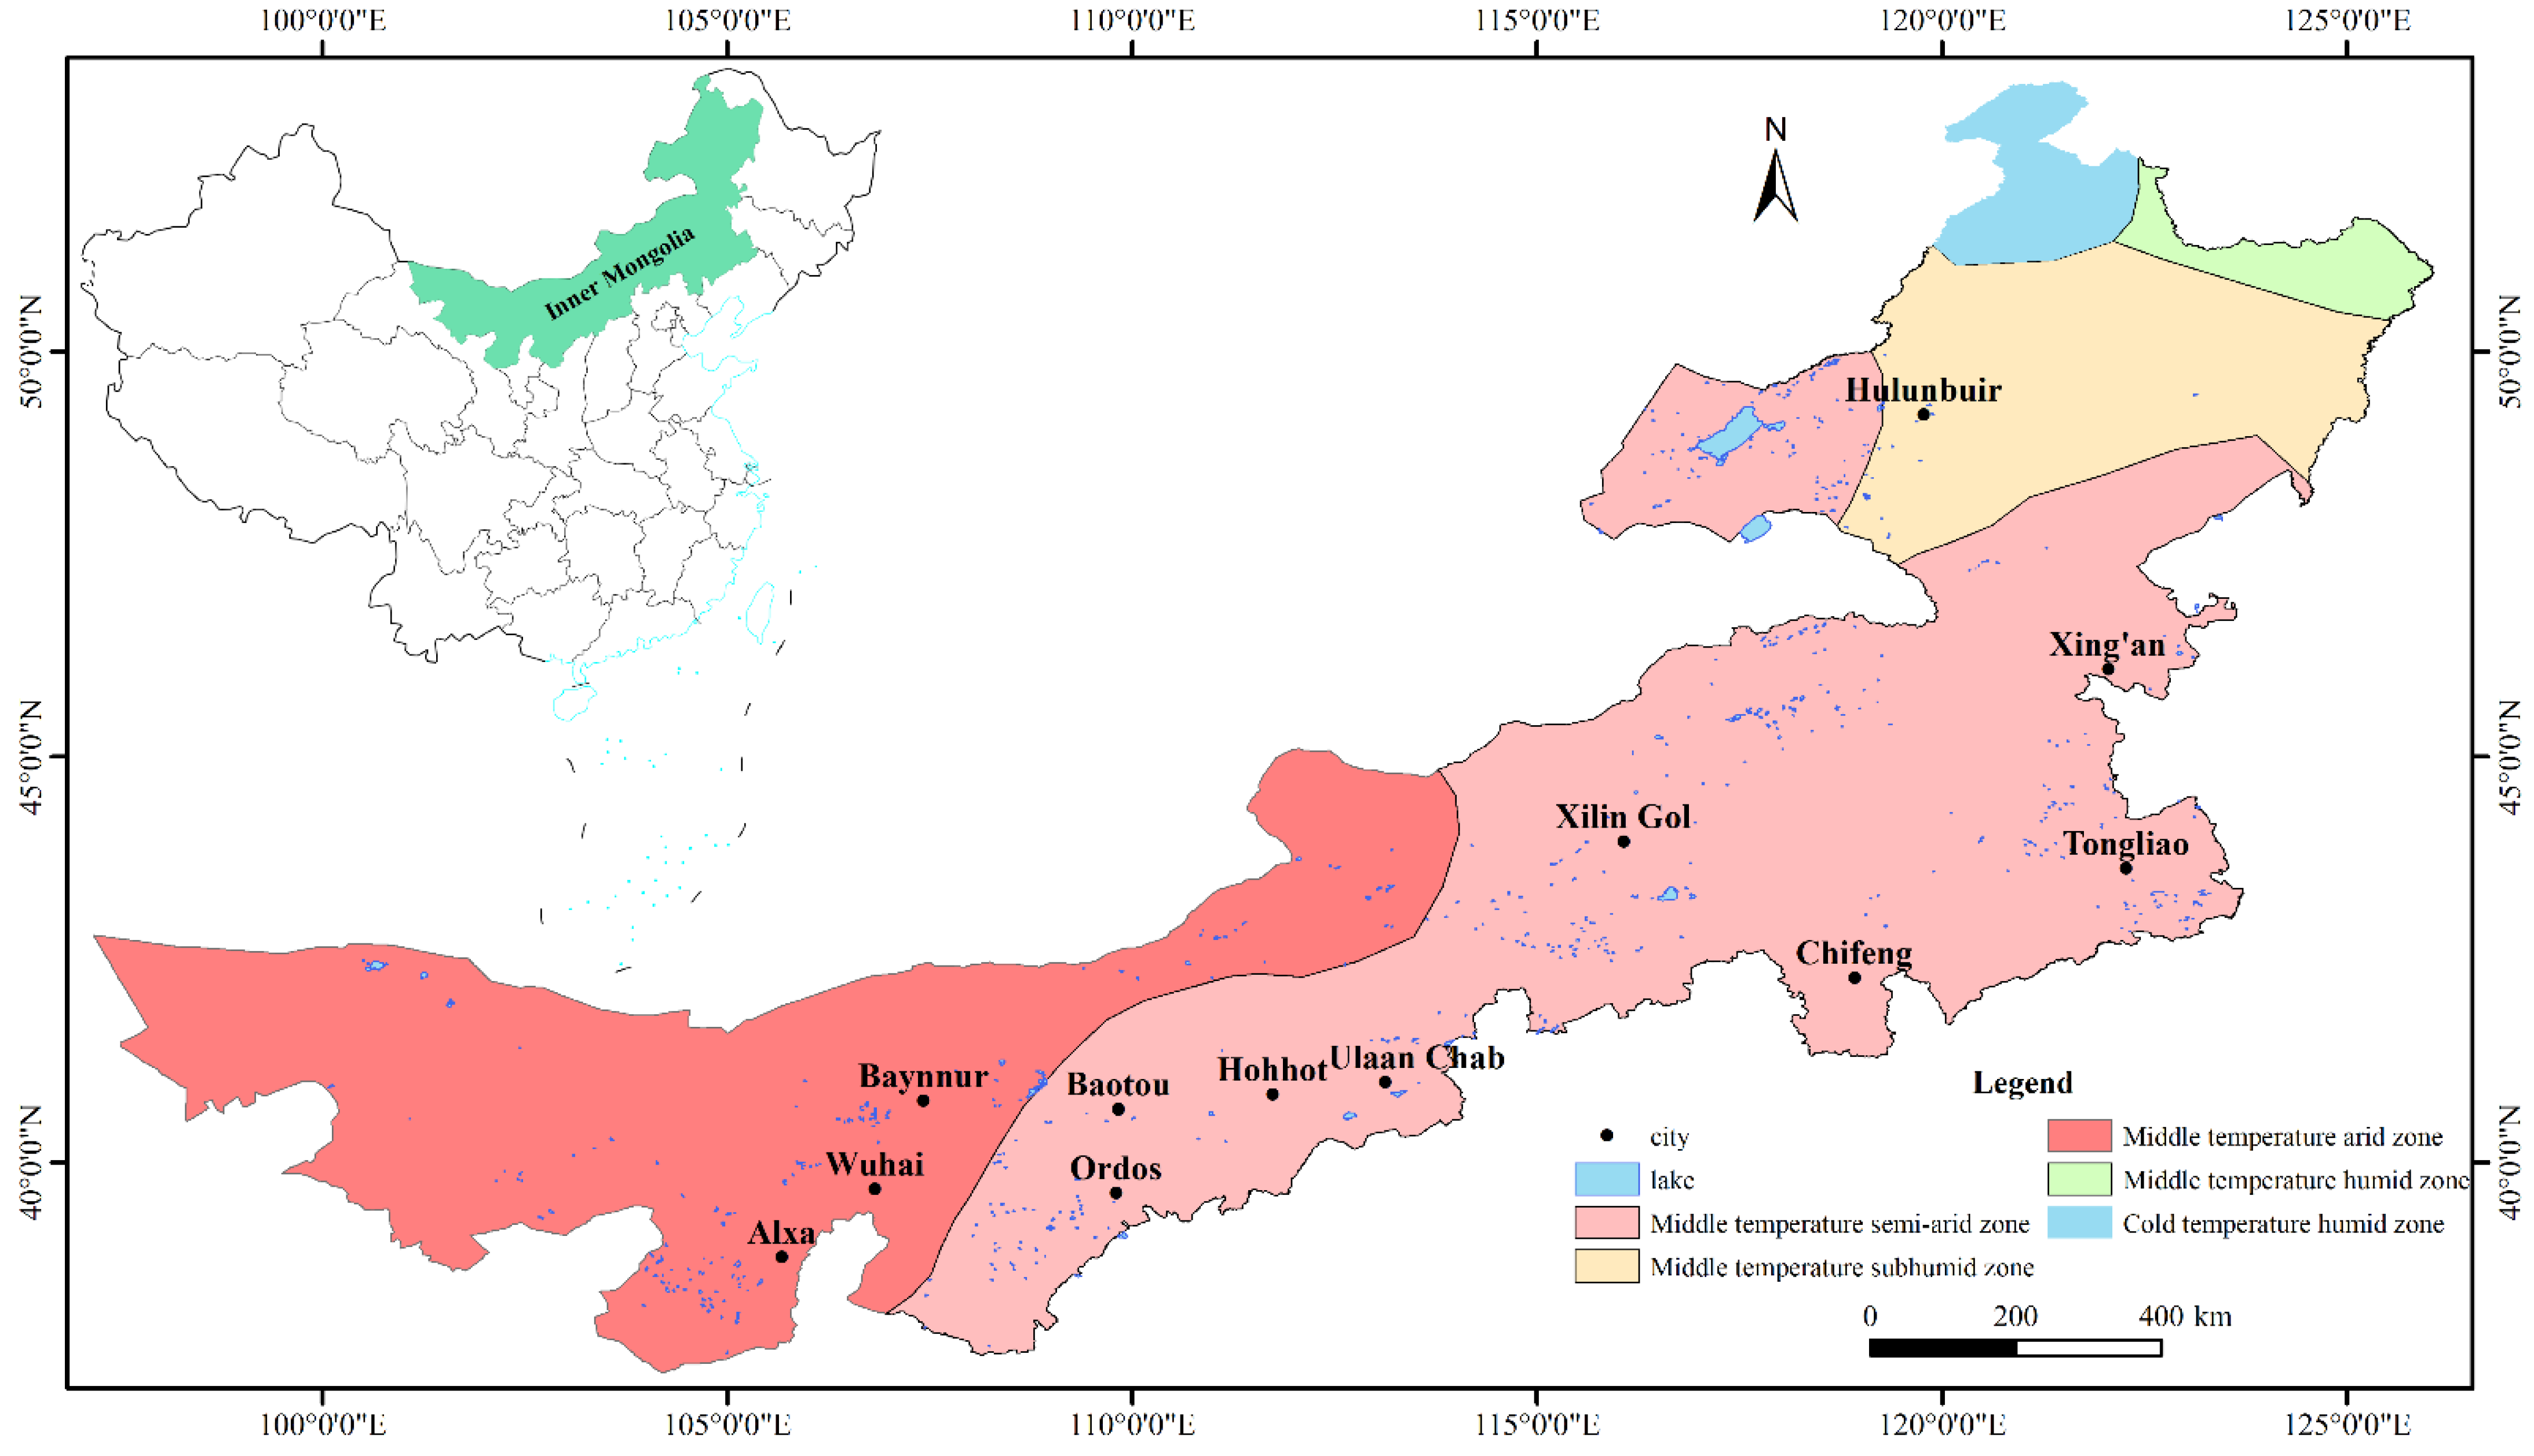
According to the climate zoning scheme for China, Inner Mongolia is divided into five climate zones: mid-temperate arid, mid-temperate semi-arid, mid-temperate semi-humid, mid-temperate humid, and cold temperate humid zones [
26]. The studied lakes were mainly distributed in the mid-temperate arid, mid-temperate semi-arid, and mid-temperate semi-humid zones (
Figure 2); the temporal variations in the number and area of the lakes exhibited different trends depending on the climate zones (
Table 5).
In the mid-temperate arid zone, the number and area of the lakes displayed increasing trends. During 1990–1995, the number of lakes increased rapidly from 106 to 119 (10.9%), and the area of the lakes increased from 627.86 km2 to 642.80 km2. Conversely, during 1995–2010, the number of lakes fluctuated, diminishing slightly from 119 to 116, and the total area of the lakes decreased from 642.80 km2 to 583.82 km2. During 2010–2018, the number of lakes increased from 116 to 125 (7.2%), and the area of the lakes grew by 25.13% or 146.71 km2, from 583.82 km2 to 730.53 km2.
In 1990, the number and area of the lakes in the mid-temperate semi-arid zone accounted for 75.8% and 91.4%, respectively, of those in the entire region. During 1990–2000, the number of lakes remained relatively stable, decreasing from 389 to 390, while the area of lakes increased from 4292.06 km2 to 4366.05 km2. During 2000–2010, both the number and area of the lakes declined, with the number of lakes decreasing from 390 to 385 and their total area shrinking by 20.2% (881.24 km2), from 4366.05 km2 to 3484.81 km2. After 2010, the number and area of the lakes gradually steadied, with the number stabilizing at a lower value of 384 and the area at a slightly higher value of 3515.46 km2.
Both the number and area of the lakes in the mid-temperate semi-humid zone varied only slightly. The number of lakes remained at 18 for each year, except in 1995 and 2015 when the number was 17. The area stabilized between 40 and 50 km2 in each year, except for 2010, which had a low value of 37 km2.
