

Consortium between Groundwater Quality and Lint Yield in Cotton Belt Areas

 , , and
Abstract
1. Introduction
2. Materials and Methods
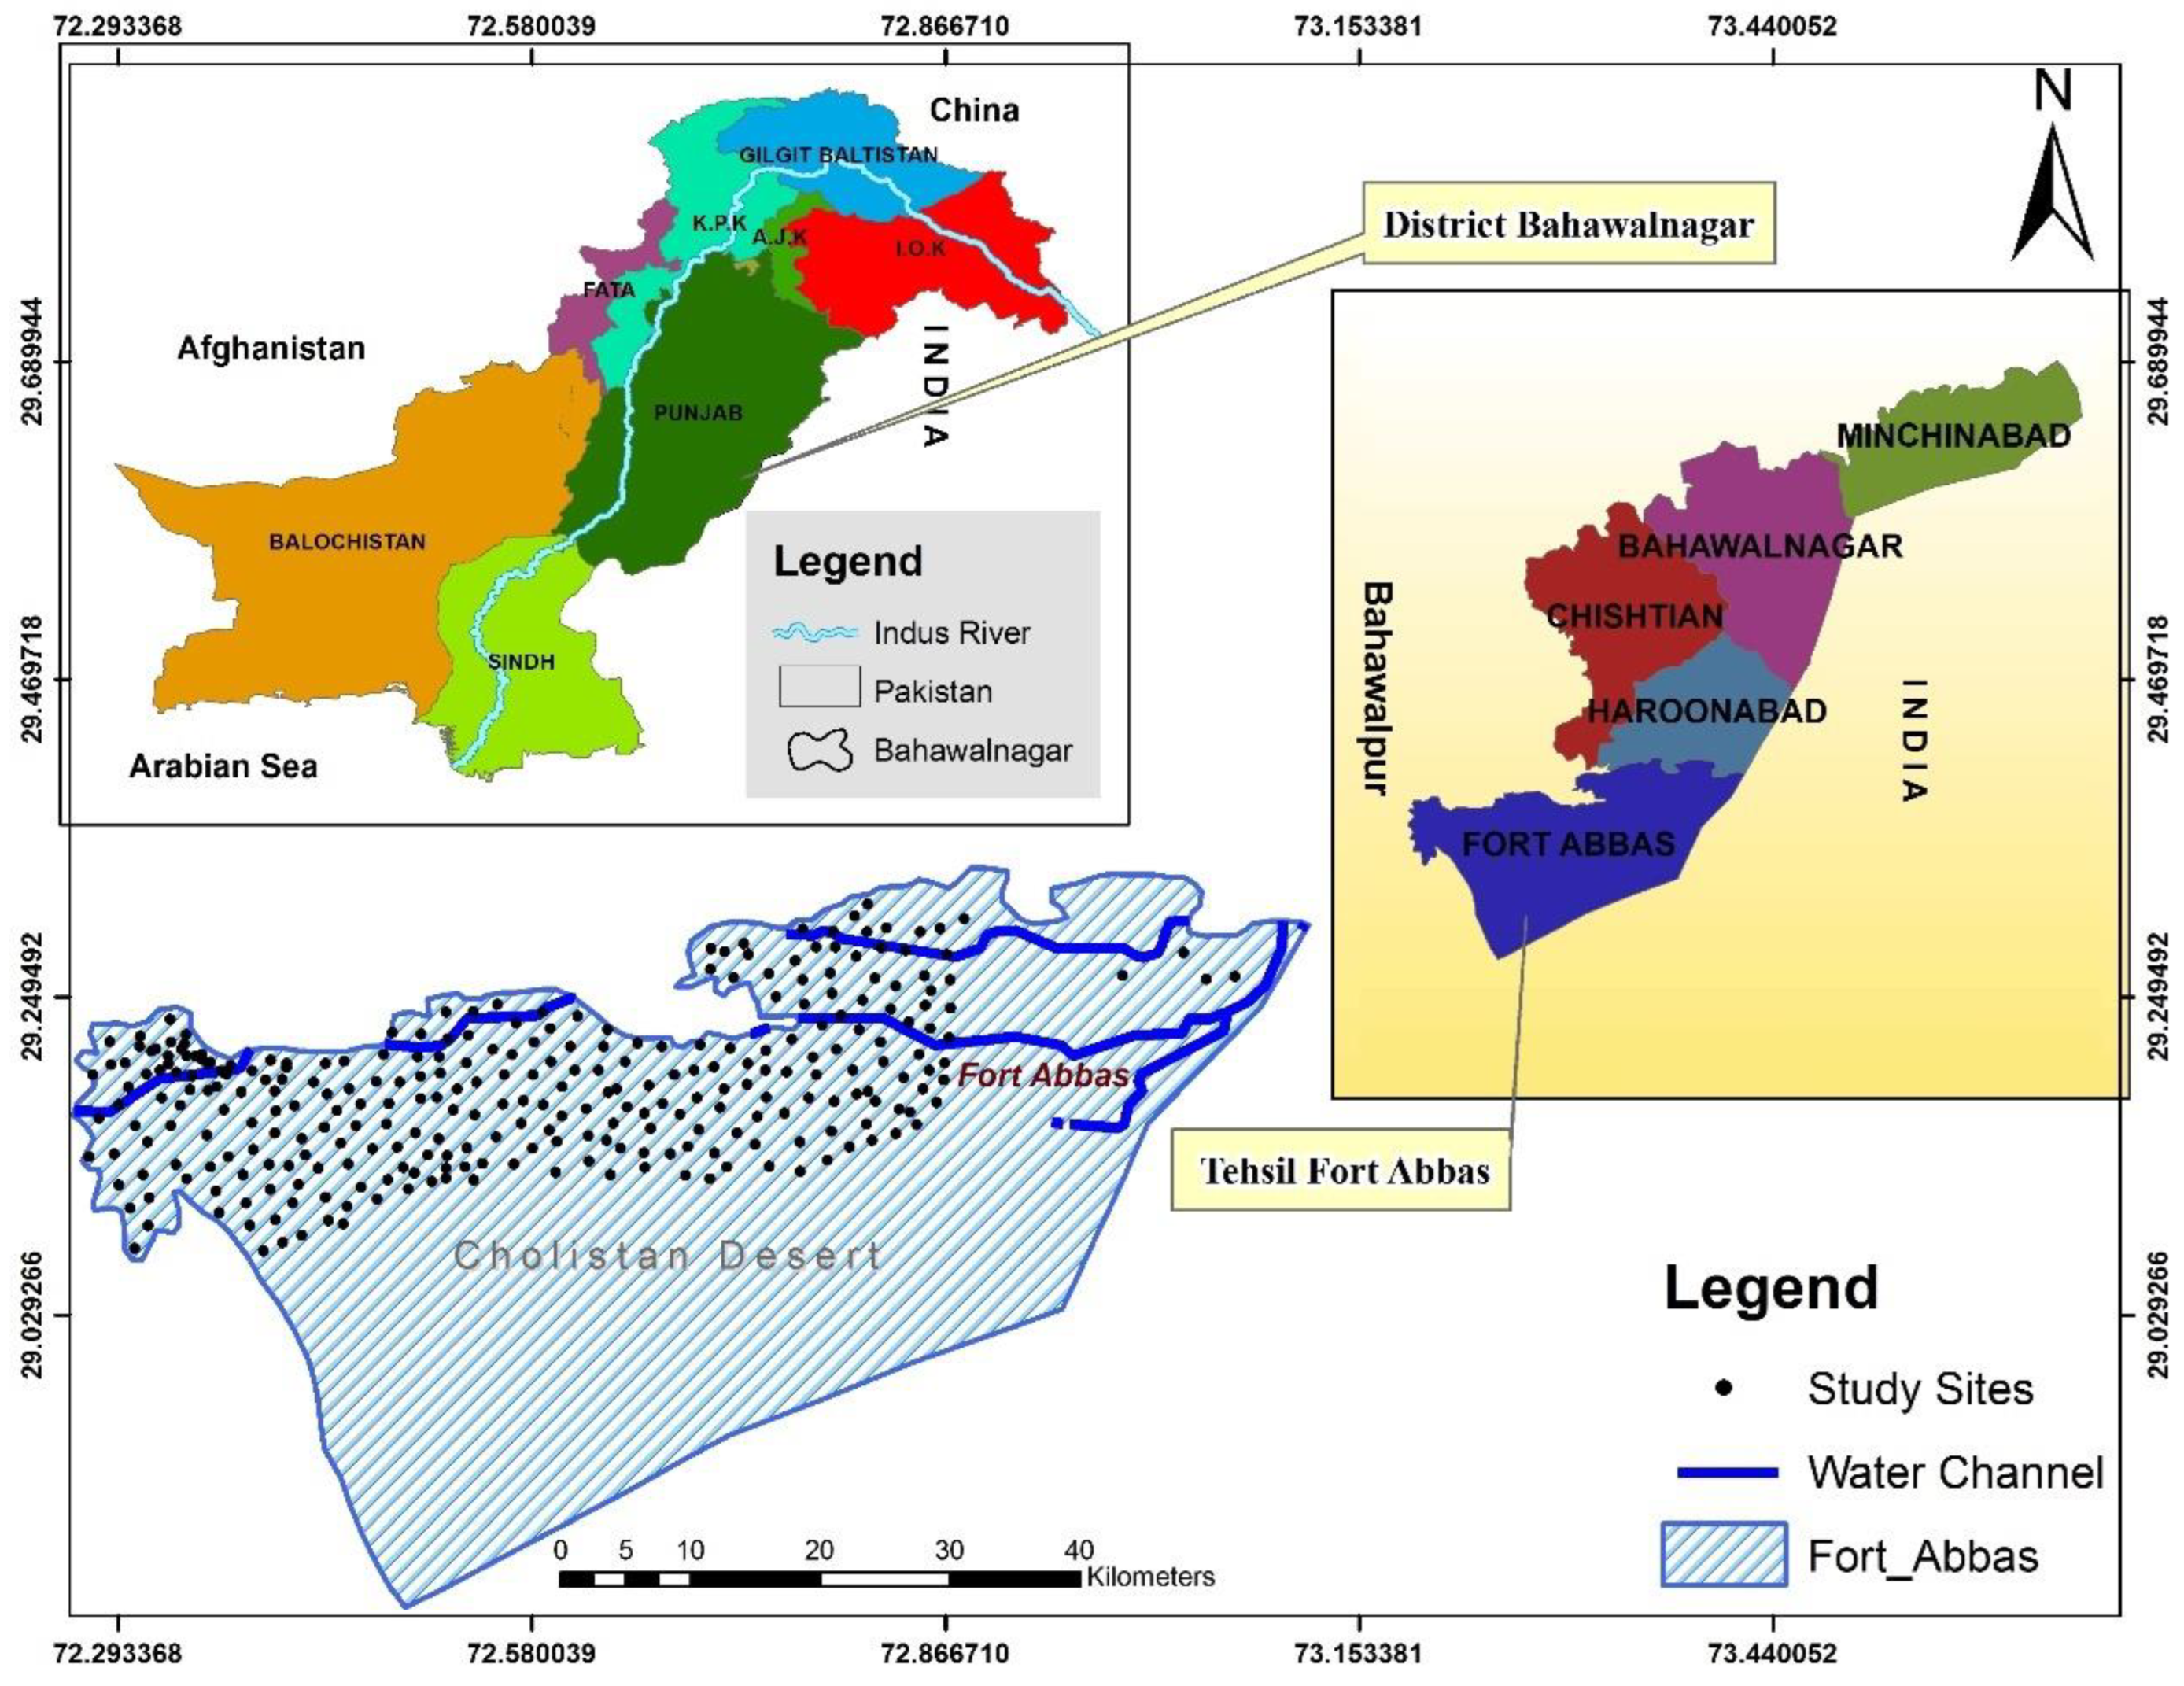
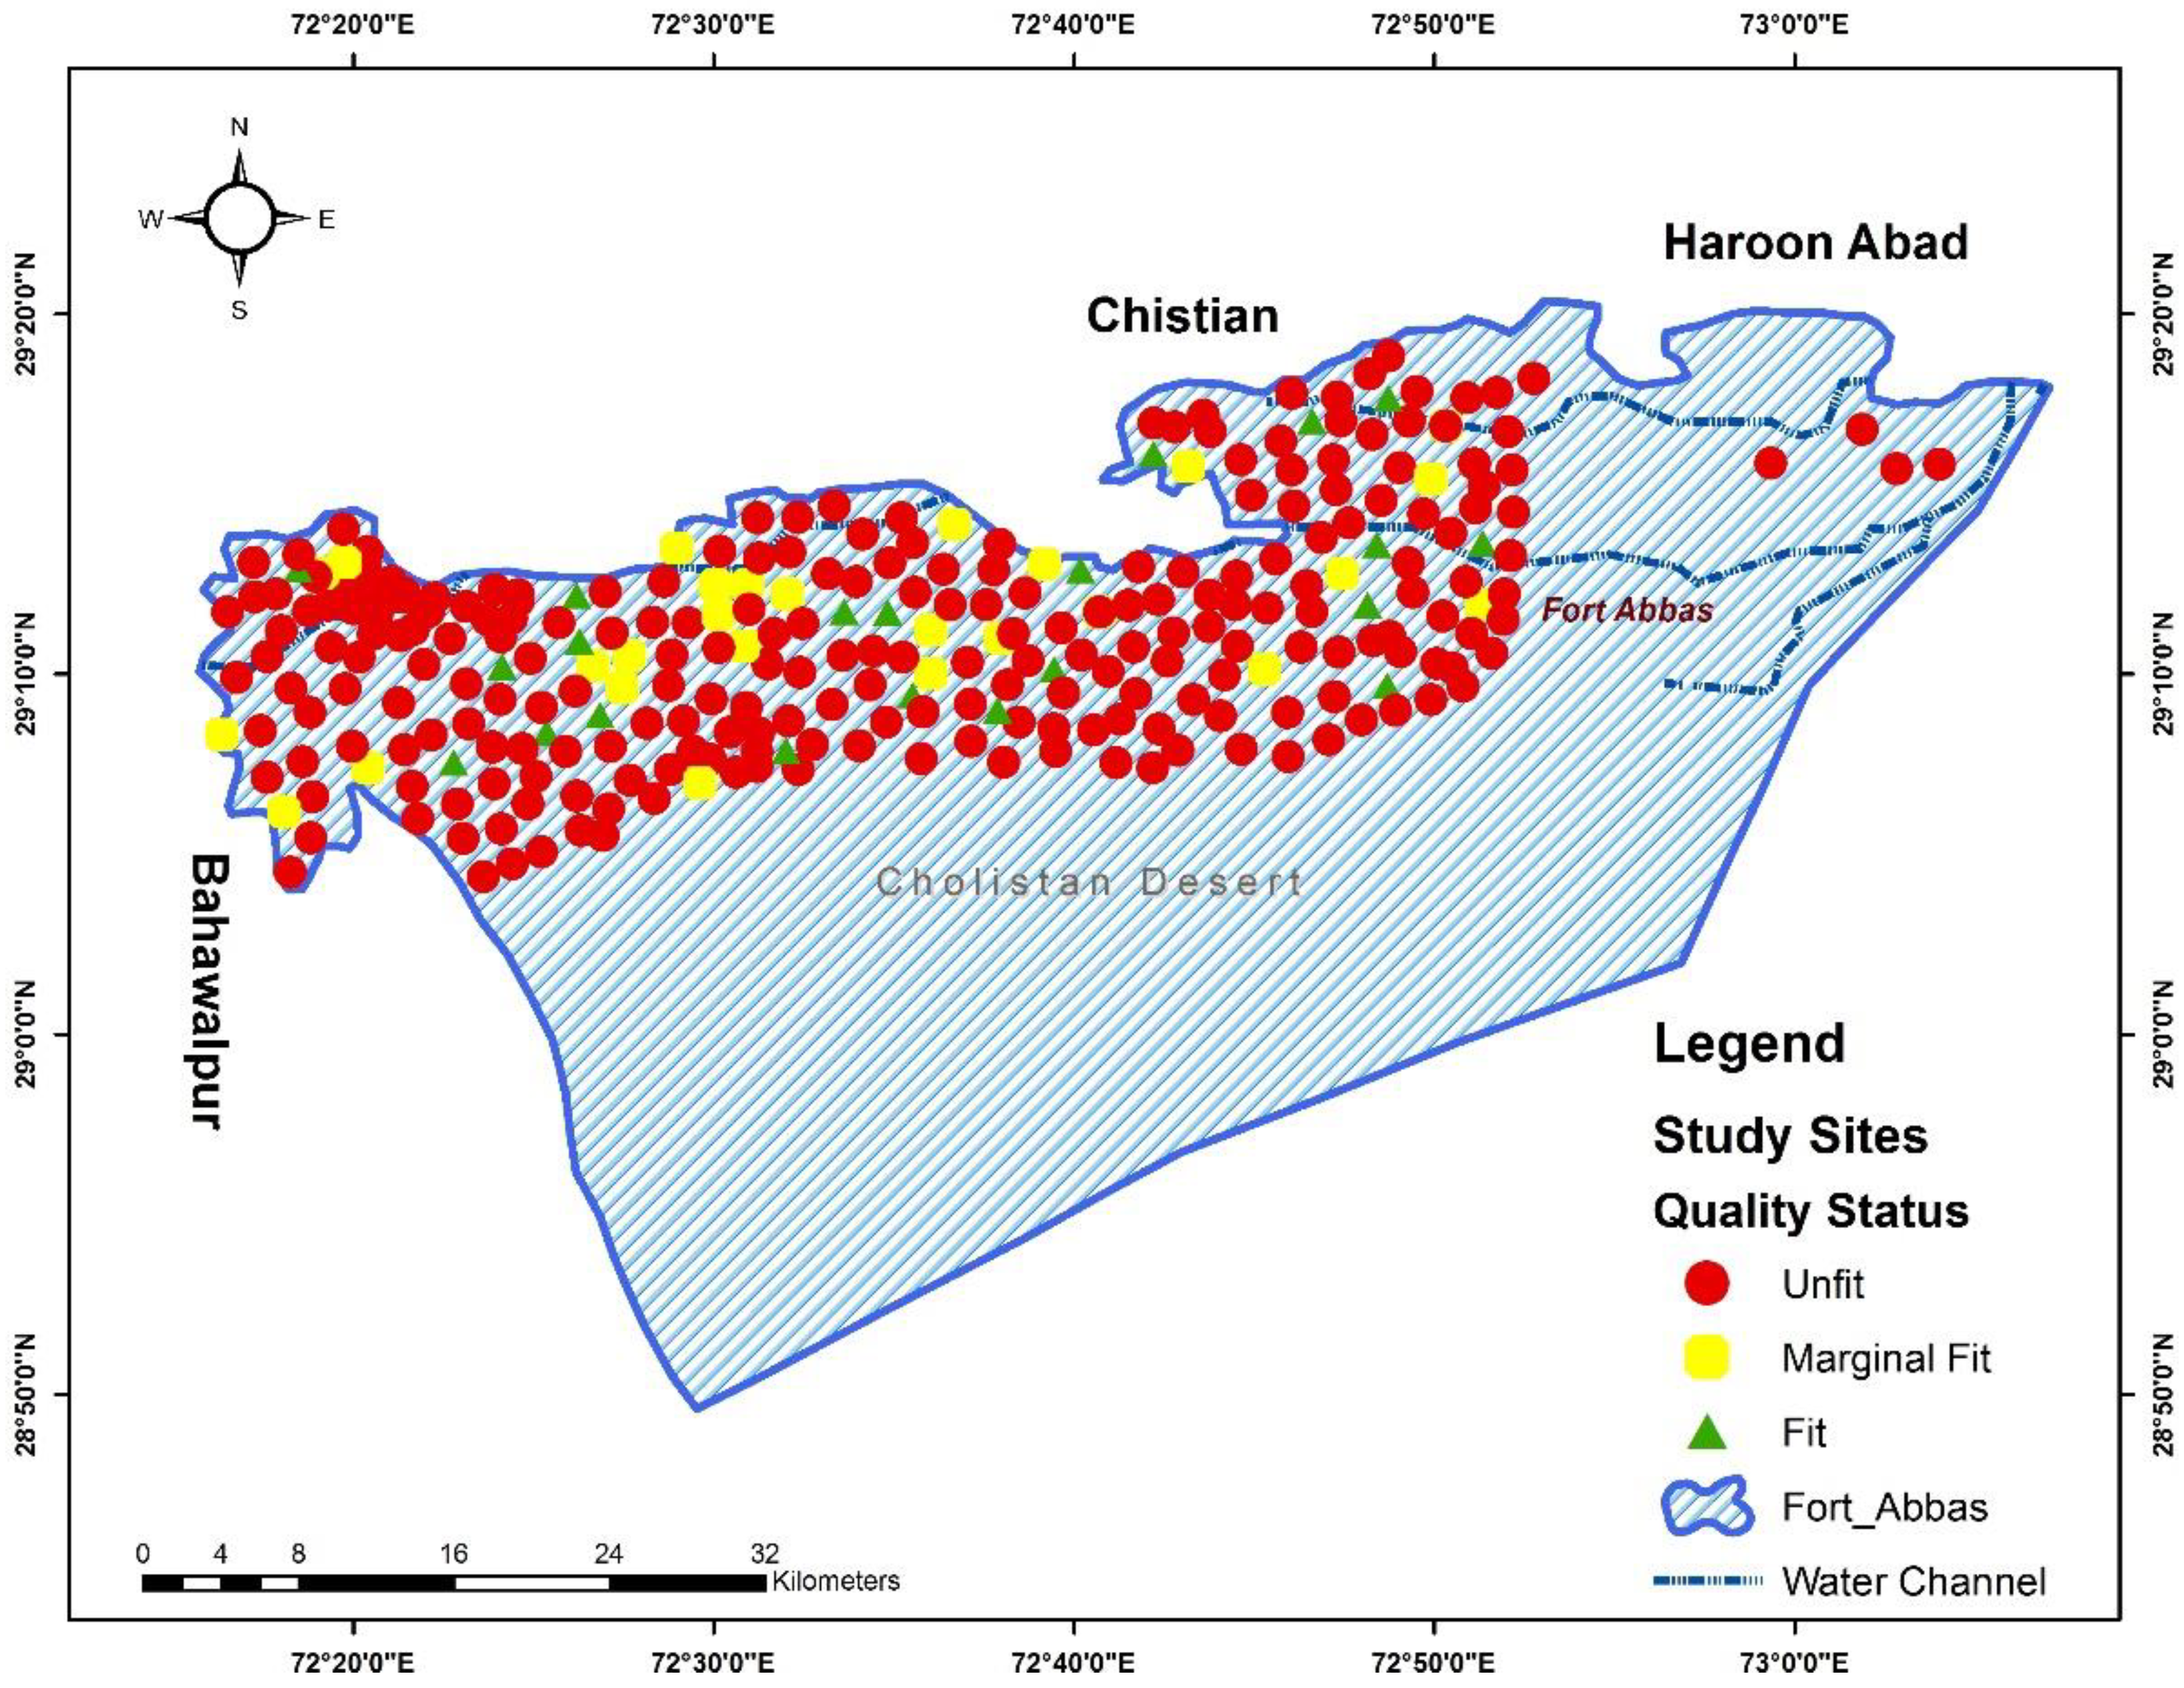
2.1. Study Area Description
2.2. Water Sampling
2.3. Analysis of Samples
2.4. Geographical Information Services (GIS)
2.5. Statistical Analysis
3. Results
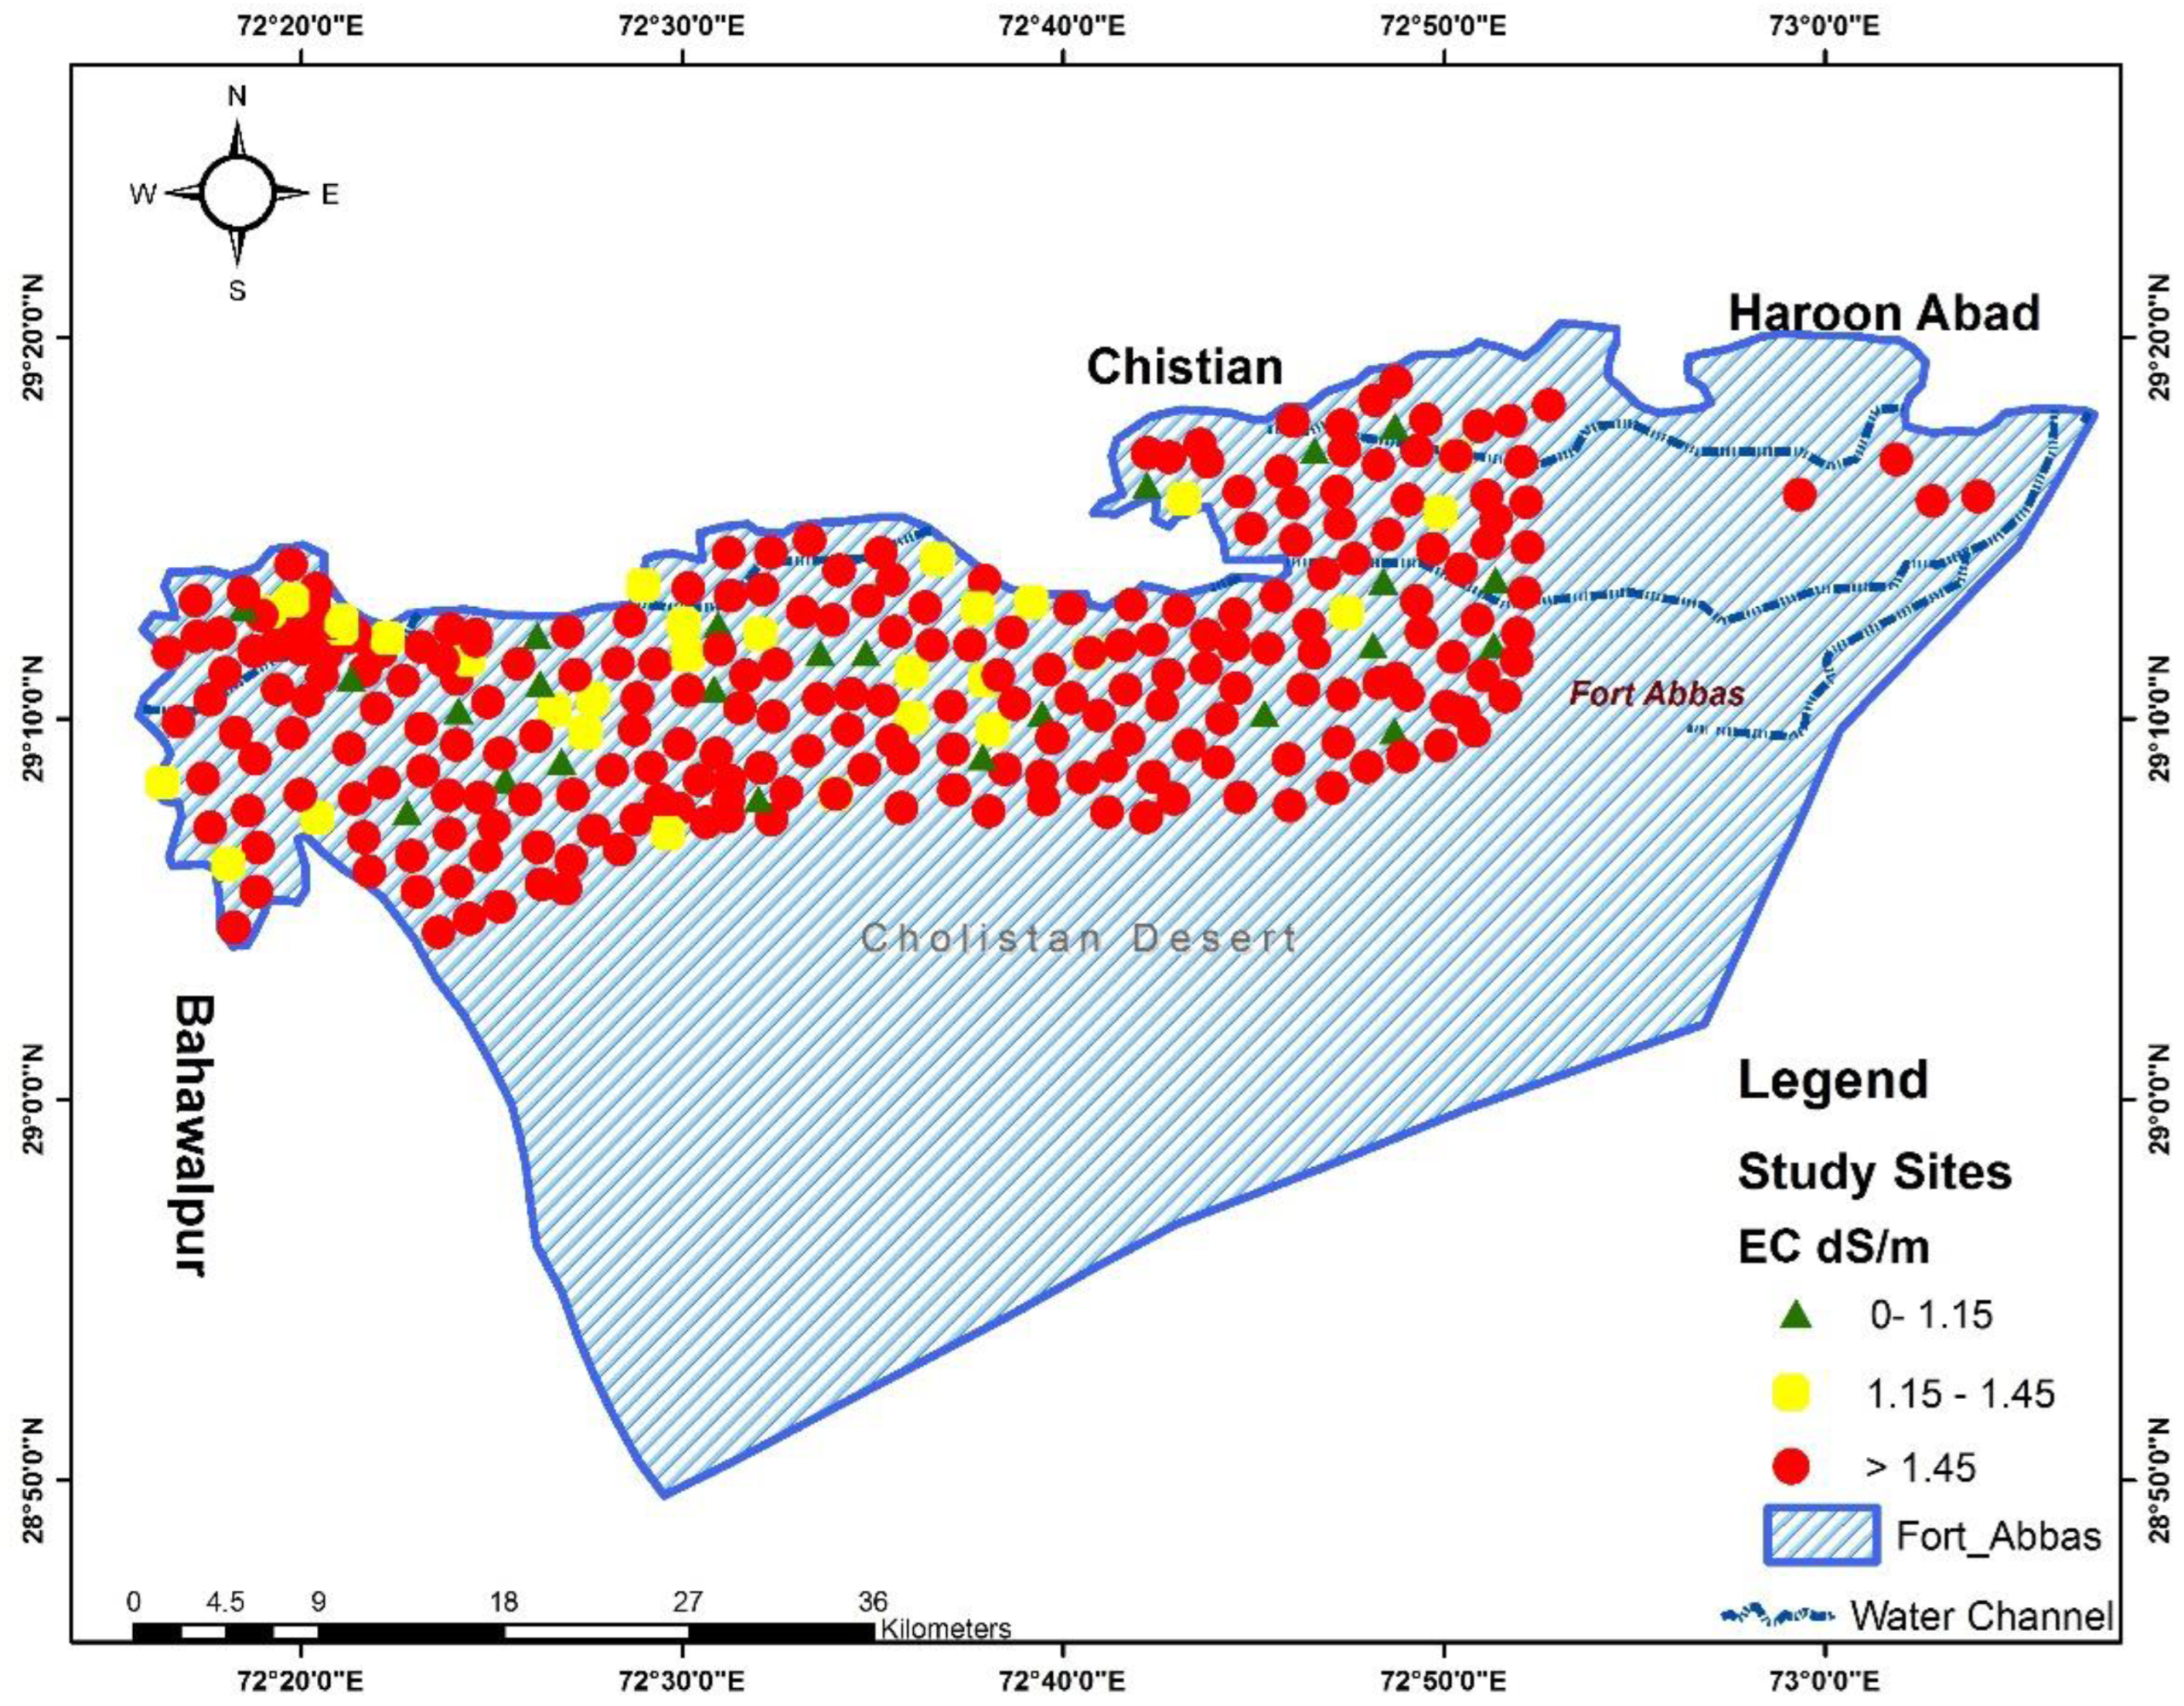
3.1. Electrical Conductivity () Status
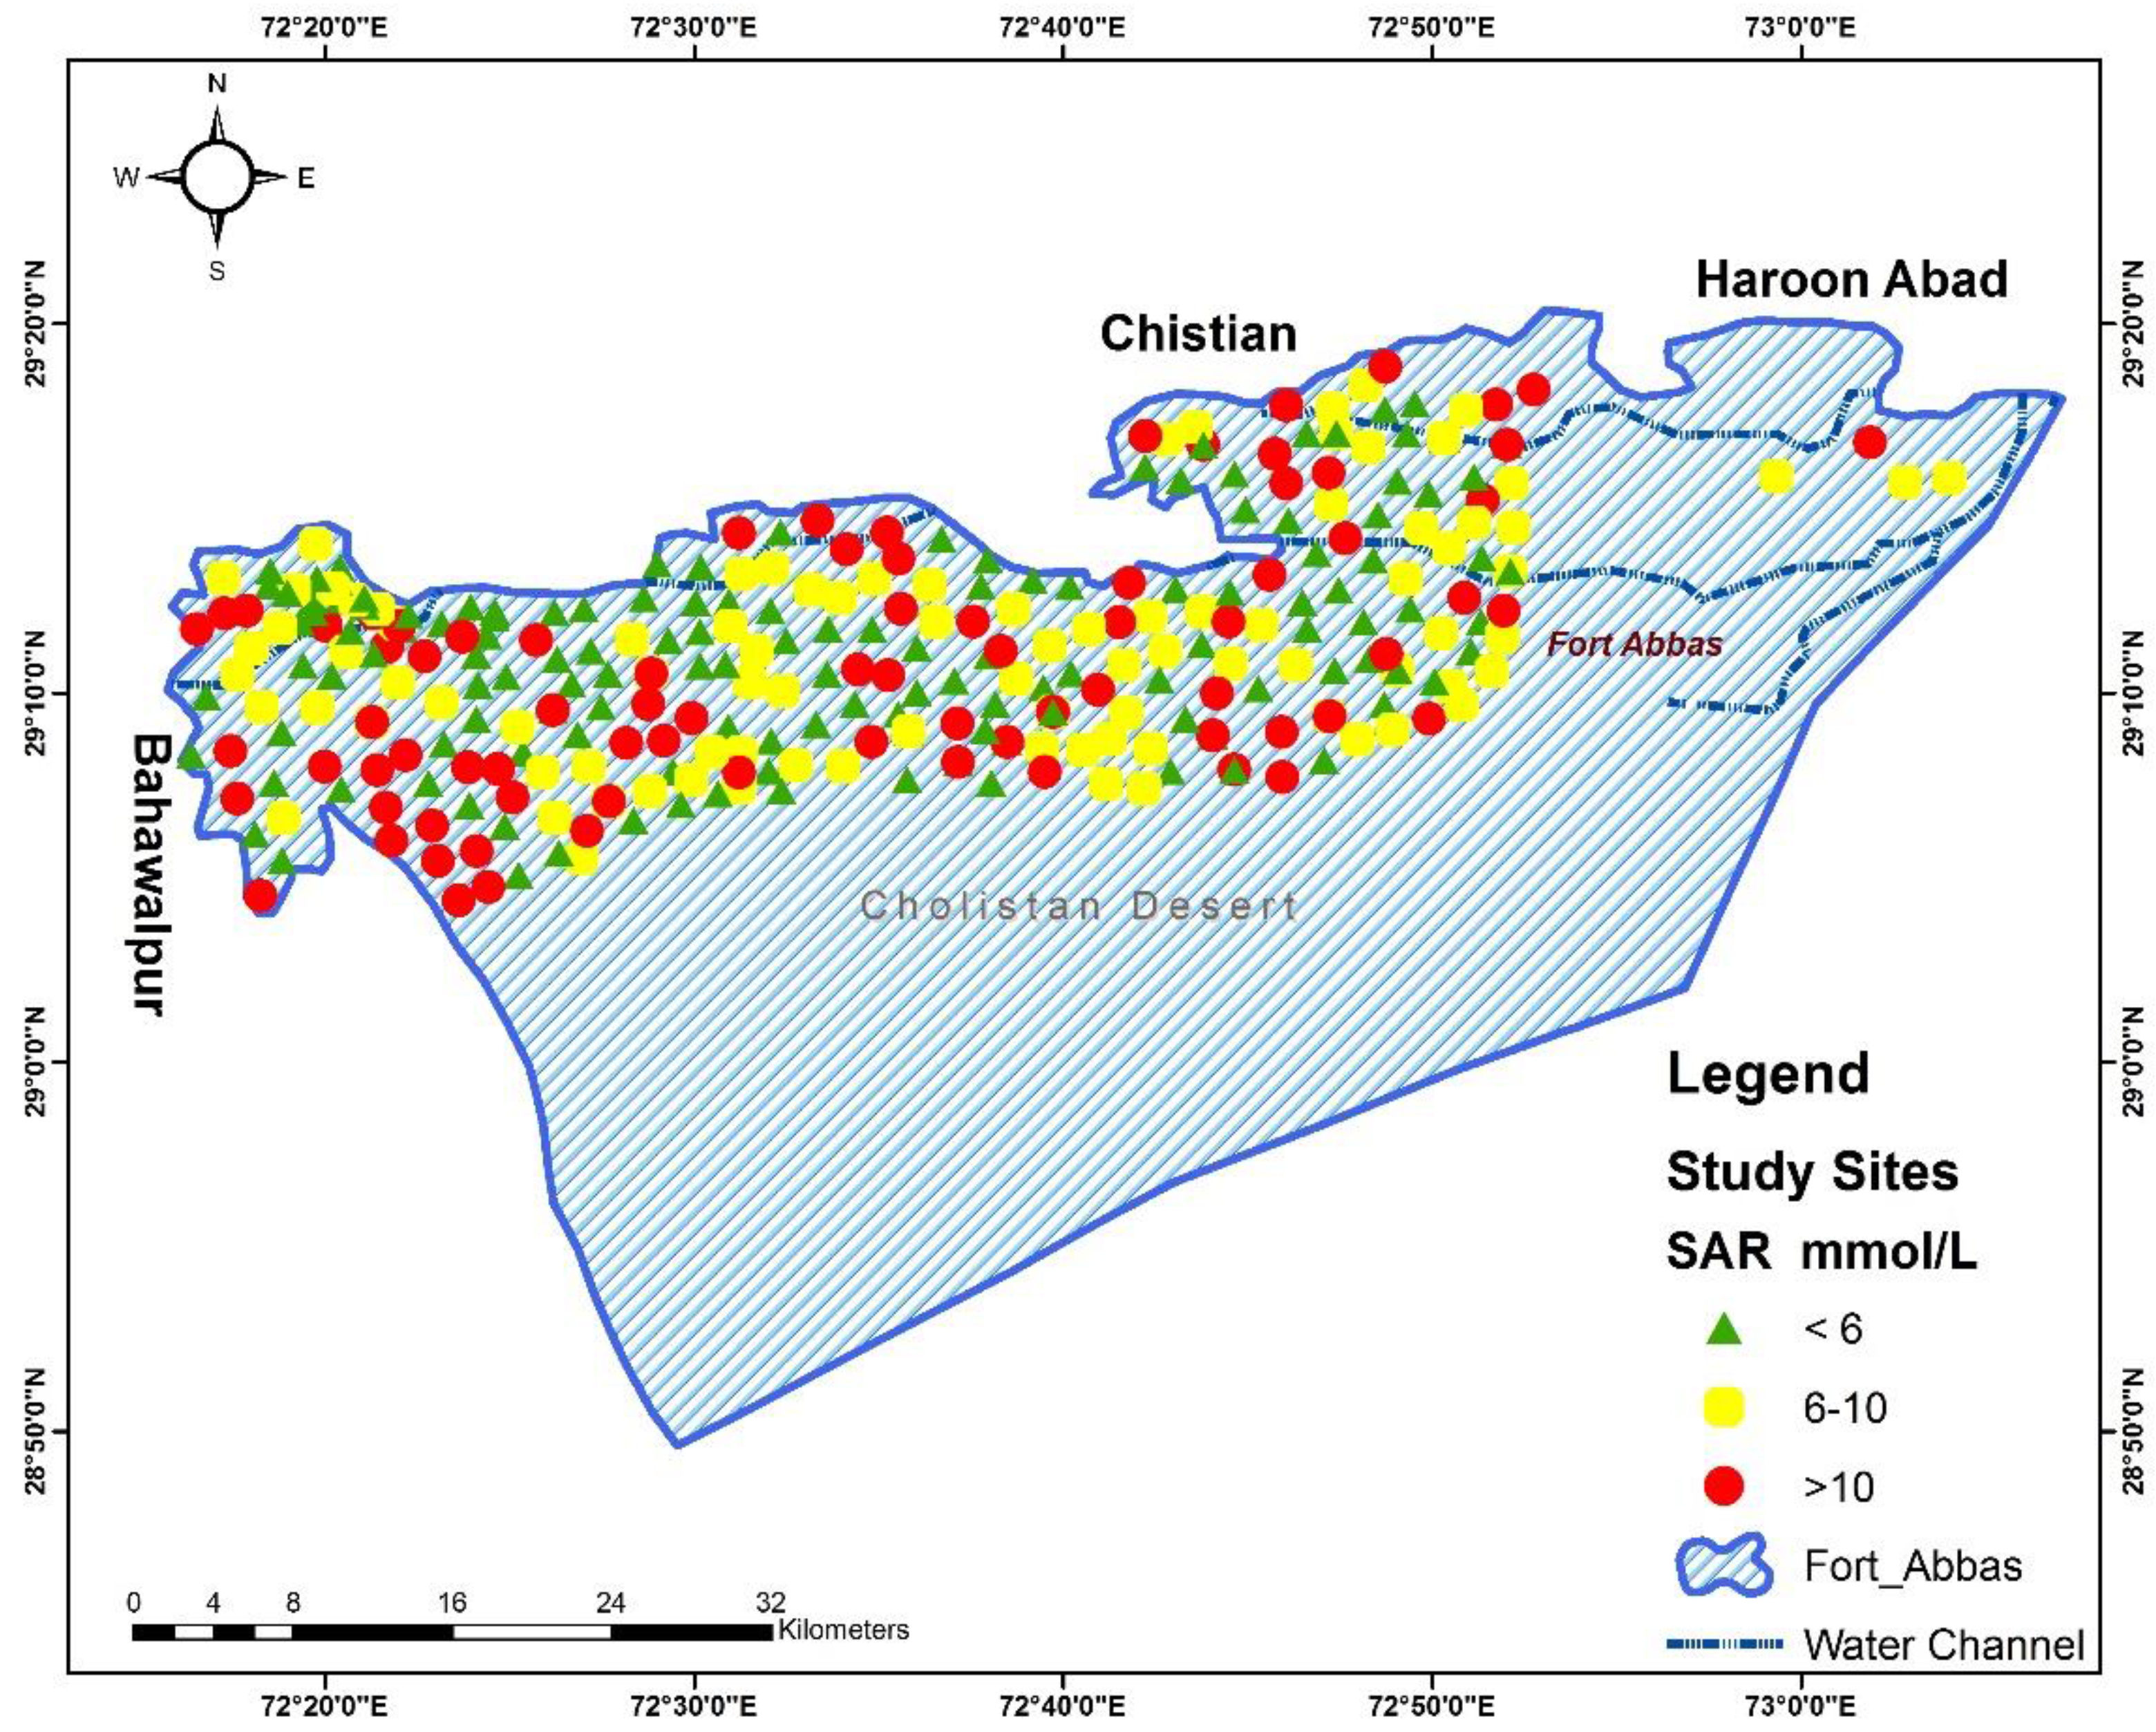
3.2. Sodium Absorption Ratio SAR ()
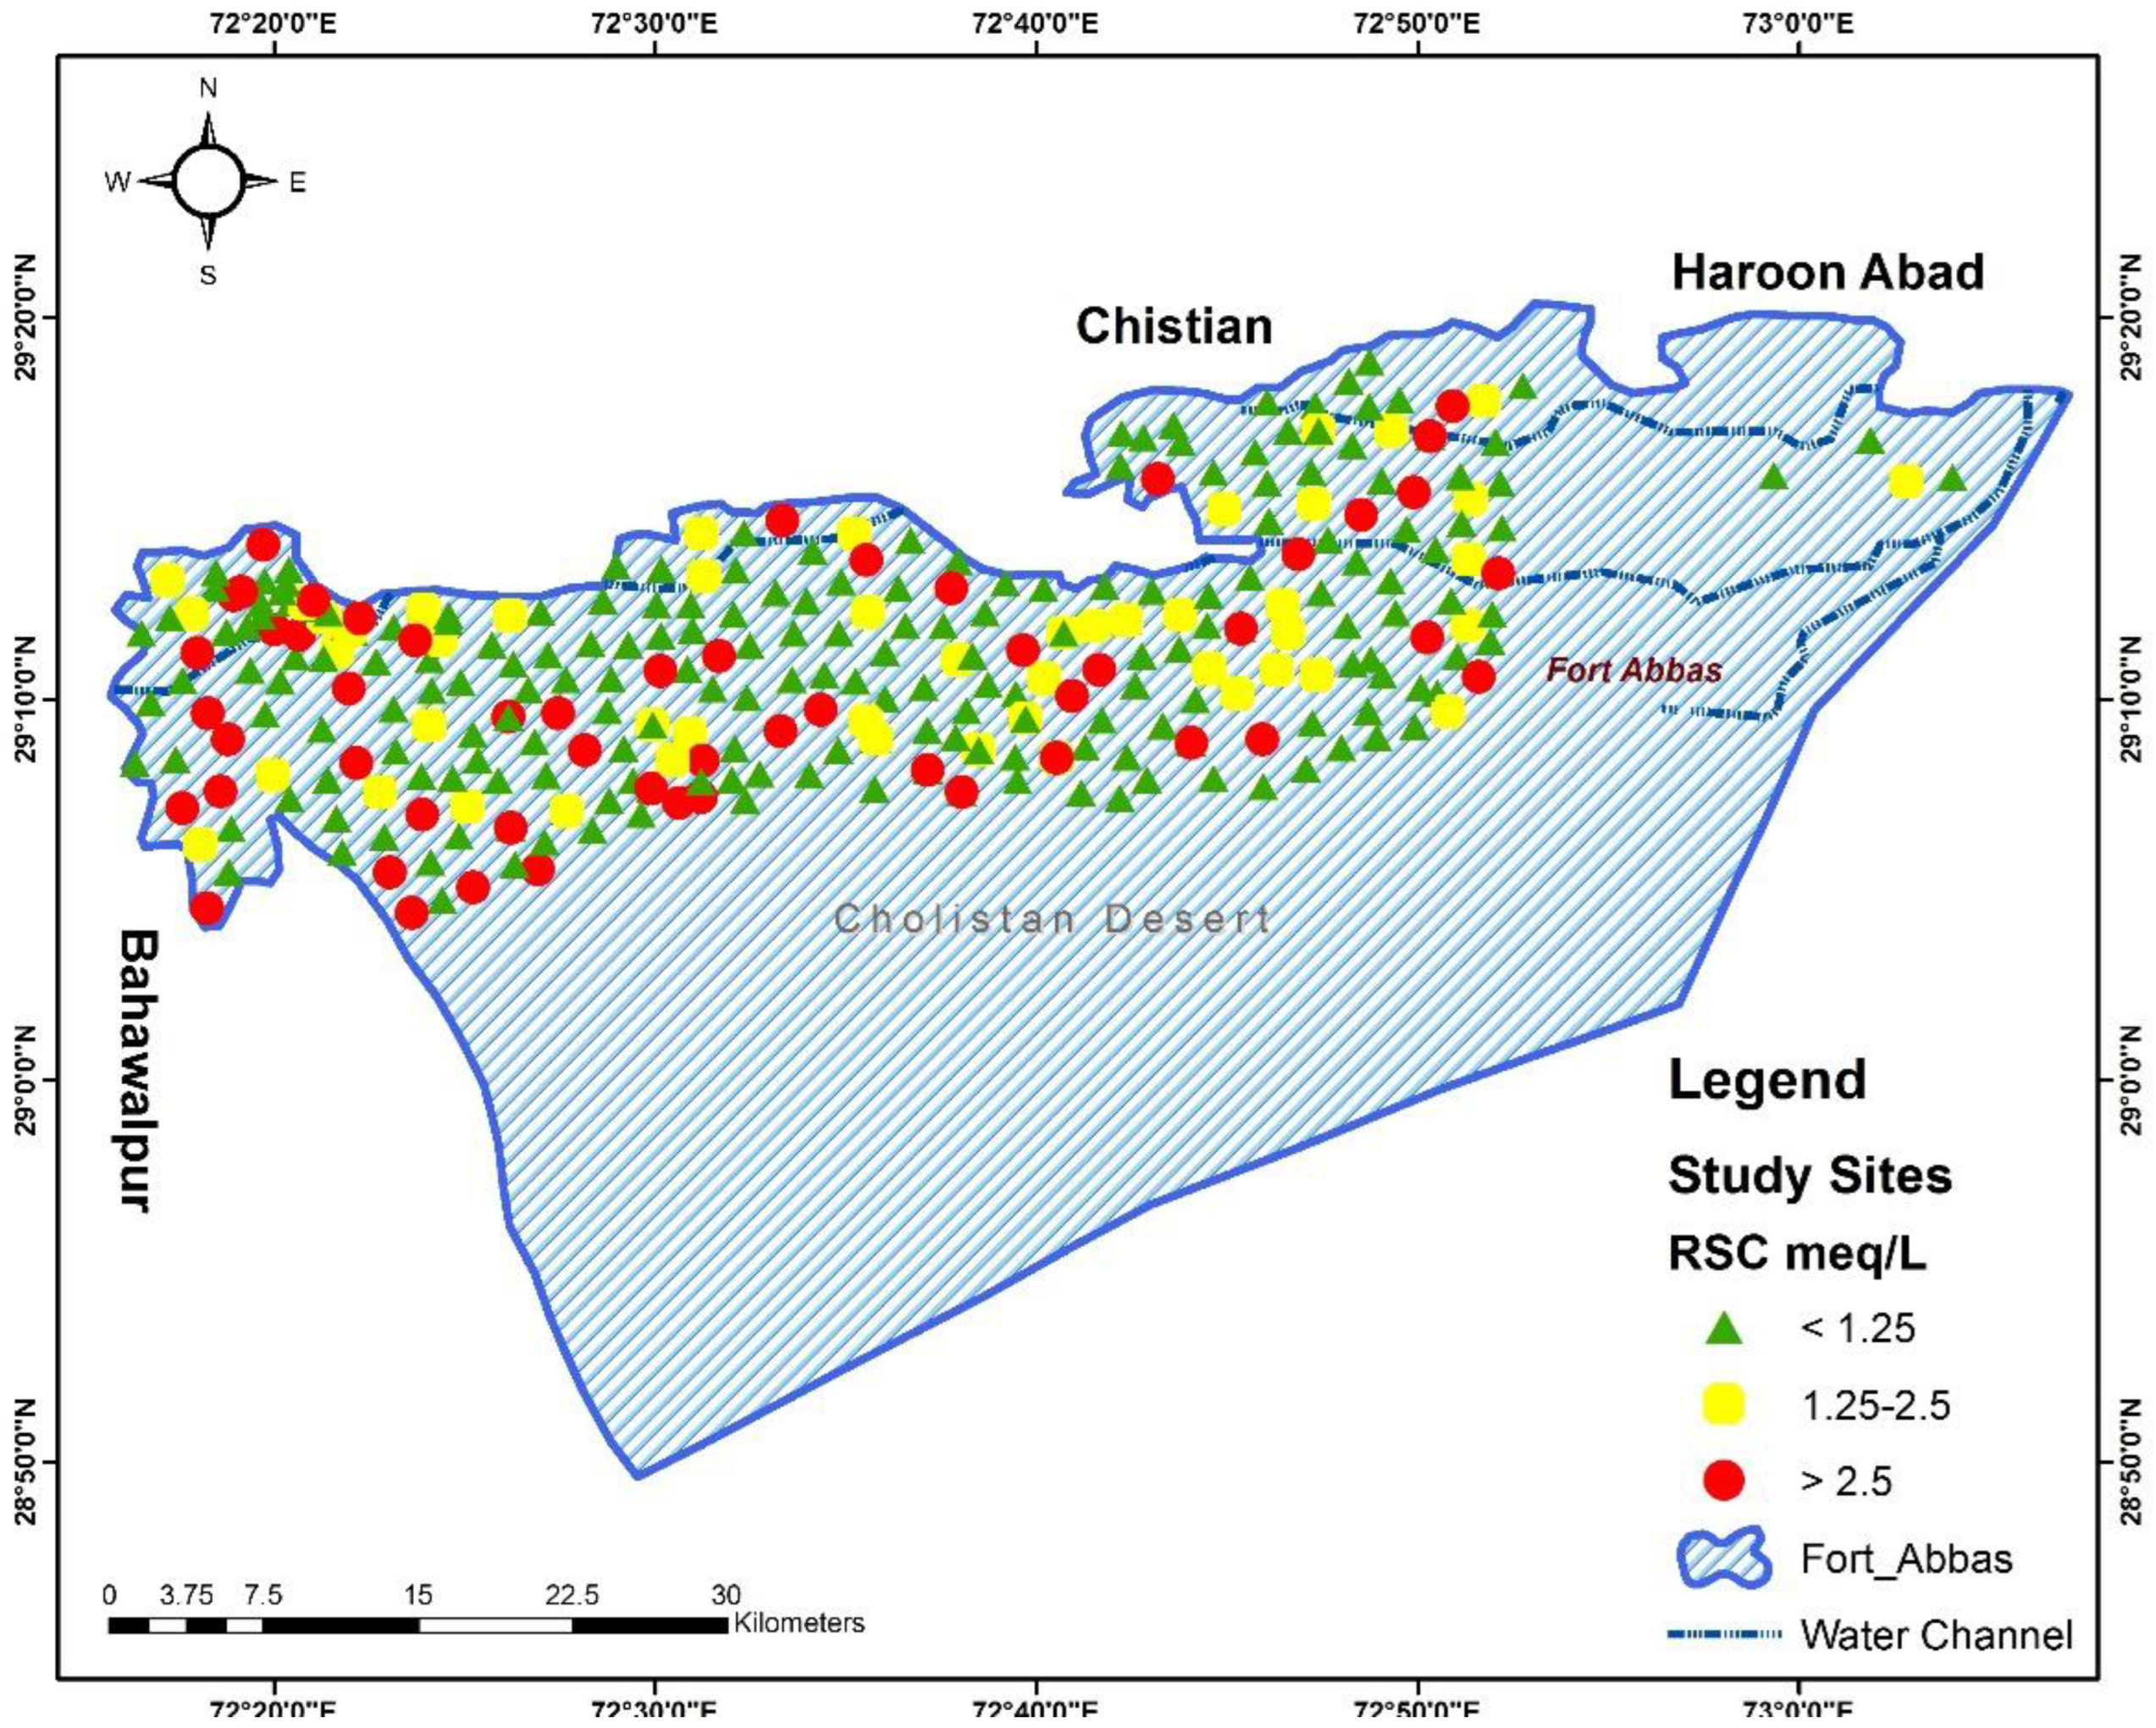
3.3. Ratio of Residual Sodium Carbonate ()
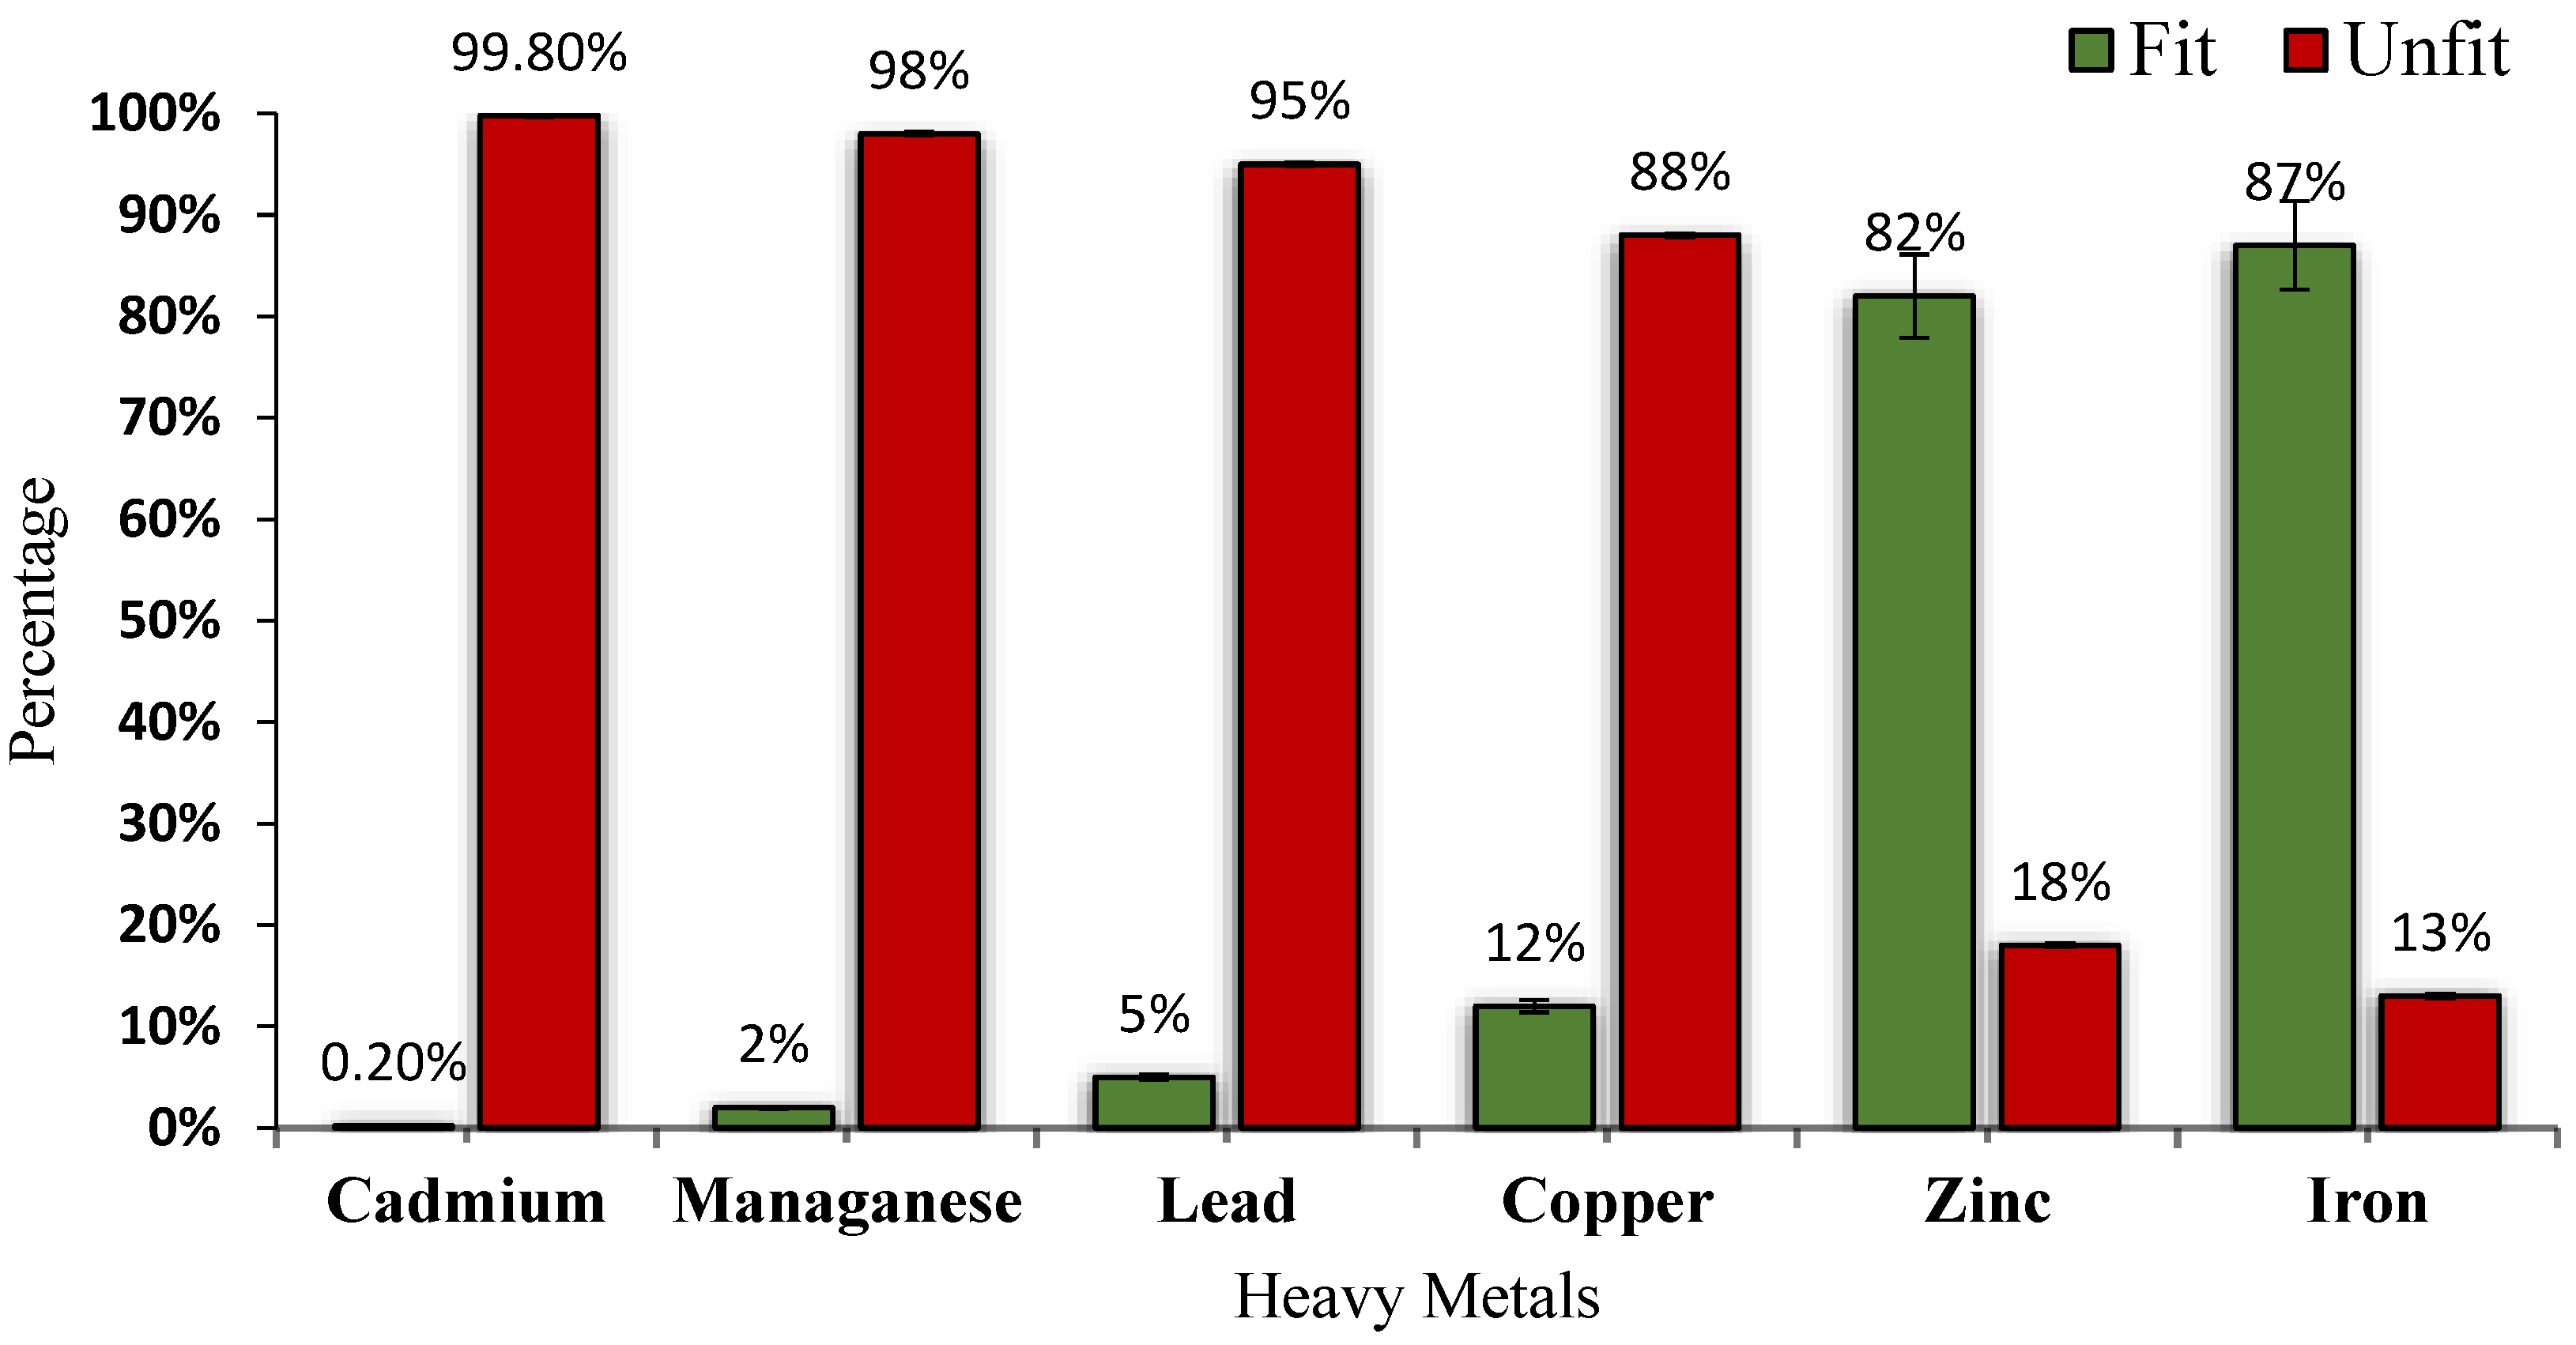
3.4. Metal Analysis of Groundwater
3.5. Effect of Groundwater Quality on Annual Cotton Yield
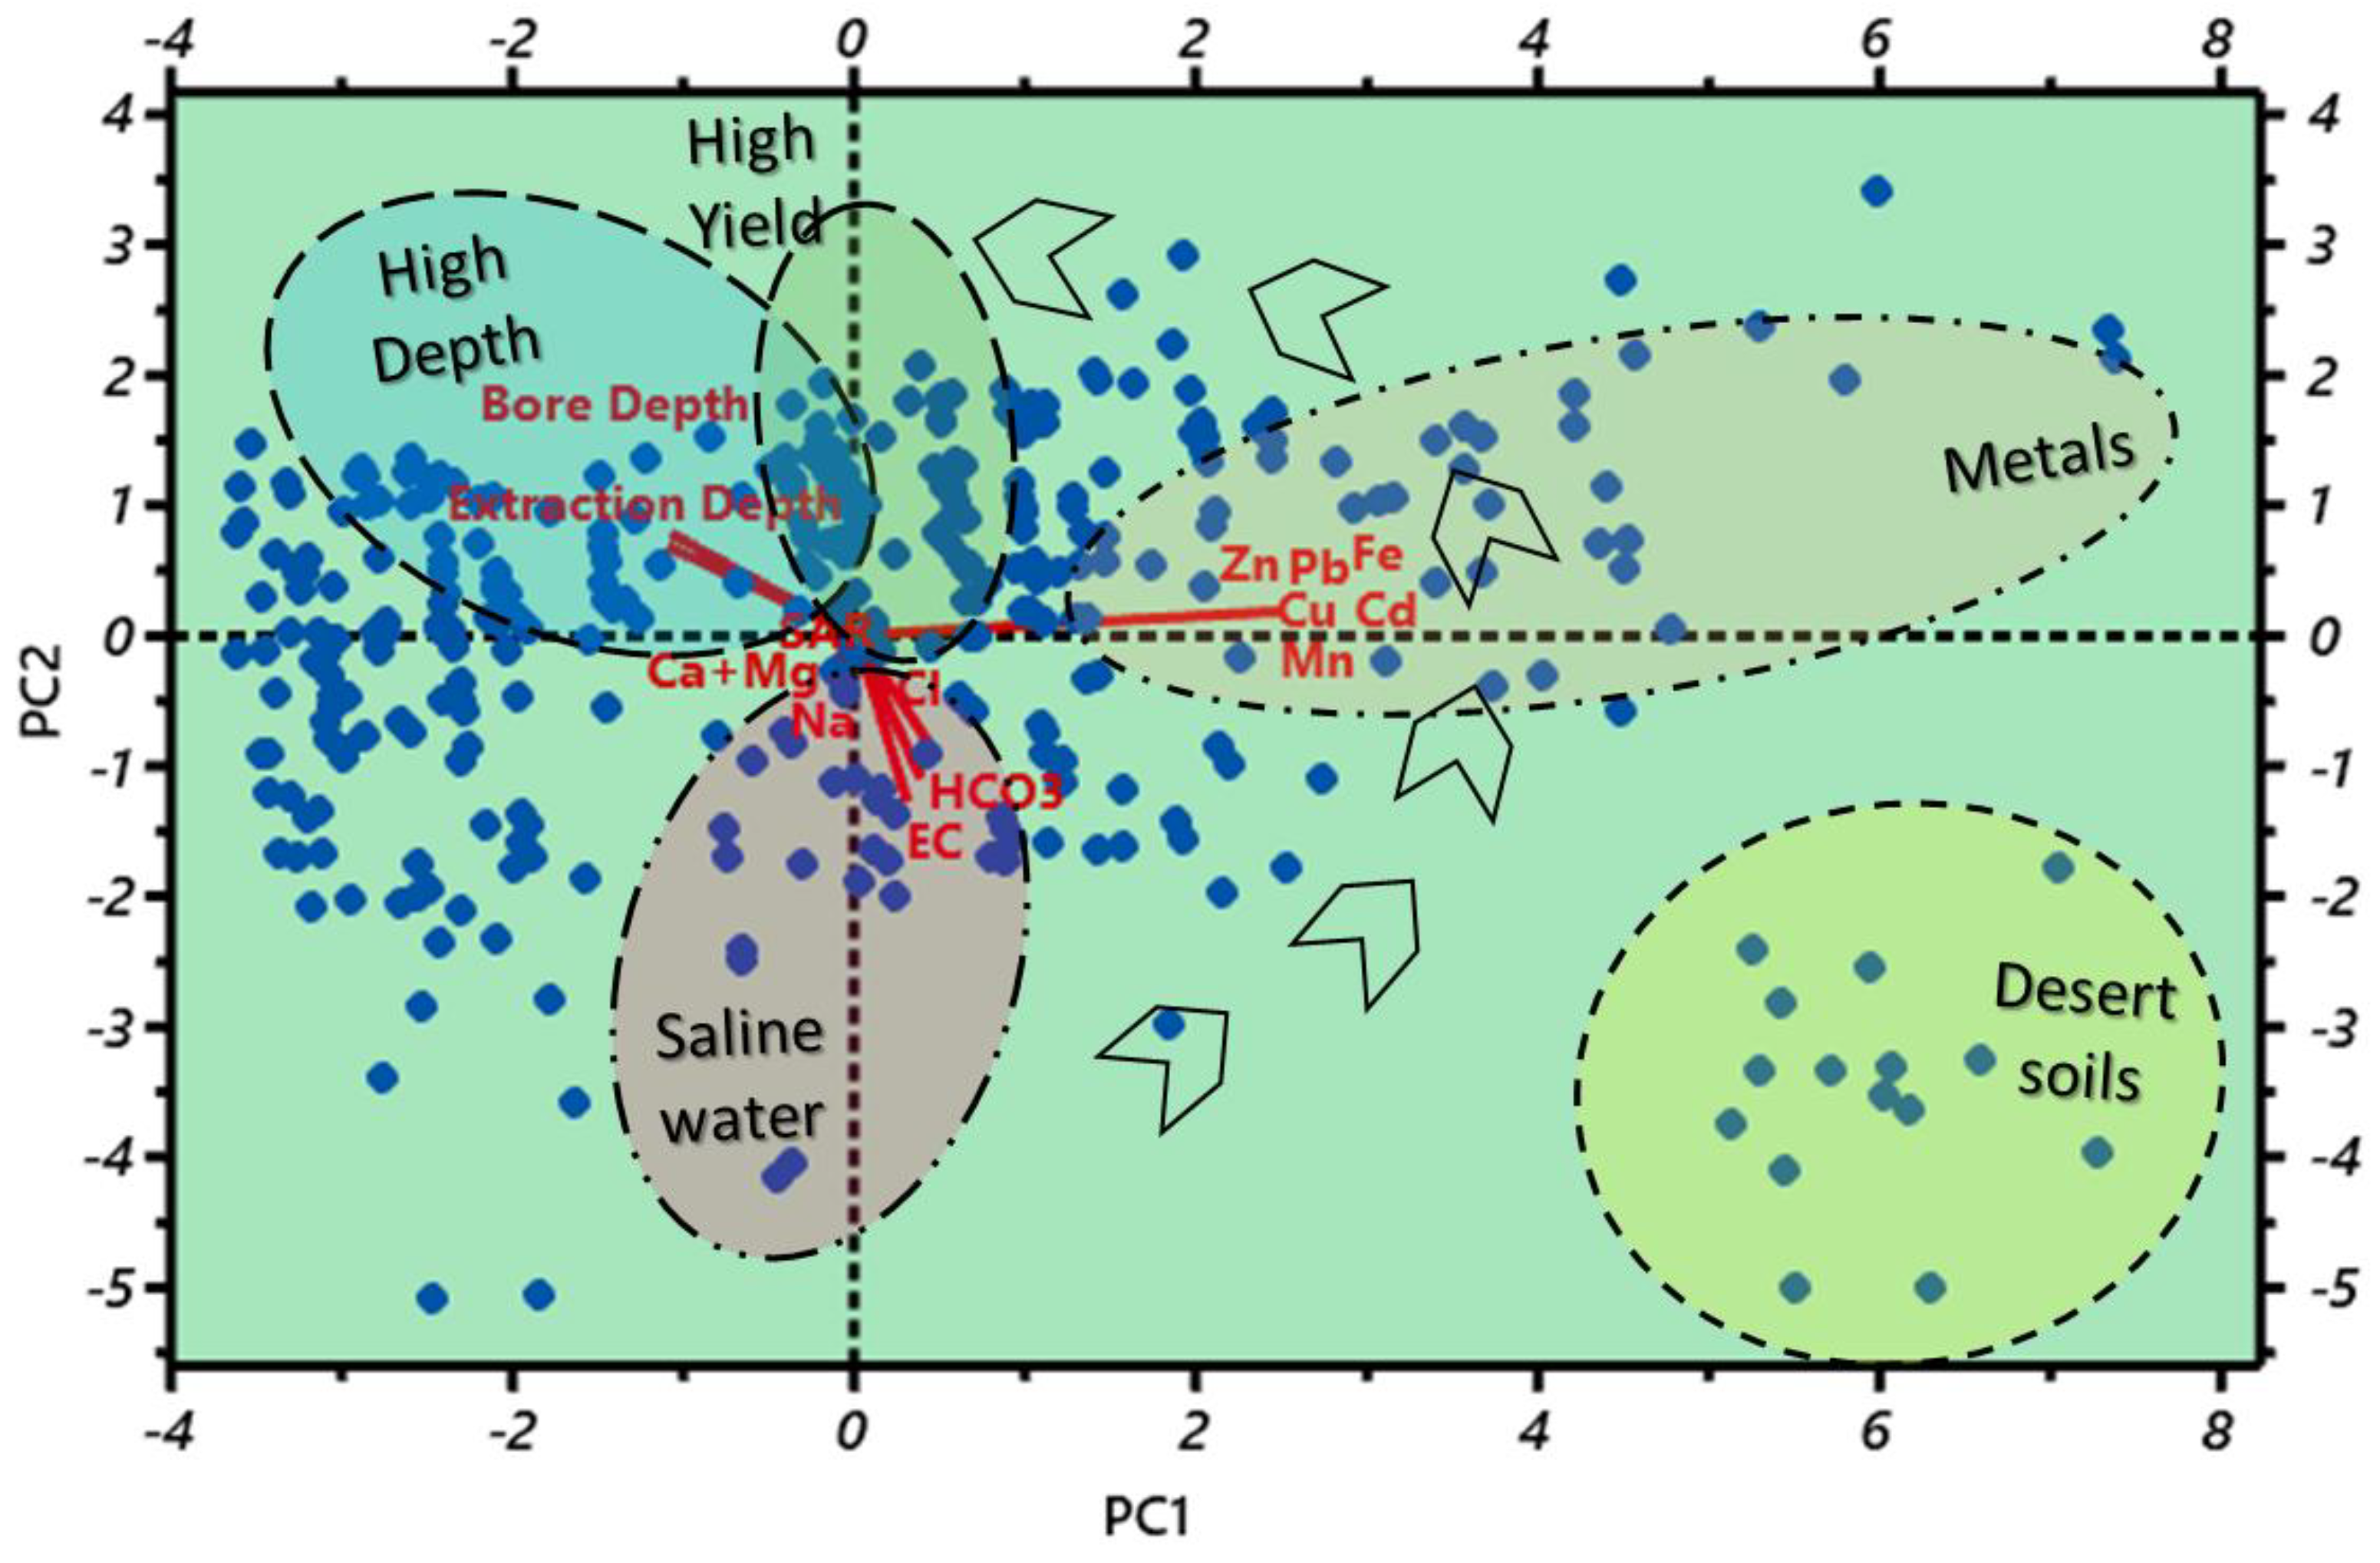
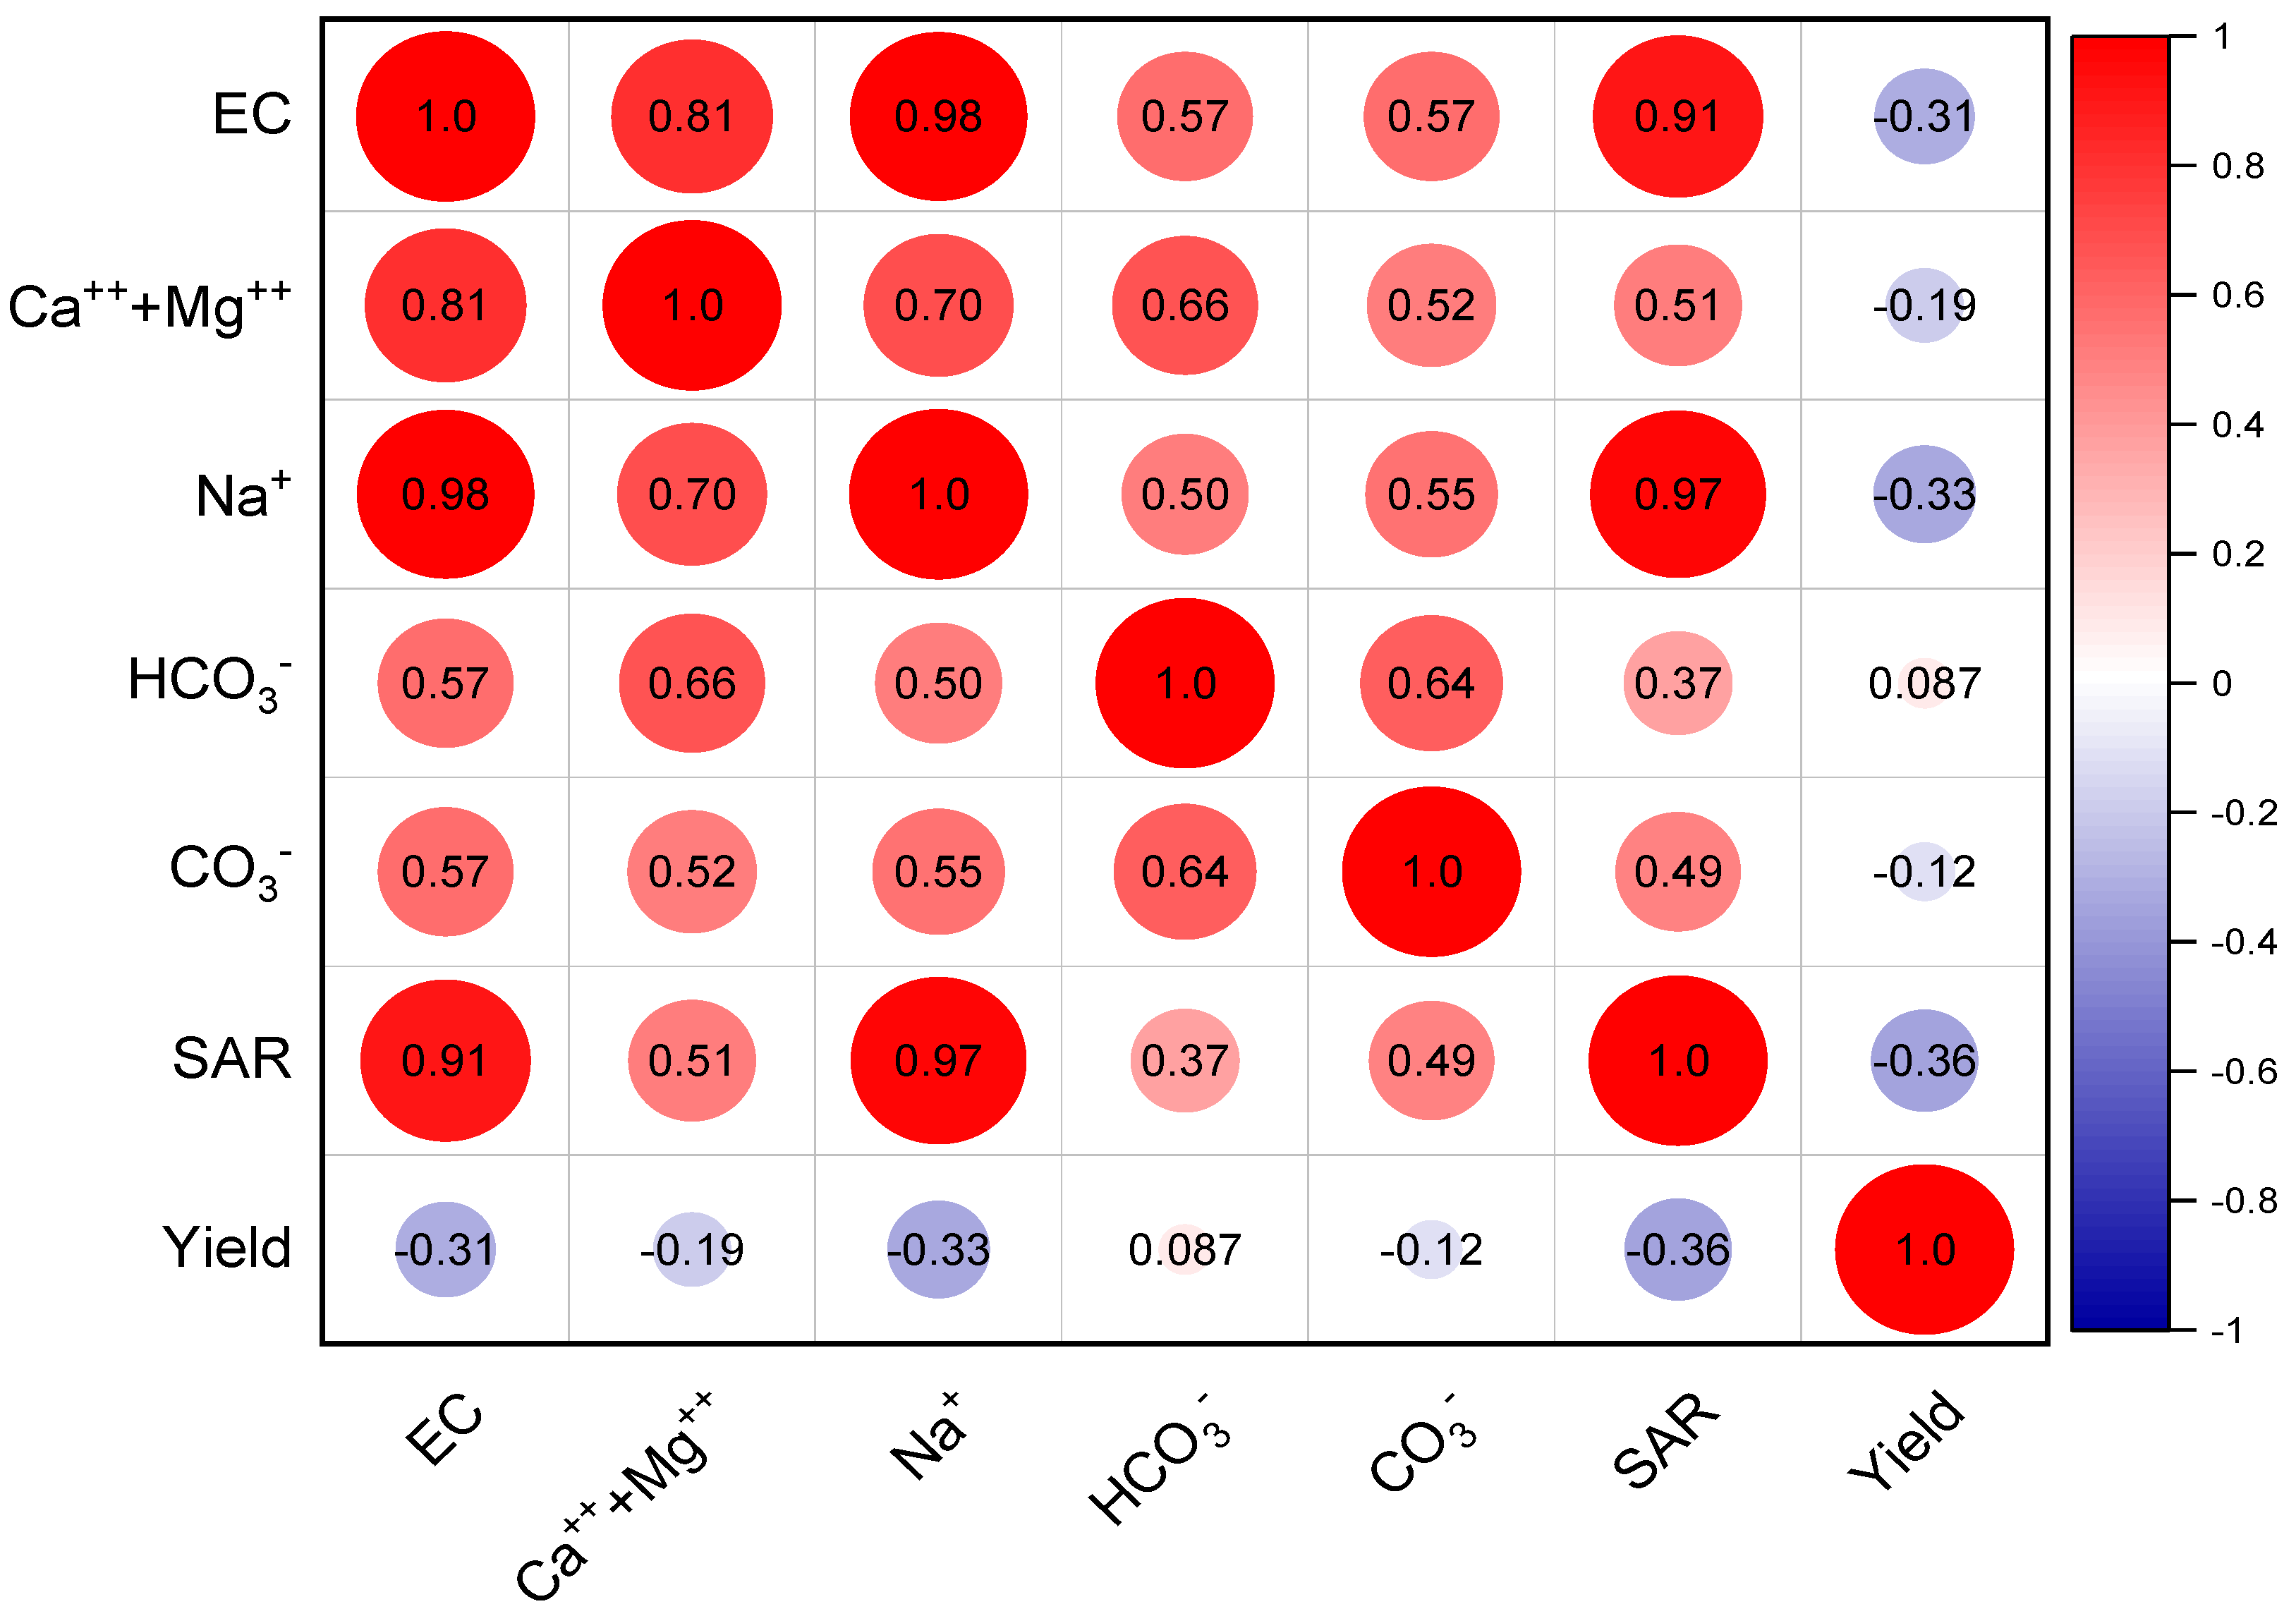
3.6. Principal Component and Correlation Analysis
4. Discussion
4.1. Groundwater Quality in Relation to EC, SAR, RSC
4.2. Groundwater Quality and Heavy Metals
4.3. Groundwater Quality and Cotton Yield
5. Conclusions
Author Contributions
Funding
Institutional Review Board Statement
Informed Consent Statement
Data Availability Statement
Acknowledgments
Conflicts of Interest
References
- Zuo, Q.; Li, W.; Zhao, H.; Ma, J.; Han, C.; Luo, Z. A Harmony-Based Approach for Assessing and Regulating Human-Water Relationships: A Case Study of Henan Province in China. Water 2021, 13, 32. [Google Scholar] [CrossRef]
- Qureshi, A.S. Groundwater Governance in Pakistan: From Colossal Development to Neglected Management. Water 2020, 12, 3017. [Google Scholar] [CrossRef]
- Ahmad, D.; Afzal, M.; Rauf, A. Flood hazards adaptation strategies: A gender-based disaggregated analysis of farm-dependent Bait community in Punjab, Pakistan. Environ. Dev. Sustain. 2021, 23, 865–886. [Google Scholar] [CrossRef]
- Riaz, U.; Abbas, Z.; Zaman, Q.; Mubashir, M.; Jabeen, M.; Zulqadar, S.A.; Javeid, Z.; Rehman, S.; Ashraf, M.; Qamar, J. Evaluation of ground water quality for irrigation purposes and effect on crop yields: A GIS based study of Bahawalpur. Pak. J. Agric. Res. 2018, 31, 29–36. [Google Scholar] [CrossRef]
- Yang, L.; Ren, Q.; Zheng, K.; Jiao, Z.; Ruan, X.; Wang, Y. Migration of heavy metals in the soil-grape system and potential health risk assessment. Sci. Total Environ. 2022, 806, 150646. [Google Scholar] [CrossRef] [PubMed]
- Aslam, B.; Ismail, S.; Ali, I. A GIS-based DRASTIC model for assessing aquifer susceptibility of Safdarabad Tehsil, Sheikhupura District, Punjab Province, Pakistan. Model. Earth Syst. Environ. 2020, 6, 995–1005. [Google Scholar] [CrossRef]
- Shahzad, A.N.; Qureshi, M.K.; Wakeel, A.; Misselbrook, T. Crop production in Pakistan and low nitrogen use efficiencies. Nat. Sustain. 2019, 7, 86–91. [Google Scholar] [CrossRef]
- Hopmans, J.W.; Qureshi, A.; Kisekka, I.; Munns, R.; Grattan, S.; Rengasamy, P.; Ben-Gal, A.; Assouline, S.; Javaux, M.; Minhas, P.; et al. Critical knowledge gaps and research priorities in global soil salinity. Adv. Agron. 2021, 169, 1–191. [Google Scholar]
- Shen, B.; Wu, J.; Zhan, S.; Jin, M.; Saparov, A.S.; Abuduwaili, J. Spatial variations and controls on the hydrochemistry of surface waters across the Ili-Balkhash Basin, arid Central Asia. J. Hydrol. 2021, 600, 126565. [Google Scholar] [CrossRef]
- Ram, A.; Tiwari, S.K.; Pandey, H.K.; Chaurasia, A.K.; Singh, S.; Singh, Y.V. Groundwater quality assessment using water quality index (WQI) under GIS framework. Appl. Water Sci. 2021, 11, 46. [Google Scholar] [CrossRef]
- Noreen, M.; Younes, I. Appraisal of Water Quality Measurements for Canal and Tube Well Water Systems for Agriculture Irrigation in Rechna Doab, Pakistan. Int. J. Econ. Environ. Geol. 2021, 12, 60–66. [Google Scholar] [CrossRef]
- Qureshi, A.S.; Perry, C. Managing water and salt for sustainable agriculture in the Indus Basin of Pakistan. Sustainability 2021, 13, 5303. [Google Scholar] [CrossRef]
- Khan, M.A.; Wahid, A.; Ahmad, M.; Tahir, M.T.; Ahmad, M.; Ahmad, S.; Hasanuzzaman, M. World Cotton Production and Consumption: An Overview. In Cotton Production and Uses; Ahmad, S., Hasanuzzaman, M., Eds.; Springer: Singapore, 2020; pp. 1–7. [Google Scholar]
- Abbas, G.; Ali, A.; Khan, M.; Mahmood, H.Z.; Wahab, S.A.; Amir-Ud-Din, R. The Transition from Arid Farming Systems to Agroforestry Systems in Pakistan: A Comparison of Monetary Returns. Small-Scale For. 2021, 20, 325–350. [Google Scholar] [CrossRef]
- Forstner, V.; Groh, J.; Vremec, M.; Herndl, M.; Vereecken, H.; Gerke, H.H.; Pütz, T. Response of water balance components to climate change in permanent grassland soil ecosystems. Hydrol. Earth Syst. Sci. Discuss. 2021, 2021, 1–30. [Google Scholar]
- Badeenezhad, A.; Radfard, M.; Abbasi, F.; Jurado, A.; Bozorginia, M.; Jalili, M.; Soleimani, H. Effect of land use changes on non-carcinogenic health risks due to nitrate exposure to drinking groundwater. Environ. Sci. Pollut. Res. 2021, 28, 41937–41947. [Google Scholar] [CrossRef] [PubMed]
- Priyan, K. Issues and challenges of groundwater and surface water management in semi-arid regions. In Groundwater Resources Development and Planning in the Semi-Arid Region; Springer: Cham, Switzerland, 2021; pp. 1–17. [Google Scholar]
- Rusydi, A.F.; Onodera, S.I.; Saito, M.; Hyodo, F.; Maeda, M.; Sugianti, K.; Wibawa, S. Potential Sources of Ammonium-Nitrogen in the Coastal Groundwater Determined from a Combined Analysis of Nitrogen Isotope, Biological and Geological Parameters, and Land Use. Water 2021, 13, 25. [Google Scholar] [CrossRef]
- Hailu, B.; Mehari, H. Impacts of Soil Salinity/Sodicity on Soil-Water Relations and Plant Growth in Dry Land Areas: A Review. J. Nat. Sci. Res. 2021, 12, 1–10. [Google Scholar]
- Nasir, J.; Ashfaq, M.; Baig, I.A.; Punthakey, J.F.; Culas, R.; Ali, A.; Hassan, F.U. Socioeconomic Impact Assessment of Water Resources Conservation and Management to Protect Groundwater in Punjab, Pakistan. Water 2021, 13, 2672. [Google Scholar] [CrossRef]
- Syed, A.; Sarwar, G.; Shah, S.H.; Muhammad, S. Soil salinity research in 21st century in Pakistan: Its impact on availability of plant nutrients, growth and yield of crops. Commun. Soil Sci. Plant Anal. 2021, 52, 183–200. [Google Scholar] [CrossRef]
- Farid, H.U.; Ayub, H.U.; Khan, Z.M.; Ahmad, I.; Anjum, M.N.; Kanwar, R.M.A.; Sakinder, P. Groundwater quality risk assessment using hydro-chemical and geospatial analysis. Environ. Dev. Sustain. 2022, 1–23. [Google Scholar] [CrossRef]
- Maplandia.com. Fort Abbas Map. 2020. Available online: http://www.maplandia.com/pakistan/punjab/bahawalnagar/fort-abbas/ (accessed on 13 April 2018).
- Qureshi, A.L.; Kori, S.M.; Pathan, W.W.; Kori, A.R.; Mahessar, A.A. Demarcation of Groundwater Quantum and Quality of Lower Indus Basin: A Case Study of Seri and Muhammad Khan Distributaries. J. Water Environ. Technol. 2022, 20, 95–106. [Google Scholar] [CrossRef]
- Ahmad, T.I.; Khan, R.E.; Soharwardi, M.A.; Shafiq, M.N.; Gillani, S. Socioeconomics and agronomy of wheat yield in cotton-wheat cropping system in Punjab, Pakistan: A quality-quantity assessment. Int. J. Agric. Ext. 2021, 9, 69–78. [Google Scholar]
- Richards, L.A. Diagnosis and improvement of saline and alkali soils, U.S. Salinity Laboratory Staff. In USDA Handbook; USDA: Washington, DC, USA, 1954; Volume 60, p. 160. [Google Scholar]
- Steel, R.G.D.; Torrie, D.H.; Dickey, D.A. Principles and Procedures of Statistics. A Biometrical Approach, 3rd ed.; McGraw Hill Book Co.: New York, NY, USA, 1997; Volume 2, pp. 119–133. [Google Scholar]
- Abdelhafez, A.A.; Metwalley, S.M.; Abbas, H.H. Irrigation: Water resources, types and common problems in Egypt. In Technological and Modern Irrigation Environment in Egypt; Springer: Cham, Switzerland, 2020; pp. 15–34. [Google Scholar]
- Ayers, R.S.; Westcot, D.W. Water Quality for Agriculture. FAO Irrigation and Drainage Paper 29. Rev. 1; FAO United Nations: Rome, Italy, 1985; p. 174. [Google Scholar]
- Hammam, A.A.; Mohamed, E.S. Mapping soil salinity in the East Nile Delta using several methodological approaches of salinity assessment. Egypt. J. Remote Sens. Space Sci. 2020, 23, 125–131. [Google Scholar] [CrossRef]
- Akhter, N.; Aqeel, M.; Shahnaz, M.M.; Alnusairi, G.S.; Alghanem, S.M.; Kousar, A.; Hashem, M.; Kanwal, H.; Alamri, S.; Ilyas, A.; et al. Physiological homeostasis for ecological success of Typha (Typha domingensis Pers.) populations in saline soils. Physiol. Mol. Biol. Plants 2021, 27, 687–701. [Google Scholar] [CrossRef]
- Bodale, I.; Mihalache, G.; Achiţei, V.; Teliban, G.C.; Cazacu, A.; Stoleru, V. Evaluation of the Nutrients Uptake by Tomato Plants in Different Phenological Stages Using an Electrical Conductivity Technique. Agriculture 2021, 11, 292. [Google Scholar] [CrossRef]
- Jehan, S.; Ullah, I.; Khan, S.; Muhammad, S.; Khattak, S.A.; Khan, T. Evaluation of the Swat River, Northern Pakistan, water quality using multivariate statistical techniques and water quality index (WQI) model. Environ. Sci. Pollut. Res. 2020, 27, 38545–38558. [Google Scholar] [CrossRef]
- Corwin, D.L.; Scudiero, E. Review of soil salinity assessment for agriculture across multiple scales using proximal and/or remote sensors. Adv. Agron. 2019, 158, 1–130. [Google Scholar]
- Singh, A. Salinization and drainage problems of agricultural land. Irrig. Drain. 2020, 69, 844–853. [Google Scholar] [CrossRef]
- Hendawy, E.; Belal, A.A.; Mohamed, E.S.; Elfadaly, A.; Murgante, B.; Aldosari, A.A.; Lasaponara, R. The prediction and assessment of the impacts of soil sealing on agricultural land in the North Nile Delta (Egypt) using satellite data and GIS modeling. Sustainability 2019, 11, 4662. [Google Scholar] [CrossRef]
- Abbas, A.M.; Abd-Elmabod, S.K.; El-Ashry, S.M.; Soliman, W.S.; El-Tayeh, N.; Castillo, J.M. Capability of the invasive tree Prosopis glandulosa Torr. to remediate soil treated with sewage sludge. Sustainability 2019, 11, 2711. [Google Scholar] [CrossRef]
- Ullah, S.; Ai, C.; Huang, S.; Song, D.; Abbas, T.; Zhang, J.; He, P. Substituting ecological intensification of agriculture for conventional agricultural practices increased yield and decreased nitrogen losses in North China. Appl. Soil Ecol. 2020, 147, 103395. [Google Scholar] [CrossRef]
- Makki, Z.F.; Zuhaira, A.A.; Al-Jubouri, S.M.; Al-Hamd, R.K.S.; Cunningham, L.S. GIS-based assessment of groundwater quality for drinking and irrigation purposes in central Iraq. Environ. Monit. Assess. 2021, 193, 107. [Google Scholar] [CrossRef] [PubMed]
- Samtio, M.S.; Rajper, K.H.; Mastoi, A.S.; Sadaf, R.; Rajper, R.H.; Hakro, A.A.; Lanjwani, M.F. Hydrochemical assessment of groundwater from taluka Dahili, Thar Desert, Pakistan, for irrigation purpose using water quality indices. Int. J. Environ. Anal. Chem. 2021, 1–17. [Google Scholar] [CrossRef]
- Siddique, A.; Waseem, M.; Haq, F.U.; Sattar, M.N.; Khan, N.M. Statistical modelling of drought and groundwater quality nexus. In Book of Abstracts; International Conference on Energy, Water and Environment – ICEWE-2021; University of Engineering and Technology: Lahore, Pakistan, 2021; p. 436. [Google Scholar]
- Duy Thanh, L.; Jougnot, D.; Van Do, P.; Van Nghia, A.N. A physically based model for the electrical conductivity of water-saturated porous media. Geophys. J. Int. 2019, 219, 866–876. [Google Scholar] [CrossRef]
- Kadam, A.; Wagh, V.; Jacobs, J.; Patil, S.; Pawar, N.; Umrikar, B.; Sankhua, R.; Kumar, S. Integrated approach for the evaluation of groundwater quality through hydro geochemistry and human health risk from Shivganga river basin, Pune, Maharashtra, India. Environ. Sci. Pollut. Res. 2022, 29, 4311–4333. [Google Scholar] [CrossRef]
- Chen, R.; Liu, L.; Li, Y.; Zhai, Y.; Chen, H.; Hu, B.; Zhang, Q.; Teng, Y. Characteristics of Hydro-Geochemistry and Groundwater Pollution in Songnen Plain in Northeastern China. Sustainability 2022, 14, 6527. [Google Scholar] [CrossRef]
- Khan, S.; Guan, Y.; Khan, F.; Khan, Z. A Comprehensive Index for Measuring Water Security in an Urbanizing World: The Case of Pakistan’s Capital. Water 2020, 12, 166. [Google Scholar] [CrossRef]
- Kubier, A.; Wilkin, R.T.; Pichler, T. Cadmium in soils and ground-water: A review. J. Appl. Geochem. 2019, 539, 125–134. [Google Scholar]
- Charvalas, G.; Solomou, A.D.; Giannoulis, K.D.; Skoufogianni, E.; Bartzialis, D.; Emmanouil, C.; Danalatos, N.G. Determination of heavy metals in the territory of contaminated areas of Greece and their restoration through hyperaccumulators. Environ. Sci. Pollut. Res. 2021, 28, 3858–3863. [Google Scholar] [CrossRef]
- Azam, S.M.R.; Ma, H.; Xu, B.; Devi, S.; Siddique, M.A.B.; Stanley, S.L.; Bhandari, B.; Zhu, J. Efficacy of ultrasound treatment in the removal of pesticide residues from fresh vegetables: A review. Trends Food Sci. Technol. 2020, 97, 417–432. [Google Scholar] [CrossRef]
- Liu, B.; Wang, S.; Kong, X.; Liu, X.; Sun, H. Modeling and assessing feasibility of long-term brackish water irrigation in vertically homogeneous and heterogeneous cultivated lowland in the North China Plain. Agric. Water Manag. 2019, 211, 98–110. [Google Scholar] [CrossRef]
- Di Mola, I.; Conti, S.; Cozzolino, E.; Melchionna, G.; Ottaiano, L.; Testa, A.; Sabatino, L.; Rouphael, Y.; Mori, M. Plant-based protein hydrolysate improves salinity tolerance in Hemp: Agronomical and physiological aspects. Agronomy 2021, 11, 342. [Google Scholar] [CrossRef]
- Che, Z.; Wang, J.; Li, J. Effects of water quality, irrigation amount and nitrogen applied on soil salinity and cotton production under mulched drip irrigation in arid Northwest China. Agric. Water Manag. 2021, 247, 106738. [Google Scholar] [CrossRef]
- Arshad, M.; Awais, M.; Bashir, R.; Ahmad, S.R.; Anwar-Ul-Haq, M.; Senousy, H.H.; Iftikhar, M.; Anjum, M.U.; Ramzan, S.; Alharbi, S.A.; et al. Assessment of wheat productivity responses and soil health dynamics under brackish ground water. Saudi J. Biol. Sci. 2022, 29, 793–803. [Google Scholar] [CrossRef] [PubMed]
- Wei, K.; Zhang, J.; Wang, Q.; Guo, Y.; Mu, W. Irrigation with ionized brackish water affects cotton yield and water use efficiency. Ind. Crops Prod. 2022, 175, 114244. [Google Scholar] [CrossRef]


| No. | Parameters | Fit | Marginal Fit | Unfit |
|---|---|---|---|---|
| 1 | 0 to 1.15 | 1.15 to 1.45 | ||
| 2 | 6 to 10 | |||
| 3 | 1.25 to 2.5 |
| Present Study | Degree of Restriction on Use [28] | |||||||||
|---|---|---|---|---|---|---|---|---|---|---|
| Variables | Range | Mean | S.D. | C.V. | Skew | 1st Quartile | 3rd Quartile | None | S to M | Never |
| EC | 0.62–10.49 | 2.90 | 1.68 | 58.05 | 1.24 | 1.72 | 4.13 | <0.7 | 0.7–3.0 | >3.0 |
| Ca + Mg | 1.48–1919.0 | 19.06 | 115.89 | 607.87 | 14.61 | 7.10 | 12.06 | - | - | - |
| Bicarbonates | 4.08–17.40 | 8.25 | 2.35 | 28.54 | 0.57 | 6.42 | 9.88 | <1.5 | 1.5–8.5 | >8.5 |
| Sodium | 1.18–1957.0 | 23.57 | 104.91 | 445.07 | 18.11 | 8.56 | 24.80 | <3 | 3–9 | >9 |
| Cl | 0.12–40.0 | 3.31 | 3.08 | 93.01 | 5.64 | 1.92 | 4.12 | <4 | 4–10 | >10 |
| SAR | 0.65–483.0 | 9.03 | 25.93 | 287.19 | 17.66 | 4.32 | 10.55 | >0.7 | 0.7–0.2 | >0.2 |
| RSC | 0.00–5.44 | 0.39 | 1.02 | 263.44 | 3.05 | 0.00 | 0.00 | <1.5 | 1.50–2.50 | >2.50 |
| Cd | 0.01–3.25 | 1.03 | 0.69 | 67.43 | 0.52 | 0.36 | 3.25 | - | - | >0.01 |
| Cu | 0.01–3.25 | 1.03 | 0.70 | 67.38 | 0.52 | 0.36 | 1.45 | - | - | >0.20 |
| Fe | 0.03–9.03 | 2.88 | 1.94 | 67.40 | 0.52 | 1.00 | 4.03 | - | - | >5.0 |
| Zn | 0.01–4.06 | 1.29 | 0.87 | 67.36 | 0.52 | 0.45 | 1.81 | - | - | >2.0 |
| Pb | 0.01–3.36 | 1.07 | 0.72 | 67.39 | 0.51 | 0.37 | 1.50 | - | - | >5.0 |
| Sampling Points | Location in Study Area | No. of Respondents | Average kg/Acre | Water Quality Status |
|---|---|---|---|---|
| Chak no. 316 h/r marot | South Western Side | 36 | 1040 ± 65.32 | Fit |
| Chak no. 329 h/r marot | Western Side | 26 | 760 ± 65.32 | Marginal Fit |
| Chak no. 325 h/r marot | Western Side | 15 | 520 ± 65.32 | Unfit |
| Chak no. 341 h/r marot | Western Side | 17 | 906.67 ± 82.19 | Marginal Fit |
| Chak no. 313 h/r marot | Eastern Side | 18 | 493.4 ± 82.19 | Unfit |
| Chak no. 310 h/r marot | Eastern Side | 12 | 920 ± 97.98 | UnFit |
| Chak no. 338 h/r marot | Southwestern Side | 12 | 866.67 ± 82.19 | Unfit |
| Chak no. 328 h/r marot | Western Side | 16 | 946.67 ± 82.19 | Marginal Fit |
| Chak no. 319 h/r marot | Western Side | 41 | 933.34 ± 67.99 | Marginal Fit |
| Chak no. 314 h/r marot | Eastern Side | 27 | 760 ± 65.32 | Unfit |
| Chak no. 317 h/r marot | Southwestern Side | 32 | 1000 ± 65.32 | Fit |
| Chak no. 326 h/r marot | Western Side | 18 | 733.34 ± 49.9 | Unfit |
| Chak no. 315 h/r marot | Eastern Side | 17 | 826.67 ± 99.8 | Unfit |
| Chak no. 340 h/r marot | Western Side | 2 | 920 ± 97.98 | Unfit |
| Chak no. 318 h/r marot | Western Side | 17 | 960 ± 97.98 | Marginal Fit |
| Chak no. 324 h/r marot | Western Side | 13 | 813.34 ± 82.19 | Unfit |
| Chak no. 204 h/b alif walhar | Eastern Side | 15 | 760 ± 65.32 | Unfit |
| Chak no. 327 h/r marot | Western Side | 3 | 813.34 ± 82.19 | Unfit |
| Chak no. 312 h/r marot | Eastern Side | 9 | 946.67 ± 82.19 | Marginal Fit |
| Chak no. 311 h/r marot | Eastern Side | 1 | 840 ± 86.41 | Unfit |
Publisher’s Note: MDPI stays neutral with regard to jurisdictional claims in published maps and institutional affiliations. |
© 2022 by the authors. Licensee MDPI, Basel, Switzerland. This article is an open access article distributed under the terms and conditions of the Creative Commons Attribution (CC BY) license (https://creativecommons.org/licenses/by/4.0/).
Share and Cite
Hameed, M.R.; Attia, H.; Riaz, U.; Ashraf, K.; Alamer, K.H.; Althobaiti, A.T.; Algethami, B.; Sultan, K.; Khan, A.A.A.; Zaman, Q.u. Consortium between Groundwater Quality and Lint Yield in Cotton Belt Areas. Water 2022, 14, 3136. https://doi.org/10.3390/w14193136
Hameed MR, Attia H, Riaz U, Ashraf K, Alamer KH, Althobaiti AT, Algethami B, Sultan K, Khan AAA, Zaman Qu. Consortium between Groundwater Quality and Lint Yield in Cotton Belt Areas. Water. 2022; 14(19):3136. https://doi.org/10.3390/w14193136
Chicago/Turabian StyleHameed, Muhammad Rashid, Houneida Attia, Umair Riaz, Kamran Ashraf, Khalid H. Alamer, Ashwaq T. Althobaiti, Badreyah Algethami, Khawar Sultan, Aamir Amanat Ali Khan, and Qamar uz Zaman. 2022. "Consortium between Groundwater Quality and Lint Yield in Cotton Belt Areas" Water 14, no. 19: 3136. https://doi.org/10.3390/w14193136
APA StyleHameed, M. R., Attia, H., Riaz, U., Ashraf, K., Alamer, K. H., Althobaiti, A. T., Algethami, B., Sultan, K., Khan, A. A. A., & Zaman, Q. u. (2022). Consortium between Groundwater Quality and Lint Yield in Cotton Belt Areas. Water, 14(19), 3136. https://doi.org/10.3390/w14193136