Article

Temporal Variation of Suspended Sediment and Solute Fluxes in a Permafrost-Underlain Headwater Catchment on the Tibetan Plateau

1
College of Geographic Science, Hunan Normal University, Changsha 410081, China
2
State Key Laboratory of Hydrology-Water Resources and Hydraulic Engineering, Nanjing Hydraulic Research Institute, Nanjing 210098, China
3
Hunan Institute of Science and Technology, College of Civil Engineering and Architecture, Yueyang 414006, China
4
Institute of Tibetan Plateau Research, Chinese Academy of Sciences (CAS), Beijing 100101, China
*
Author to whom correspondence should be addressed.
Water 2022, 14(18), 2782; https://doi.org/10.3390/w14182782
Submission received: 10 August 2022 / Revised: 26 August 2022 / Accepted: 2 September 2022 / Published: 7 September 2022
(This article belongs to the Special Issue Isotope Tracers in Watershed Hydrology)

Abstract

:
Under global warming, the permafrost-underlain headwater catchments of the Tibetan Plateau have undergone extensive permafrost degradation and changes in precipitation characteristics, which may substantially alter the riverine suspended sediment and riverine solute fluxes. However, these fluxes and their influencing factors in such catchments are poorly understood. We studied the suspended sediment and solute fluxes in a permafrost-underlain headwater catchment on the northeastern Tibetan Plateau, based on comprehensive measurements of various water types in spring and summer in 2017. The daily flux of suspended sediment in spring was close to that in summer, but heavy rainfall events following a relatively long dry period made the largest contribution to the suspended sediment fluxes in summer. The riverine solute flux (in tons) was 12.6% and 27.8% of the suspended sediment flux (in tons) in spring and summer, indicating the dominating role of physical weathering in total material exportation. The snowmelt mobilized more suspended sediment fluxes and fewer solutes fluxes than summer rain, which may be due to the meltwater erosion and freeze–thaw processes in spring and the thicker thawed soil layer and better vegetation coverage in summer, and the longer contact time between the soil pore water and the soil and rock minerals after the thawing of frozen soil. The input of snowmelt driven by higher air temperatures in spring and the direct input of rainfall in summer would both act to dilute the stream water; however, the supra-permafrost water, with high solute contents, recharged the adjacent streamflow as frozen soil seeps and thus moderated the decrease in the riverine solute content during heavy snowmelt or rainfall events. With the permafrost degradation under future global warming, the solute fluxes in permafrost-underlain headwater catchments may increase, but the suspended sediment flux in spring may decrease due to the expansion of discontinuous permafrost areas and active layer thickness.

1. Introduction

Suspended sediment fluxes have been identified as the main form of fluvial sediment transport, and they represent physical weathering fluxes. Solute fluxes are usually calculated as the sum of the ionic mass, and they represent chemical weathering fluxes [1,2,3]. Streamflow is the natural integrator of catchment physical and chemical weathering processes, and in situ observations of riverine suspended sediments and solutes are the most effective method for studying physical and chemical weathering in catchments [4,5,6]. Much effort has been made to identify the seasonal variations of riverine suspended sediment and solute fluxes and to determine the controlling factors [7,8,9,10]. Permafrost underlies ~23.9% of the Northern Hemisphere land surface, and the permafrost area on the Tibetan Plateau alone is 133.1 × 10⁴ km2 in the 2000s [11,12]. Under the global climate change of the last five decades, the Tibetan Plateau has experienced a rapid temperature increase which is twice that observed globally, and the study showed that the total degraded area is approximately 153.8 × 10⁴ km2, accounting for 88% of the permafrost area in the 1960s; thus, the understanding of the temporal effects of permafrost degradation due to global warming is very important [12,13,14]. The permafrost-underlain headwater catchments on the Tibetan Plateau are characterized by showing different stages with distinctive freeze–thaw and snowmelt occurring in spring and rain mostly in summer [15,16]. However, for logistical reasons and given the harsh environment of the Tibetan Plateau, few systematic comparisons have been made of the riverine suspended sediment and solute fluxes between different seasons (with different hydrological processes) in the permafrost-underlain headwater catchments.
Freeze–thaw processes and meteorological factors (rainfall/snowfall ratio, snowmelt intensity, and variations in air temperature) are recognized as important factors influencing the suspended sediment and solute fluxes in permafrost-underlain catchments [17,18,19]. First, when the soil is frozen, riverine solutes are cryogenically stored in the frozen soil; however, freeze–thaw processes in the soil will enhance soil erosion because the thawed surface soil layer has poor resistance to erosion [2,20,21]. For example, along with annual and intraday freeze–thaw processes, the surface soil layers freeze in autumn and winter and thaw in spring and summer, and they may even freeze at night and thaw during the day. Repeated freeze–thaw cycles and the resulting repeated soil expansion and contraction would damage the original soil structure. Additionally, during the initial thawing of frozen soil, surface runoff or shallow subsurface runoff are supplied by snow meltwater, which may cause severe soil erosion at this time [22,23,24]. Moreover, floods caused by heavy rainfall events can transport the suspended sediments (which are otherwise retained in the catchment) to the stream channel, and the suspended sediment content (SSC) of stream water during flood events may increase sharply [25,26,27]). Variations in permafrost conditions and meteorological factors lead to distinct hydrological, hydrochemical, and sedimentary regimes in different seasons.
The presence of permafrost can sever the connections between the surface water system and the deep groundwater system to some extent, and the permafrost degradation under global warming, with the associated deepening of flow pathways and the melting of near-surface ground ice, will increase the fluxes of major ions in surface water [28,29,30]. The increased exposure of soil material and increased availability of erodible materials due to rapid permafrost changes may also lead to an increase in the riverine suspended sediment flux [20,21,31]. Additionally, surface ponding water and in subsidence pits and frozen soil seeps, caused by thermal perturbation of permafrost, are common in the lower valley and riparian zones of permafrost-underlain catchments and can be the primary sources of riverine solutes [20,32,33]. A trend of expansion of discontinuous permafrost areas and active layer thickness on the Tibetan Plateau has been observed during the last few decades, and such permafrost changes or permafrost collapse events may significantly alter the catchment water chemistry [34,35,36]. Additionally, there is an increased frequency of extreme precipitation events and earlier snowfall in spring, as demonstrated on the Tibetan Plateau [15,16], as well as in other parts of the world [37,38]. It is unknown how changes in both permafrost and precipitation conditions interact to affect riverine suspended sediment and solute fluxes. Therefore, in situ observations of these fluxes, and the analysis of the influencing factors, are needed to improve our understanding of how climate change affects hydrochemical and sedimentary regimes in both permafrost-underlain and snow-covered catchments.
Based on observations of streamflow discharge, suspended sediment, and solute content, and the monitoring of meteorological factors in a permafrost-underlain headwater catchment in spring and summer, the present study had the following objectives: (1) To quantify riverine suspended sediment and solute fluxes and to identify the intraday and seasonal variations; (2) to identify the processes generating and transporting riverine suspended sediment and solutes; and (3) to quantify the influences of various factors on the catchment suspended sediment and solute fluxes, and to determine the most important factors in spring and summer.

2. Methods and Materials

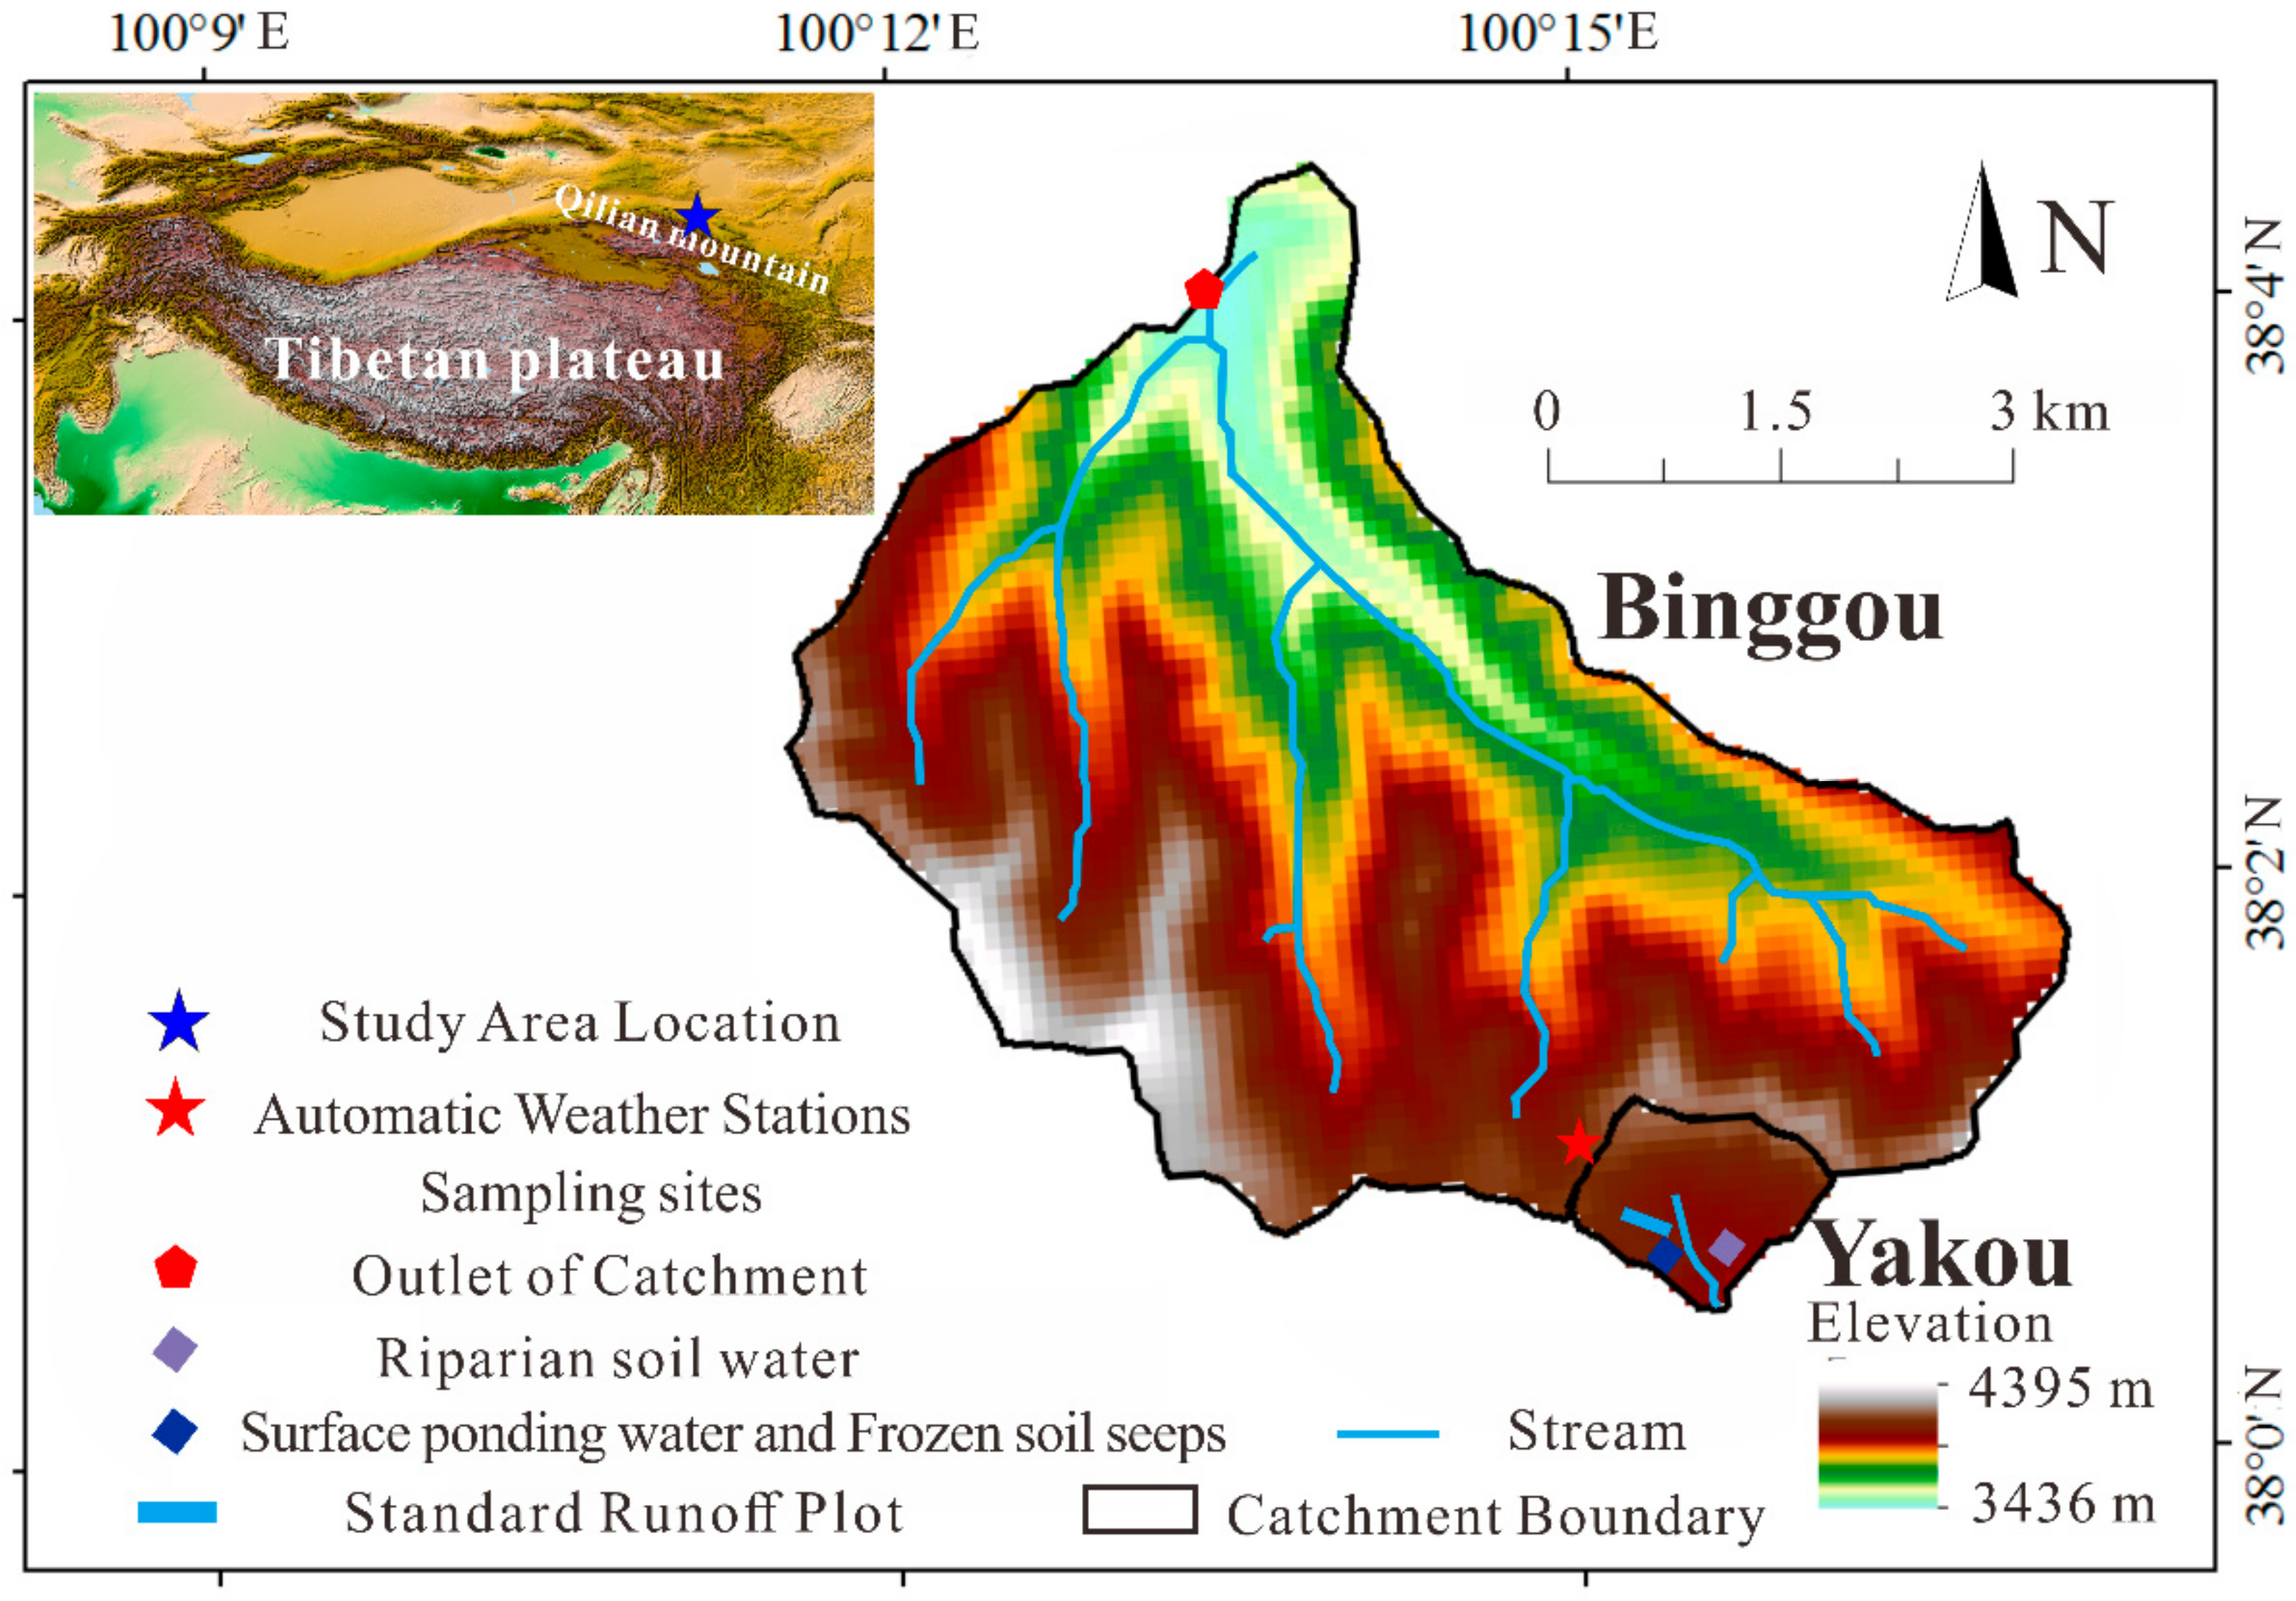
2.1. Site Description

The study area is in the Binggou catchment (30.5 km2) in Qinghai Province, China. The Binggou catchment is a headwater of the Heihe River, with an average slope of 10°, and an average elevation of 3915 m (range of 3436–4395 m) (Figure 1). The region is part of the continental climate zone. According to three-year observational data (January 2015–December 2017) at the Yakou Automatic Weather Station (AWS) [39,40], the annual average temperature is about −4.7 °C, with the minimum and maximum monthly temperatures occurring in January and July, respectively. The average annual precipitation is ~405 mm, with most of it (>84%) occurring during the period from May to September. Snowfall and rainfall are the main forms of precipitation from November to the following mid-May and from early June to September, respectively, and they alternate in the other months [41]. The monthly average air temperature is >0 °C from June to September. Therefore, the spring period and summer period were defined as the period from March to mid-May and from early June to September, respectively, and snowmelt occurs in spring and rain mostly in summer. The distribution of vegetation and soil in the Binggou catchment has a vertical zonation, with alpine shrub meadow and brown blank felty soil distributed from 3400 m to 3700 m, alpine meadow and Mat-cryic Cambisols distributed from 3700 m to 4000 m, and alpine desert and cryogenic Cambisols, along with massive exposed rocks and weathering residue distributed above 4000 m [42].
The Binggou catchment is underlaid by discontinuous permafrost and continuous permafrost. The distribution of discontinuous permafrost and continuous permafrost varies with altitude: the lower limit of continuous permafrost is ~4000 m a.s.l. and discontinuous permafrost is distributed from 3436 to 4000 m a.s.l. The initial thawing of surface soil occurs in mid-April at the altitude of 3450 m, and in mid-May at the altitude of 4147 m [41]. According to a field investigation of permafrost thickness in the headwaters of the Heihe River (a catchment adjacent to the Binggou catchment), [43] showed that the permafrost thickness was highly variable, decreasing from 111.4 m to 0 m with the altitudinal decrease from 4132 m to 3649 m a.s.l. Supra-permafrost water is defined as the saturated water above the permafrost table with the permafrost layer serving as an aquitard as the base, and the level of the supra-permafrost water was high and even close to the ground surface in the riparian zone [44], and, thus, the riparian soil water is supra-permafrost water [45]. Subsidence pits are widely distributed in the high elevation part of the Binggou catchment and the size of the subsidence pits in the study area varied from <1 m2 to >10 m2, and the surface ponding water level was usually from 10 to 30 cm, while the surface ponding water level may vary greatly under meteorological and hydrological forcing. Frozen soil seeps usually occur in the flat terrain at the base of steep hillslopes, and they recharge the surface ponding water and stream water as surface runoff. Frozen soil seep occurs continuously after the thawing of the surface soil layer under the recharge of precipitation input and frozen soil meltwater. Shallow subsurface flow at depths of 30–60 cm was shown to be the major flow pathway in permafrost-underlain hillslope [46].

2.2. Observation of Precipitation and Streamflow

The water level of runoff was recorded at the outlet of the Binggou catchment using a Hobo water level logger (U20-001-04) in spring and summer. The discharge of the Binggou catchment was calculated using a rating curve obtained using in situ current-velocity measurements with a propeller-type current meter (LS1206B, Naiwch, Nanjing, China). Both liquid and solid precipitation were measured using storage-type rain gauges (T200b, Geonor, Oslo, Norway) at the Yakou meteorological station, at the altitude of 4150 m (Figure 1).

2.3. Water Samples

In the spring and summer of 2017, precipitation, riparian soil water, hillslope subsurface flow at the depth of 30–60 cm, surface ponding water in subsidence pits, frozen soil seeps, and stream water were sampled, and the sampling sites are shown in Figure 1. Stream water samples were collected at the outlet of the Binggou catchment, and the samples of the other runoff components were collected in the neighboring Yakou catchment because the headwater of the Binggou catchment is hard to reach. The study showed that the runoff generated from the area above 3600 m—that is, the permafrost-underlain area contributed the most streamflow discharge in this region, which can be attributed to the high runoff ratio of the permafrost-underlain areas [47]. The sampling sites in the Yakou catchment are representative of the conditions in the Binggou catchment due to the proximity of the two catchments (landscape, soil type, topography), and the Yakou catchment can be regarded as the higher elevation part of the Binggou catchment that generated the most streamflow discharge.
The precipitation samples were collected from open, flat spaces without shelter or external interference at the AWS (Figure 1). All precipitation samples were collected in standard polyethylene (PE) bags (70 × 67 cm) for acid precipitation. The sample bags were vacuumed before use to remove any external contaminants and to ensure that the precipitation samples would not acquire any solutes from the standard PE bags. During persistent precipitation events, the bag was folded into a round shape and placed in a plastic bucket using rubber gloves. After the precipitation ceased, the bag was immediately retrieved and the collected precipitation was poured into a water sample bottle. The snowfall samples were melted at room temperature and stored in a refrigerator at 0 °C. Sixteen precipitation samples were collected during the sampling period, including 3 snowfall samples collected from 2 May to 3 May, and 13 rainfall samples collected from 23 July to 22 August.
Stream water samples were collected at the outlet of the Binggou catchment (as shown in Figure 1) at the same time each day (17:00), with a sampling interval of 1 to 3 days. Additionally, during the periods from 10:00 on 1 May to 09:00 on 2 May, and from 07:00 on 21 July to 06:00 on 22 July, 24 h intensive sampling with a time interval of 1 h was conducted at the outlet of the Binggou catchment. A total of 98 stream water samples were collected from the Binggou catchment, including 50 samples collected at the fixed time of 17:00 from 16 April to 5 May, and from 14 July to 23 August; and 48 samples were collected during the two 24 h intensive sampling from 1 May to 2 May and from 21 July to 22 July.
Riparian zone soil water samples were collected using a zero-tension soil lysimeter in the riparian zone of the Yakou catchment at an altitude of 3900 m (Figure 1). A detailed introduction to the construction of the zero-tension soil lysimeter and the sampling method used to collect the riparian soil water samples can be found in Xiao et al. (2020a). A total of 9 riparian soil water samples were collected at depths of 20 cm, 50 cm, and 80 cm on 27 July, 3 August, and 8 August. The surface ponding water in subsidence pits and frozen soil seeps was collected in the riparian zone of the Yakou catchment on 30 August and 24 July, and during each sampling, three subsidence pits (average area of 2 m2 and average depth of 40 cm) were selected to collect frozen soil seeps. Thus, a total of 6 surface ponding water samples and 6 frozen soil seep samples were collected on 30 August and 24 July. Samples of shallow subsurface flow at depths of 30–60 cm were collected from a standard runoff plot which was located in a mid-slope position in the Yakou catchment. A detailed introduction to the construction of the standard runoff plot and the sampling method used to obtain shallow subsurface flow samples can be found in Xiao et al. (2020). In total, 19 shallow subsurface flow samples were collected according to the runoff generation conditions, mainly in summer from 23 July to 22 August.

2.4. Sample Analysis and Testing

Sterile rubber gloves were worn when collecting the water samples. All water samples were stored in 30 mL HDPE bottles. To remove any contaminants, the water sample bottles were rinsed in ultrapure water and then dried before use. The sample bottles were rinsed at least three times using sample water at the time of collection. During sample collection, two replicate water samples were collected, and all water samples were filtered using 0.45 μm hydrophilic polyvinylidene fluoride (PVDF) membrane filters. One replicate water sample was used for the measurement of anions, and the other was acidified by adding ultrapure HNO3 until the pH was less than 3 to preserve cationic mass and to prevent algal growth and carbonate precipitation. Before analysis, water samples were stored and transported at 0 °C. During each stream water sampling session, one 500 mL bottle was filled, and the stream water was filtered through 0.45-μm filter paper (predried and weighed) for SSC measurements.
The concentrations of major cations (Ca2+, K+, Na+, and Mg2+) were measured at the Key Laboratory of Tibetan Environmental Change and Land Surface Processes, CAS, using inductively coupled plasma-optical emission spectrometry (ICP-OES) (LEEMAN). The concentrations of major anions (Cl, NO3, and SO42) were measured by ion chromatography (IC 900) (Dionex, Sunnzvale, CA, USA) and the measurement error was within 5%. The HCO3 and CO32 concentrations of the water samples were calculated using the cation–anion charge balance after measuring the total quantity within a sample. The total dissolved solids (TDS) of the water samples were measured in situ using a portable water quality monitor (HANNA, H198119). Additionally, continuous observations of specific conductivity (SC) were made using a Hobo conductivity logger (U24-002) in spring and summer, but no data are available in summer because the data logger was washed away during a heavy flood event on 22 August.

2.5. Data Analysis

The flux of suspended sediment (kg/d or t/d) was determined by the measurement of the SSC of stream water (kg/m3) and the discharge (m3/d). The flux of solutes (kg/d or t/d) was calculated using two methods: (1) by multiplying the TDS of stream water (mg/L or kg/m3) by the discharge (L/d or m3/d); (2) by using the following equation:
T D S f = i = 1 T t 0.51 S C i Q i t
where TDS is the total dissolved solids flux, SCi is the in situ specific conductivity at the time i (in μS/cm), Qi is the instantaneous streamflow discharge associated with SCi, and t is the time interval of the SSC measurement (1 h in this study). The regression equation between the in situ measured TDS and SC of stream water was TDS = 0.51 SC (R2 = 0.97, n = 98). This equation was used in conjunction with the discharge to determine the solute flux.
Partial least squares path modeling (PLS-PM) was used to build a prediction model of the dependent variable [48,49]. PLS-PM is the partial least-squares approach to structural equation modeling and provides a framework for analyzing multiple relationships among a set of blocks of variables (or data tables) [48]. An introduction to the PLS-PM can be found in Xiao et al. (2020). The structural model proposed in this study consists of six latent variables: precipitation, antecedent moisture conditions (AMC), air temperature (AT), discharge, suspended sediment, and solutes. As shown by Xiao et al. (2020), the AMC index can be defined as the cumulative precipitation within the previous 5 and 10 days (AP5 and AP10), and, therefore, it can be used to further analyze the influences of antecedent snowfall or rainfall on discharge, sediment, and solutes. Each latent variable is referenced by a single manifest variable or by several manifest variables. For example, precipitation amount (mm), streamflow discharge (m3/s), SSC (kg/m3), and TDS of stream water (mg/L) are associated with precipitation, discharge, sediment, and solutes, respectively. The daily average, maximum and minimum air temperature (°C), and daily cumulative positive temperatures above 0 °C (°C) are associated with AT; and AP5 and AP10 (mm) are associated with the AMC. The path diagram of the PLS-PM, including the manifest and latent variables, is shown in Figure 2. P, SSC, AT, APT > 0 °C, and AP represent precipitation, suspended sediment content, air temperature, cumulative positive temperatures above 0 °C, and the antecedent precipitation, respectively. In the results of the PLS-PM, the influences among the latent variables are represented by the combination of the estimated value and the p-value [48,49]. The analysis of PLS-PM was completed using the “pls-pm” package in R.

3. Results

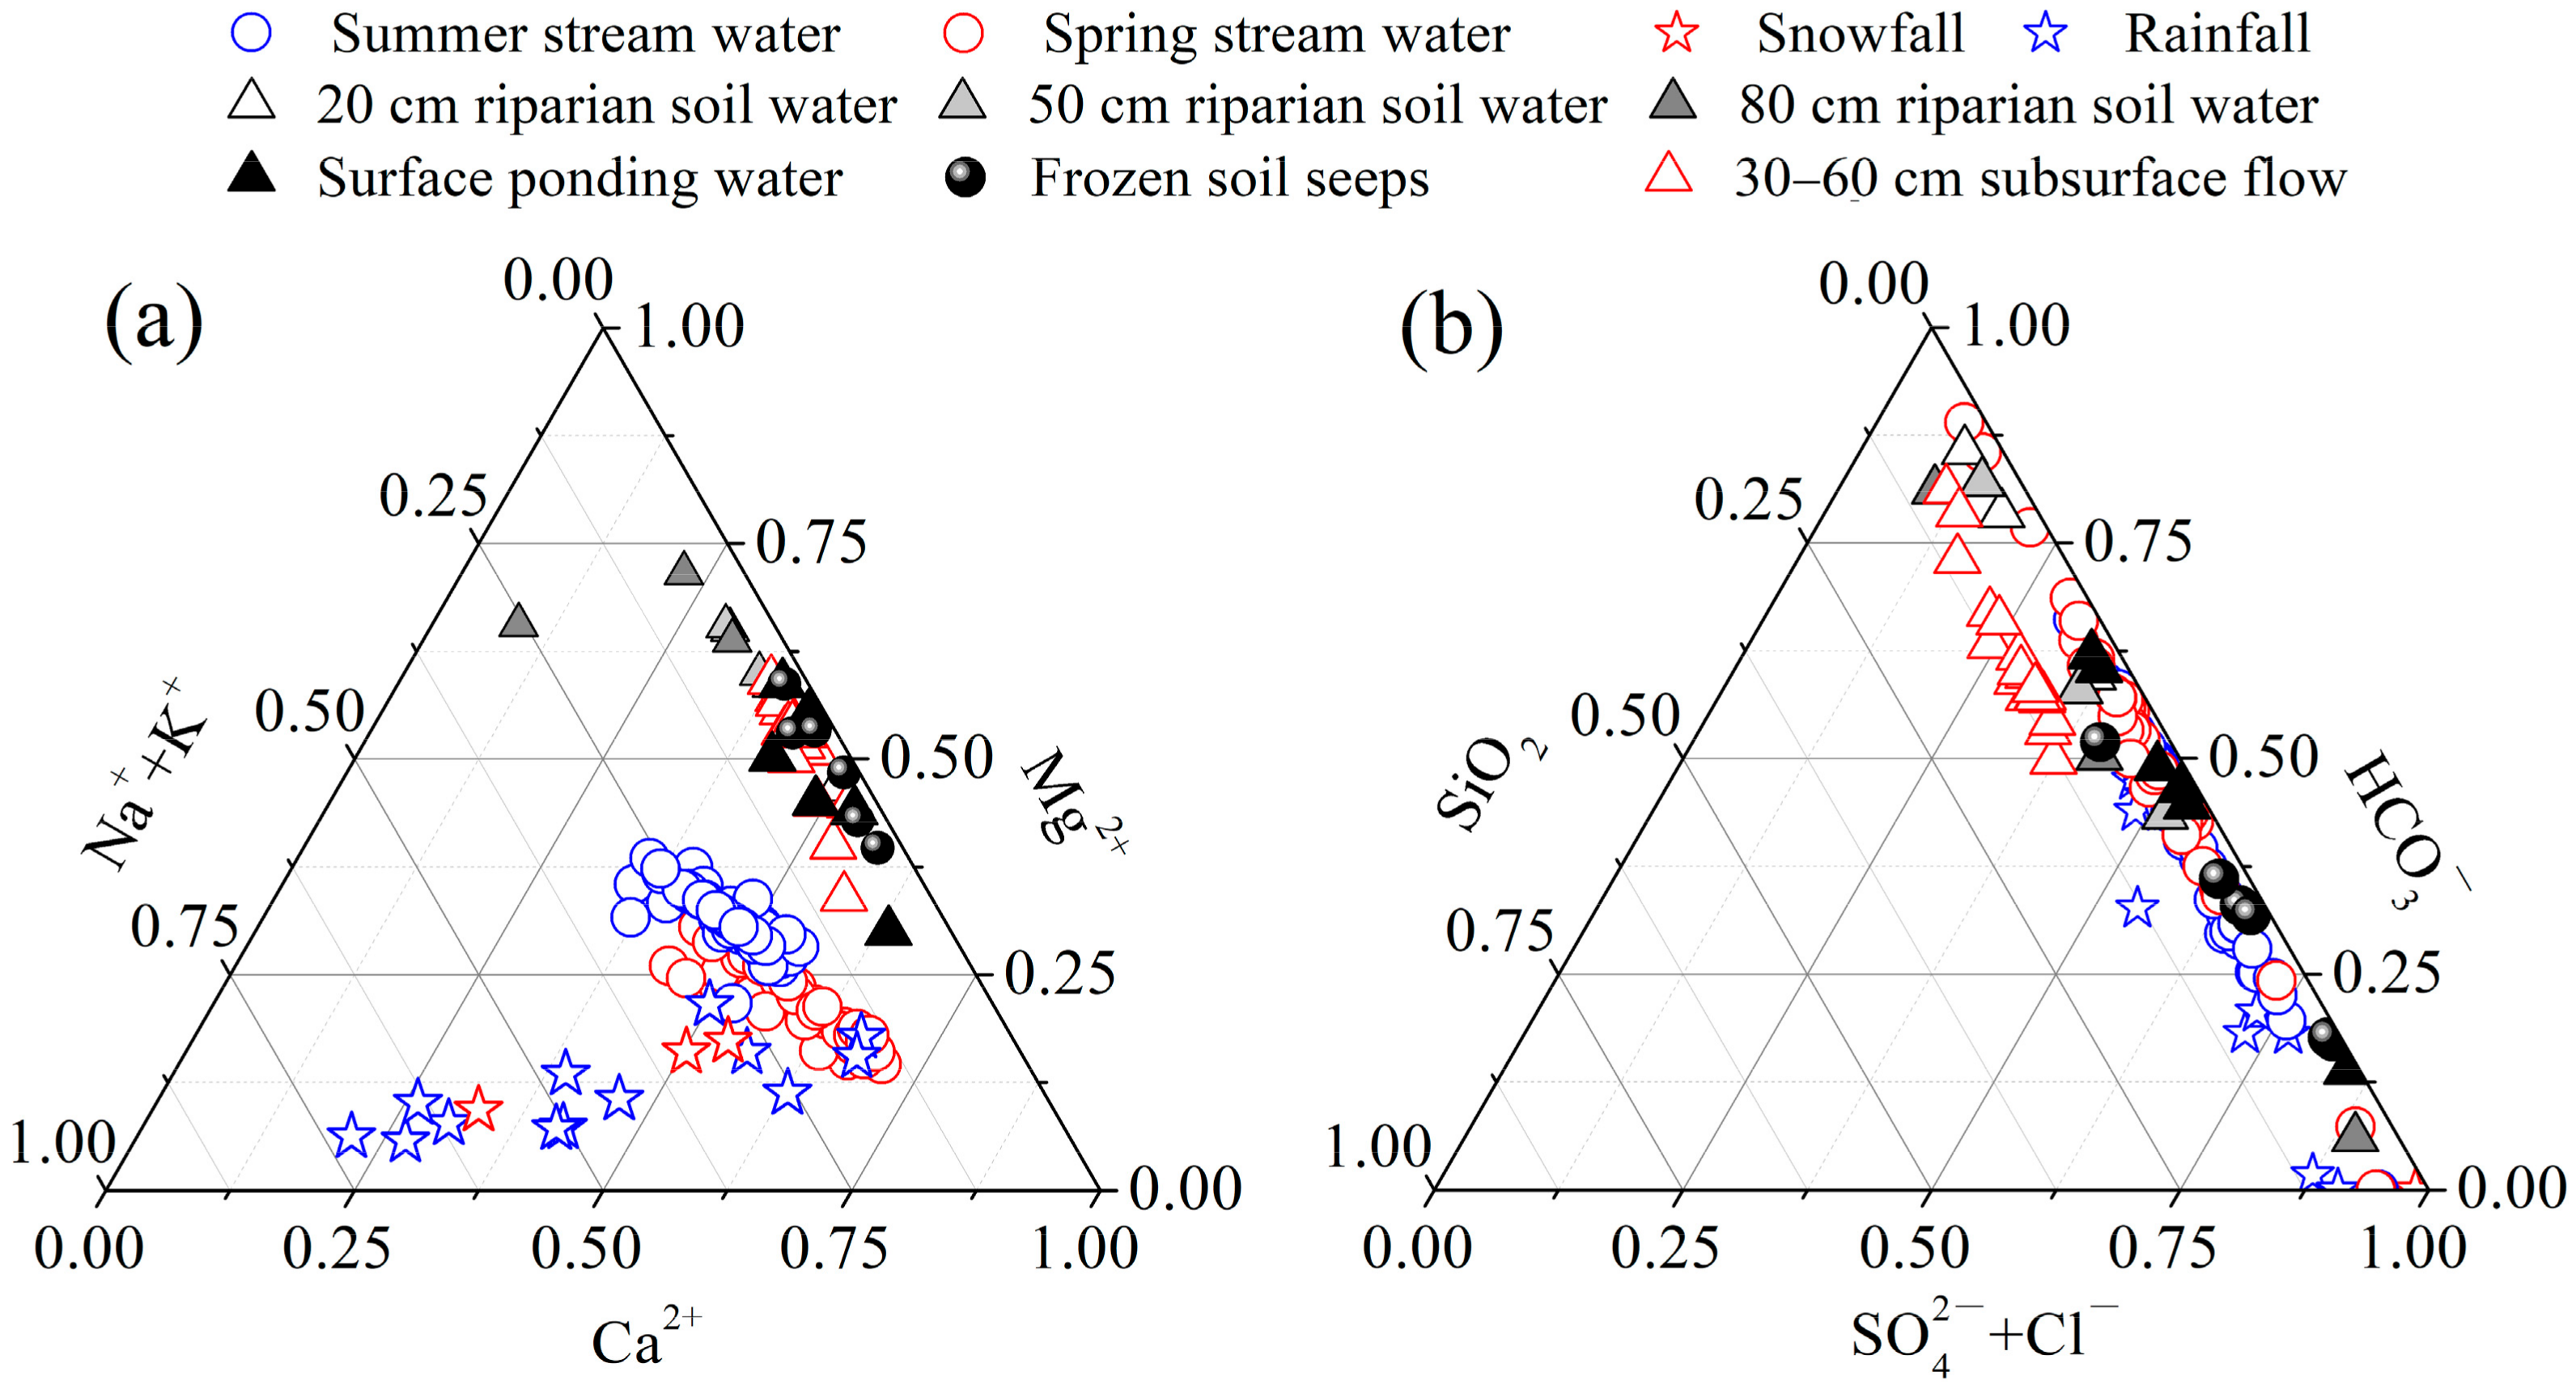
3.1. Overall Hydrochemical Characteristics of Different Water Types

The mass concentrations of TDS and major ions found in the different water types are presented in Table 1, and the major ionic order is presented in Figure 3. The Binggou spring and summer stream water can both be ranked in terms of their major cations (Ca2+ > Mg2+ > Na+ > K+) and major anions (SO42 > HCO3 > NO3 > Cl) (Figure 3). The hydrochemistry of the Binggou stream water is classed as Ca2+–Mg2+–SO42−–HCO3, with Ca2+ dominating (contributing around 64% and 52% of total cations of the spring and summer stream water, respectively), and with SO42 dominant among the total anions (contributing around 51% and 64% of total anions, respectively) (Figure 3). The TDS of the Binggou stream water ranges from 92.0 to 259.4 mg/L, with averages of 142.3 and 233.1 mg/L in spring and summer, respectively (Table 1). These values are respectively 2.2 and 3.6 times greater than the global median of 65 mg/L [50].
The major cationic concentrations in snowfall and rainfall are ordered as Ca2+ > Na+ > Mg2+ > K+, with Ca2+, Na+, and Mg2+ comprising 52%, 21%, and 18% of the total solutes in snowfall, respectively, and comprising 55%, 20%, and 13% of the total solutes in rainfall, respectively (Figure 3). The concentrations of major anions in snowfall are ordered as Cl > SO42− > NO3 > HCO3; Cl and SO42− are dominant, together contributing ~96% of total anions. The major anionic concentrations in rainfall are similar: SO42−, HCO3, Cl, and NO3 comprised around 27%, 26%, 24%, and 23% of total anions, respectively; thus, the hydrochemistry of the Yakou precipitation is classed as Ca2+–Na+–Cl–SO42− (Figure 3). Generally, the mass concentrations of TDS and most of the major ions were much higher in the spring precipitation than in the summer precipitation. For example, the average mass concentration of TDS was 19.5 mg/L, which was 2.4 times the value of the summer precipitation (8.1 mg/L; Table 1). The different mass concentrations of TDS and major ions in the spring precipitation (snowfall) and summer precipitation (rainfall) may be caused by different water vapor sources [51,52].
The subsurface waters (riparian soil water and hillslope shallow subsurface flow), surface ponding water, and frozen soil seeps show the following order of major cation concentrations: Mg2+ > Ca2+ > Na+ > K+, with Mg2+ and Ca2+ contributing more than 80% of the total (Figure 3). The anionic concentrations are ordered as HCO3 > SO42− > NO3 > Cl, or SO42− > HCO3 > NO3 > Cl, with SO42− and HCO3 contributing more than 85% of total anions (Figure 3). Therefore, the hydrochemical category of the subsurface waters, surface ponding water, and frozen soil seeps are Mg2+–Ca2+–HCO3–SO42−, or Mg2+–Ca2+–SO42−–HCO3. Except for the hillslope shallow subsurface flow, the TDS and Ca2+, Mg2+, SO42−, and HCO3 concentrations were higher for these water types than the stream water and much higher than in the precipitation (Table 1). For example, the average TDS of the subsurface waters ranged from 400.7 to 573.6 mg/L, which is higher than the 142.3 mg/L of spring stream water and the 233.1 mg/L of summer stream water. The average values of the major ion contents of riparian soil water (i.e., supra-permafrost water) at 20 cm, 50 cm, and 80 cm depth were high, with the average Ca2+, Mg2+, and SO42− concentrations having the respective ranges of 34.6–50.7, 37.6–73.5, and 96.1–214.6 mg/L (Table 1). The high mass concentrations of TDS and major ions in the riparian soil water are related to the dissolution of soil minerals and enrichment via evaporation during the long residence times.
The mass concentrations of TDS and major ions in the frozen soil seeps were higher than the surface ponding water and close to the riparian soil water—that is, the supra-permafrost water (Table 1). For example, the average TDS values of the frozen soil seeps, surface ponding water, and riparian soil water were 476.4, 276.8, and 503.4 mg/L, respectively. This can be attributed to the runoff generation processes of the alpine meadow hillslope with underlying permafrost—that is, the hillslope subsurface flow at the depths of 30–60 cm would be transformed to surface runoff in the riparian zone before supplying the streamflow. The shallow subsurface flow may pressurize supra-permafrost water, with high ion concentrations, to the ground surface in the riparian zone as frozen soil seeps, and then recharge the adjacent surface waters such as surface ponding water and stream water. The surface ponding water was also directly recharged and diluted by the precipitation input, and, thus, the surface ponding water had lower ion concentrations than the frozen soil seeps and the riparian soil water.

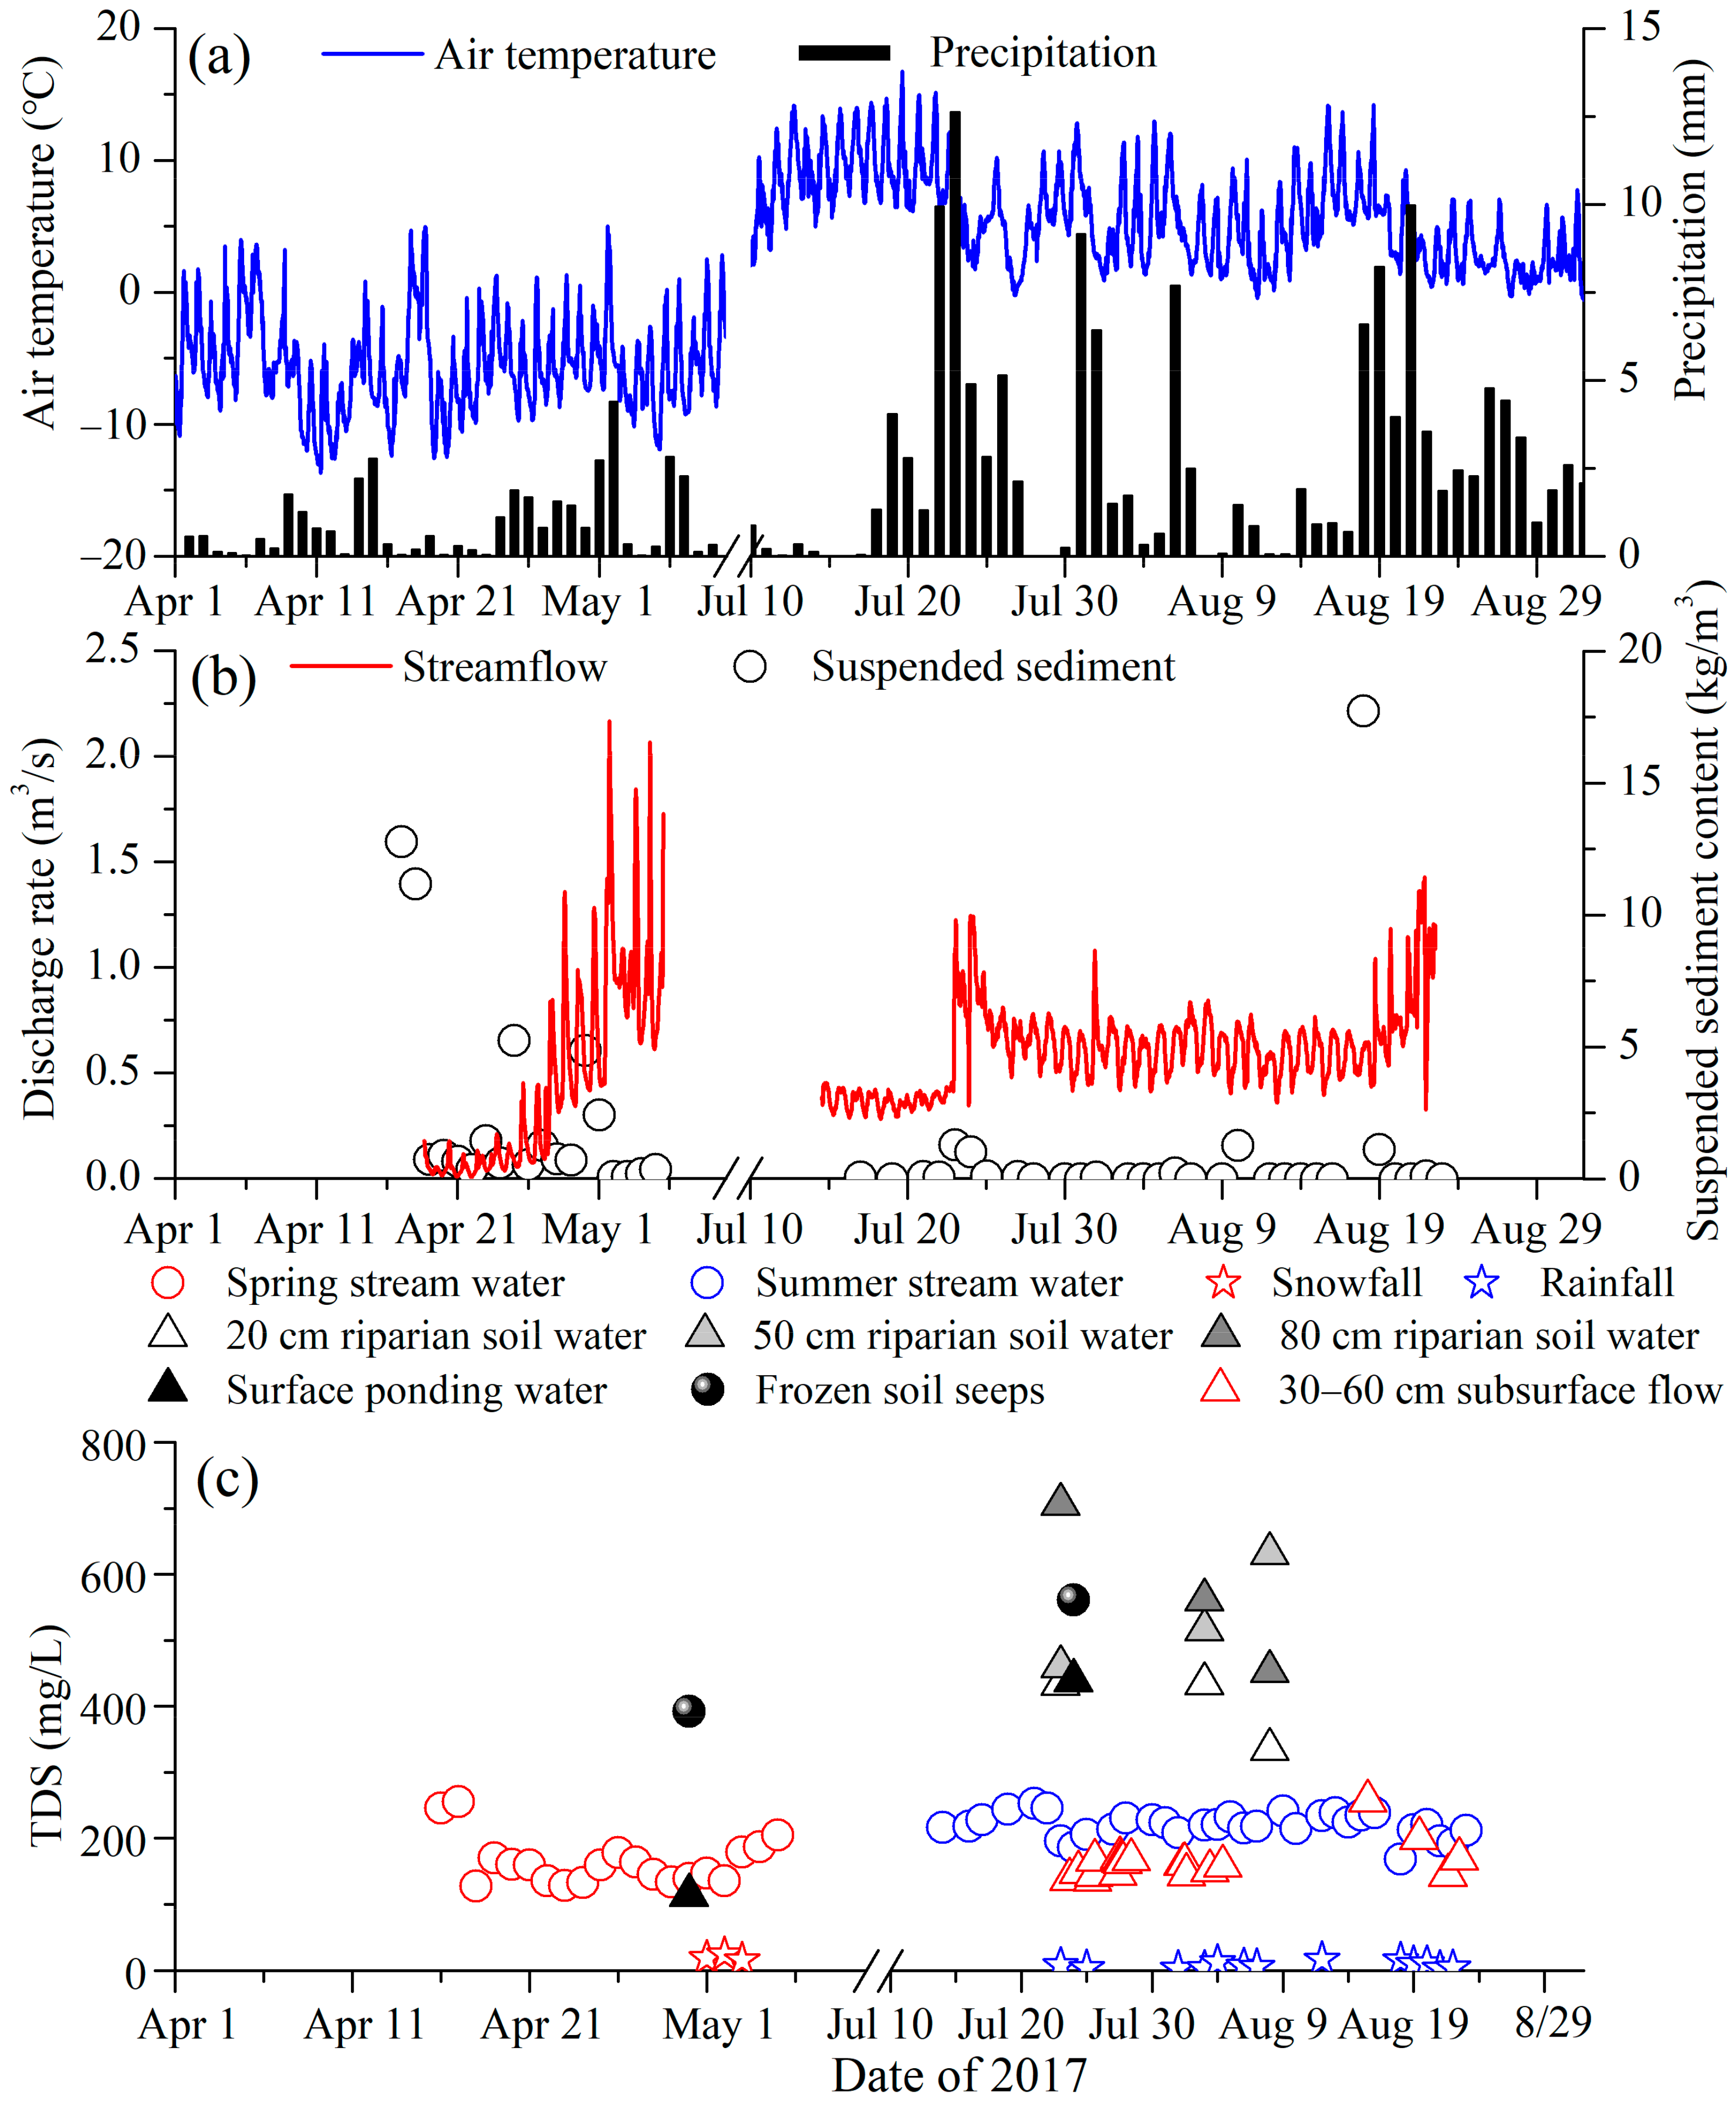
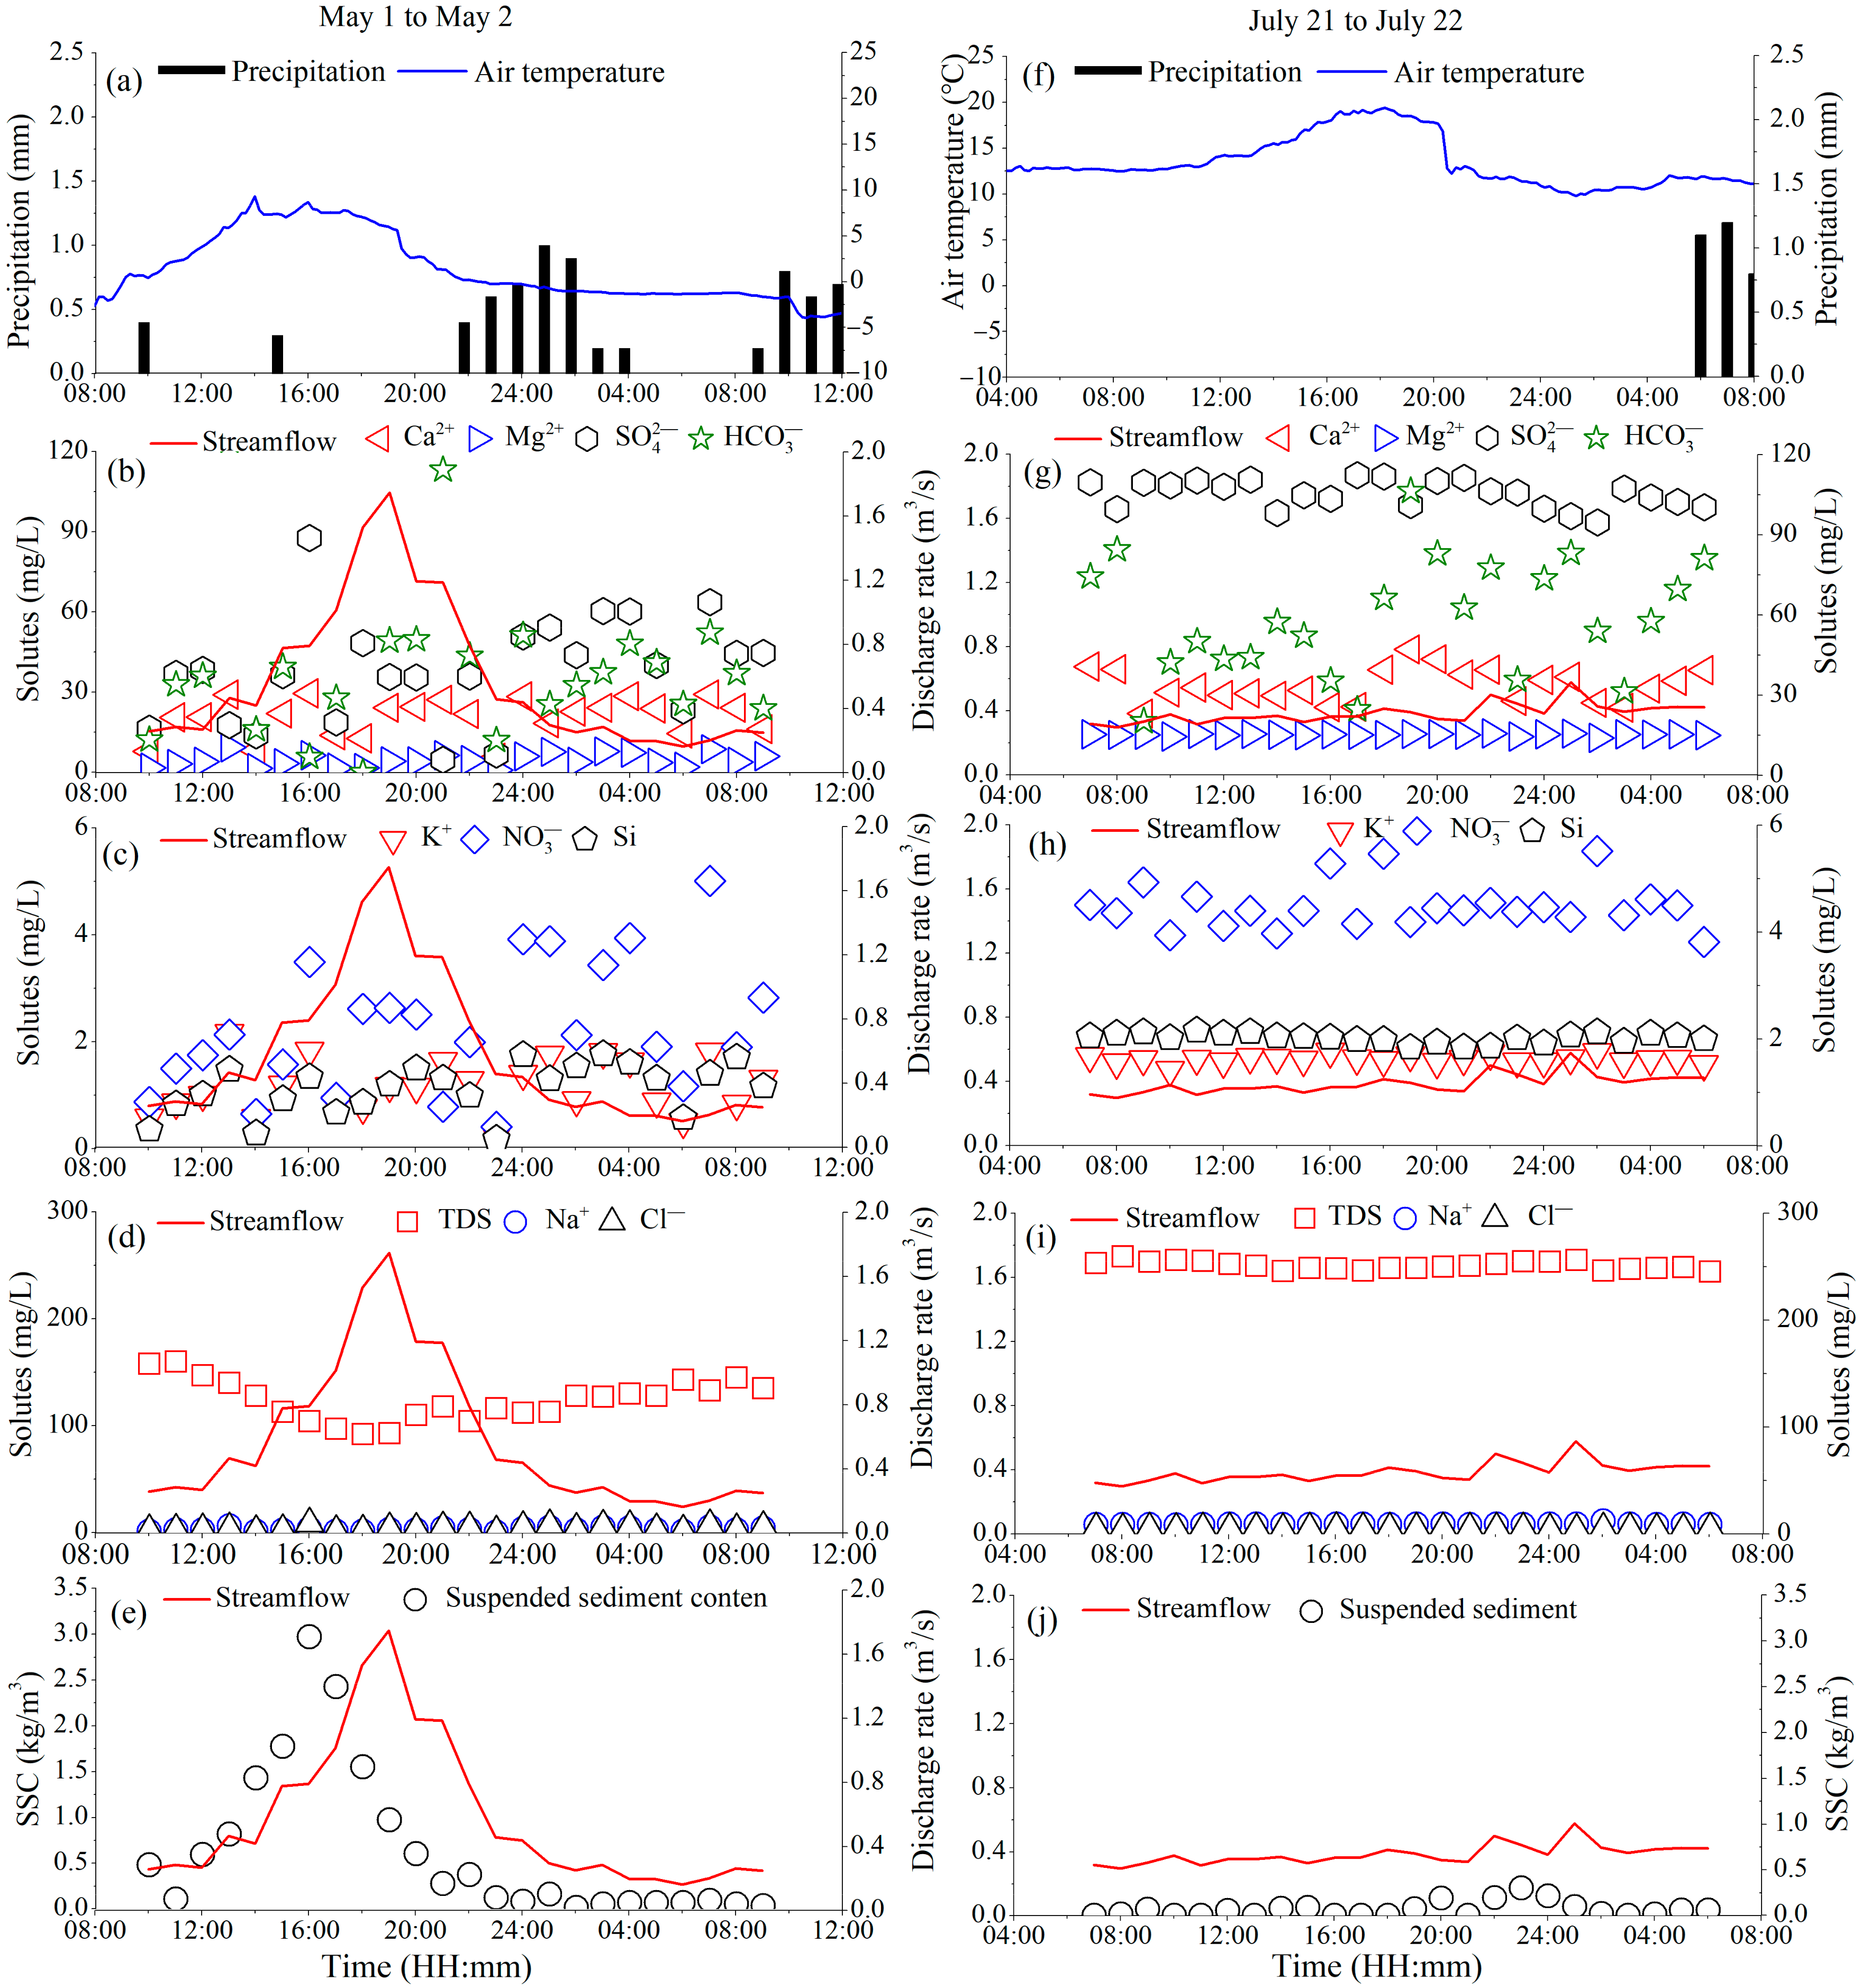
3.2. Temporal Variations of Streamflow Discharge, Suspended Sediment, and Solutes

The Binggou streamflow showed a gradual increase in discharge in spring, reaching maximum discharge at the beginning of May (Figure 4b). In summer, the discharge increased briefly at the beginning of July, gradually decreased until the middle of August, and then reached a peak at the end of August (Figure 4b). The diurnal cycle and the gradual increase in the spring streamflow were driven by the higher air temperature and thus increased snowmelt intensity, and the two relatively large increases in streamflow at the beginning of July and the end of August were driven by the heavy rainfall. The discharge increased greatly at the end of April, but there was no substantial decrease in the TDS of the Binggou spring stream water at the same time (Figure 4).
The time series of the SSC of the Binggou stream water shows that the variation and flux of suspended sediment were higher in spring than in summer (Figure 4b). The SSC of the stream water was high at the beginning of the spring sampling period (12.8 and 11.2 kg/m3 on 17 and 18 April, respectively), after which the SSC values were low (~1.0 kg/m3) during the low streamflow period. The high SSC values on 17 and 18 April may be related to the high air temperature on these two days and the large antecedent snowfall amount, these factors led to heavy snowmelt erosion on these two days. The average air temperature on 17 and 18 April was 1.8 °C and 4.4 °C, respectively, which is higher than the average air temperature (−1.2 °C) during the spring observation period from 17 April to 5 May. Moreover, the snowfall amount for the antecedent 10 days (from 7 April to 16 April) was more than 10 mm. The SSC of the stream water was relatively high on 25 April, 30 April, and 1 May (5.2, 4.9, and 2.4 kg/m3, respectively), and the corresponding discharges were relatively high (0.4, 1.2, and 2.1 m3/s, respectively). Generally, the SSC of the summer stream water was less than 1 kg/m3 and even less than 0.1 kg/m3 during most of the summer period, and substantially lower than the values of the spring stream water. However, the SSC for 18 August was 17.7 kg/m3, which was even higher than the highest SSC in spring (12.8 kg/m3 on 17 April).
To analyze the intraday variation of streamflow discharge, suspended sediment, and solute contents, intensive 24 h sampling with 1 h intervals was carried out at the outlet of the Binggou catchment from 1 May to 2 May of the spring period, and from 21 July to 22 July of the summer period (Figure 5). From 10:00 on 1 May to 9:00 on 2 May, the streamflow discharge gradually increased from 0.26 m3/s at 10:00, reached a peak of 1.75 m3/s at 19:00 on 1 May, and then gradually decreased to 0.25 m3/s at 2:00 on 2 May, before maintaining a low value of ~0.2 m3/s from 02:00 to 09:00 on 2 May. The intraday variations of streamflow discharge were driven by the variations of the air temperature and the resulting snowmelt intensity—that is, the air temperature remained above 0 °C from 12:00 to 19:00 on 1 May and reached a peak of 5.9 °C at 14:00. The SSC showed very similar intraday variations to the streamflow discharge—that is, the SSC gradually increased from 0.48 kg/m3 at 10:00 to 2.97 kg/m3 at 16:00, gradually decreased to 0.97 kg/m3 at 19:00 on 1 May, and then maintained low values of <1.0 kg/m3 from 20:00 on 1 May to 09:00 on 2 May (Figure 5e). These observations show that the increases in the SSC were always consistent with the increases in streamflow discharge, and that the peak in SSC occurred three hours earlier than the peak streamflow discharge. An obvious temporal disconnection between the SSC peak and the discharge peak of the rivers on the Tibetan Plateau has been observed, which is described as a hysteresis effect [53,54,55]. The low SSC during the period of high streamflow discharge (Figure 5e) may have been caused by the exhaustion of the catchment sediment supply [26,56].
Compared to the intensive 24 h sampling in spring, the streamflow discharge and SSC during the intensive 24 h sampling from 21 July to 22 July were low and showed less temporal variability, with the average streamflow discharge and SSC of 0.39 m3/s and 0.06 kg/m3, respectively. These values are lower than the average values during the period from 1 May to 2 May (0.57 m3/s and 0.63 kg/m3, respectively). This was mainly due to the lower rainfall during the period from 21 July to 22 July, and the increases in streamflow discharge and SSC were mainly driven by heavy rainfall events in summer.
The TDS and major ion concentrations in the stream water during the intensive 24 h sampling showed higher temporal variability during the period from 1 May to 2 May than during the period from 21 July to 22 July (Table 1 and Figure 5). Except for Ca2+ and SO42− in the stream water, the other major ions and TDS remained almost unchanged and the stream water hydrochemistry exhibited chemostatic behavior during the period from 21 July to 22 July. For example, the mean values of Mg2+, K+, Na+, Cl, and SO42− during the summer intensive 24 h sampling were 15.2, 1.6, 9.1, 4.9, and 105.3 mg/L, respectively, while the standard deviations were 0.4, 0.1, 0.7, 0.4, and 5.1, respectively, and the mean values were substantially higher than during the spring intensive sampling (4.6, 1.2, 3.0, 3.9, and 38.3 mg/L, respectively), while the standard deviations were substantially lower than during the spring intensive sampling (2.4, 0.5, 1.5, 2.0, and 19.3 mg/L, respectively) (Table 1). However, the solute contents of the stream water did not show large decreases during the spring intensive 24 h sampling, as indicated by the less variable values of TDS, Na+, and Cl during the rising stage of the streamflow discharge from 10:00 to 19:00 on 1 May (Figure 5). These observations indicate that the spring stream water may be recharged by multiple source water types.

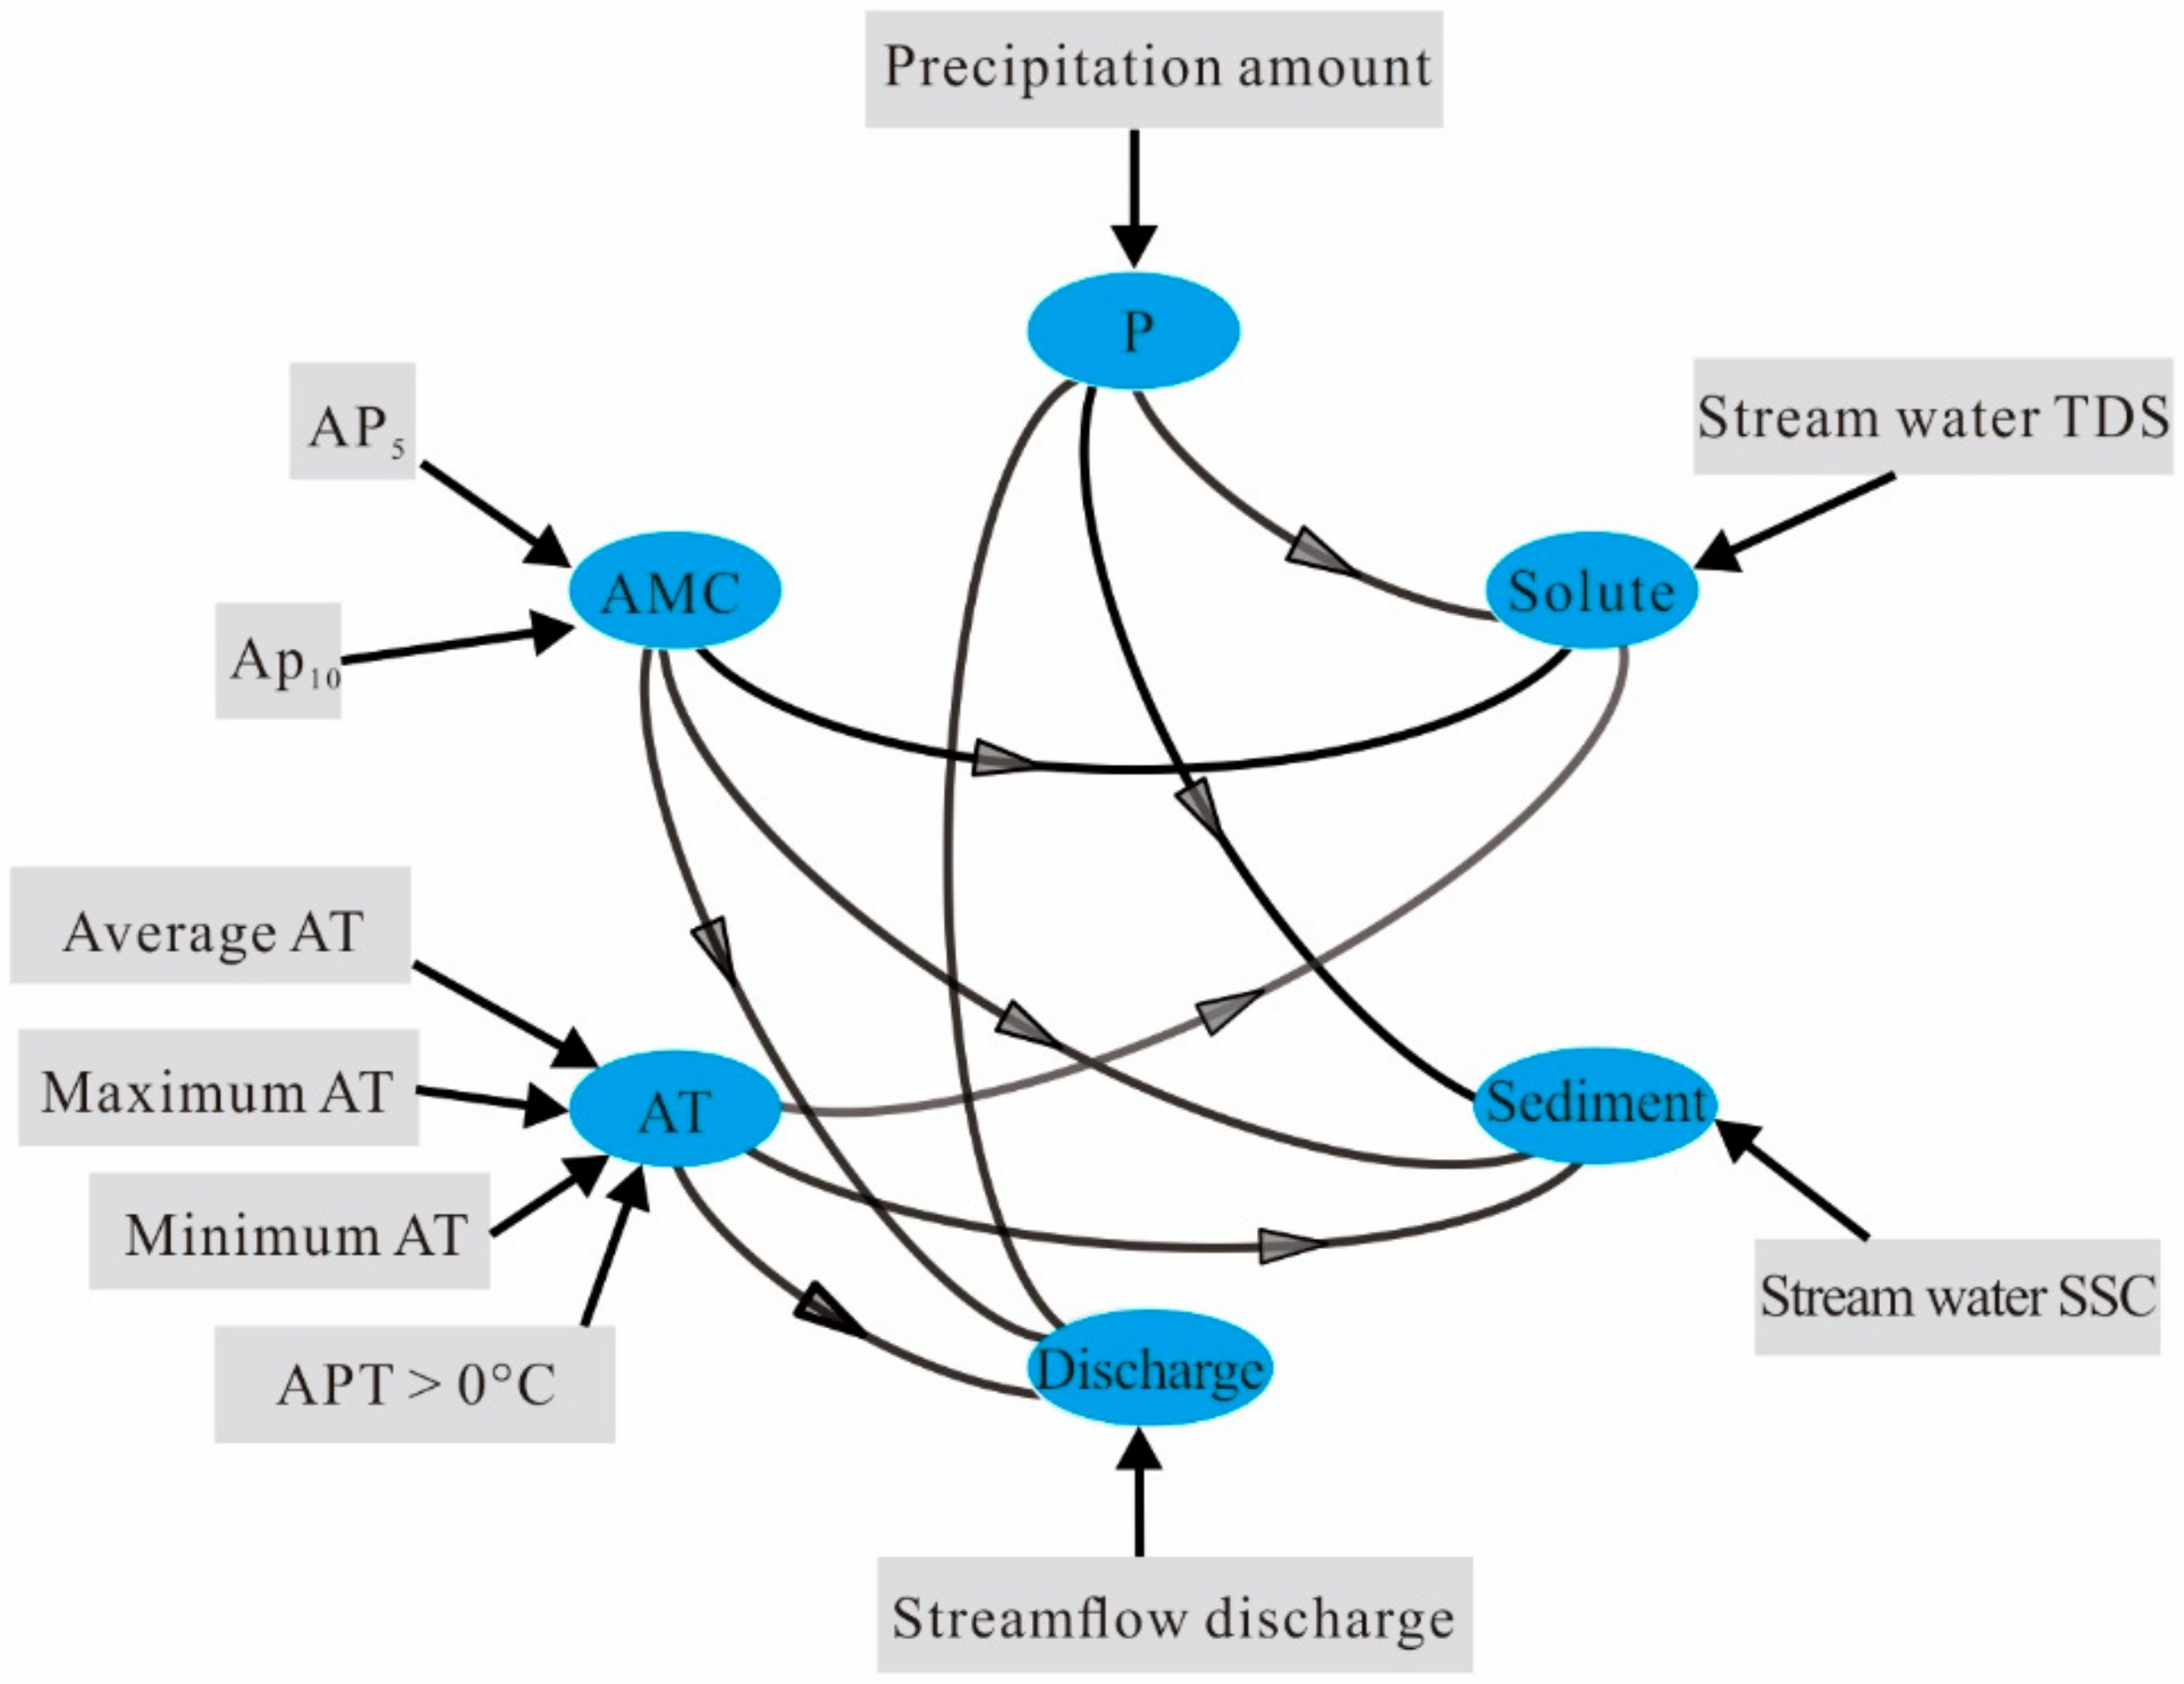
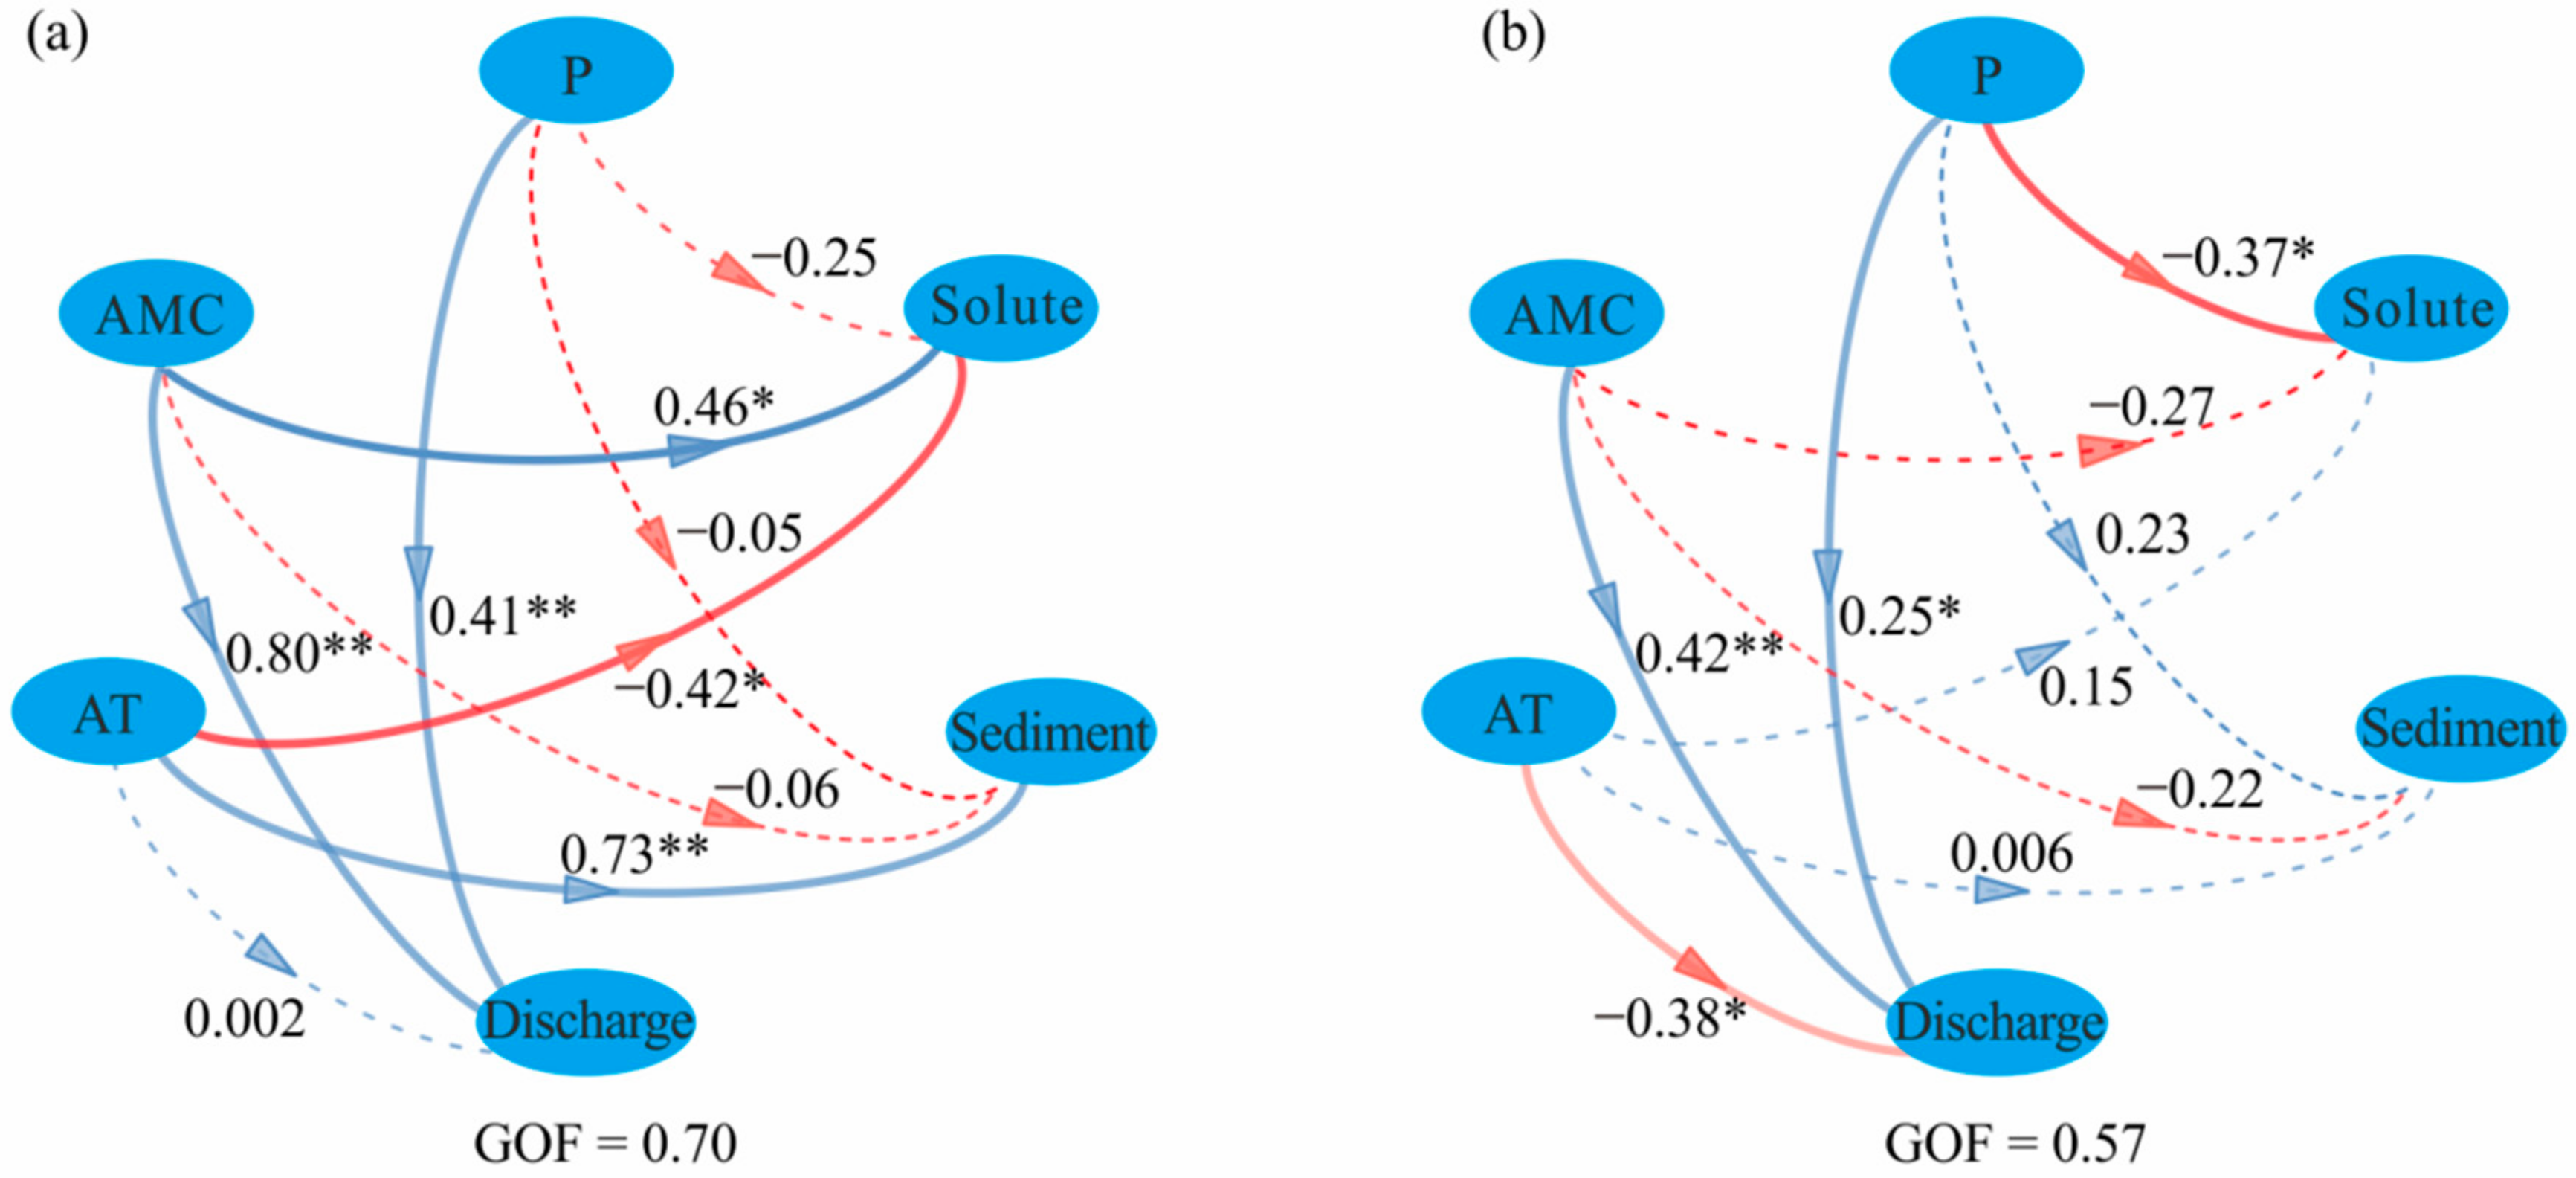
3.3. Results of the PLS-PM

Because the hydrochemical and sedimentary regimes of the stream water changed from spring to summer, with different concentrations and temporal variations in different seasons (Figure 4 and Figure 5), PLS-PM was conducted separately for spring and summer to analyze the correlations among different variables. The results of the PLS-PM for spring and summer are shown separately in Figure 6.
In spring, the AMC and the precipitation showed highly significant (p < 0.01) influences on discharge, with the AMC having the higher estimated value (0.80 and 0.41 for the AMC and precipitation, respectively) (Figure 6a). This indicates that both the event precipitation and AMC (i.e., the snowpack) were important factors for generating streamflow during this period, but that the AMC was more important than the event snowfall. The air temperature showed a highly significant (p < 0.01) influence on the sediment, with a high estimated value of 0.73, showing that the increase in riverine suspended sediment was driven by strong snowmelt events as the air temperature increased. The precipitation showed a nonsignificant (p > 0.05) negative correlation with the solute, with a low estimated value (−0.25), while the air temperature had a relatively strong and significant (p < 0.05) negative correlation with the sediment with an intermediate estimated value (−0.42), indicating that the input of snowfall diluted the riverine solute contents. However, the AMC showed a significant (p < 0.05) and strong positive correlation with the solute, with a moderate estimated value (0.46)—that is, higher antecedent snowfall during this period resulted in higher riverine solute contents. This may be due to the higher supra-permafrost water level under the recharge of precipitation infiltration, with resulting increases in water and solute fluxes from the supra-permafrost water to the adjacent stream water as frozen soil seeps.
Figure 6b shows the results of the PLS-PM for summer. The AMC had a highly significant (p < 0.01) influence on the discharge, with an estimated value of 0.42, and the precipitation had a significant (p < 0.05) influence on the discharge, with an estimated value of 0.25. This also indicates that the event and antecedent precipitation was the most important factor in the generation of streamflow in summer, and that the AMC was a more important factor than event precipitation during this period. The air temperature showed a significant influence (p < 0.05) on the discharge via its influence on catchment evaporation. Precipitation had a nonsignificant (p > 0.05) positive influence on the SSC, with an estimated value of 0.23, showing that only the heavy precipitation events facilitated soil erosion and increased the riverine suspended sediment. However, no latent variables were found to significantly influence the suspended sediments during this period. Precipitation showed a significant (p < 0.05) negative influence on the solute, with an intermediate estimated value (−0.37), and the AMC showed a nonsignificant (p > 0.05) negative influence on the solute with a low estimated value (−0.27). These results show that the increase in the event precipitation and antecedent precipitation had a negative influence on riverine solutes during this period, and that rainfall input diluted the riverine solute contents. The air temperature showed a nonsignificant (p > 0.05) positive influence on the solute, with a low estimated value (0.15), which may be due to the air temperature increasing the contact time between the water flow and the soil or bedrock by increasing the depth of the freezing front, which was driven by higher air temperatures.

4. Discussion

4.1. Catchment Suspended Sediment and Solute Fluxes

Time series data were used to determine the suspended sediment and solute fluxes (Table 2). The results showed that the daily mean flux of suspended sediment in spring was close to that in summer (46.9 t/d and 41.2 t/d in spring and summer, respectively). However, the Binggou catchment experiences relatively high riverine sediment flux during summer heavy rainfall after a relatively long dry interval, which contributed to most of the suspended sediment flux during this period. For example, the SSC of stream water was 17.7 kg/m3 on 18 August (Figure 4b), which may have been caused by the heavy precipitation event on August 18 which followed a relatively long rain-free period (from 2 August to 17 August). The heavy precipitation would have resulted in the transport of a large quantity of readily available sediment to the stream channel since a large amount of sediment would have accumulated during the relatively long rain-free period. Moreover, in this mountainous region, catastrophic events such as debris flows and landslides often occur during heavy rainfall events, and the soil mantle may move downward as a whole above the bedrock surface. This may be mainly due to the relatively well-developed subsurface runoff above the bedrock or the frozen front, with thawed frozen soil providing ideal conditions for the development of subsurface runoff and the movement of the soil mantle [57,58,59]. The anomalously high sediment flux on 18 August contributed more than 68% of the total suspended sediment flux in summer, which causes a large reduction of the daily mean flux of suspended sediment, from 41.2 t/d to 13.5 t/d, if the suspended sediment flux on 18 August is excluded from the calculation. Therefore, the suspended sediment flux was more concentrated in summer than in spring.
The higher daily mean flux of riverine suspended sediment in spring than in summer may be linked to snowmelt and freeze–thaw processes. Spring is the period of soil thawing and snow melting on the Tibetan Plateau, and the soil affected by freeze–thaw processes is susceptible to erosion; at the same time, the vegetation cover is poor and provides little protection against erosion at this time [20]. Therefore, the soil erosion driven by meltwater is severe and the SSC in stream water is relatively high in spring (Figure 4b and Figure 5e). The SSC in stream water can be very high during heavy snowmelt events, reaching values of 12.8 and 11.2 kg/m3 on 17 and 18 April, respectively (Figure 4b). The heavy slope erosion generated by concentrated meltwater caused the high SSC values on 17 and 18 April, when the high antecedent snowfall provided a large source for meltwater and the strong meltwater event was then driven by the high air temperature (Figure 6a). However, plant growth conditions (the above-ground biomass and plant height) were better improved in summer than in spring, and the stream water generally had much lower SSC than in spring (Figure 4b) because the vegetation cover effectively reduced the soil erosion. Additionally, the low SSC during the low flow period indicates supply-limited conditions and the limited connectivity of slope sediment to the channel network in summer [2,60,61].
It has been shown that riverine solute fluxes were low during winter and spring in alpine regions because chemical reactions are inhibited by the low air and soil temperatures, and the mass is cryogenically stored [2,62,63]. In this study, the riverine solute flux—the amount of material generated through chemical weathering processes—showed distinct seasonal differences from spring to summer, with the riverine solute flux being much higher in summer than in spring (the daily mean values calculated by the daily data of TDS in spring and summer were 6.2 t/d and 11.4 t/d, respectively (Table 2)). This is reasonable because the TDS values of the summer stream water were generally higher than the values of the spring stream water (Figure 4 and Figure 5). Moreover, the riverine solute flux calculated by the daily TDS data (measured by the in situ TDS data) was close to the TDS calculated by the SC data (measured by the Hobo conductivity logger at a 1 h interval) (Table 2), with respective riverine solute fluxes of 112.4 t and 105.5 t over 18 days in spring. This shows that the calculation of riverine solute flux using the daily data was acceptable. Overall, the daily mean riverine solute flux in spring was 54.4% (6.2 t/d, calculated from the in situ TDS data) and 51.8% (5.9 t/d, calculated from the SC data) of the riverine solute flux in summer (11.4 t/d, calculated from the in situ TDS data).
Studies showed that suspended sediment usually represents the major proportion of the weathering flux in stream water, while a high level of physical weathering in the catchment always promotes chemical weathering [50,64]. In this study, the total riverine solute flux (in tons) was 12.6% (calculated from the in situ TDS data) and 11.8% (calculated from the SC data) of the total suspended sediment flux (in tons) in spring, with the ratio of 27.8% for summer (calculated from the in situ TDS data) (Table 2). This indicates that the flux of suspended sediment (the fluxes generated by physical weathering) dominated the total material exported from the Binggou catchment (bed sediments were not considered). Additionally, the lower riverine solute contents in spring than in summer (Figure 4 and Figure 5) make it difficult to calculate the annual riverine solute flux based solely on samples collected in spring or summer, as this may underestimate or overestimate the year-round material flux [2]. The solute fluxes of the Binggou catchment were 74.2, 136.4, and 105.3 t km−1 a−1, calculated from the daily spring data, daily summer data, and the average daily spring and summer data, respectively. The solute fluxes calculated from the average spring and summer data are much higher than the global average (24 t km−1 a−1) [50], which may be due to the strong physical and chemical weathering within the permafrost-underlain headwater catchment.

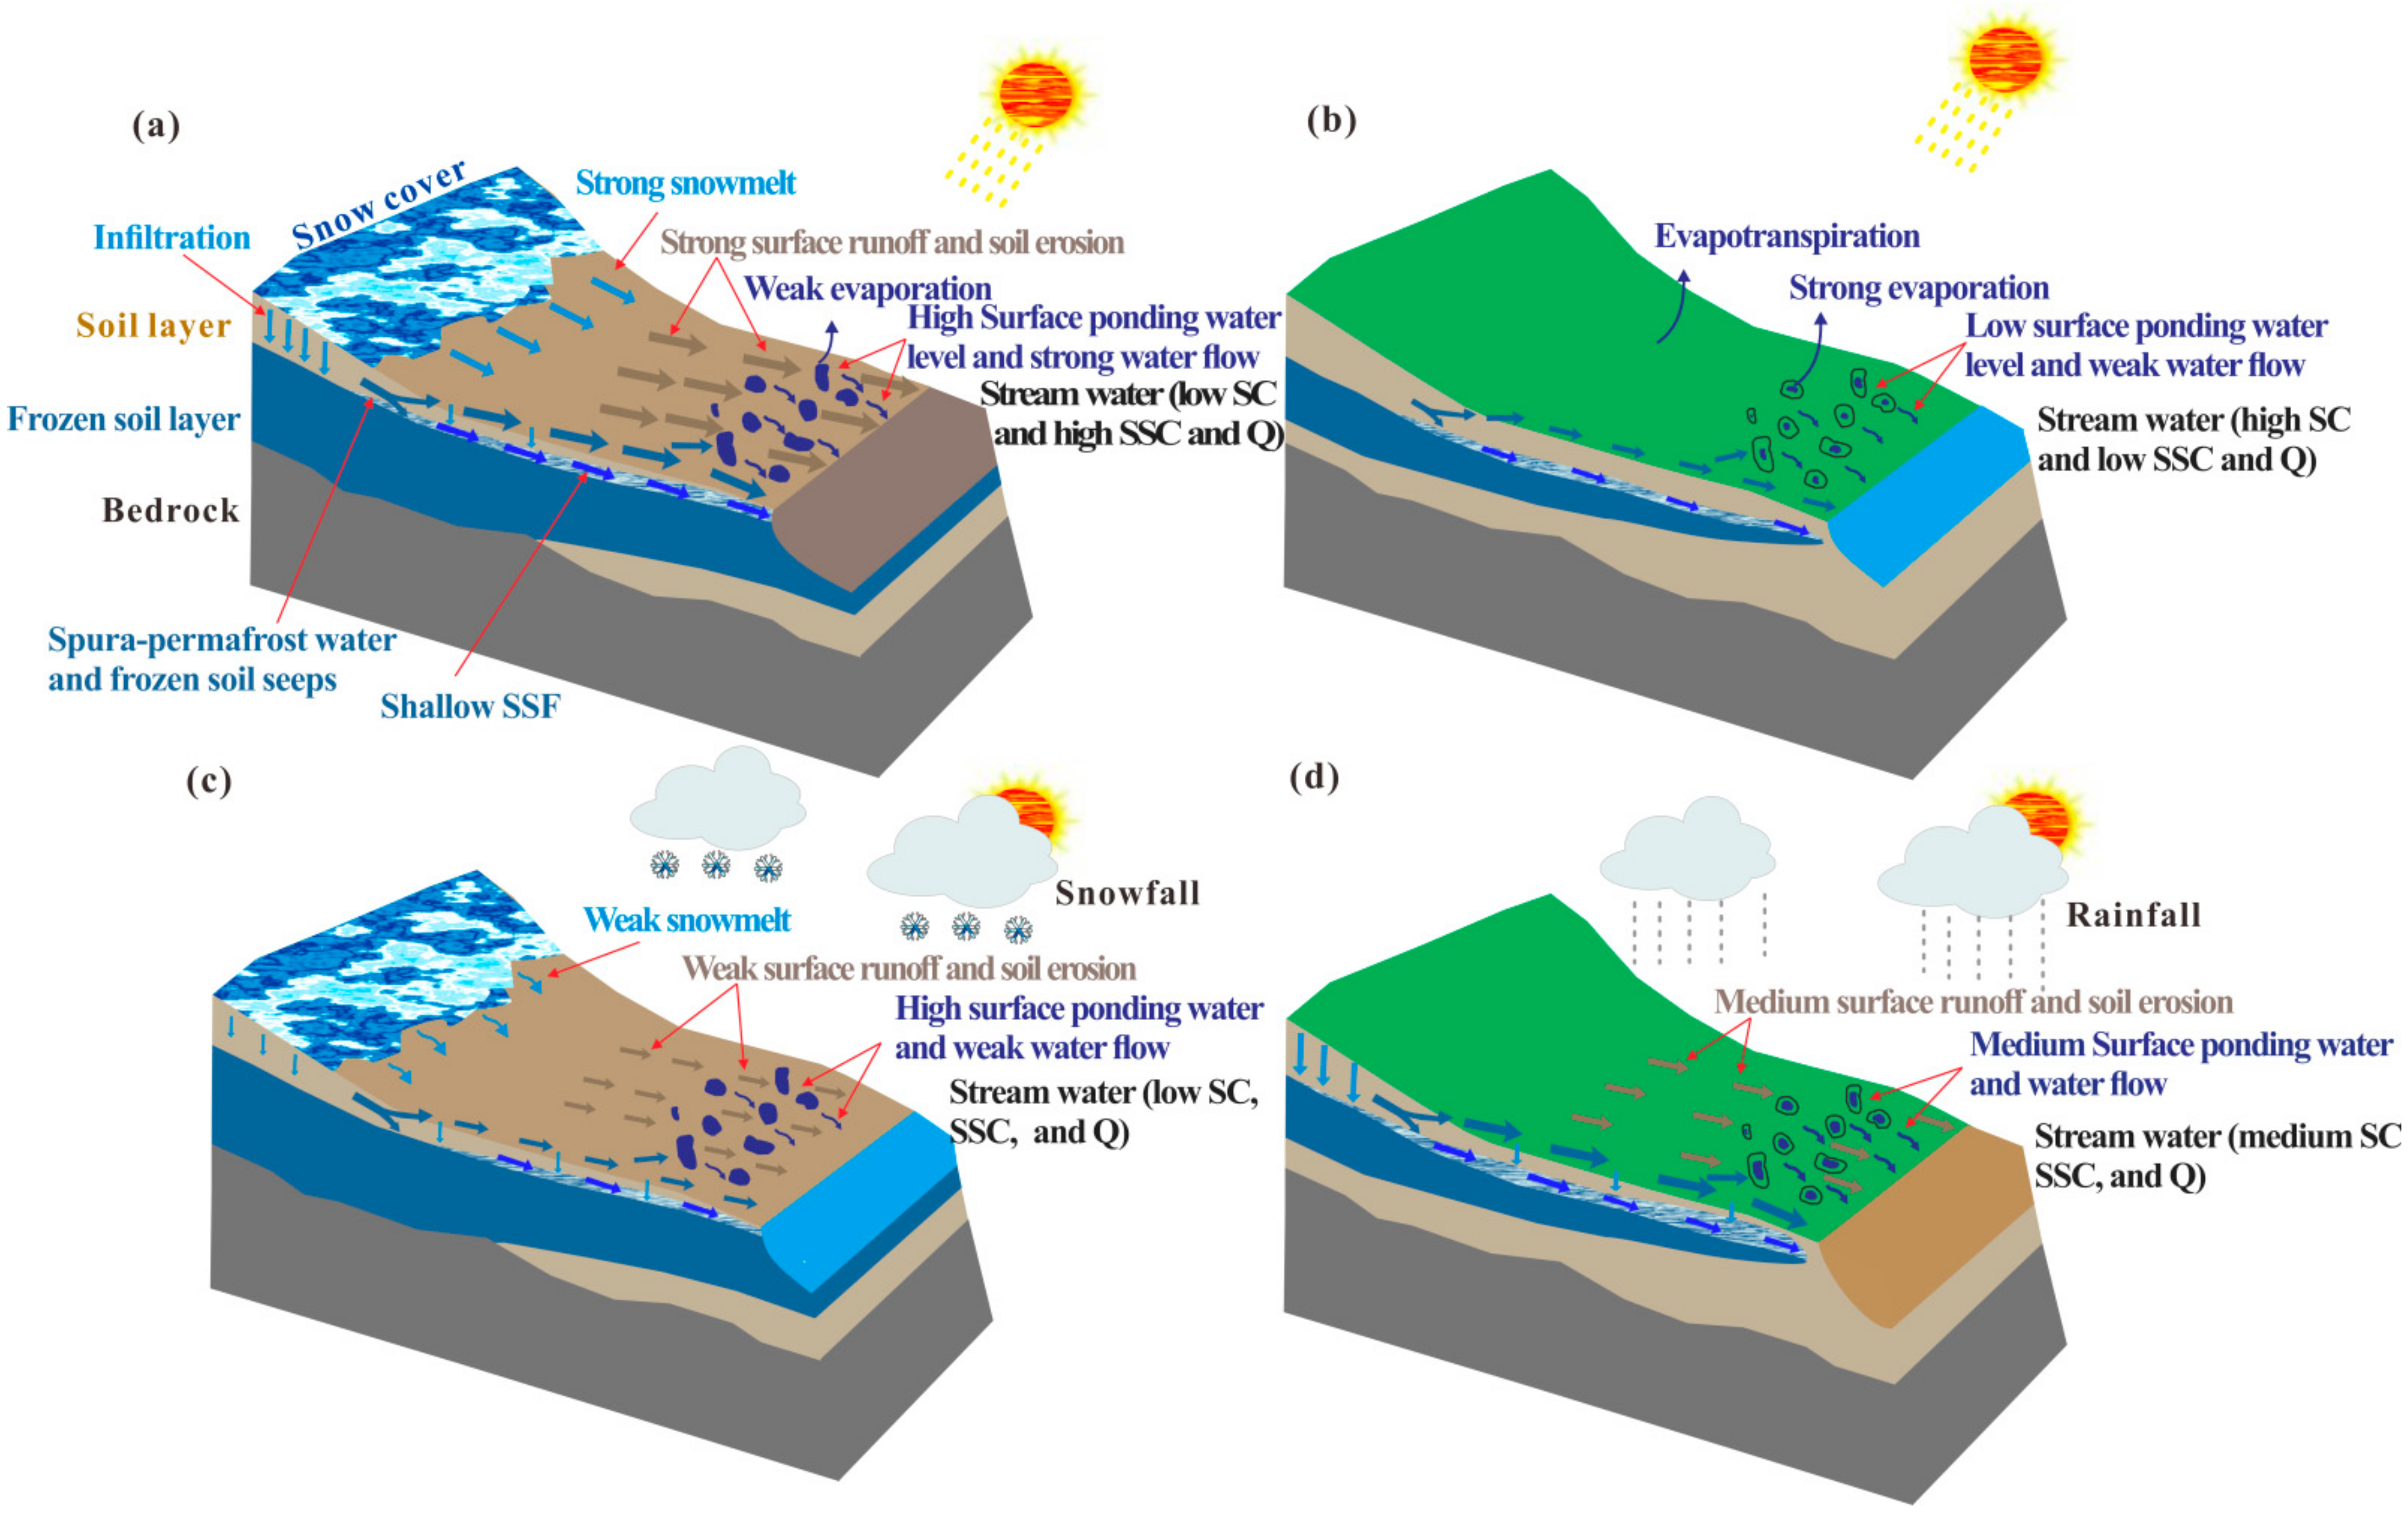
4.2. Processes Responsible for the Generation and Transport of Catchment Runoff, Suspended Sediment, and Solute

For this permafrost-underlain headwater catchment, our data reveal an obvious change in the processes responsible for the generation and transport of runoff, suspended sediment, and solutes from spring to summer. Schematic diagrams illustrating the hydrological, hydrochemical, and sedimentary regimes of the Binggou catchment are shown in Figure 7.
Two main points can be made, as follows. (1) For the spring period, which has a thin thawed soil layer, the generation of streamflow and the transport of suspended sediment and solutes were mainly controlled by snowmelt and freeze–thaw processes. As indicated by our previous studies, which focused on hillslope runoff generation processes in this permafrost region [46,65], frozen soil acts as an impermeable layer, causing the transformation of snowmelt water to hillslope runoff or streamflow, with a relatively high runoff ratio. Therefore, the streamflow discharge always increased abruptly during heavy snowmelt events (Figure 4), and as discussed above, the SSC of stream water would increase substantially during such events due to the intensive meltwater erosion (Figure 7a). Additionally, increases in the air temperature showed a nonsignificant (p > 0.05) positive influence on the streamflow discharge (Figure 6), which suggests that a high air temperature may increase the streamflow discharge, although enough sources of meltwater—that is, the AMC and event precipitation were more important for generating streamflow in spring. It has been shown that snowfall will reduce relative to rainfall and snow-depth would show continuous decreases due to the increases in air temperature [15,16]. Thus, global warming may reduce the peak of streamflow discharge generated by a concentrated snowmelt event during the late spring period (i.e., late April and early May).
During heavy snowfall events, the SSC, streamflow discharge, and solute contents may decrease because of the low air temperature and, thus, low snowmelt intensity (Figure 7c). The type of precipitation is directly determined by the near-surface air temperature, and heavy snowfall events are always accompanied by substantial cooling which reduces the snowmelt intensity [66,67,68]. Therefore, the streamflow discharge and SSC may have been low due to the absence of heavy snowmelt input and meltwater erosion. For example, there was a relatively large amount of precipitation (5 mm) during the period from 20:00 on 1 May to 09:00 on 2 May, but the streamflow discharge decreased from 1.2 m3/s at 20:00 on 1 May to less than 0.2 m3/s during the interval from 02:00 to 09:00 on 2 May, while the SSC decreased from 0.6 kg/m3 to less than 0.1 kg/m3 (Figure 5e). This was mainly due to the low air temperature, which was only −4.3 °C on average during this period, and, thus, the snowmelt almost ceased and cryogenically stored in the catchment, thus less meltwater and sediment were transported to the stream channel. Moreover, although the snowmelt intensity was low or even zero during the heavy snowfall after 22:00 on 1 May, the direct input of snowfall into the stream channel would have diluted the solute content of the stream water to some degree [69,70].
The results of the PLS-PM showed that the AMC had a significant (p < 0.05) and strong positive influence on the solute concentrations (Figure 6a), which may indicate that the streamflow was supplemented by water with high solute contents (frozen soil seeps and surface ponding water) (Table 1). The supra-permafrost water was maintained by the underlying permafrost and the input of precipitation, which could rise to the ground surface with continuous precipitation [46]. When the snowmelt intensity was high, the hillslope runoff may have pressurized supra-permafrost water becoming frozen soil seeps at the riparian zone, and then contributing to the adjacent surface waters such as surface ponding water and stream water, which led to a major contribution of water with a high solute content to the stream water, buffering the snowmelt input, which had a low solute content (Figure 7a). Therefore, the TDS and major ion concentrations of the stream water did not decrease substantially when the streamflow discharge showed abrupt increases (Figure 4 and Figure 5).
(2) For the summer period, when the active layer thickness was greater and evapotranspiration was greater in spring, the Binggou catchment showed a deeper flow pathway, less soil erosion, and buffered hydrochemical regimes of the stream water (Figure 7b,d). First, as indicated by [46,65], with the thawing of the frozen soil layers, the shallow subsurface flow was the major flow pathway in summer. The TDS and major ion concentrations of the stream water were higher in summer than in spring (Figure 4 and Figure 5), which was linked to the longer contact time between the soil pore water and soil and rock minerals [36,46]. This was supported by the major ion contents of riparian soil water at different soil layers, as the major ion contents of riparian soil water showed an increasing trend with increasing soil depth, and the reasons can be attributed to soil leaching, self-purification, and desalination effects during freezing, together with the high mobility of elements associated with the transport of organic matter [36,71,72]. Therefore, the sources and the factors controlling the solute contents in the Binggou stream water shifted from spring to summer. Furthermore, under the dry conditions of the summer period, the streamflow discharge was low and relatively uniform because the streamflow was maintained by subsurface flow and strong evapotranspiration (Figure 7b), and the solute contents were more concentrated than in spring (Figure 7a,c) and the heavy rainfall events of the summer period (Figure 7d). Second, the surface ponding water level and supra-permafrost water level may have declined continuously because of the strong evapotranspiration and the greater active layer thickness in summer, and, thus, the water and solute fluxes from supra-permafrost water to the stream water were relatively weak during the dry conditions (Figure 7b), and the stream water may have been diluted by the input of heavy rainfall with an intermediate solute content (Figure 7d).
The SSC of stream water was generally lower in summer than in spring, which can be attributed to the improved growth conditions of the alpine meadow vegetation, and the thicker active layer in summer. The SSC of the stream water would have been very high during heavy rainfall events after a relatively long rainless period (Figure 4b). Additionally, the results of the PLS-PM showed that no latent variables had significant influences on the sediments in summer (Figure 6). The low SSC of the stream water and the low correlation between the influencing factors and the sediments during SPR can be partly attributed to the sampling method used for the stream water samples—that is, the stream water samples were collected at a fixed time with an interval of 1–3 days. First, the SSC showed a diurnal cycle and was driven by the increased air temperature and snowmelt intensity in spring, and the sampling time of 17:00 would have resulted in the collection of stream water samples with a relatively high SSC. Second, because of the unique atmospheric circulation system of mountain areas—including the combination of relatively moist air and abrupt radiative cooling at sunset in the late afternoon [73], and nocturnal ridge-to-valley convection before sunrise [74,75]—the diurnal precipitation distribution was uneven, and more precipitation occurred at night. Thus, sampling at a fixed time may not always have resulted in the collection of stream water samples with a high SSC in summer. Therefore, the fixed-time sampling in spring was more representative than that in summer, and the continuous observation of SSC using turbidity meters and high-frequency sampling during heavy rainfall events is needed in subsequent studies, to provide more detailed data on the temporal variation of SSC and to better reveal the influences of hydrometeorological factors on the sedimentary regimes.
In this study, we systematically summarized the generation and transport processes of runoff, suspended sediment, and solutes under different conditions in a permafrost-underlain headwater catchment (Figure 7). Our findings demonstrated that with the permafrost degradation under future global warming, the solute fluxes in permafrost-underlain headwater catchments may increase due to the deepening of the active layer thickness and the expansion of discontinuous permafrost areas, but the suspended sediment flux in spring may decrease due to the earlier initial thawing of frozen soil and snowmelt stage. Therefore, our findings supported the previous literature, which demonstrated that with the earlier snowfall in spring and permafrost degradation against the background of global warming increases, soil erosion would reduce along with the deepening of the major flow pathway and weakening of the snowmelt erosion intensity, and the solute content of stream water increased as the result of the interaction between water flow and soil and bedrock [24,30,35]. Our results emphasize the important influence of specific landscape units (e.g., surface ponding water and frozen soil seeps) and the underlying permafrost and soil freeze–thaw processes on the catchment hydrological, hydrochemical, and sedimentary regimes. The insights obtained are potentially widely applicable because the landscapes of the Binggou catchment (e.g., alpine meadow, subsidence pits, and the riparian saturated zone) are widely distributed on the Tibetan Plateau and in other permafrost-underlain headwater catchments. Thus, our findings may contribute to improving the parameterization of process-based models and the accurate prediction of the future runoff, suspended sediment, and solute fluxes in permafrost-underlain headwater catchments.

5. Conclusions

The suspended sediment and solute fluxes in spring and summer and the factors influencing them were investigated in a permafrost-underlain headwater catchment. Time series of the SSC of the Binggou stream water showed that the variations and fluxes of SSC were higher in spring than in summer. Although the daily mean flux of suspended sediment in spring was close to that in summer (46.9 t/d and 41.2 t/d, respectively), heavy rainfall events following a relatively long dry period resulted in the largest sediment yields in summer. The high sediment flux on 18 August made the largest contribution (68%) to the total suspended sediment flux in summer. Freeze–thaw processes in spring promoted meltwater erosion in summer, and the thicker thawed soil layer combined with the denser vegetation coverage in summer could effectively reduce soil erosion. The daily mean fluxes of solute contents were 6.2 t/d (calculated from the in situ TDS data) and 5.9 t/d (calculated from the SC data) in spring, and that in summer was 11.4 t/d (calculated from the in situ TDS data). The greater riverine solute fluxes in summer than in spring were linked to the long interval of soil pore water interactions with soil and rock minerals after the thawing of frozen soil. Suspended sediment flux dominated the total material exported from the Binggou catchment, with the total riverine solute flux (in tons, calculated from the in situ TDS data) being 12.6% and 27.8% of the total suspended sediment flux (in tons) in spring and summer, respectively.
The results of the PLS-PM showed that the streamflow discharge was controlled by precipitation and AMC in spring and summer, and antecedent precipitation played a more important role in generating streamflow than event precipitation and air temperature. Air temperature and precipitation showed strong and direct negative influences on the solute content of the stream water in spring and summer, respectively. This indicates that the solute content of the stream water was diluted mainly by the input of precipitation, and that the increases in the air temperature may have increased the snowmelt intensity, which led to a decrease in the solute concentrations. The AMC had a strong positive influence on the solute contents of stream water in spring, which may be due to the high level of supra-permafrost water under the wetter AMC. The hillslope runoff may have pressurized the supra-permafrost water with a high solute content to become the frozen soil seeps, causing it to contribute to the adjacent streamflow and buffer the snowfall input, which had a low solute content. The riverine suspended sediment and solute fluxes in permafrost-underlain headwater catchments show complex seasonal variations and influencing factors, and further efforts are needed to obtain continuous measurements of runoff, suspended sediment, and solute contents using automatic monitors on a longer timescale, which will enable the analysis of the seasonal and interannual variations of riverine suspended sediment and solute fluxes.

Author Contributions

Conceptualization, X.X.; methodology, X.X.; software, X.X.; validation, X.X., Z.L., K.L. and J.W.; formal analysis, X.X., Z.L., K.L. and J.W.; investigation, X.X.; resources, X.X.; data curation, X.X.; writing—original draft preparation, X.X.; writing—review and editing, X.X., Z.L., K.L. and J.W.; visualization, X.X.; supervision, X.X.; project administration, X.X.; funding acquisition, X.X. All authors have read and agreed to the published version of the manuscript.

Funding

This research was funded by the National Natural Science Foundation of China (Grant number 42101130) and the State Key Laboratory of Hydrology-Water Resources and Hydraulic Engineering, Nanjing Hydraulic Research Institute (Grant number 2020nkms02).

Data Availability Statement

The data that support the findings of this study are available from the corresponding author upon reasonable request. Moreover, discharge, suspended sediment, and solute contents data (Data Set S1) used in this study can be accessed online (https://doi.org/10.5281/zenodo.6412515 (accessed on 5 April 2022)).

Conflicts of Interest

The authors declare that they have no known competing financial interests or personal relationships that could have appeared to influence the work reported in this paper.

References

  1. Bouchez, J.; Gaillardet, J. How accurate are rivers as gauges of chemical denudation of the Earth surface? Geology 2014, 42, 171–174. [Google Scholar] [CrossRef]
  2. Mager, S.; Diack, E.; Horton, S. Catchment-scale weathering fluxes in the Southern Alps, New Zealand. Geomorphology 2018, 316, 24–34. [Google Scholar] [CrossRef]
  3. Zhang, F.; Xiao, X.; Wang, L.; Zeng, C.; Yu, Z.; Wang, G.; Shi, X. Chemical weathering and CO2 consumption in the glaciated Karuxung River catchment, Tibetan Plateau. Hydrol. Process. 2021, 35, e14330. [Google Scholar] [CrossRef]
  4. Das, P.; Sarma, K.P.; Jha, P.K.; Ranjan, R.; Herbert, R.; Kumar, M. Understanding the Cyclicity of Chemical Weathering and Associated CO2 Consumption in the Brahmaputra River Basin (India): The Role of Major Rivers in Climate Change Mitigation Perspective. Aquat. Geochem. 2016, 22, 225–251. [Google Scholar] [CrossRef]
  5. Donnini, M.; Frondini, F.; Probst, J.-L.; Probst, A.; Cardellini, C.; Marchesini, I.; Guzzetti, F. Chemical weathering and consumption of atmospheric carbon dioxide in the Alpine region. Glob. Planet. Chang. 2016, 136, 65–81. [Google Scholar] [CrossRef]
  6. Yu, Z.; Wu, G.; Keys, L.; Li, F.; Yan, N.; Qu, D.; Liu, X. Seasonal variation of chemical weathering and its controlling factors in two alpine catchments, Nam Co basin, central Tibetan Plateau. J. Hydrol. 2019, 576, 381–395. [Google Scholar] [CrossRef]
  7. Wu, W. Hydrochemistry of inland rivers in the north Tibetan Plateau: Constraints and weathering rate estimation. Sci. Total Environ. 2016, 541, 468–482. [Google Scholar] [CrossRef] [PubMed]
  8. Kellerer-Pirklbauer, A. Potential weathering by freeze-thaw action in alpine rocks in the European Alps during a nine year monitoring period. Geomorphology 2017, 296, 113–131. [Google Scholar] [CrossRef]
  9. Wu, H.; Wu, J.; Li, J.; Fu, C. Spatial variations of hydrochemistry and stable isotopes in mountainous river water from the Central Asian headwaters of the Tajikistan Pamirs. Catena 2020, 193, 104639. [Google Scholar] [CrossRef]
  10. Derakhshan-Babaei, F.; Nosrati, K.; Tikhomirov, D.; Christl, M.; Sadough, H.; Egli, M. Relating the spatial variability of chemical weathering and erosion to geological and topographical zones. Geomorphology 2020, 363, 107235. [Google Scholar] [CrossRef]
  11. Zhang, T.; Barry, R.G.; Knowles, K.; Heginbottom, J.A.; Brown, J. Statistics and characteristics of permafrost and ground-ice distribution in the Northern Hemisphere. Polar Geogr. 1999, 23, 132–154. [Google Scholar] [CrossRef]
  12. Ran, Y.; Li, X.; Cheng, G. Climate warming over the past half century has led to thermal degradation of permafrost on the Qinghai–Tibet Plateau. Cryosphere 2018, 12, 595–608. [Google Scholar] [CrossRef]
  13. Yao, T.; Wu, F.; Ding, L.; Sun, J.; Zhu, L.; Piao, S.; Deng, T.; Ni, X.; Zheng, H.; Ouyang, H. Multispherical interactions and their effects on the Tibetan Plateau’s earth system: A review of the recent researches. Natl. Sci. Rev. 2015, 2, 468–488. [Google Scholar] [CrossRef]
  14. Yao, T.; Xue, Y.; Chen, D.; Chen, F.; Thompson, L.; Cui, P.; Koike, T.; Lau, W.K.-M.; Lettenmaier, D.; Mosbrugger, V.; et al. Recent Third Pole’s Rapid Warming Accompanies Cryospheric Melt and Water Cycle Intensification and Interactions between Monsoon and Environment: Multidisciplinary Approach with Observations, Modeling, and Analysis. Bull. Am. Meteorol. Soc. 2019, 100, 423–444. [Google Scholar] [CrossRef]
  15. Wang, J.; Zhang, M.; Wang, S.; Ren, Z.; Che, Y.; Qiang, F.; Qu, D. Decrease in snowfall/rainfall ratio in the Tibetan Plateau from 1961 to 2013. J. Geogr. Sci. 2016, 26, 1277–1288. [Google Scholar] [CrossRef]
  16. Deng, H.; Pepin, N.C.; Chen, Y. Changes of snowfall under warming in the Tibetan Plateau. J. Geophys. Res. Atmos. 2017, 122, 7323–7341. [Google Scholar] [CrossRef]
  17. Lewis, T.; Lafrenière, M.J.; Lamoureux, S.F. Hydrochemical and sedimentary responses of paired High Arctic watersheds to unusual climate and permafrost disturbance, Cape Bounty, Melville Island, Canada. Hydrol. Process. 2012, 26, 2003–2018. [Google Scholar] [CrossRef]
  18. Kokelj, S.V.; Tunnicliffe, J.; Lacelle, D.; Lantz, T.C.; Chin, K.S.; Fraser, R. Increased precipitation drives mega slump development and destabilization of ice-rich permafrost terrain, northwestern Canada. Glob. Planet. Chang. 2015, 129, 56–68. [Google Scholar] [CrossRef]
  19. Toohey, R.C.; Herman-Mercer, N.M.; Schuster, P.F.; Mutter, E.A.; Koch, J.C. Multidecadal increases in the Yukon River Basin of chemical fluxes as indicators of changing flowpaths, groundwater, and permafrost. Geophys. Res. Lett. 2016, 43, 12–120, 130. [Google Scholar] [CrossRef]
  20. Shi, X.; Zhang, F.; Wang, L.; Jagirani, M.D.; Zeng, C.; Xiao, X.; Wang, G. Experimental study on the effects of multiple factors on spring meltwater erosion on an alpine meadow slope. Int. Soil Water Conserv. Res. 2020, 8, 116–123. [Google Scholar] [CrossRef]
  21. Lafrenière, M.J.; Lamoureux, S.F. Effects of changing permafrost conditions on hydrological processes and fluvial fluxes. Earth-Sci. Rev. 2019, 191, 212–223. [Google Scholar] [CrossRef]
  22. Oztas, T.; Fayetorbay, F. Effect of freezing and thawing processs on soil aggregate stability. Catena 2003, 52, 1–8. [Google Scholar] [CrossRef]
  23. Ferrick, M.G.; Gatto, L.W. Quantifying the effect of a freeze-thaw cycle on soil erosion: Laboratory experiments. Earth Surf. Process. Landf. J. Br. Geomorphol. Res. Group 2005, 30, 1305–1326. [Google Scholar] [CrossRef]
  24. Sadeghi, S.H.; Raeisi, M.B.; Hazbavi, Z. Influence of freeze-only and freezing-thawing cycles on splash erosion. Int. Soil Water Conserv. Res. 2018, 6, 275–279. [Google Scholar] [CrossRef]
  25. Oeurng, C.; Sauvage, S.; Sánchez-Pérez, J.-M. Dynamics of suspended sediment transport and yield in a large agricultural catchment, southwest France. Earth Surf. Process. Landf. 2010, 35, 1289–1301. [Google Scholar] [CrossRef]
  26. López-Tarazón, J.; Batalla, R.; Vericat, D.; Balasch, J. Rainfall, runoff and sediment transport relations in a mesoscale mountainous catchment: The River Isábena (Ebro basin). Catena 2010, 82, 23–34. [Google Scholar] [CrossRef]
  27. Lana-Renault, N.; Alvera, B.; García-Ruiz, J.M. Runoff and Sediment Transport during the Snowmelt Period in a Mediterranean High-Mountain Catchment. Arct. Antarct. Alp. Res. 2011, 43, 213–222. [Google Scholar] [CrossRef]
  28. Malone, L.; Lacelle, D.; Kokelj, S.; Clark, I.D. Impacts of hillslope thaw slumps on the geochemistry of permafrost catchments (Stony Creek watershed, NWT, Canada). Chem. Geol. 2013, 356, 38–49. [Google Scholar] [CrossRef]
  29. Pokrovsky, O.S.; Manasypov, R.M.; Loiko, S.V.; Krickov, I.A.; Kopysov, S.G.; Kolesnichenko, L.G.; Vorobyev, S.N.; Kirpotin, S.N. Trace element transport in western Siberian rivers across a permafrost gradient. Biogeosciences 2016, 13, 1877–1900. [Google Scholar] [CrossRef]
  30. Roberts, K.E.; Lamoureux, S.F.; Kyser, T.K.; Muir, D.C.G.; Lafreniere, M.; Iqaluk, D.; Pienkowski, A.; Normandeau, A. Climate and permafrost effects on the chemistry and ecosystems of High Arctic Lakes. Sci. Rep. 2017, 7, 13292. [Google Scholar] [CrossRef] [PubMed] [Green Version]
  31. Wu, Y.; Ouyang, W.; Hao, Z.; Lin, C.; Liu, H.; Wang, Y. Assessment of soil erosion characteristics in response to temperature and precipitation in a freeze-thaw watershed. Geoderma 2018, 328, 56–65. [Google Scholar] [CrossRef]
  32. Jones, B.M.; Grosse, G.; Arp, C.D.; Jones, M.C.; Anthony, K.W.; Romanovsky, V.E. Modern thermokarst lake dynamics in the continuous permafrost zone, northern Seward Peninsula, Alaska. J. Geophys. Res. Biogeosci. 2011, 116, 1–13. [Google Scholar] [CrossRef]
  33. Liljedahl, A.K.; Boike, J.; Daanen, R.P.; Fedorov, A.N.; Frost, G.V.; Grosse, G.; Hinzman, L.D.; Iijma, Y.; Jorgen-son, J.C.; Matveyeva, N.; et al. Pan-Arctic ice-wedge degradation in warming permafrost and its influence on tundra hydrology. Nat. Geosci. 2016, 9, 312–318. [Google Scholar] [CrossRef]
  34. Luo, J.; Niu, F.; Lin, Z.; Liu, M.; Yin, G. Recent acceleration of thaw slumping in permafrost terrain of Qinghai-Tibet Plateau: An example from the Beiluhe Region. Geomorphology 2019, 341, 79–85. [Google Scholar] [CrossRef]
  35. Mu, C.; Shang, J.; Zhang, T.; Fan, C.; Wang, S.; Peng, X.; Zhong, W.; Zhang, F.; Mu, M.; Jia, L. Acceleration of thaw slump during 1997–2017 in the Qilian Mountains of the northern Qinghai-Tibetan plateau. Landslides 2020, 17, 1051–1062. [Google Scholar] [CrossRef]
  36. Ji, X.; Abakumov, E.; Polyakov, V.; Xie, X. Mobilization of Geochemical Elements to Surface Water in the Active Layer of Permafrost in the Russian Arctic. Water Resour. Res. 2021, 57, e2020WR028269. [Google Scholar] [CrossRef]
  37. Mote, P.W.; Hamlet, A.F.; Clark, M.P.; Lettenmaier, D.P. Declining Mountain Snowpack In Western North America. Bull. Am. Meteorol. Soc. 2005, 86, 39–50. [Google Scholar] [CrossRef]
  38. Knowles, N.; Dettinger, M.D.; Cayan, D.R. Trends in Snowfall versus Rainfall in the Western United States. J. Clim. 2006, 19, 4545–4559. [Google Scholar] [CrossRef]
  39. Liu, S.; Li, X.; Xu, Z.; Che, T.; Xiao, Q.; Ma, M.; Liu, Q.; Jin, R.; Guo, J.; Wang, L.; et al. The Heihe Integrated Observatory Network: A Basin-Scale Land Surface Processes Observatory in China. Vadose Zone J. 2018, 17, 180072-21. [Google Scholar] [CrossRef]
  40. Che, T.; Li, X.; Liu, S.; Li, H.; Xu, Z.; Tan, J.; Zhang, Y.; Ren, Z.; Xiao, L.; Deng, J.; et al. Integrated hydrometeorological, snow and frozen-ground observations in the alpine region of the Heihe River Basin, China. Earth Syst. Sci. Data 2019, 11, 1483–1499. [Google Scholar] [CrossRef] [Green Version]
  41. Li, H.Y.; Wang, J.; Bai, Y.J.; Li, Z.; Dou, Y. The snow hydrological processes during a Representative snow cover period in Binggou Watershed in the upper reaches of Heihe River (In Chinese with English abstract). J. Glaciol. Geocryol. 2009, 31, 293–300. Available online: http://ir.casnw.net/handle/362004/11865 (accessed on 15 April 2009).
  42. Yang, Z.; Yang, Z.; Liang, F.X.; Wang, Q. Permafrost hydrological processes in Binggou basin of Qilian mountains (In Chinese with English abstract). J. Glaciol. Geocryol. 1993, 15, 235–241. Available online: http://www.bcdt.ac.cn/CN/article/downloadArticleFile.do?attachType=PDF&id=2216 (accessed on 5 September 2022).
  43. Wang, Q.F.; Zhang, T.J.; Wu, J.C.; Peng, X.Q.; Zhong, X.Y.; Mu, C.C.; Wang, K.; Wu, Q.B.; Cheng, G.D. Investigation on permafrost distribution over the upper reaches of the Heihe River in the Qilian Mountains. J. Glaciol. Geocryol. 2013, 35, 19–25. [Google Scholar] [CrossRef]
  44. Cheng, G.; Jin, H. Permafrost and groundwater on the Qinghai-Tibet Plateau and in northeast China. Hydrogeol. J. 2013, 21, 5–23. [Google Scholar] [CrossRef]
  45. Xiao, X.; Zhang, F.; Li, X.; Wang, G.; Zeng, C.; Shi, X. Hydrological functioning of thawing soil water in a permafrost-influenced alpine meadow hillslope. Vadose Zone J. 2020, 19, e20022. [Google Scholar] [CrossRef]
  46. Xiao, X.; Zhang, F.; Li, X.; Zeng, C.; Shi, X.; Wu, H.; Jagirani, M.D.; Che, T. Using stable isotopes to identify major flow pathways in a permafrost influenced alpine meadow hillslope during summer rainfall period. Hydrol. Process. 2020, 34, 1104–1116. [Google Scholar] [CrossRef]
  47. Wang, N.L.; Zhang, S.B.; He, J.Q.; Pu, J.C.; Wu, X.B.; Jiang, X. Tracing the major source area of the mountainous runoff generation of the Heihe River in northwest China using stable isotope technique. Chin. Sci. Bull. 2009, 54, 2751–2757. [Google Scholar] [CrossRef]
  48. Sanchez, G. PLS path modeling with R. Berkeley Trowchez Ed. 2013, 383, 551. Available online: http://gastonsanchez.com/PLS_Path_Modeling_with_R.pdf (accessed on 1 January 2013).
  49. Ravand, H.; Baghaei, P. Partial least squares structural equation modeling with R. Pract. Assess. Res. Eval. 2016, 21, 11. [Google Scholar] [CrossRef]
  50. Gaillardet, J.; Dupré, B.; Louvat, P.; Allègre, C. Global silicate weathering and CO2 consumption rates deduced from the chemistry of large rivers. Chem. Geol. 1999, 159, 3–30. [Google Scholar] [CrossRef]
  51. Yu, W.; Yao, T.; Tian, L.; Ma, Y.; Ichiyanagi, K.; Wang, Y.; Sun, W. Relationships between δ18O in precipitation and air temperature and moisture origin on a south–north transect of the Tibetan Plateau. Atmos. Res. 2008, 87, 158–169. [Google Scholar] [CrossRef]
  52. Yao, T.; Masson-Delmotte, V.; Gao, J.; Yu, W.; Yang, X.; Risi, C.; Sturm, C.; Werner, M.; Zhao, H.; He, Y.; et al. A review of climatic controls on δ18O in precipitation over the Tibetan Plateau: Observations and simulations. Rev. Geophys. 2013, 51, 525–548. [Google Scholar] [CrossRef]
  53. Andermann, C.; Crave, A.; Gloaguen, R.; Davy, P.; Bonnet, S. Connecting source and transport: Suspended sediments in the Nepal Himalayas. Earth Planet. Sci. Lett. 2012, 351, 158–170. [Google Scholar] [CrossRef]
  54. Chen, F.; Cai, Q.; Sun, L.; Lei, T. Discharge-sediment processes of the Zhadang glacier on the Tibetan Plateau measured with a high frequency data acquisition system. Hydrol. Process. 2016, 30, 4330–4338. [Google Scholar] [CrossRef]
  55. Zeng, C.; Zhang, F.; Lu, X.; Wang, G.; Gong, T. Improving sediment load estimations: The case of the Yarlung Zangbo River (the upper Brahmaputra, Tibet Plateau). Catena 2018, 160, 201–211. [Google Scholar] [CrossRef]
  56. Singh, V.B.; Ramanathan, A.; AL, R.; Kumar, M. Seasonal variation of the solute and suspended sediment load in Gangotri glacier meltwater, central Himalaya, India. J. Southeast Asian Earth Sci. 2014, 79, 224–234. [Google Scholar] [CrossRef]
  57. Coe, J.; Kean, J.; Godt, J.; Baum, R.; Jones, E.S.; Gochis, D.J.; Anderson, G.S. New insights into debris-flow hazards from an extraordinary event in the Colorado Front Range. GSA Today 2014, 24, 4–10. [Google Scholar] [CrossRef]
  58. Parker, R.N.; Hales, T.; Mudd, S.M.; Grieve, S.; Constantine, J.A. Colluvium supply in humid regions limits the frequency of storm-triggered landslides. Sci. Rep. 2016, 6, 34438. [Google Scholar] [CrossRef]
  59. Patton, A.I.; Rathburn, S.L.; Capps, D.M. Landslide response to climate change in permafrost regions. Geomorphology 2019, 340, 116–128. [Google Scholar] [CrossRef]
  60. Beel, C.R.; Orwin, J.F.; Holland, P.G. Controls on slope-to-channel fine sediment connectivity in a largely ice-free valley, Hoophorn Stream, Southern Alps, New Zealand. Earth Surf. Process. Landf. 2011, 36, 981–994. [Google Scholar] [CrossRef]
  61. Taylor, R.J.; Massey, C.; Fuller, I.C.; Marden, M.; Archibald, G.; Ries, W. Quantifying sediment connectivity in an actively eroding gully complex, Waipaoa catchment, New Zealand. Geomorphology 2018, 307, 24–37. [Google Scholar] [CrossRef]
  62. Wolff-Boenisch, D.; Gabet, E.J.; Burbank, D.W.; Langner, H.; Putkonen, J. Spatial variations in chemical weathering and CO2 consumption in Nepalese High Himalayan catchments during the monsoon season. Geochim. Cosmochim. Acta 2009, 73, 3148–3170. [Google Scholar] [CrossRef]
  63. Sun, M.; Wu, W.; Ji, X.; Wang, X.; Qu, S. Silicate weathering rate and its controlling factors: A study from small granitic watersheds in the Jiuhua Mountains. Chem. Geol. 2019, 504, 253–266. [Google Scholar] [CrossRef]
  64. Piqué, G.; Batalla, R.; López, R.; Sabater, S. The fluvial sediment budget of a dammed river (upper Muga, southern Pyrenees). Geomorphology 2017, 293, 211–226. [Google Scholar] [CrossRef]
  65. Xiao, X.; Zhang, F.; Che, T.; Shi, X.; Zeng, C.; Wang, G. Changes in plot-scale runoff generation processes from the spring–summer transition period to the summer months in a permafrost-dominated catchment. J. Hydrol. 2020, 587, 124966. [Google Scholar] [CrossRef]
  66. Fassnacht, S.; Kouwen, N.; Soulis, E. Surface temperature adjustments to improve weather radar representation of multi-temporal winter precipitation accumulations. J. Hydrol. 2001, 253, 148–168. [Google Scholar] [CrossRef]
  67. McCabe, G.J.; Clark, M.P.; Hay, L.E. Rain-on-Snow Events in the Western United States. Bull. Am. Meteorol. Soc. 2007, 88, 319–328. [Google Scholar] [CrossRef]
  68. Ye, H. Changes in Frequency of Precipitation Types Associated with Surface Air Temperature over Northern Eurasia during 1936–1990. J. Clim. 2008, 21, 5807–5819. [Google Scholar] [CrossRef]
  69. Jin, L.; Siegel, D.I.; Lautz, L.K.; Lu, Z. Identifying streamflow sources during spring snowmelt using water chemistry and isotopic composition in semi-arid mountain streams. J. Hydrol. 2012, 470, 289–301. [Google Scholar] [CrossRef]
  70. Winnick, M.J.; Carroll, R.W.H.; Williams, K.H.; Maxwell, R.M.; Dong, W.; Maher, K. Snowmelt controls on concentration-discharge relationships and the balance of oxidative and acid-base weathering fluxes in an alpine catchment, East River, Colorado. Water Resour. Res. 2017, 53, 2507–2523. [Google Scholar] [CrossRef]
  71. Throckmorton, H.M.; Newman, B.D.; Heikoop, J.M.; Perkins, G.B.; Feng, X.; Graham, D.E.; O’Malley, D.; Vesselinov, V.V.; Young, J.; Wullschleger, S.D.; et al. Active layer hydrology in an arctic tundra ecosystem: Quantifying water sources and cycling using water stable isotopes. Hydrol. Process. 2016, 30, 4972–4986. [Google Scholar] [CrossRef]
  72. Wang, W.; Wu, T.; Zhao, L.; Li, R.; Xie, C.; Qiao, Y.; Zhang, H.; Zhu, X.; Yang, S.; Qin, Y.; et al. Hydrochemical characteristics of ground ice in permafrost regions of the Qinghai-Tibet Plateau. Sci. Total Environ. 2018, 626, 366–376. [Google Scholar] [CrossRef]
  73. Immerzeel, W.W.; Petersen, L.R.; Ragettli, S.; Pellicciotti, F. The importance of observed gradients of air temperature and precipitation for modeling runoff from a glacierized watershed in the Nepalese Himalayas. Water Resour. Res. 2014, 50, 2212–2226. [Google Scholar] [CrossRef] [Green Version]
  74. Sugimoto, S.; Ueno, K.; Sha, W. Transportation of Water Vapor into the Tibetan Plateau in the Case of a Passing Synoptic-Scale Trough. J. Meteorol. Soc. Jpn. Ser. II 2008, 86, 935–949. [Google Scholar] [CrossRef]
  75. Liu, X.; Bai, A.; Liu, C. Diurnal variations of summertime precipitation over the Tibetan Plateau in relation to orographically-induced regional circulations. Environ. Res. Lett. 2009, 4, 045203. [Google Scholar] [CrossRef]
Figure 1. Location and topography of the Binggou catchment with observing and sampling location.
Water 14 02782 g001
Figure 2. The path diagram of partial least-squares path modeling includes manifest (rectangles) and latent (ovals) variables.
Water 14 02782 g002
Figure 3. Piper diagram of major ions of different water types.
Water 14 02782 g003
Figure 4. Time series of air temperature and precipitation at the automatic weather station (a), streamflow discharge and suspended sediment content at the outlet of the Binggou catchment (b), and total dissolved solids (TDS) of different water types (c).
Water 14 02782 g004
Figure 5. The variation of air temperature and precipitation (a,f), streamflow discharge (be,gj), suspended sediment content (e,j), total dissolved solids (TDS) (d,i), and major ions content (bd,gi) at the outlet of the Binggou catchment during spring (left panels) and summer (right panels) intensive 24 h sampling.
Water 14 02782 g005
Figure 6. Results of partial least-squares path modeling for the periods (a) from 18 April to 5 May (the spring period) and (b) from 14 July to 23 August (the summer period). The numbers and asterisks adjacent to the arrows represent estimated values and the significance of the correlation, and the blue/red arrows represent positive/negative correlations. Significant (p < 0.05) and highly significant (p < 0.01) correlations are represented by asterisks (*) and double-asterisks (**), respectively, and the GOF represents the overall goodness of fit of the PLS-PM.
Water 14 02782 g006
Figure 7. Schematic figures illustrating the generation and transport processes of runoff (Q), suspended sediment (SSC), and solute (SC) of the Binggou catchment during the spring period (left panels) and the summer period (right panels) under heavy snowmelt events (a), dry conditions (b), heavy snowfall events (c), and heavy rainfall events (d). Note that the conceptual diagrams partly refer to the conceptual diagram shown in [46,65], and arrow sizes approximate the magnitudes of the water flow.
Water 14 02782 g007
Table 1. Major ions, Si, and total dissolved solids (TDS) of the different water types (unit of major ions, Si, and TDS: mg/L).
Water TypesValuesTDSCa2+Mg2+K+Na+SiO2ClNO3SO42−HCO3
Stream water
Spring stream waterAverage142.324.45.81.44.21.24.72.446.547.0
SD34.28.12.90.62.10.52.21.123.731.0
Summer stream waterAverage233.133.814.01.68.42.14.24.599.759.3
SD20.96.81.90.31.40.20.90.59.424.6
Spring intensive 24 h samplingAverage123.920.74.61.23.01.13.92.338.339.0
SD18.97.02.40.51.50.52.01.219.328.0
Summer intensive 24 h samplingAverage251.033.715.21.69.12.04.94.5105.358.8
SD3.86.20.40.10.70.10.40.45.121.4
Precipitation
SnowfallAverage19.51.70.30.30.70.17.31.08.20.0
SD3.40.30.10.00.40.03.60.54.70.0
RainfallAverage8.11.20.20.50.50.11.01.61.41.7
SD4.40.70.10.40.40.00.61.50.61.3
Runoff components
20 cm riparian soil waterAverage400.747.837.60.22.45.21.40.596.1214.8
SD46.81.58.50.10.40.50.20.150.532.6
50 cm riparian soil waterAverage535.950.760.61.33.58.43.31.9172.4242.2
SD71.39.13.50.20.21.50.61.856.1112.6
80 cm riparian soil waterAverage573.534.673.52.612.914.74.50.5214.6230.5
SD103.811.113.00.412.88.31.60.1105.5193.5
30-60 cm subsurface flowAverage162.620.013.70.62.07.31.21.030.793.4
SD26.55.01.60.31.20.50.71.58.724.1
Surface ponding waterAverage276.836.324.50.92.42.54.50.994.0113.3
SD170.019.618.20.51.01.51.70.764.372.0
Frozen soil seepsAverage476.468.942.21.03.34.110.42.0232.3116.4
SD245.037.423.50.81.31.23.71.5155.144.3
Table 2. Fluxes of discharge, suspended sediment, and solute in the Binggou stream water from 18 April to 5 May (the spring period) and from 14 July to 23 August (the summer period).
TimeDaysValue TypeDischargeSediment FluxSolute Flux aSolute Flux b
Spring period (18 April to 5 May)18Daily mean3.9 × 104 m346.9 ton6.2 ton5.9 ton
Sum69.9 × 104 m3892.4 ton112.4 ton105.5 ton
Summer period (14 July to 23 August)32Daily mean5.3 × 104 m341.2 ton11.4 ton
Sum169.3 × 104 m31319 ton366.3 ton
a was calculated by the daily data of TDS, which was measured by the portable water quality monitor. b was calculated by the specific conductivity data with a 1 h interval and transferred to TDS, which was measured by the Hobo conductivity logger.
Publisher’s Note: MDPI stays neutral with regard to jurisdictional claims in published maps and institutional affiliations.

