
Improvement of the Flow Pattern of a Forebay with a Side-Intake Pumping Station by Diversion Piers Based on Orthogonal Test Method

1
College of Mechanics and Materials, Hohai University, Nanjing 210098, China
2
College of Agricultural Science and Engineering, Hohai University, Nanjing 210098, China
*
Author to whom correspondence should be addressed.
Water 2022, 14(17), 2663; https://doi.org/10.3390/w14172663
Submission received: 30 July 2022
/
Revised: 23 August 2022
/
Accepted: 26 August 2022
/
Published: 28 August 2022
(This article belongs to the Special Issue Advancement in the Fluid Dynamics Research of Reversible Pump-Turbine)
Abstract
:The flow analysis of the forebay of a lateral intake pumping station with asymmetrical operating pumps was carried out with a realizable k-ε turbulent model and SIMPLEC (Semi Implicit Method for Pressure Linked Equations Consistent) algorithm. The Pressure Inlet boundary condition was adopted and the pressure between the top surface and the bottom surface was linear with the height of the inlet section. The Mass Flow Outlet boundary condition was also adopted to ensure the accuracy and precision of the CFD (Computational Fluid Dynamics) simulation. The diversion pier was selected as the optimization strategy based on the flow parameters. The layout of the diversion piers was designed with four parameters which are the relative length, relative height, width, and straight-line distance of the piers’ tail. Each parameter had three values. Based on the orthogonal test, nine groups of the numerical simulation on different layouts of diversion piers were analyzed with the uniformity of axial flow velocity and weighted average angle of the flow velocity of the inlet cross-section of each pump, reducing the number of tests from 64 (43) groups to 9 groups, improving work efficiency. The results show that the diversion piers had a significant adjustment of uniformity of axial flow velocity and weighted average angle of flow velocity. After optimization of the forebay, the uniformity of axial flow velocity of intake of No.1 pump was 80.26% and the weighted average angle of flow velocity was 77.68°. The above values of the No.2 pump were 98.74% and 87.84°, respectively. The values of the No.4 pump were 93.41% and 77.28°. The results of numerical simulation, which was carried out to estimate the rectification effect under the operation combination of the No.1, No.3, and No.4 pumps, showed that the uniformity and the angle of the No.1 pump were 92.65% and 72.66°, respectively, the uniformity and the angle of No.3 pump were 94.54% and 85.14°, and the uniformity and the angle of the No.4 pump were 75.81% and 78.21°. This research proves that the orthogonal test method, in a reasonable and convenient way, can be applied in hydraulic optimization for a lateral intake pumping station.
1. Introduction
In the forebay of a lateral intake pumping station, vortices, spiral flows, and large-scale reversed flows occurred, directly affecting the pump’s inlet conditions, and resulting in a decline in the pump’s energy performance and steam erosion performance. These flow patterns also cause vibration in the unit and may even jeopardize its safety. Therefore, rectification measures must be developed for the lateral intake pumping stations [1,2,3]. In order to improve flow performance, some researchers have studied three-dimensional flows in pump or pumping station intakes [4,5,6,7,8]. Several studies have been conducted on the flow and the alteration of the flow pattern in the forebay of the pumping stations. Kadam P. et al. [9] studied the flow field of the inlet building of a pumping station using physical model tests along with numerical simulation techniques. They also evaluated the flow characteristics of the forebay and the inlet pipe and discovered that the poor intake flow pattern was caused by the high diffusion angle of the forebay and small inundation depth. To improve the flow in the forebay of the pumping station, Liu, C. et al. [10,11] used division piers that study and validate conclusions numerically and experimentally. Feng X. [12] used the rectifier sill as a rectifying measure for the forward inflow forebay of the pumping station. Li J. et al. [13] simulated flow patterns in the forebay and suction sump of the Tianshan pumping station through a finite element analysis approach. Xu, B. et al. [14] studied the influence of the length of the diversion piers on the flow pattern in an asymmetric combined sluice-pump station project based on the CFD numerical simulation. Finally, Xia, C. et al. [15] added the inverted T-shaped diversion piers in the forebay to significantly improve the uniformity of the internal flow velocity distribution.
Luo, C. et al. [16] added the sill to rectify the flow pattern in the forebay and analyzed the general rules of the position and height of the sill. Yu, Y. et al. [17] studied the influence of the flow deflector on the flow pattern in the forebay of the pumping station and obtained the reasonable layout parameters of the flow deflector based on the physical model test and numerical simulation. According to a study by Luo, C. et al. [18], opening the diversion pier can lower the lateral and axial flow velocity as well as the oblique flow area of the surface layer of the flow surface in front of the pier head, enhancing navigational safety. The orthogonal test method is a scientific approach to testing a design based on the analysis of multi-component and multi-level test situations. It significantly reduces the number of tests while allowing for the investigation of the influence of each factor level on evaluation indices through the creation of orthogonal test tables and ranges. The influence of each factor on the head of the pump was investigated by Wang, W. et al. [19] using an orthogonal test design with four factors, three levels, and numerical simulation calculation. J. Zhou [20] obtained the influence of each factor on the uniformity of axial flow velocity and the weighted average angle of velocity by the length, width, radian, and relative height of the orthogonal test design of five factors and four levels. The study by Xu, B. et al. [21] showed that the orthogonal test method has a significant effect on the parameter design for the rectification measures of pumping stations.
The orthogonal test method can optimize the hydraulic design of the diversion piers. Numerous studies combining physical model testing and numerical simulation have been carried out for the rectification measures for the forebay of pumping stations. These studies show that the results of the CFD numerical simulation are essentially similar to those of the physical model testing and that the only approach to enhance the flow pattern of the forebay of pumping stations is through the use of the CFD numerical simulation method [22,23,24,25,26]. As a result, in this paper, the CFD numerical simulation method will be used to analyze the flow pattern of the forebay of a specific pumping station and to improve the design parameters of the diversion pier. The analysis method and procedure are shown in Figure 1.
The novelty of this study lies in the object of flow analysis, which includes not only the forebay with side-intake of the pumping station but also asymmetrical operating pumps and nine groups of numerical simulation on the various layouts of diversion piers investigated using the orthogonal test with uniform axial flow velocity and weighted average angle of the flow velocity at the inlet cross-section of each pump. This study is divided into five sections: study area and method, typical sections in calculation domain and evaluation indexes of flow pattern in the forebay, design of diversion piers based on the orthogonal test, CFD analysis of Pumps 1, 3, and 4, and conclusion. This study provides valuable resources for related topics of interest in pumping station engineering.
2. Study Area and Method
2.1. Study Area
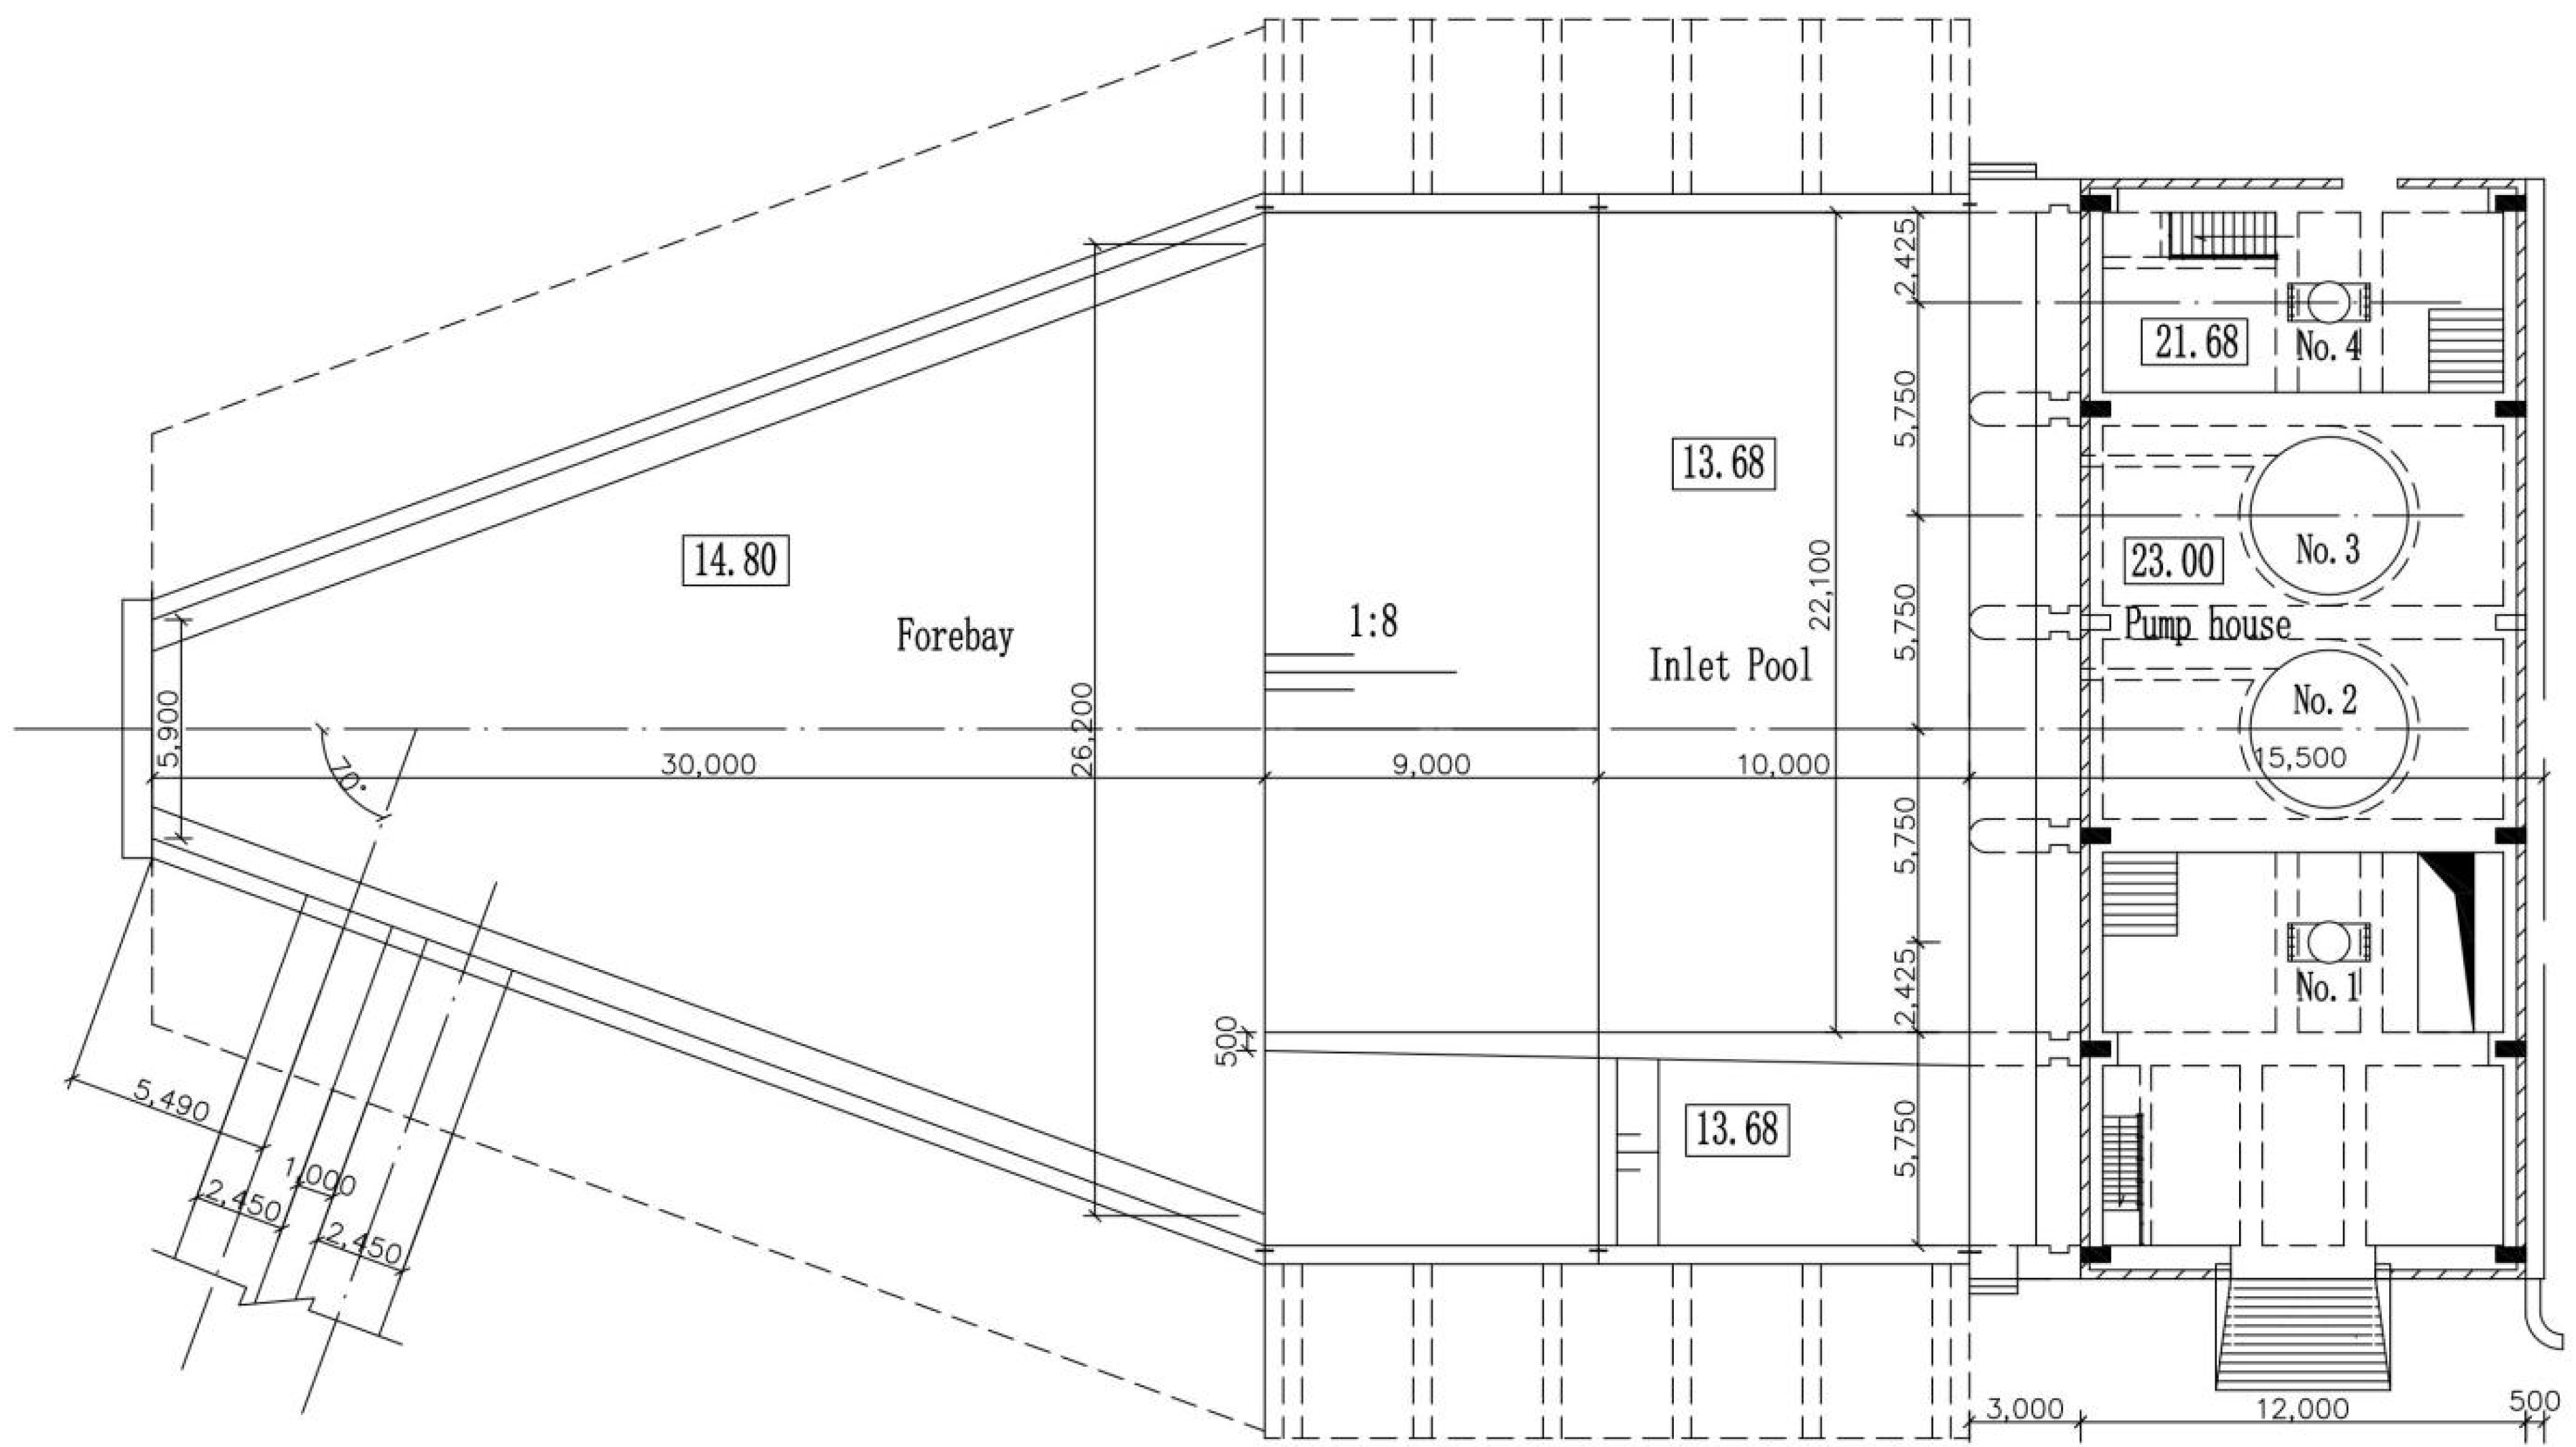
There are four pumps in the certain lateral inlet pumping station in Shandong province, China, among which, the rated flow of the No.1 or No.4 pump is 2.6 m3/s and the rated flow of the No.2 or No.3 pump is 5.4 m3/s. The inlet cross-section of every pump is 3.2 m high and 4.85 m wide. The water depth of the forebay before the slope is 4 m, the water depth of the forebay behind the slope is 5.4 m, and the bottom slope has a gradient of 1:8, as shown in Figure 2.
Two main pump operation schemes are the combination of No.1 pump, No.2 pump, and No.4 pump and the combination of No.1 pump, No.3 pump, and No.4 pump. The rectification measures with diversion piers of the forebay under the combination of pumps 1, 2, and 4 will be mainly studied. The effectiveness of the rectification measures of pumps 1, 3, and 4 will be tested.
2.2. Study Method
FLUENT is used to numerically simulate the flow pattern of the forebay. The flow governing equations are the continuity equation and the Navier-Stokes equation. LES (Large eddy simulation) and RANS (Reynolds averaged Navier-Stokes) are two simulation methods of turbulence. LES can capture large-scale effects and coherent structures in unsteady and nonequilibrium processes and RANS will be incapable of action, but the computation load will be bigger, and consumption time will be longer for LES. The simulation accuracy by RANS can meet the requirement. The realizable k-ε turbulence model for RANS was suitable for the simulation of the flow in the forebay with side-intake of the pumping station [3]. The Reynolds number in the forebay is 2.86 × 10⁵ greater than 3 × 10⁴, which shows that the turbulence is fully developed. The SIMPLEC algorithm is adopted [27].
2.2.1. Boundary Conditions
The side inlet cross-section is used as the inlet of the calculation domain, and the pressure inlet boundary condition was adopted. The pressure on the top of the inlet section is 8 kPa. The pressure at the bottom of the inlet section is 40 kPa. The pressure between the top surface and the bottom surface is linear with the height of the inlet section. For the free surface of the forebay, the shear stress generated by the air on the water surface and heat exchange can be ignored, and the treatment of the symmetrical boundary with the surface of the forebay was adopted according to the rigid-lid assumption. The outlet of the discharge pipe of every pump was used as the outlet boundary. The Mass Flow Outlet boundary condition was then adopted. The mass flow of the No.1 pump was 2600 kg/s, the mass flow of the No.2 pump was 5400 kg/s, and the mass flow of the No.4 pump was 2600 kg/s. All the solid parts were set to the wall according to the wall function method.
2.2.2. Grid Independence Verification
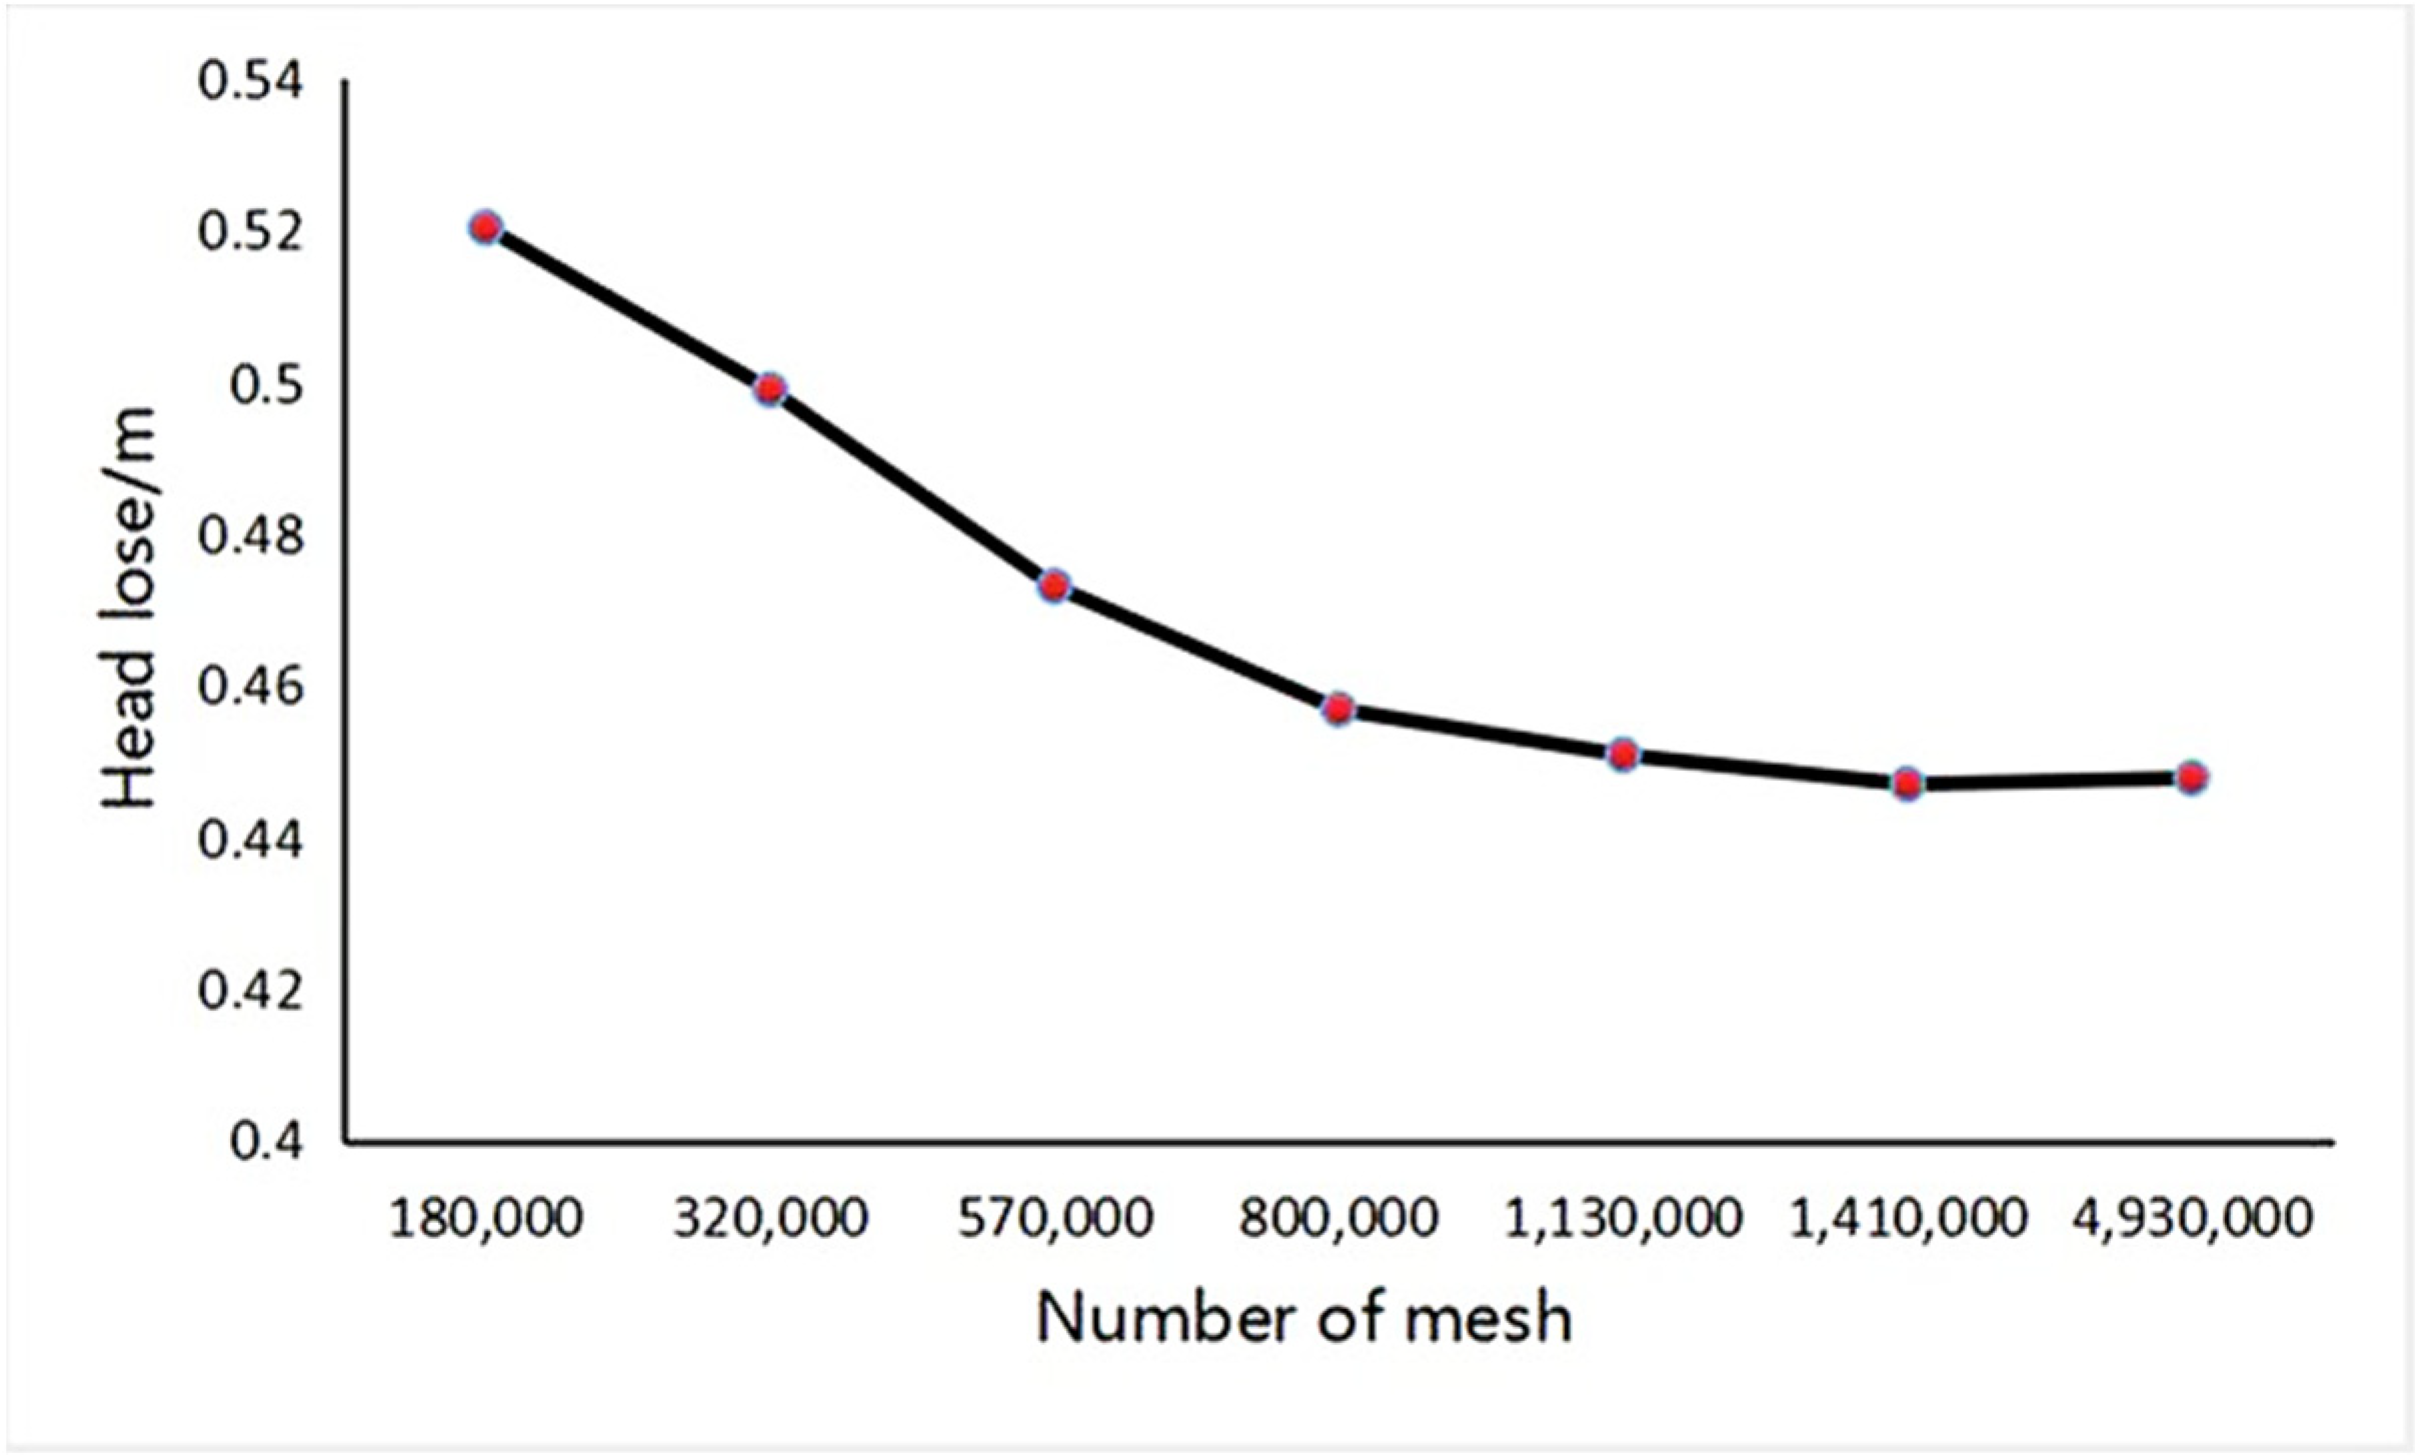
The computing domain is meshed by Fluent Meshing, including a tetrahedral grid in complex parts and hexahedral mesh for non-complex parts. In order to improve the calculation speed and accuracy of the computational domain, grid independence verification should be done. The number of mesh is selected from 180,000, 320,000, 570,000, 800,000, 1.41 million, 3.33 million, and 4.93 million. Head loss, hf, was used as an evaluation indicator for grid independence verification.
where Pin is the total pressure of the inlet; Pout is the total pressure of the outlet; ρ is the density of water; and g is the gravity acceleration.
According to Figure 3, after the number of mesh exceeds 800,000, the head loss of the calculation domain changes little and its head loss does not exceed 2%. Therefore, the number of mesh was chosen as 800,000.
3. Typical Sections in Calculation Domain and Evaluation Indexes of Flow Pattern in Forebay
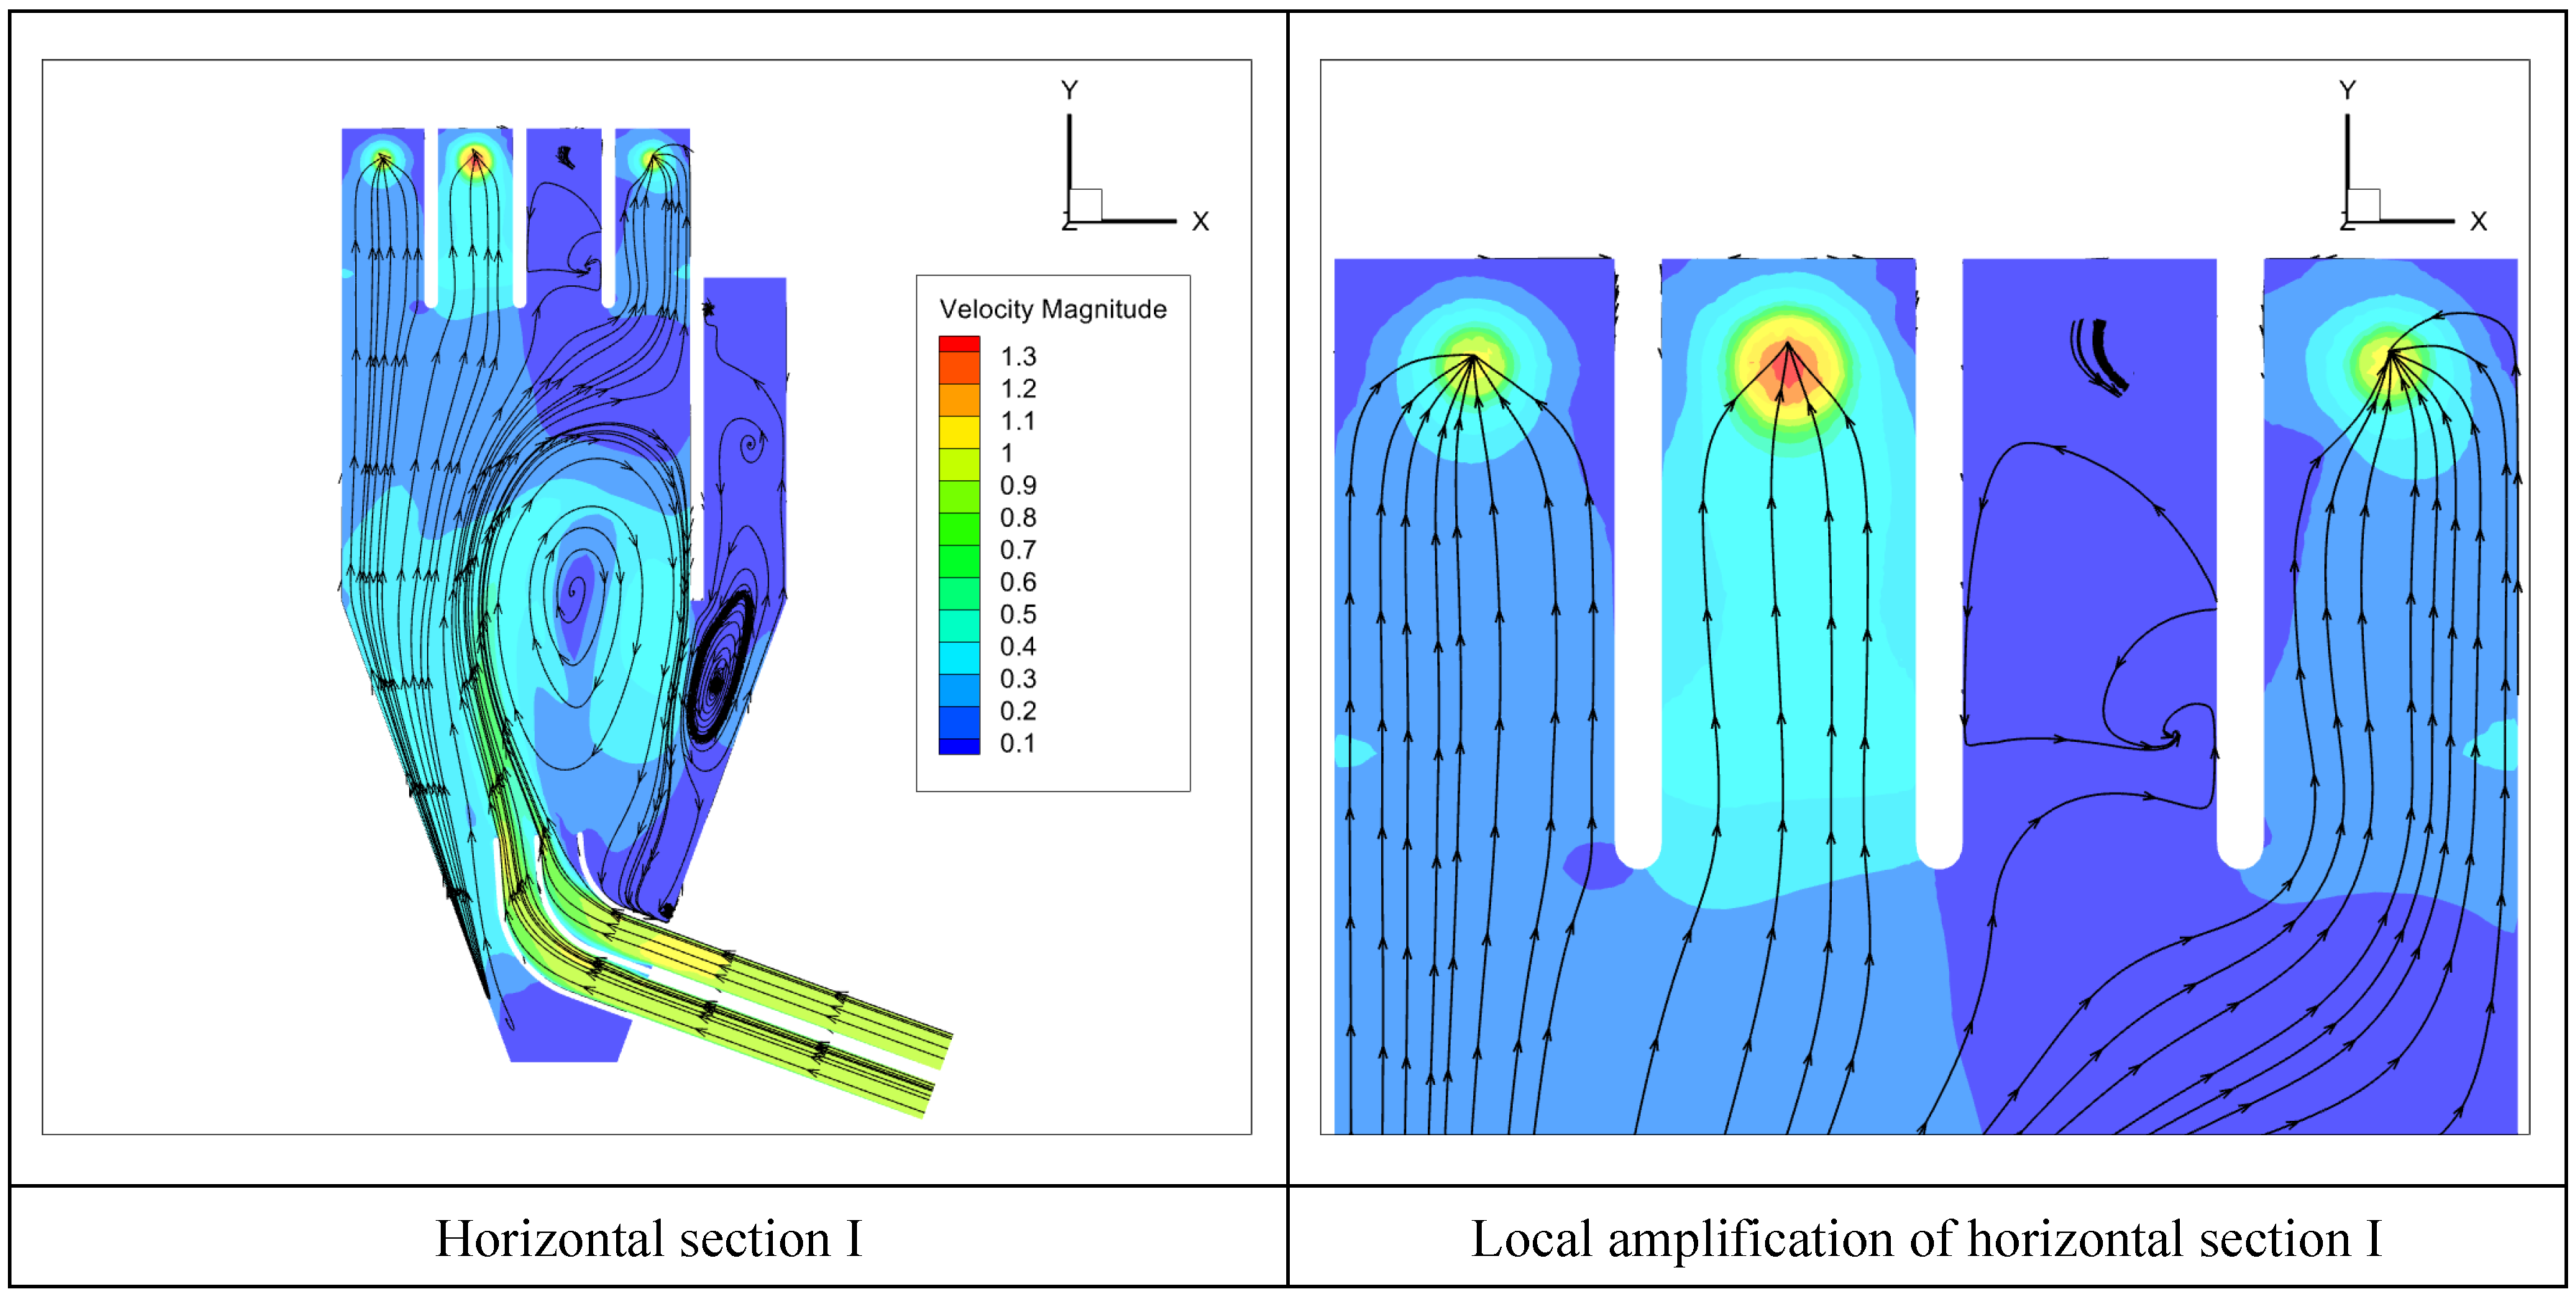
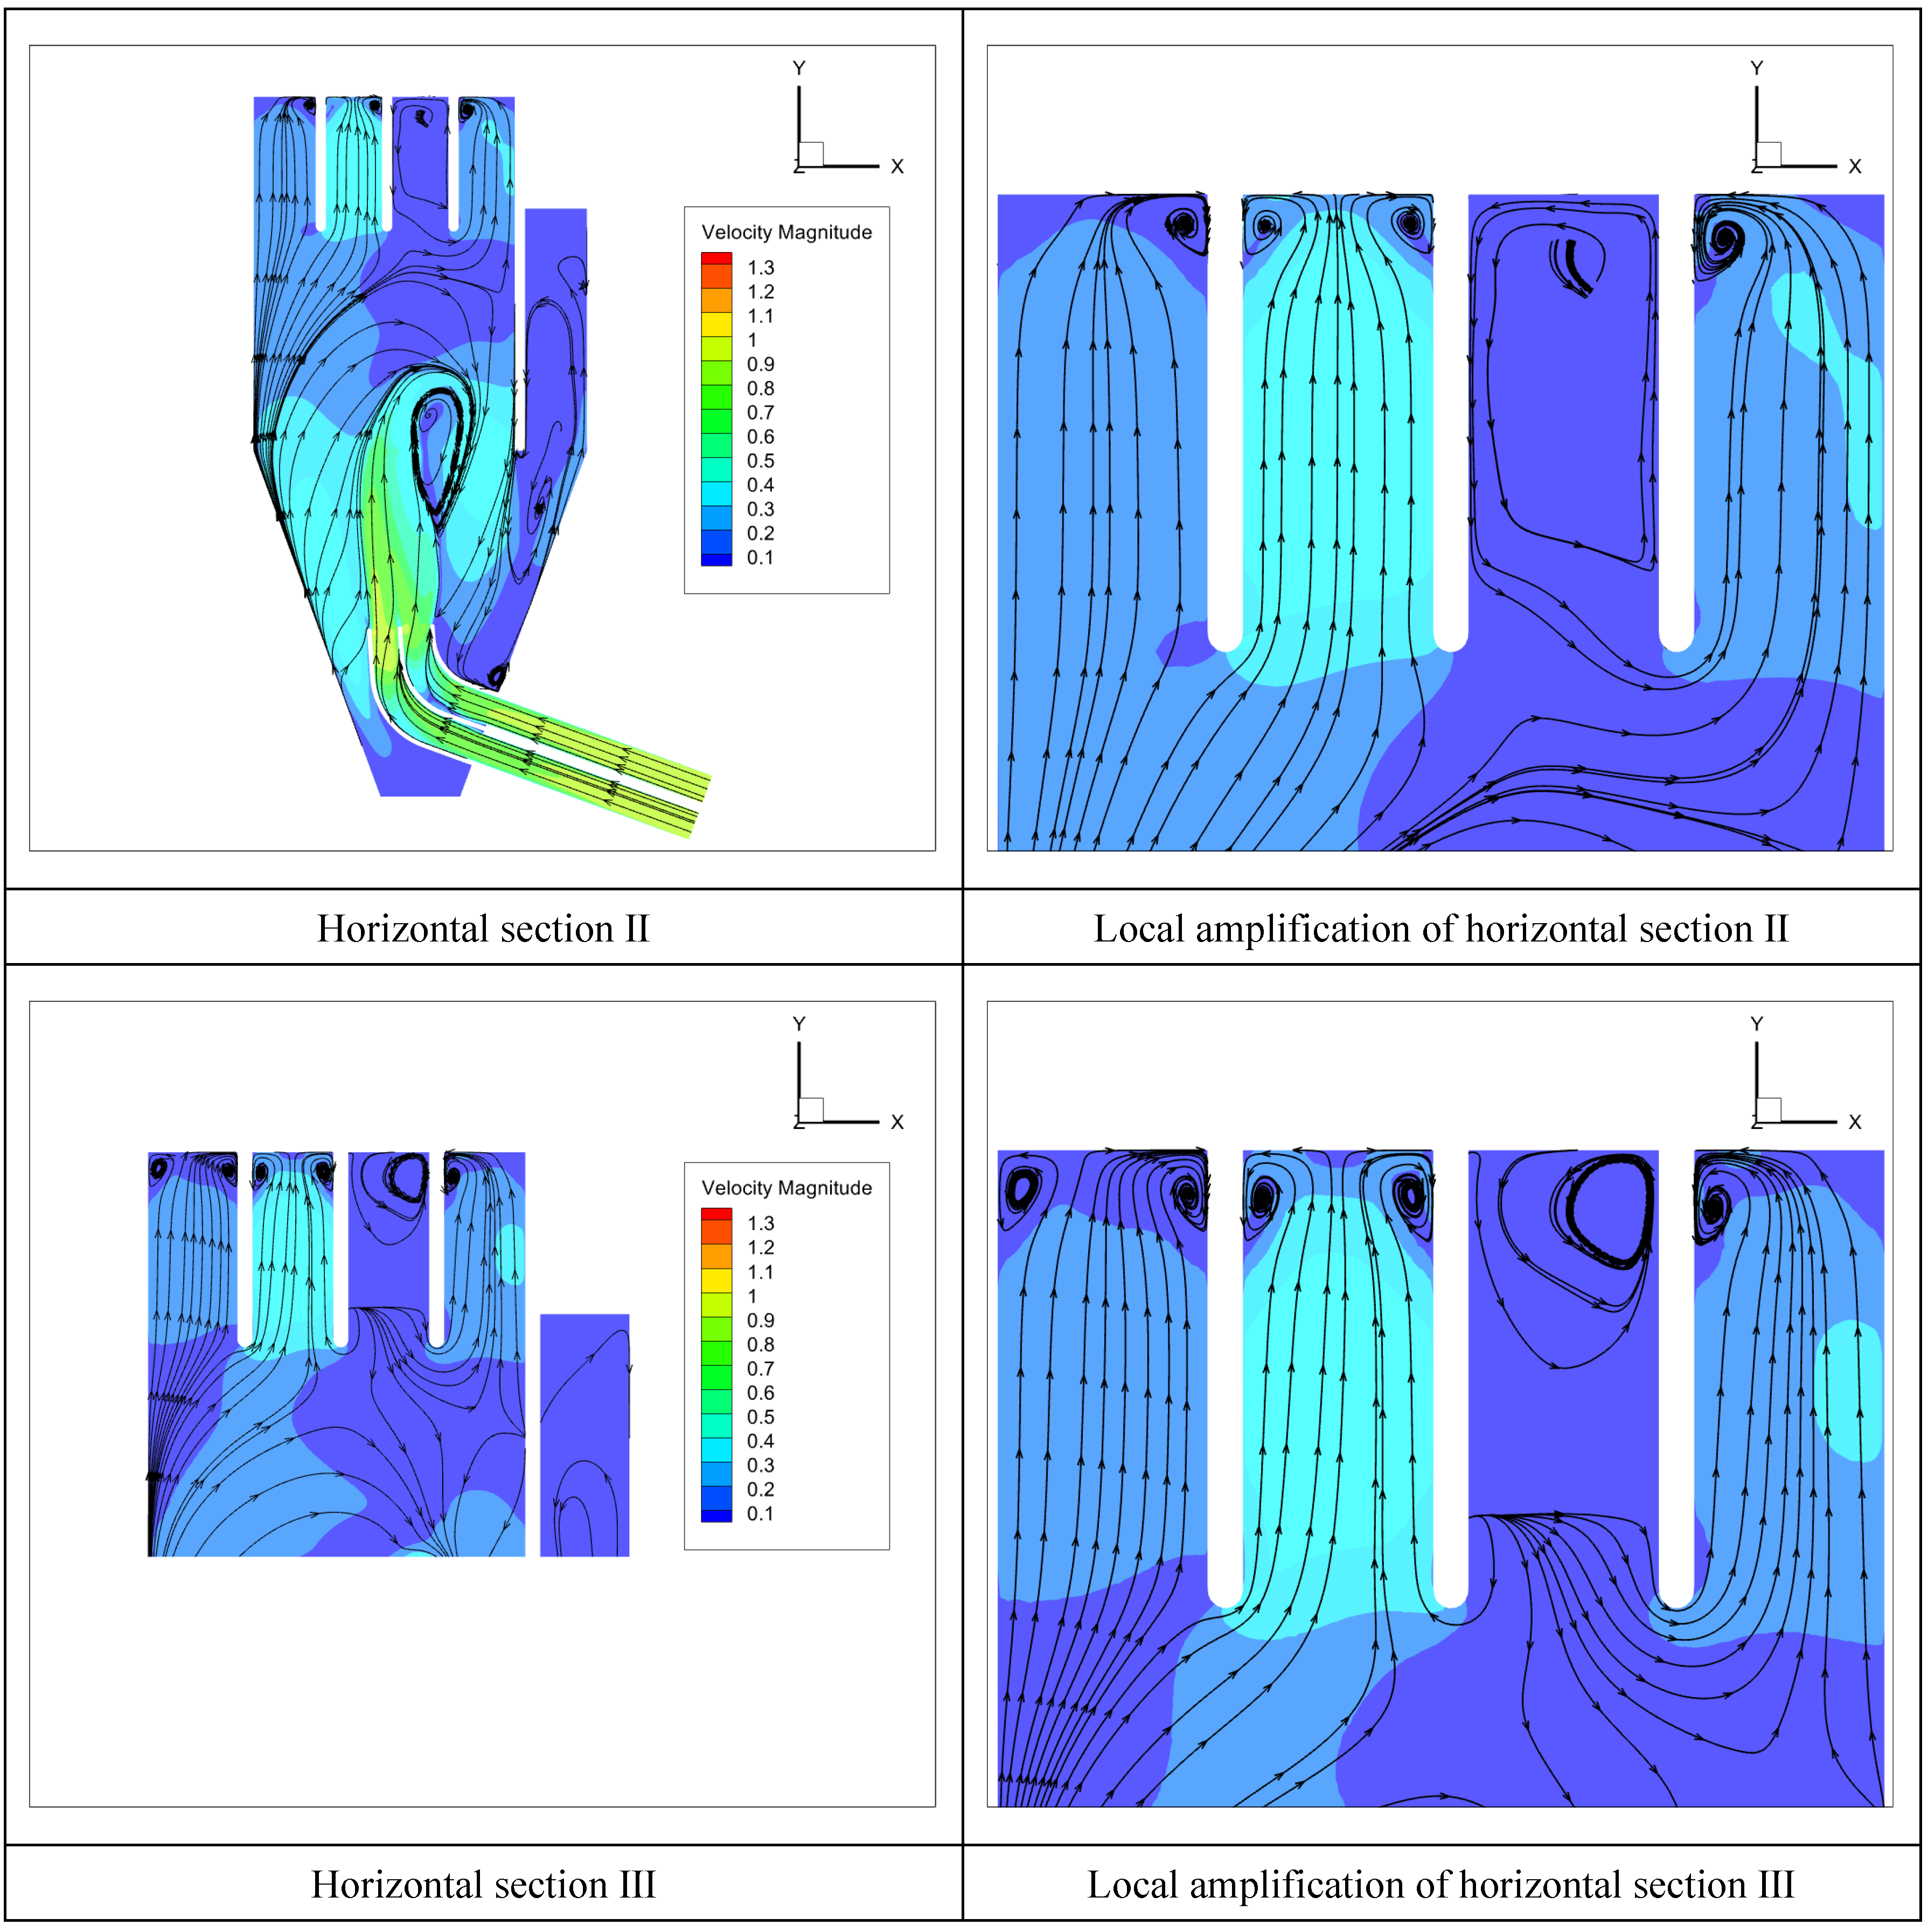
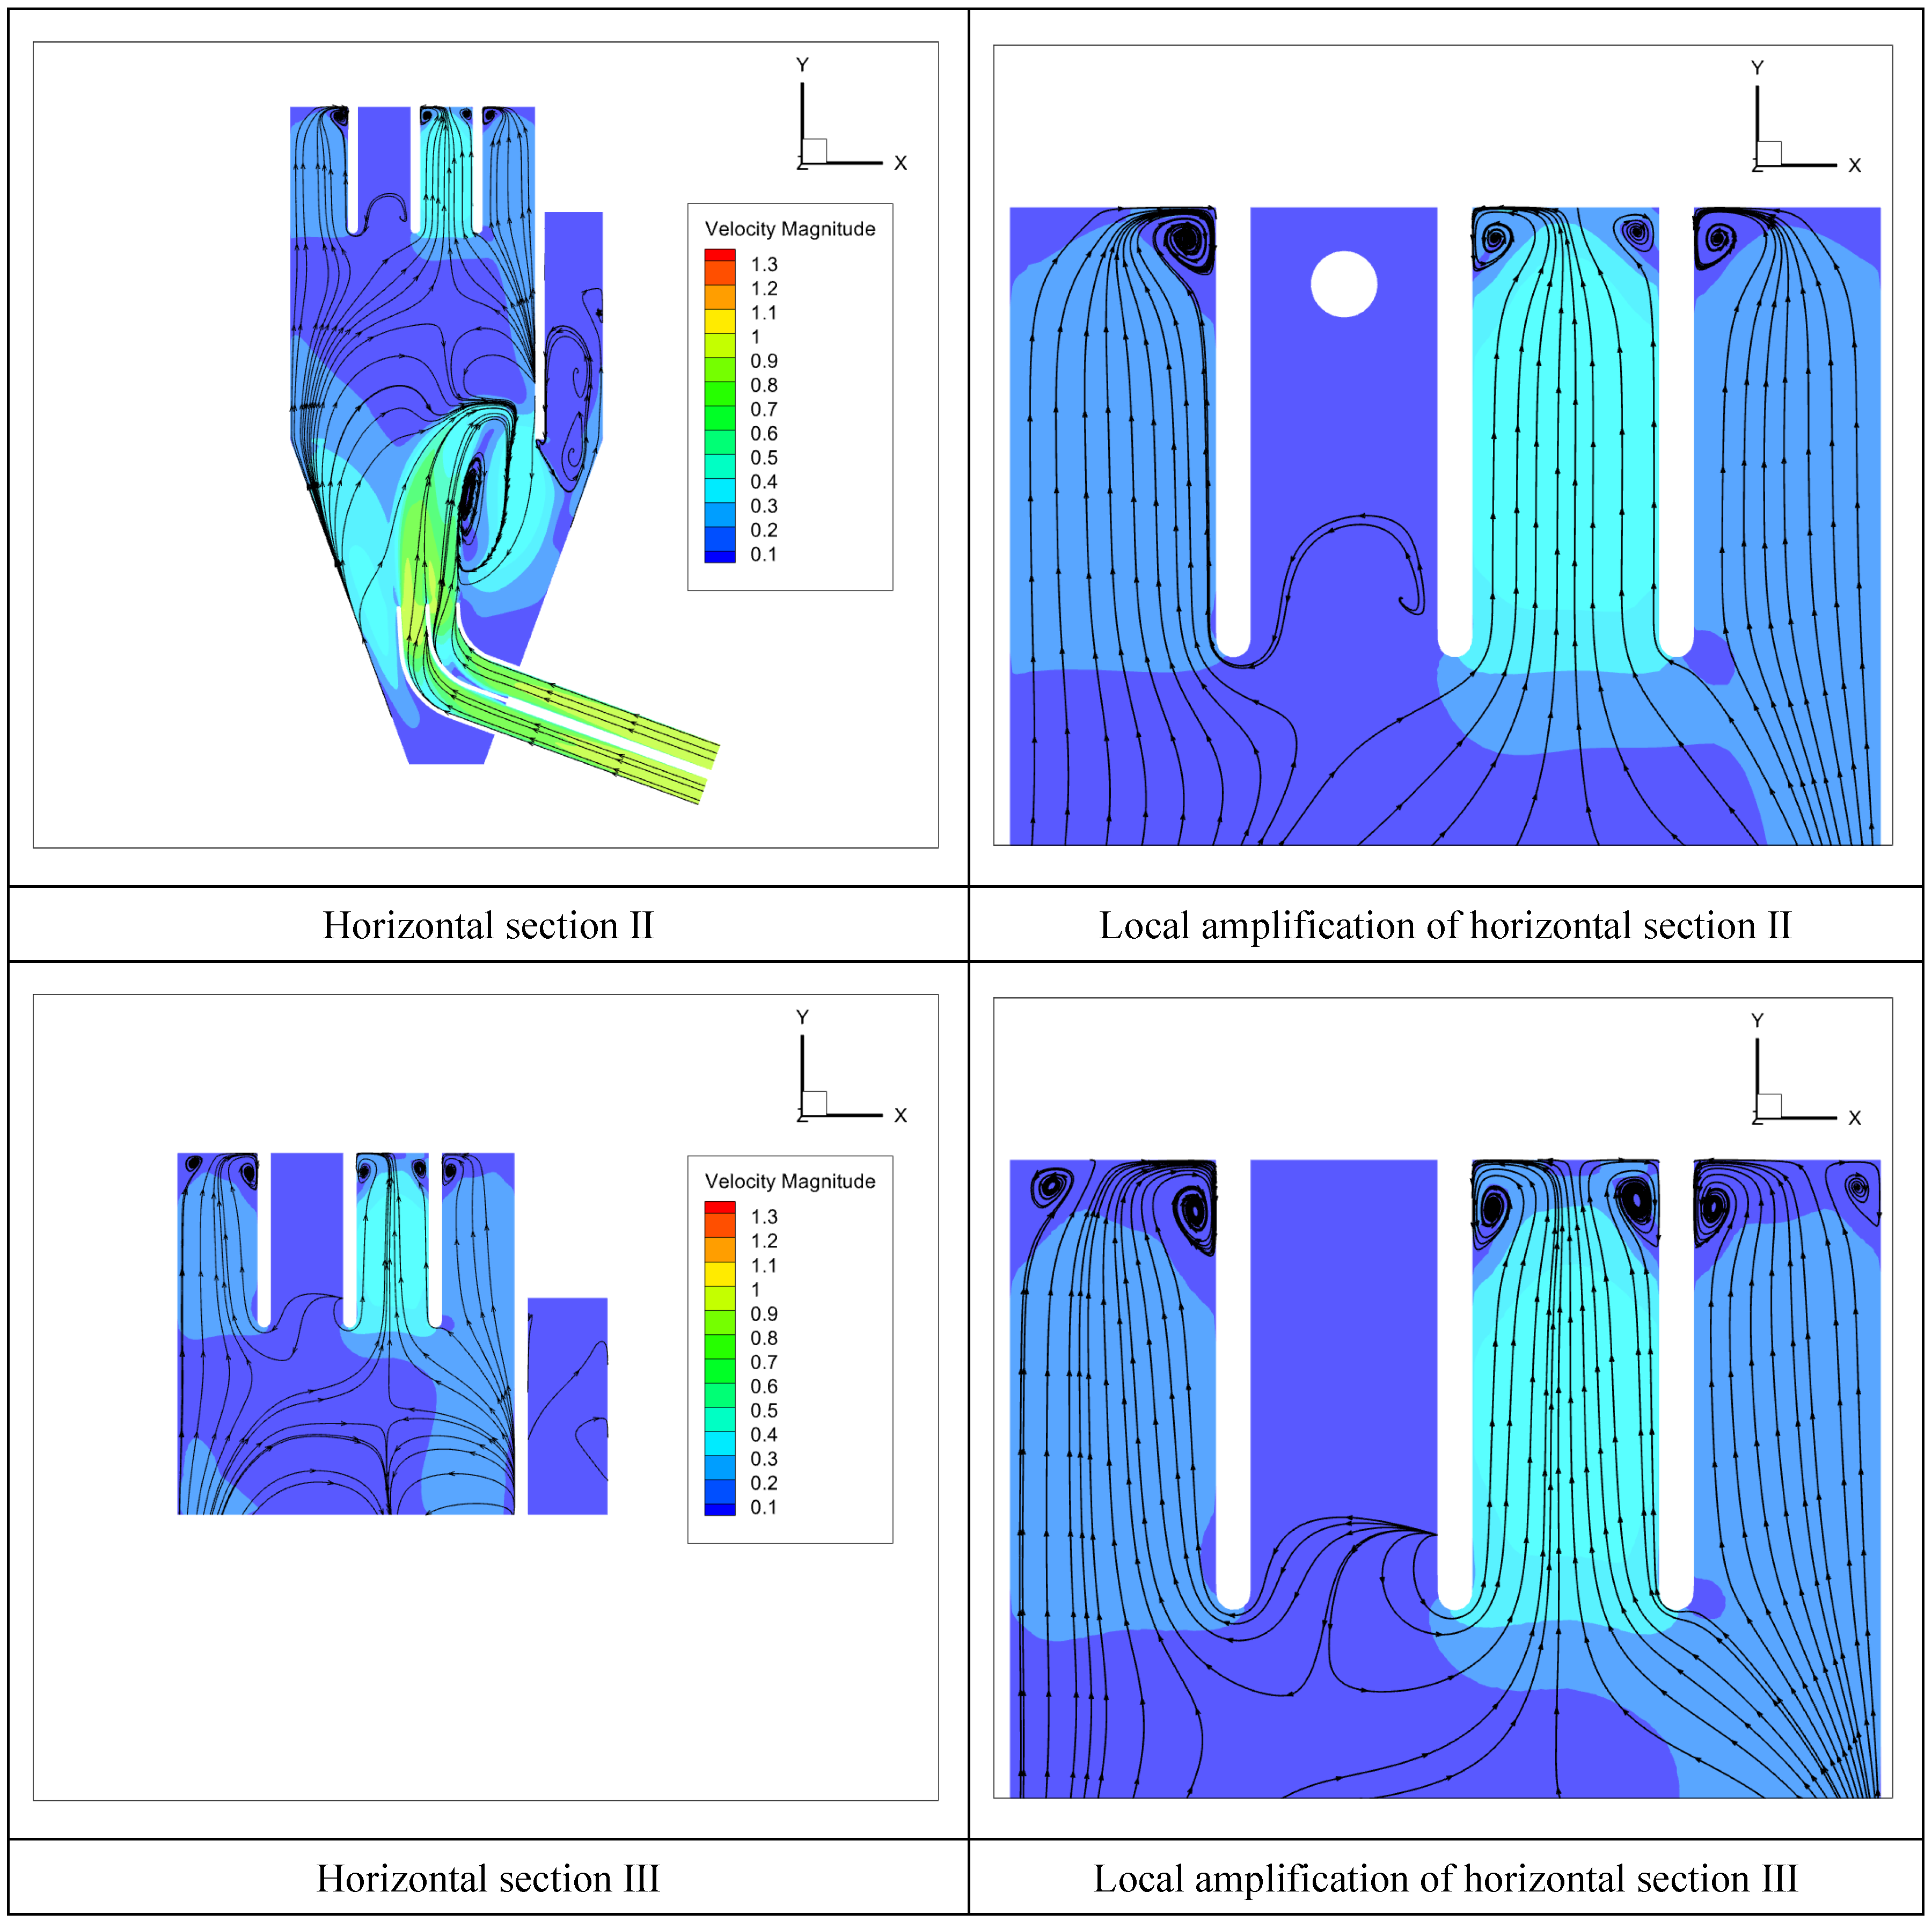
As shown in Figure 4, three horizontal sections are taken in the upper, middle, and lower layers of the calculation domain as typical sections, which are called horizontal section I (Z = 1.4 m), horizontal section II (Z = 0.1 m), and horizontal section III (Z = −1 m). The elevation of the bottom of the forebay, as indicated in Figure 1, is Z = 0.
The leftmost section of the forebay at length direction is Y = 0. Cross-section I (Y = 49 m) is selected at the inlet passage of every pump to calculate the uniformity of axial flow velocity and weighted average angle of flow velocity. The uniformity of axial flow velocity (UAFV) and weighted average angle of flow velocity (WAAFV) on the cross-section I can quantitatively indicate the inlet condition of pumps.
The uniformity of axial flow velocity, , is shown in Equation (2).
In the formula, is the axial velocity of each mesh, m/s; is the average axial velocity of the section, m/s; and n is the number of mesh.
The weighted average angle of flow velocity, θ, is shown in Equation (3); θ = 90° indicates that the inlet condition of the pump is very good.
In the formula, is the transverse velocity of each mesh, m/s.
4. Design of Diversion Piers Based on Orthogonal Test Method
4.1. Dimension Design of Diversion Piers
As shown in Figure 5, there are three diversion piers: 1 (outer), 2 (middle), and 3 (inner) in consideration of the lateral intake forebay. The diversion piers are designed by arc section and the straight-line segment at the head and tail. Diversion piers 2 and 3 are designed with a straight segment at the head L1 = 4.5 m with the arc segment l1 = 6.7 m in diversion pier 1 as the reference length. The length of the straight-line segment at the head and the length of the arc segment of diversion piers 2 and 3 were determined by relative length which is the ratio between the lengths of the two straight-line segments or two arc segments, L1/L2 = l1/l2. C is the length of the straight-line segment at the tail of diversion pier 3, and the length of the straight-line segment at the tail of diversion piers 1 and 2 may be determined to keep the ends of three diversion piers in the same cross-section of the forebay. Relative height is h = H1/H2, where H1 is the height of the diversion pier and H2 is the water depth of the forebay. B is the width of the diversion pier which is smaller than 0.9 m.
4.2. Factors and Results Based on Orthogonal Test Method
The relative length, the width of the diversion pier, the length of the straight-line segment at the tail of the diversion pier, and the relative height are the design parameters for the design of the diversion pier. The uniformity of axial flow velocity and the co-angle of the weighted average angle of flow velocity (CWAAFV) were taken as the evaluation indexes for the orthogonal test results, and the orthogonal test table was selected according to the specified factors and the appropriate amount of the level. The level of each factor and the orthogonal test results are shown in Table 1 and Table 2. A, B, C, and D represent the relative length, the width of the diversion pier, the length of the straight-line segment at the tail of the diversion pier, and the relative height, respectively.
4.3. Analysis of Orthogonal Test Table of the Diversion Piers
Ki (i = 1,2,3) of factor I (I = A,B,C,D) for UAFV or CWAAFV in Table 3 is the sum of three UAFV or CWAAFV values for level i and factor I in Table 2, and then ki = Ki/3,. The R value can reflect the strength of the factor on the result, that is, the larger the R value, the greater the influence of the factor on the result. It can be seen from Table 3 that the influence of UAFV is: A > B > C > D, and the order of the design factors of the diversion piers is: the relative length, the width of the diversion pier, the length of the straight-line segment at the tail and the relative height of the diversion pier. It can also be seen from Table 3 that the influence of CWAAFV is: D > C > A > B, and the order of the design factors of the diversion piers is the relative height of the diversion pier, the length of the straight-line segment at the tail, the relative length, and the width of the diversion pier.
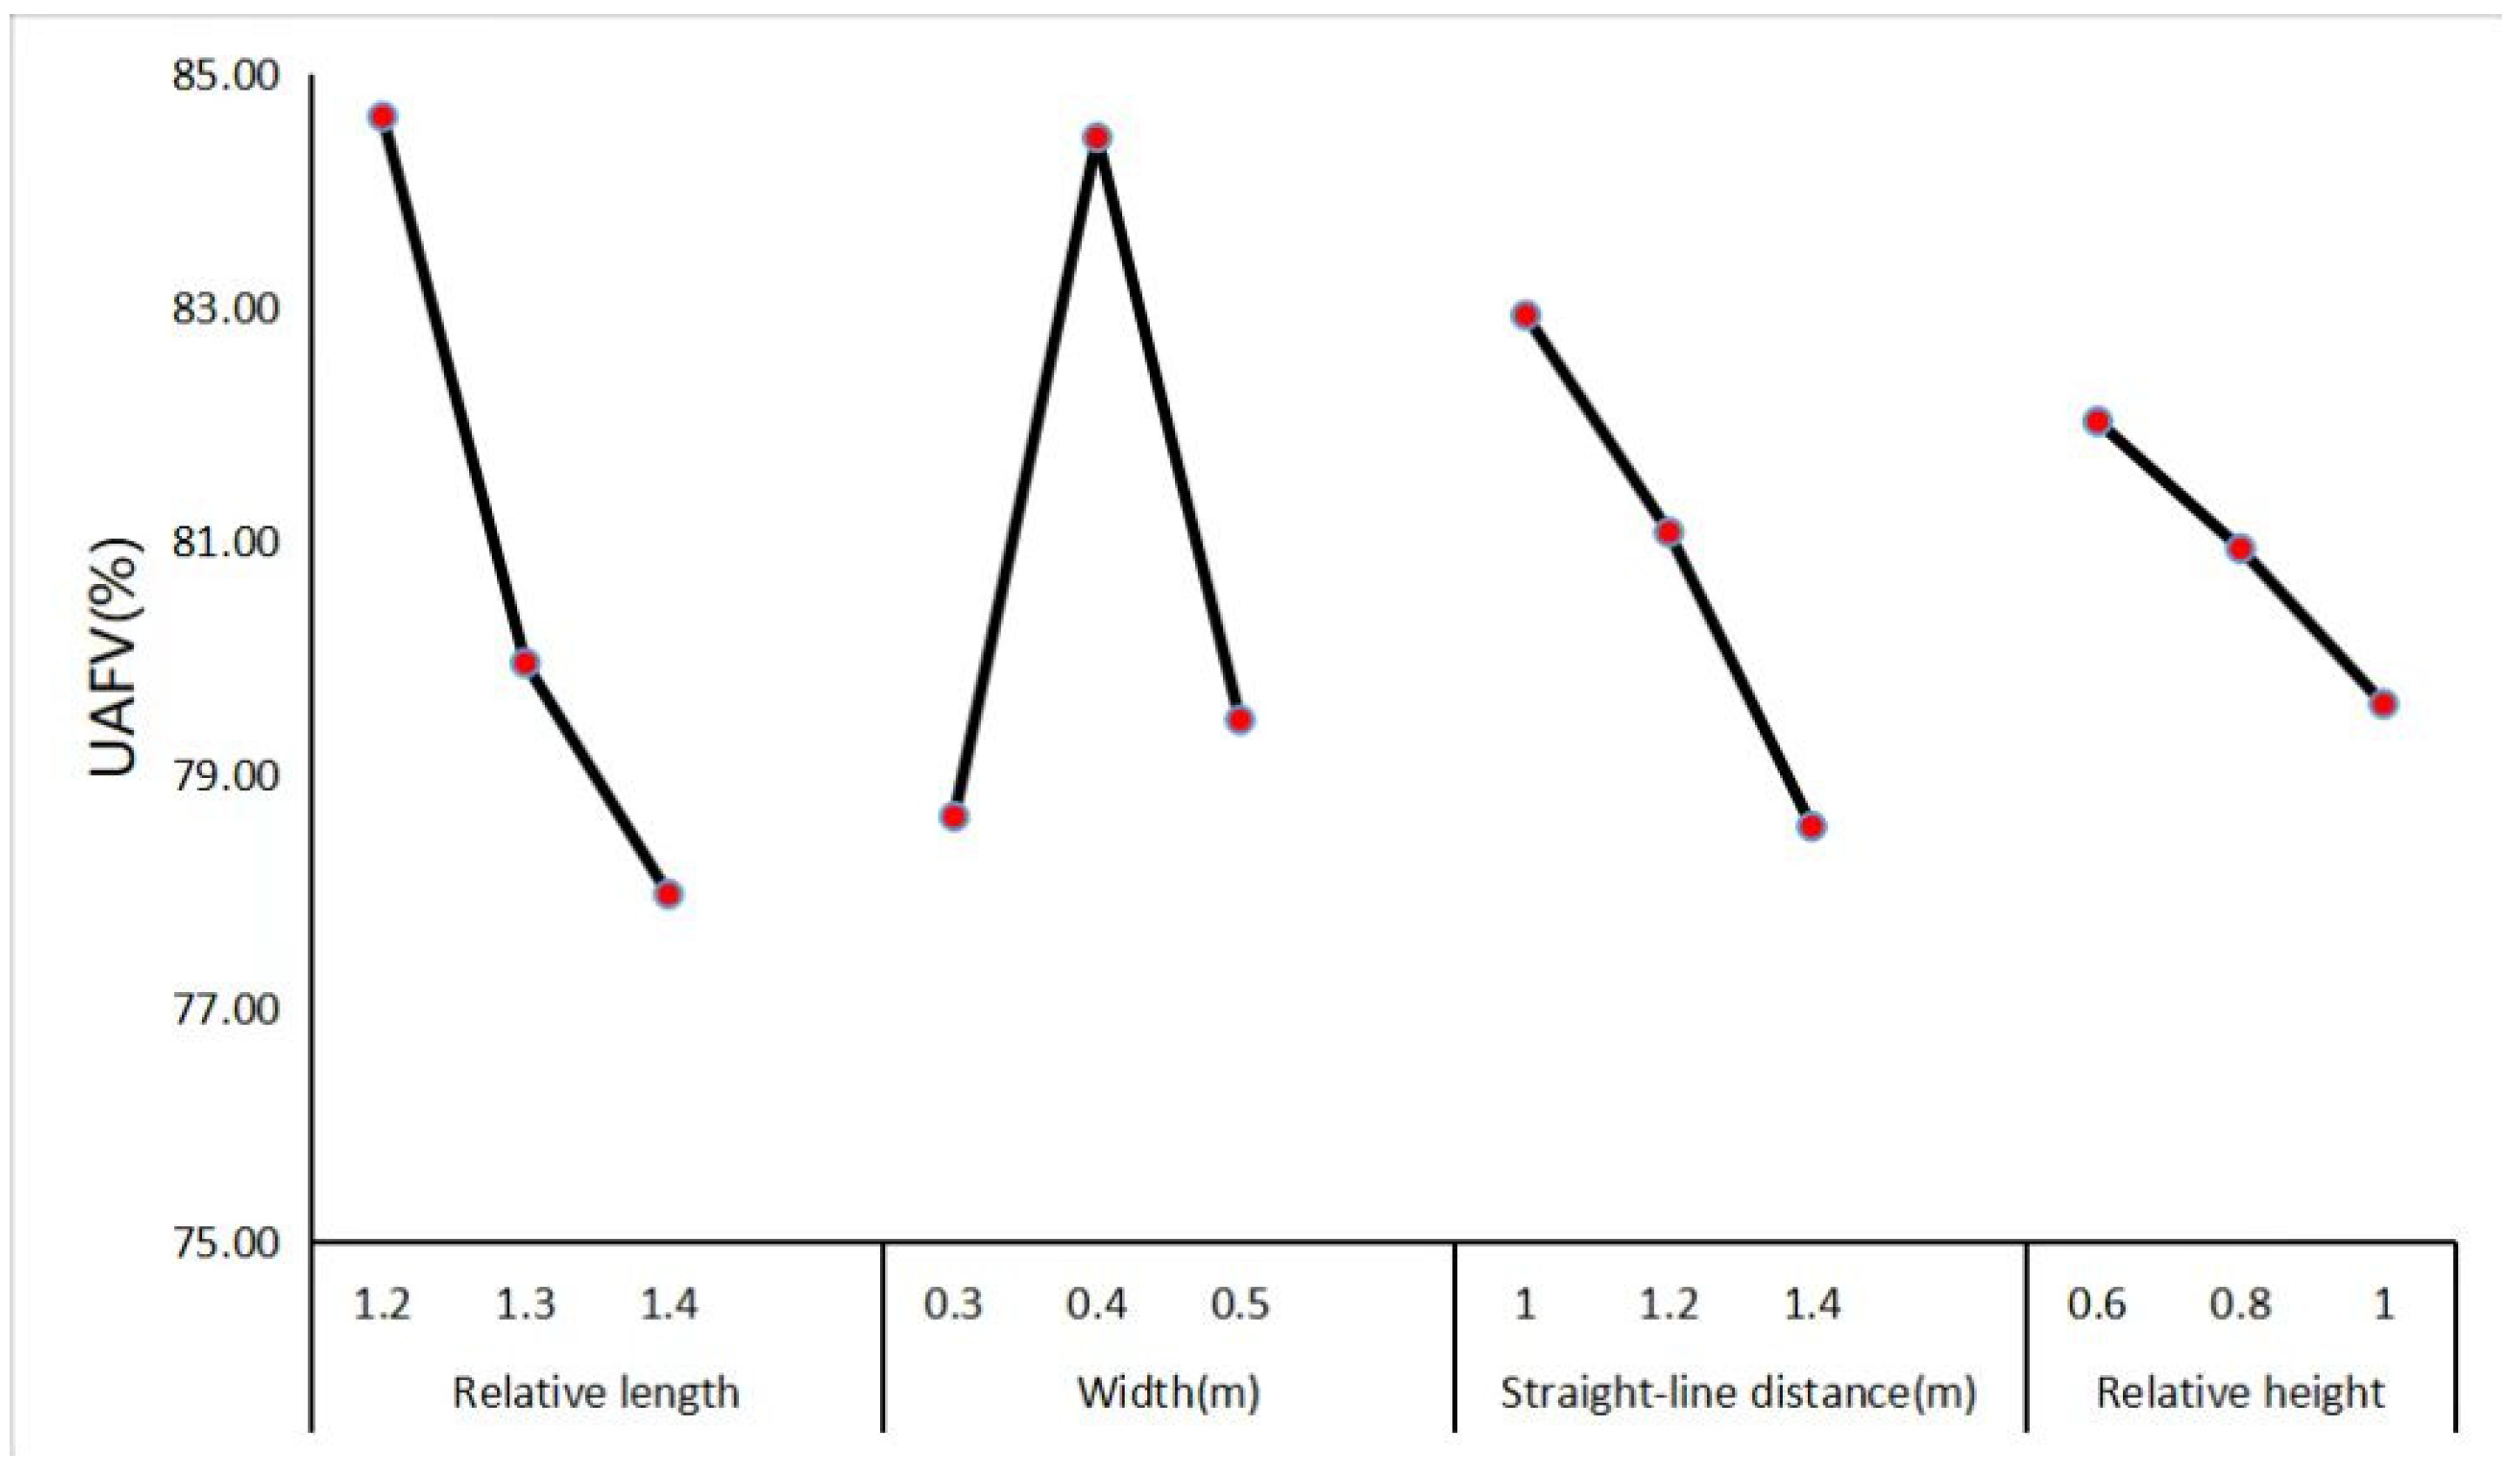
The trend diagram of UAFV is shown in Figure 6. It can be seen from Figure 5 that the relative length of the diversion pier and the length of the straight-line segment at the tail and the relative height of the diversion pier increases, and the UAFV value decreases, but when the width of the diversion pier (0.3 m, 0.4 m, or 0.5 m) is 0.4 m, the UAFV is maximized. So, the test scheme when UAFV is optimal is: A1B2C1D1.
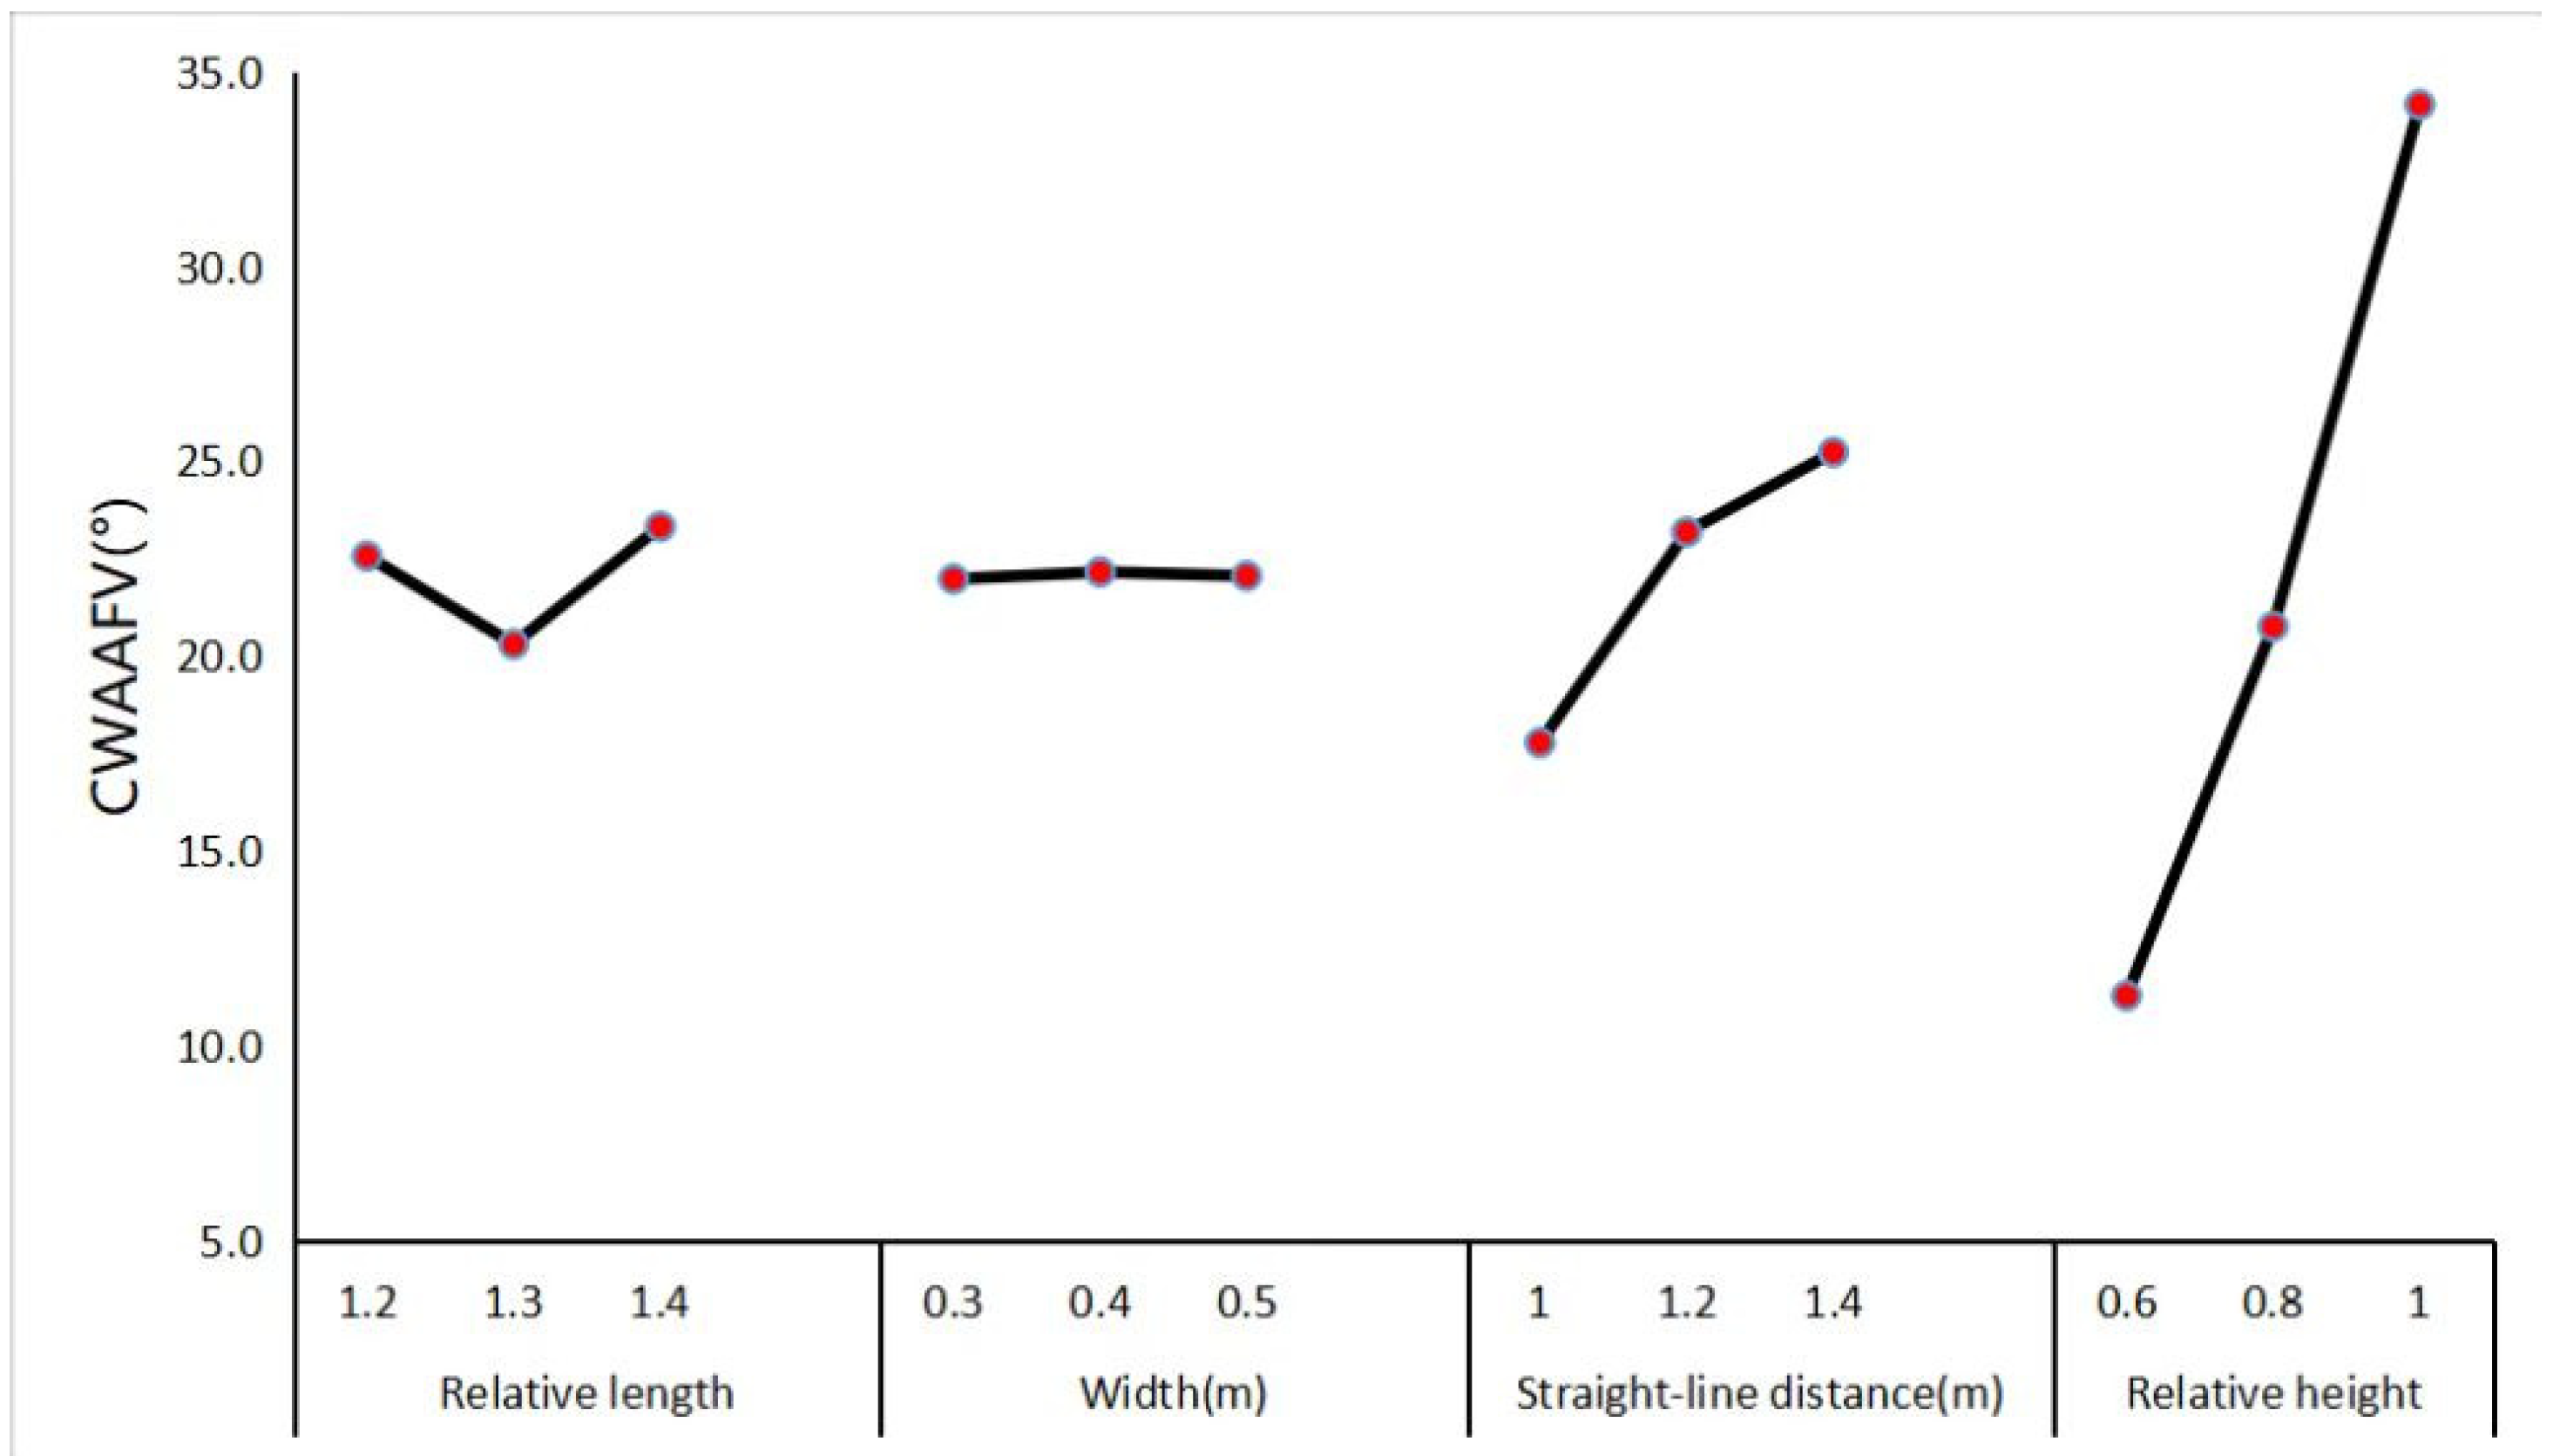
The trend diagram of CWAAFV is shown in Figure 7. When the relative length reaches 1.3 or the width of the diversion pier is 0.3 m or the length of the straight-line segment at the tail is 1.0 m or the relative height of the diversion pier is 0.6 m, CWAAFV values are minimized. So, the optimal scheme for CWAAFV is: A2B1C1D1.
4.4. Analysis of Optimal Result
For UAFV, the selection scheme is A1B2C1D1, and for CWAAFV, the selection scheme is A2B1C1D1. The comprehensive balance method is adopted, that is, according to the influence degree of each factor on the evaluation index, the advantages and disadvantages of each factor level for the evaluation index are calculated, and the most favorable scheme is selected. The optimal scheme, A1B2C1D1, of diversion pier design is obtained by calculating with the comprehensive balance method. Based on the numerical simulation, the flow pattern for the optimal scheme is shown in Figure 8. For the No.1 pump, the UAFV was 80.26% and the WAAFV was 77.68°. For the No.2 pump, the UAFV was 98.74% and the WAAFV was 87.84°. For the No.4 pump, the UAFV was 93.41% and the WAAFV was 77.28°.
Figure 9 is a vector diagram of the flow velocity in the domain. With the increase in the trip, the water flow velocity gradually decreases, the backflow at the outlet of the diversion piers gradually disappears, the flow velocity distribution is gradually uniform, and the direction of the flow velocity at the cross-section I is basically parallel to the axial direction, showing that the diversion pier has a good rectification effect.
5. CFD Numerical Test Analysis of Pumps 1, 3, and 4
In order to test the rectification effect of the optimal scheme designed in the orthogonal test of the diversion piers under the pump operation scheme of pumps 1, 3, and 4, the flow pattern in the forebay of the pumping station is calculated by the same CFD method, and the streamline diagram of each typical section is shown in Figure 10.
By the calculation, the UAFV of the No.1, No.3, and No.4 pumps were 92.65%, 94.54%, and 75.81%, respectively. The WAAFV of pumps 1, 3, and 4 were 72.66°, 85.14°, and 78.21°, respectively. Therefore, it can be proved that the optimal scheme of the diversion piers designed by the orthogonal test method is more suitable for different pump startup modes under lateral water intake.
6. Conclusions
The CFD numerical simulation approach was used to study the flow pattern in the forebay and to improve the design parameters of the diversion pier of a pumping station. The forebay of a lateral intake pumping station with asymmetrical working pumps was subjected to flow analysis using a realizable k-ε Turbulent model, the SIMPLEC method, Pressure Inlet boundary condition, where the pressure between the top surface and the bottom surface is linear with the height of the inlet section, and Mass Flow Outlet boundary condition. Based on the flow parameters, the diversion pier was chosen as the optimization strategy. Nine groups of the numerical simulation on various layouts of diversion piers were examined using the orthogonal test method, with the uniform axial flow velocity and weighted average angle of the flow velocity of each pump’s inlet cross-section. This provided a reference for related pumping station engineering. The following conclusions were drawn:
(1) The parameters of diversion piers of the orthogonal test design having four factors and three levels are different, and the uniformity of axial flow velocity and the weighted average angle of the flow velocity of the inlet passages for the pumps are also different. With a comprehensive balance method, the optimal combination of diversion pier parameters can be selected as A1B2C1D1. The uniformity of axial flow velocity and the weighted average angle of flow velocity after selecting the optimal combination are greatly improved.
(2) After selecting the optimal scheme through the orthogonal test design of the diversion piers, the results showed that a small range of reflux phenomena appears in the outlet position of the diversion piers. However, with the increase in the water flow approach, the backflow area gradually disappears, and the water flow is relatively straight. Because the flow of the No.2 pump unit is greater than that of the No.1 pump unit and No.4 pump unit, the velocity distribution of the cross-section of the forebay shows a trend of middle-high and low on both sides.
(3) Under the pump operation scheme of pumps 1, 3, and 4, the rectification effect of the optimal scheme designed in the orthogonal test of the diversion piers under the pump operation scheme of pumps 1, 2, and 4 has been well tested. It can be proved that the size of the diversion pier designed by the orthogonal test method has a high application value in the study of the lateral intake pumping station.
RANS with a realizable k-ε turbulent model was used in this study. The LES turbulent model will be a good approach for higher accuracy and fine analysis of the vortex field. The diversion piers in the paper combined with the sill is likely obtain a better rectification effect, according to the relevant references. Sediment deposition in the front of the sill, however, needs to be taken into consideration; it also necessitates further investigation.
Author Contributions
Conceptualization, C.Z. and H.Y.; methodology, C.Z.; software, C.Z.; validation, H.Y., Y.Y., and M.T.J.; formal analysis, C.Z.; investigation, C.Z.; resources, Y.Y.; data curation, H.Y.; writing—original draft preparation, M.T.J.; writing—review and editing, Y.Y.; visualization, C.Z.; supervision, Y.Y.; project administration, Y.Y.; funding acquisition, Y.Y. All authors have read and agreed to the published version of the manuscript.
Funding
The research was supported by the National Key Research and Development Program (2019YFC0409000).
Institutional Review Board Statement
Not applicable.
Informed Consent Statement
Not applicable.
Conflicts of Interest
The authors declare no conflict of interest.
References
- Nasr, A.; Yang, F.; Zhang, Y.; Wang, T.; Hassan, M. Analysis of the Flow Pattern and Flow Rectification Measures of the Side-Intake Forebay in a Multi-Unit Pumping Station. Water 2021, 13, 2025. [Google Scholar] [CrossRef]
- Liu, C.; Han, X.; Zhou, J.; Jin, Y.; Cheng, L. Numerical simulation of turbulent flow in forebay with side-intake of pumping station. J. Drain. Irrig. Mach. Eng. 2009, 27, 281–286. [Google Scholar]
- Cheng, B.; Yu, Y. CFD Simulation and Optimization for Lateral Diversion and Intake Pumping Stations. Procedia Eng. 2012, 28, 122–127. [Google Scholar] [CrossRef]
- Ansar, M.; Nakato, T.; Constantinescu, G. Numerical simulations of inviscid three-dimensional flows at single- and dual-pump intakes. J. Hydraul. Res. 2002, 40, 461–470. [Google Scholar] [CrossRef]
- Rajendran, V.P.; Constantinescu, S.G.; Patel, V.C. Experimental Validation of Numerical Model of Flow in Pump-Intake Bays. J. Hydraul. Eng. 1999, 125, 1119–1125. [Google Scholar] [CrossRef]
- Rajendran, V.P.; Patel, V.C. Measurement of Vortices in Model Pump-Intake Bay by PIV. J. Hydraul. Eng. 2000, 126, 322–334. [Google Scholar] [CrossRef]
- Teaima, I.R.; El-Gamal, T. Improving Flow Performance of Irrigation Pump Station Intake. J. Appl. Water Eng. Res. 2017, 5, 9–21. [Google Scholar] [CrossRef]
- Zhan, J.-M.; Wang, B.-C.; Yu, L.-H.; Li, Y.-S.; Tang, L. Numerical Investigation of Flow Patterns in Different Pump Intake Systems. J. Hydrodynam. B 2012, 24, 873–882. [Google Scholar] [CrossRef]
- Kadam, P.; Chavan, D. CFD analysis of flow in pump sump to check suitability for better performance of pump. Int. J. Mech. Eng. Robot. 2013, 1, 56–65. [Google Scholar]
- Liu, C.; Zhou, J.; Cheng, L. The experimental study and numerical simulation of turbulent flow in pumping forebay. ASME Power Conf. 2009, 43505, 171–176. [Google Scholar]
- Liu, C.; Zhou, J.; Cheng, L.; Jin, Y.; Han, X. Study on Improving the Flow in Forebay of the Pumping Station. In Proceedings of the ASME 2010 3rd Joint US-European Fluids Engineering Summer Meeting: Volume 1, Symposia—Parts A, B, and C; ASMEDC, Montreal, QC, Canada, 1–5 August 2010. [Google Scholar]
- Feng, X. Flow analysis of bottom sill rectification and back sill of pump station forebay. Jiangsu Water Resour. 1998, 26, 31–33, 38. [Google Scholar]
- Li, J.; Cao, Y.; Gao, C. Numerical Simulation of Flow Patterns in the Forebay and Suction Sump of Tianshan Pumping Station. Water Pract. Technol. 2014, 9, 519–525. [Google Scholar] [CrossRef]
- Xu, B.; Zhang, C.; Li, Z.; Gao, C.; Bi, C. Study on the influence of geometric parameters of diversion pier on navigable flow conditions of gate station joint hub based on CFD. J. Irrig. Drain. 2019, 38, 115–122. [Google Scholar]
- Xia, C.; Cheng, L.; Jiao, W.; Zhang, D. Numerical simulation on rectification measure of inverted T-shaped sill at forebay of pump station. J. South-to-North Water Transf. Water Sci. Technol. 2018, 16, 146–150. [Google Scholar]
- Luo, C.; Cheng, L.; Liu, C. Numerical simulation of mechanism for sill rectifying flow in pumping station intake. J. Drain. Irrig. Mach. Eng. 2014, 32, 393–398. [Google Scholar]
- Yu, Y.; Xu, H.; Cheng, Y. CFD numerical simulation on modification of flow pattern with flow deflector at fore-bay of pumping station. J. Water Resour. Hydropower Eng. 2006, 37, 41–43. [Google Scholar]
- Luo, C.; Qian, J.; Liu, C.; Chen, F.; Xu, J.; Zhou, J. Numerical simulation and test verification on diversion pier rectifying flow in forebay of pumping station for asymmetric combined sluice-pump station project. Trans. Chin. Soc. Agric. Eng. 2015, 31, 100–108. [Google Scholar]
- Wang, W.; Shi, W.; Jiang, X.; Feng, Q.; Lu, W.; Zhang, D. Optimization design of multistage centrifugal pump impeller by orthogonal experiment and CFD. Appl. Energy 2016, 34, 191–197. [Google Scholar]
- Zhou, J.; Zhao, M.; Wang, C.; Gao, Z. Optimal Design of Diversion Piers of Lateral Intake Pumping Station Based on Orthogonal Test. Shock Vib. 2021, 2021, 1–9. [Google Scholar] [CrossRef]
- Xu, B.; Liu, J.; Lu, W. Optimization Design of Y-Shaped Settling Diversion Wall Based on Orthogonal Test. Machines 2022, 10, 91. [Google Scholar] [CrossRef]
- Zhou, J.; Zhong, Z.; Liang, J.; Shi, X. Three-dimensional Numerical Simulation of Side-intake Forebay of Pumping Station. J. Irrig. Drain. 2015, 34, 52–55. [Google Scholar]
- Yang, F.; Zhang, Y.; Liu, C.; Wang, T.; Jiang, D.; Jin, Y. Numerical and Experimental Investigations of Flow Pattern and Anti-Vortex Measures of Forebay in a Multi-Unit Pumping Station. Water 2021, 13, 935. [Google Scholar] [CrossRef]
- Can, L.; Chao, L. Numerical simulation and improvement of side-intake characteristics of multi-unit pumping station. J. Hydroelectr. Eng. 2015, 34, 207–214. [Google Scholar]
- Caishui, H.O.U. Three-Dimensional Numerical Analysis of Flow Pattern in Pressure Forebay of Hydropower Station. Procedia Eng. 2012, 28, 128–135. [Google Scholar] [CrossRef]
- Lu, Z.; Xiao, R.; Tao, R.; Li, P.; Liu, W. Influence of guide vane profile on the flow energy dissipation in a reversible pump-turbine at pump mode. J. Energy Storage 2022, 49, 104161. [Google Scholar] [CrossRef]
- Wang, F. The Analysis of Computational Fluid Dynamics-CFD Software Theory and Application; Tsinghua University Press: Beijing, China, 2004. [Google Scholar]
Figure 1.
Analysis flowchart.
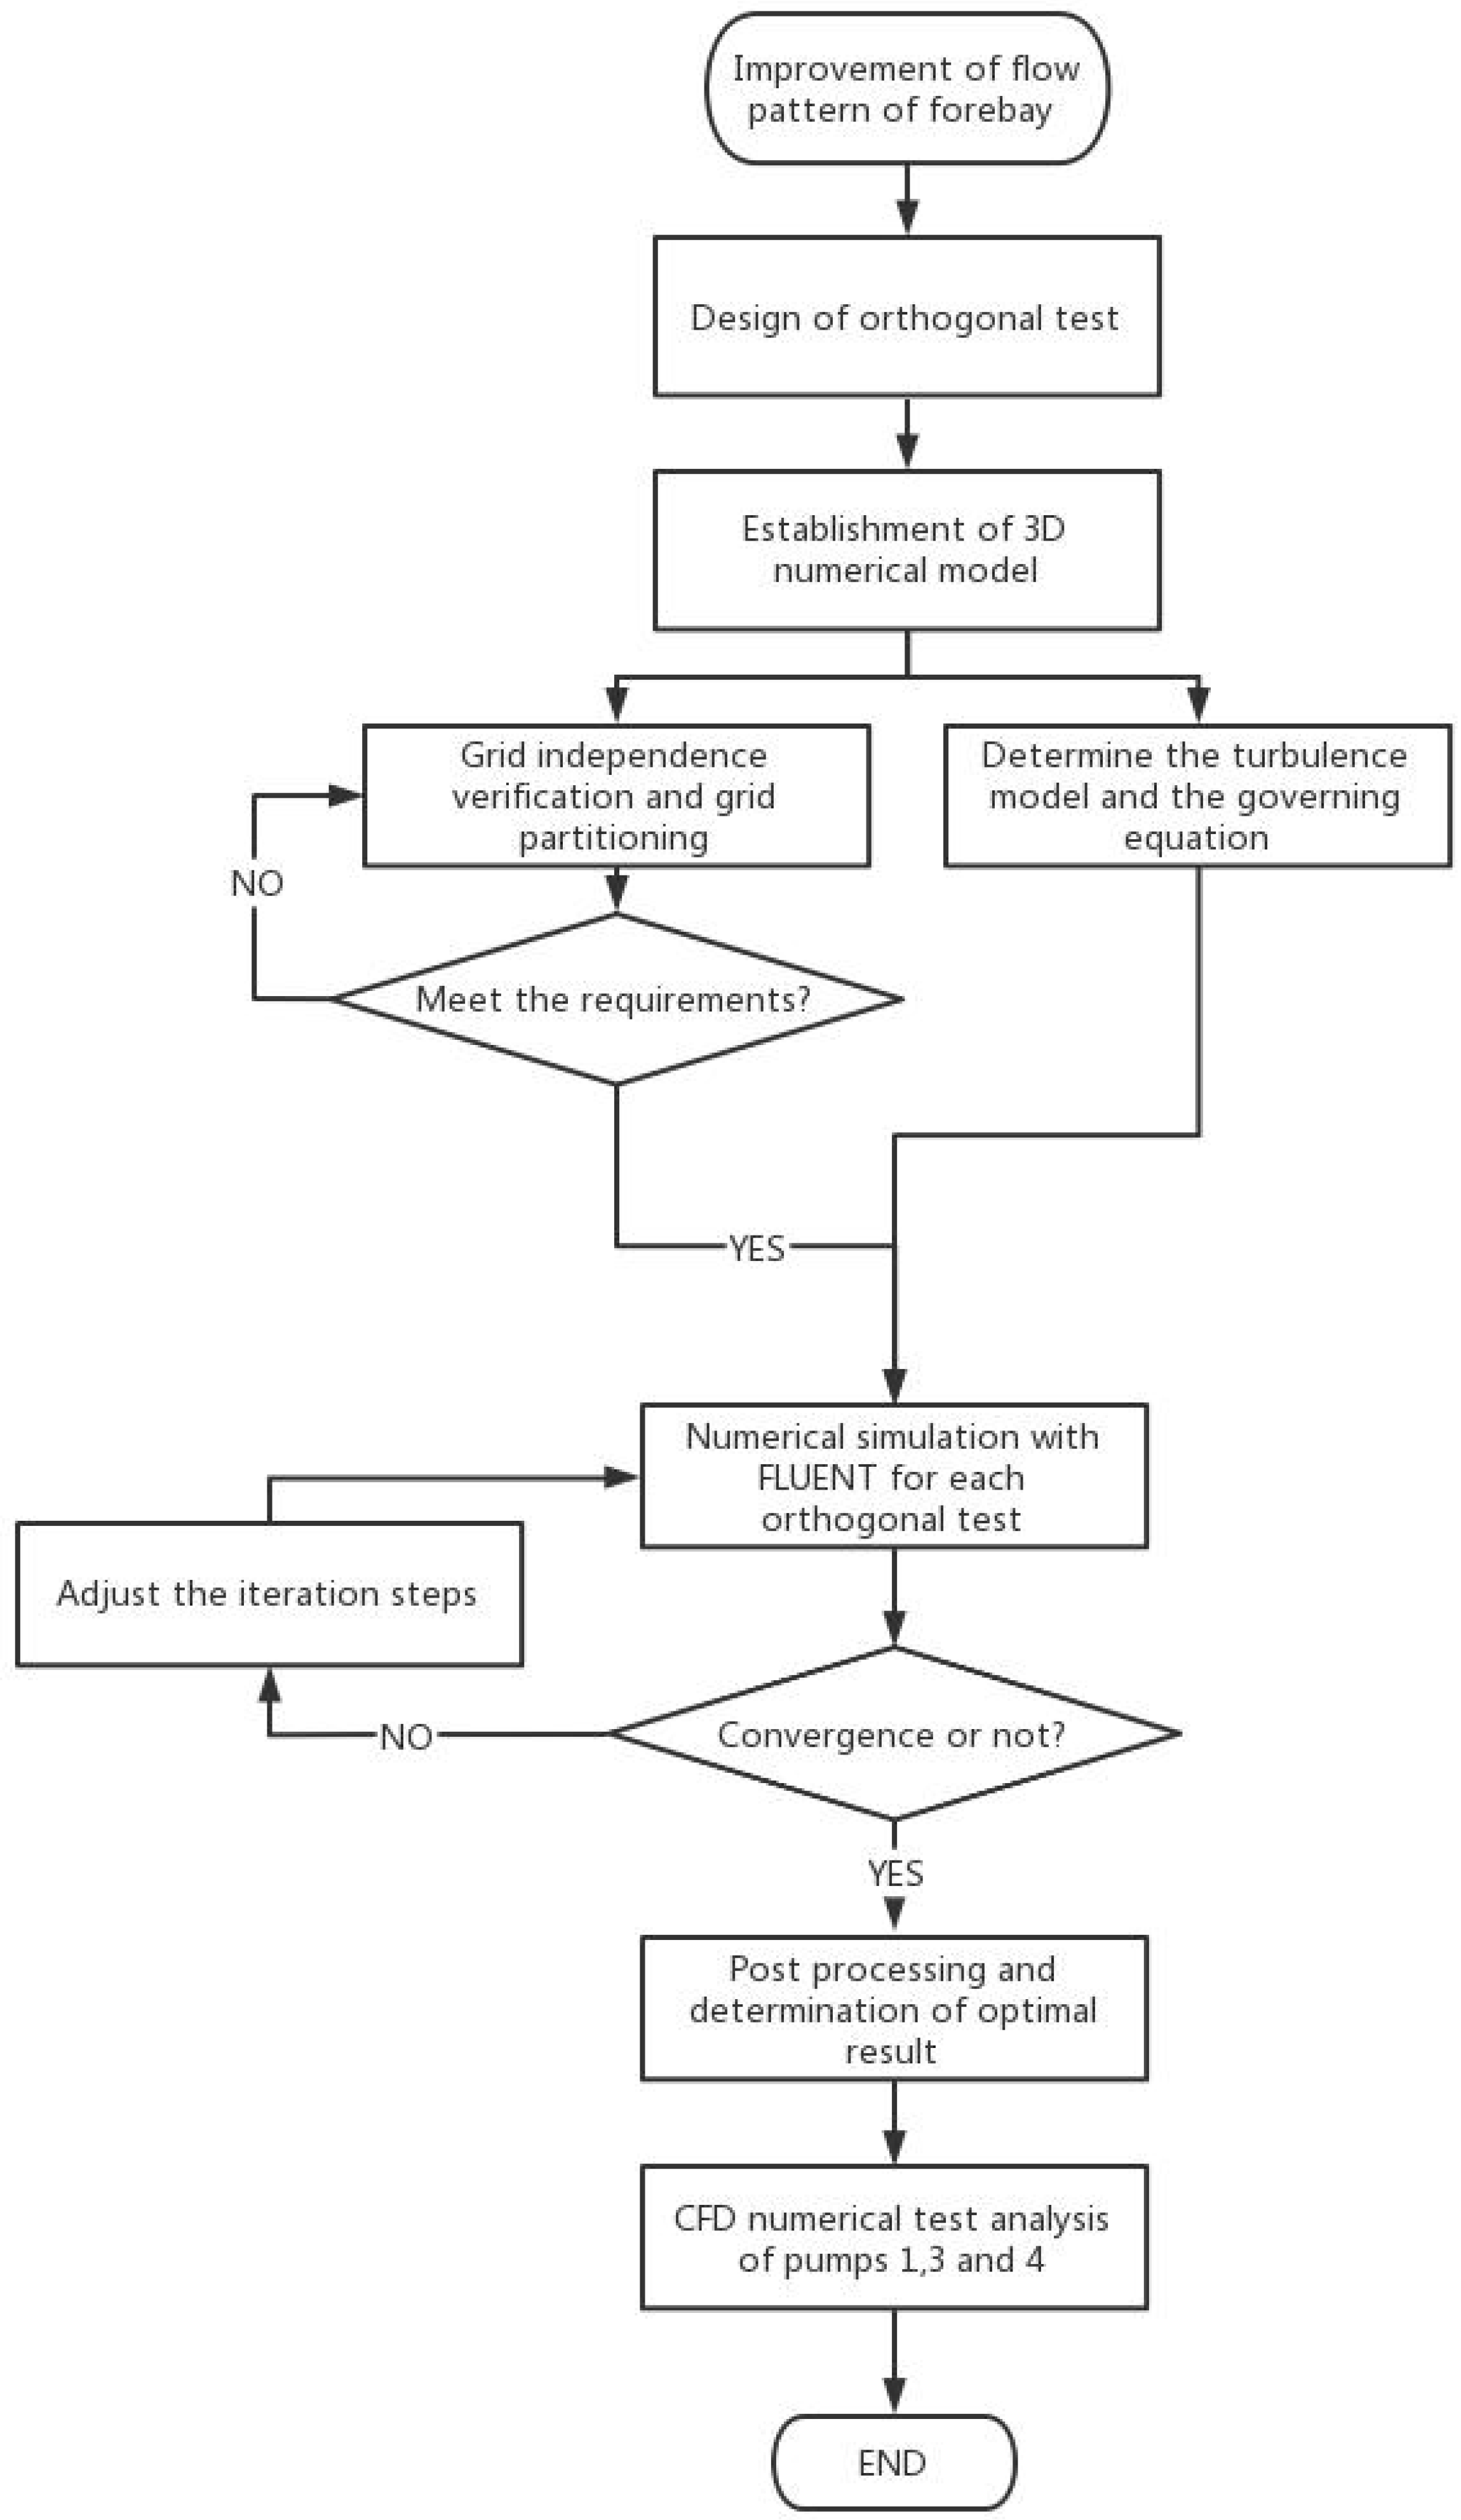
Figure 2.
The plane layout of the certain lateral intake pumping station (EL: m, OTH: mm:). (Scale 1:200).
Figure 2.
The plane layout of the certain lateral intake pumping station (EL: m, OTH: mm:). (Scale 1:200).

Figure 3.
Head loss at different numbers of mesh.

Figure 4.
Typical sections.
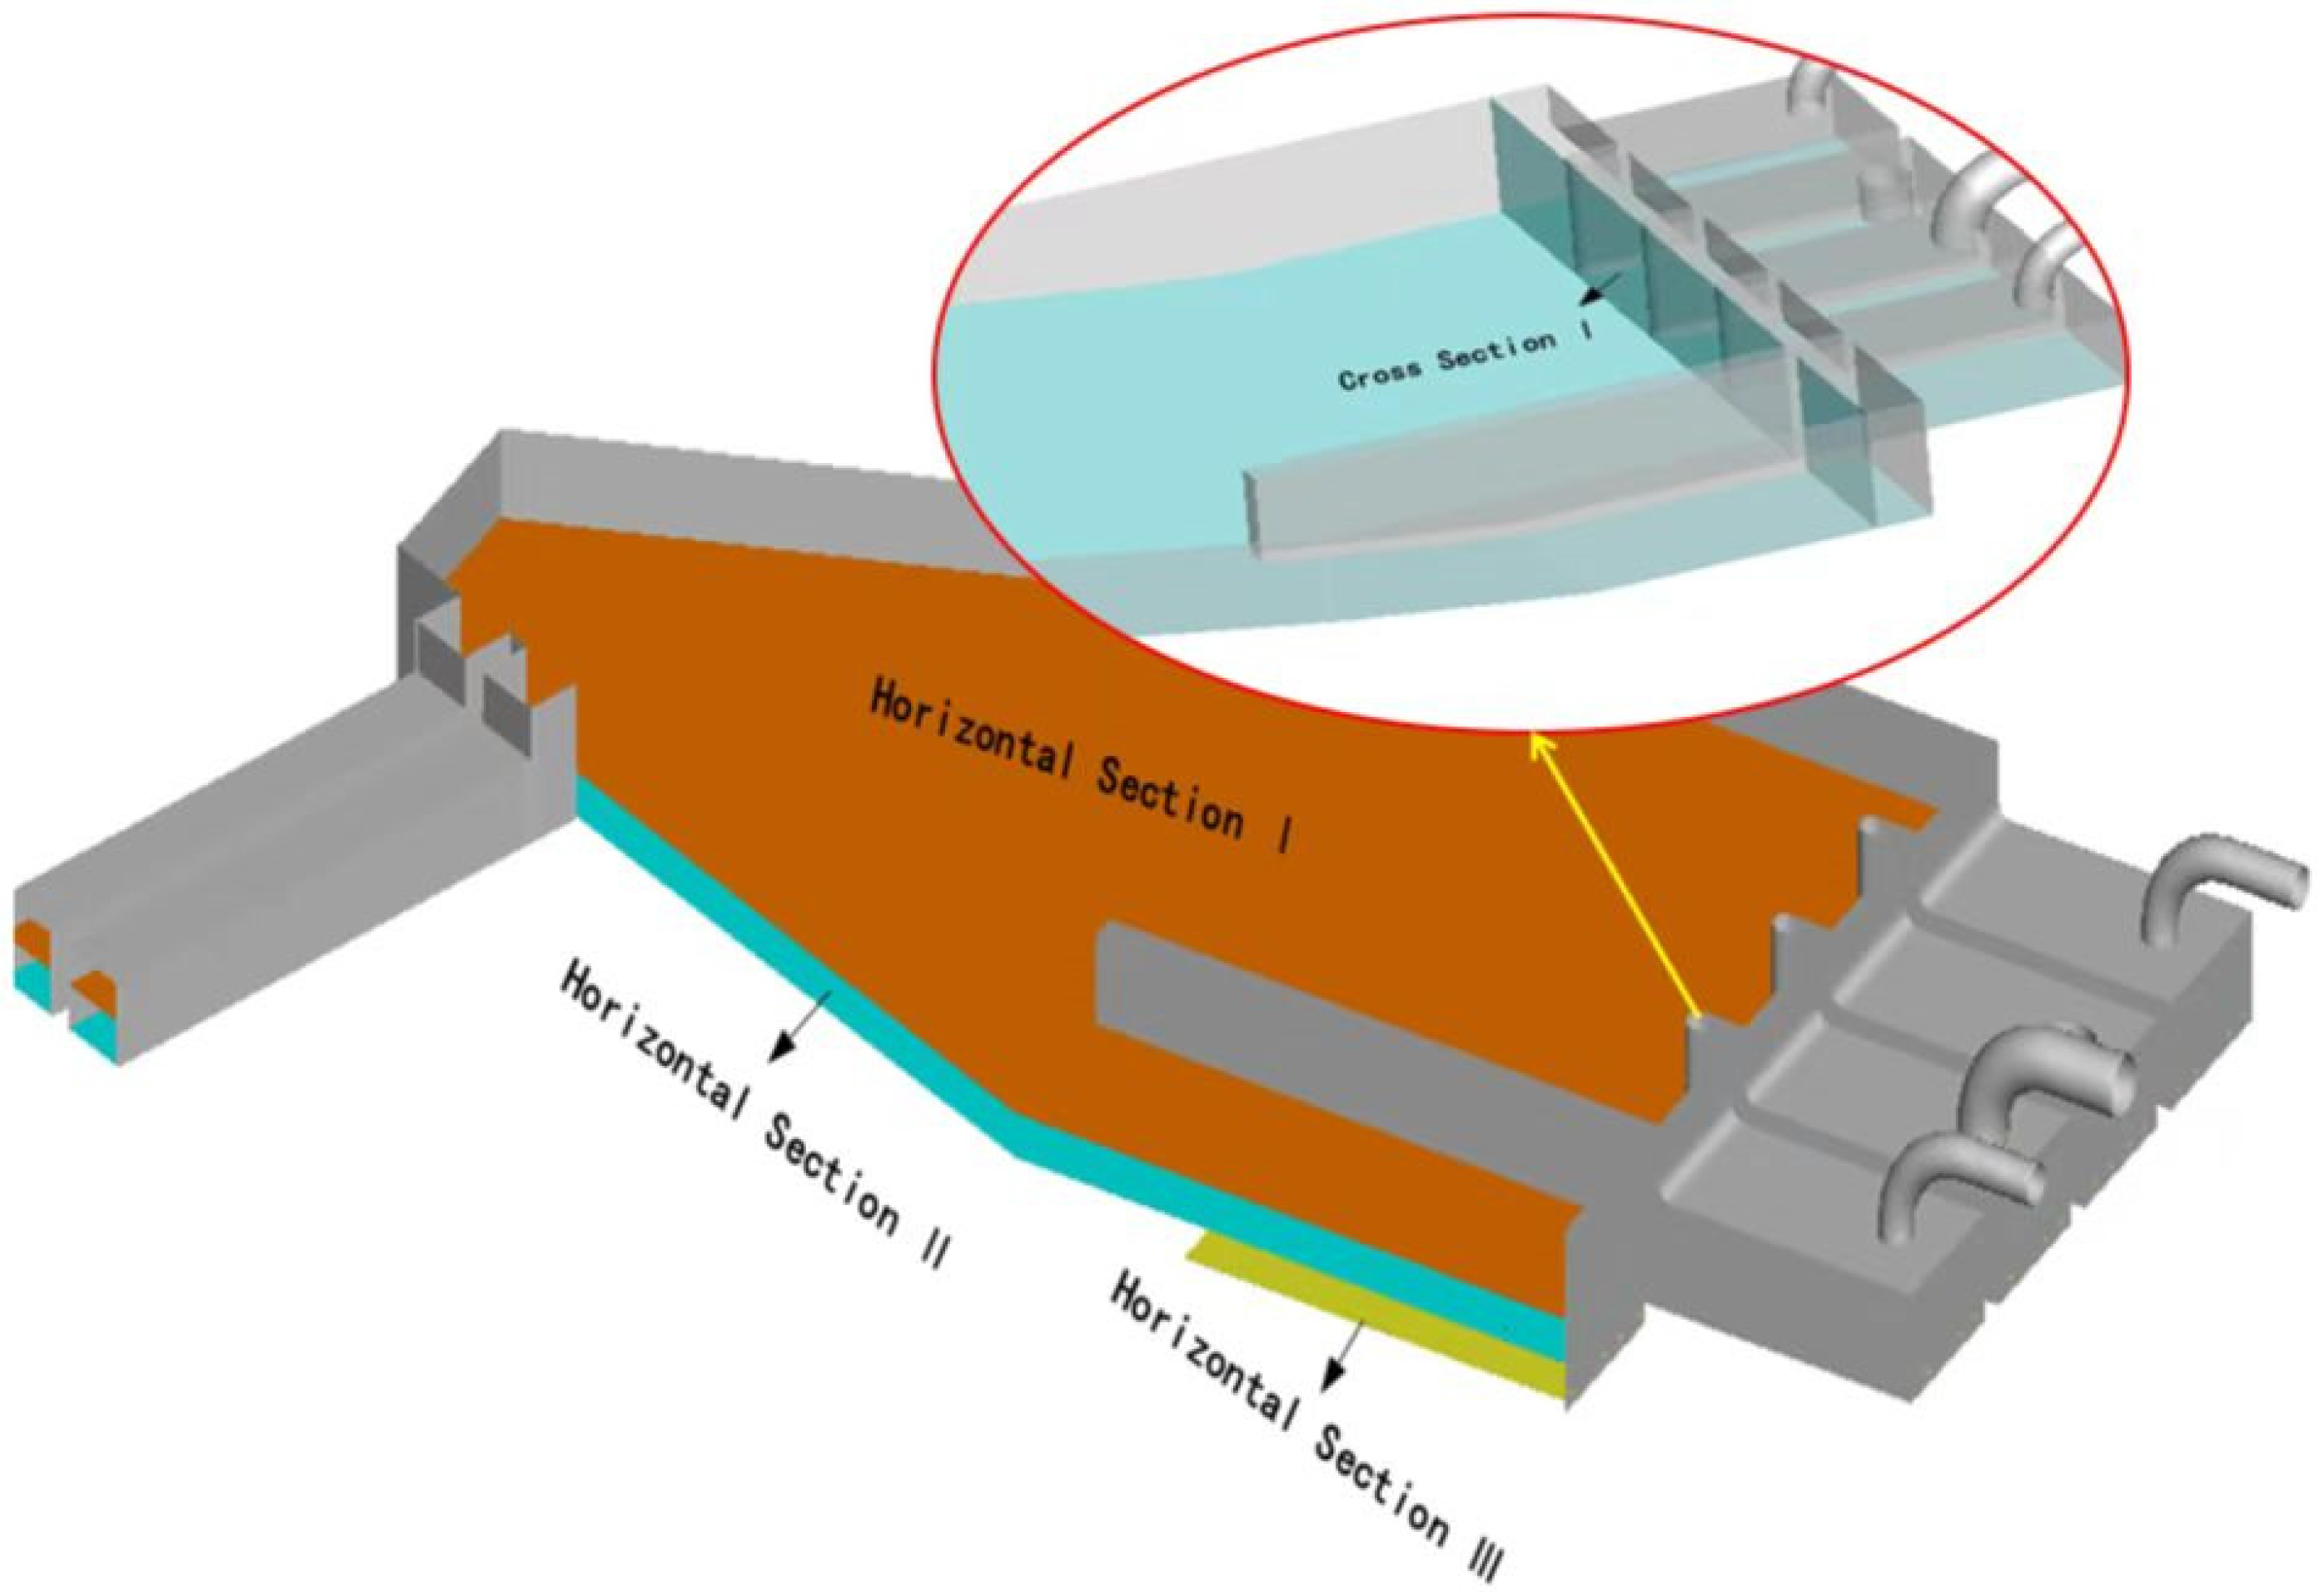
Figure 5.
Dimension design of the diversion piers.
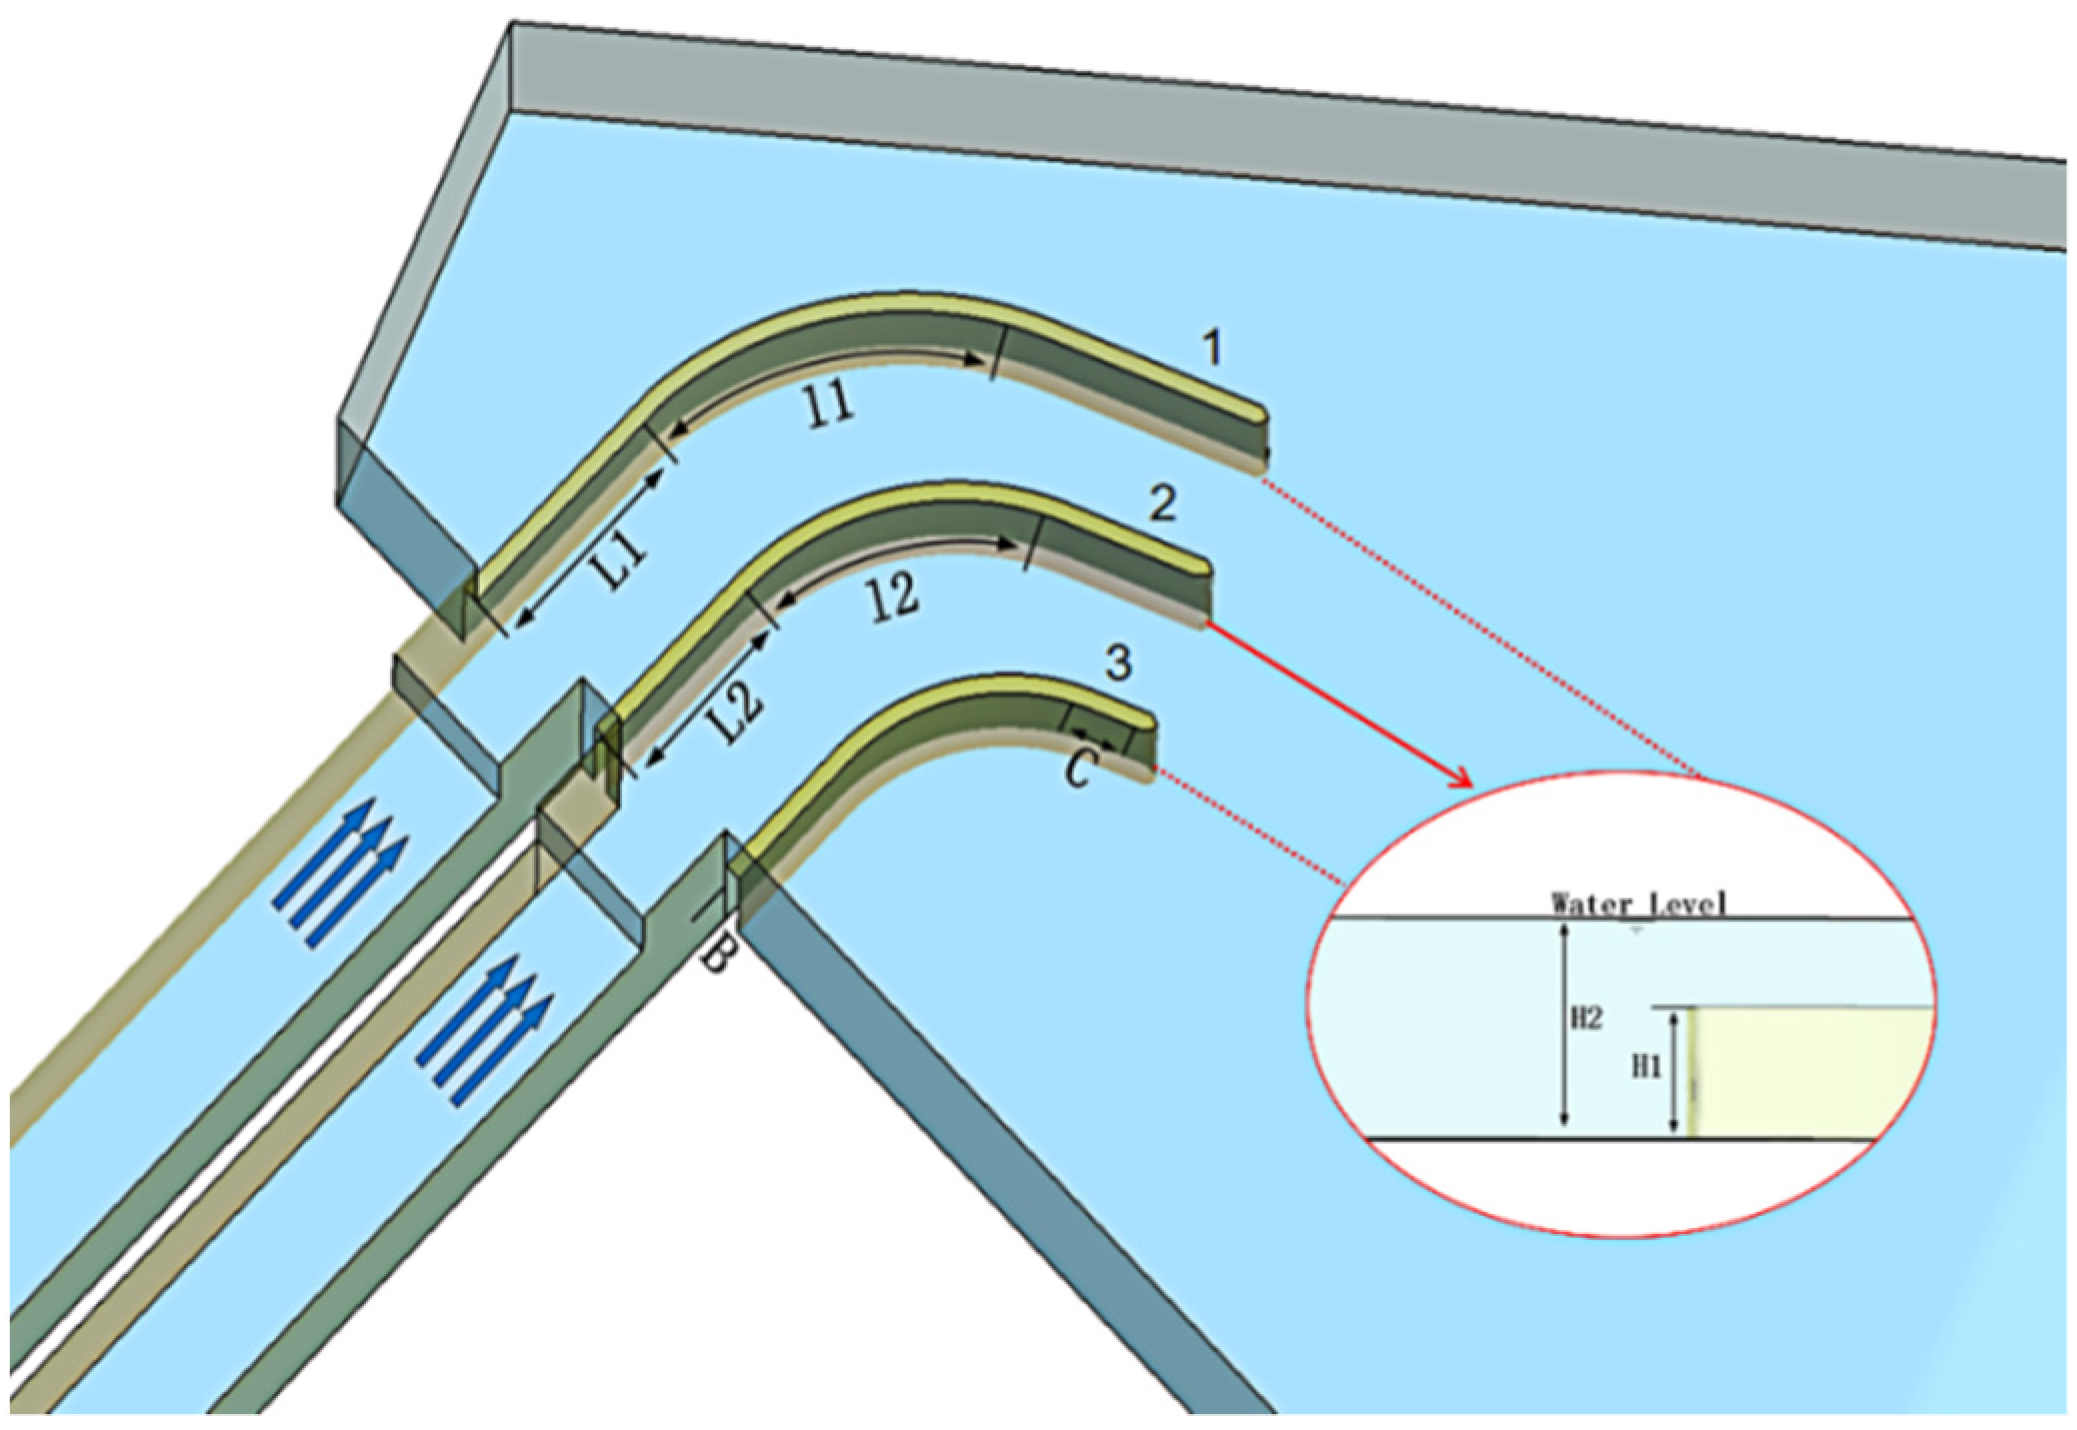
Figure 6.
The trend of UAFV with three levels for each factor.

Figure 7.
The trend of CWAAFV with three levels for each factor.

Figure 8.
Flow pattern for the optimal scheme of the diversion piers for operating pumps 1, 2, and 4.
Figure 8.
Flow pattern for the optimal scheme of the diversion piers for operating pumps 1, 2, and 4.
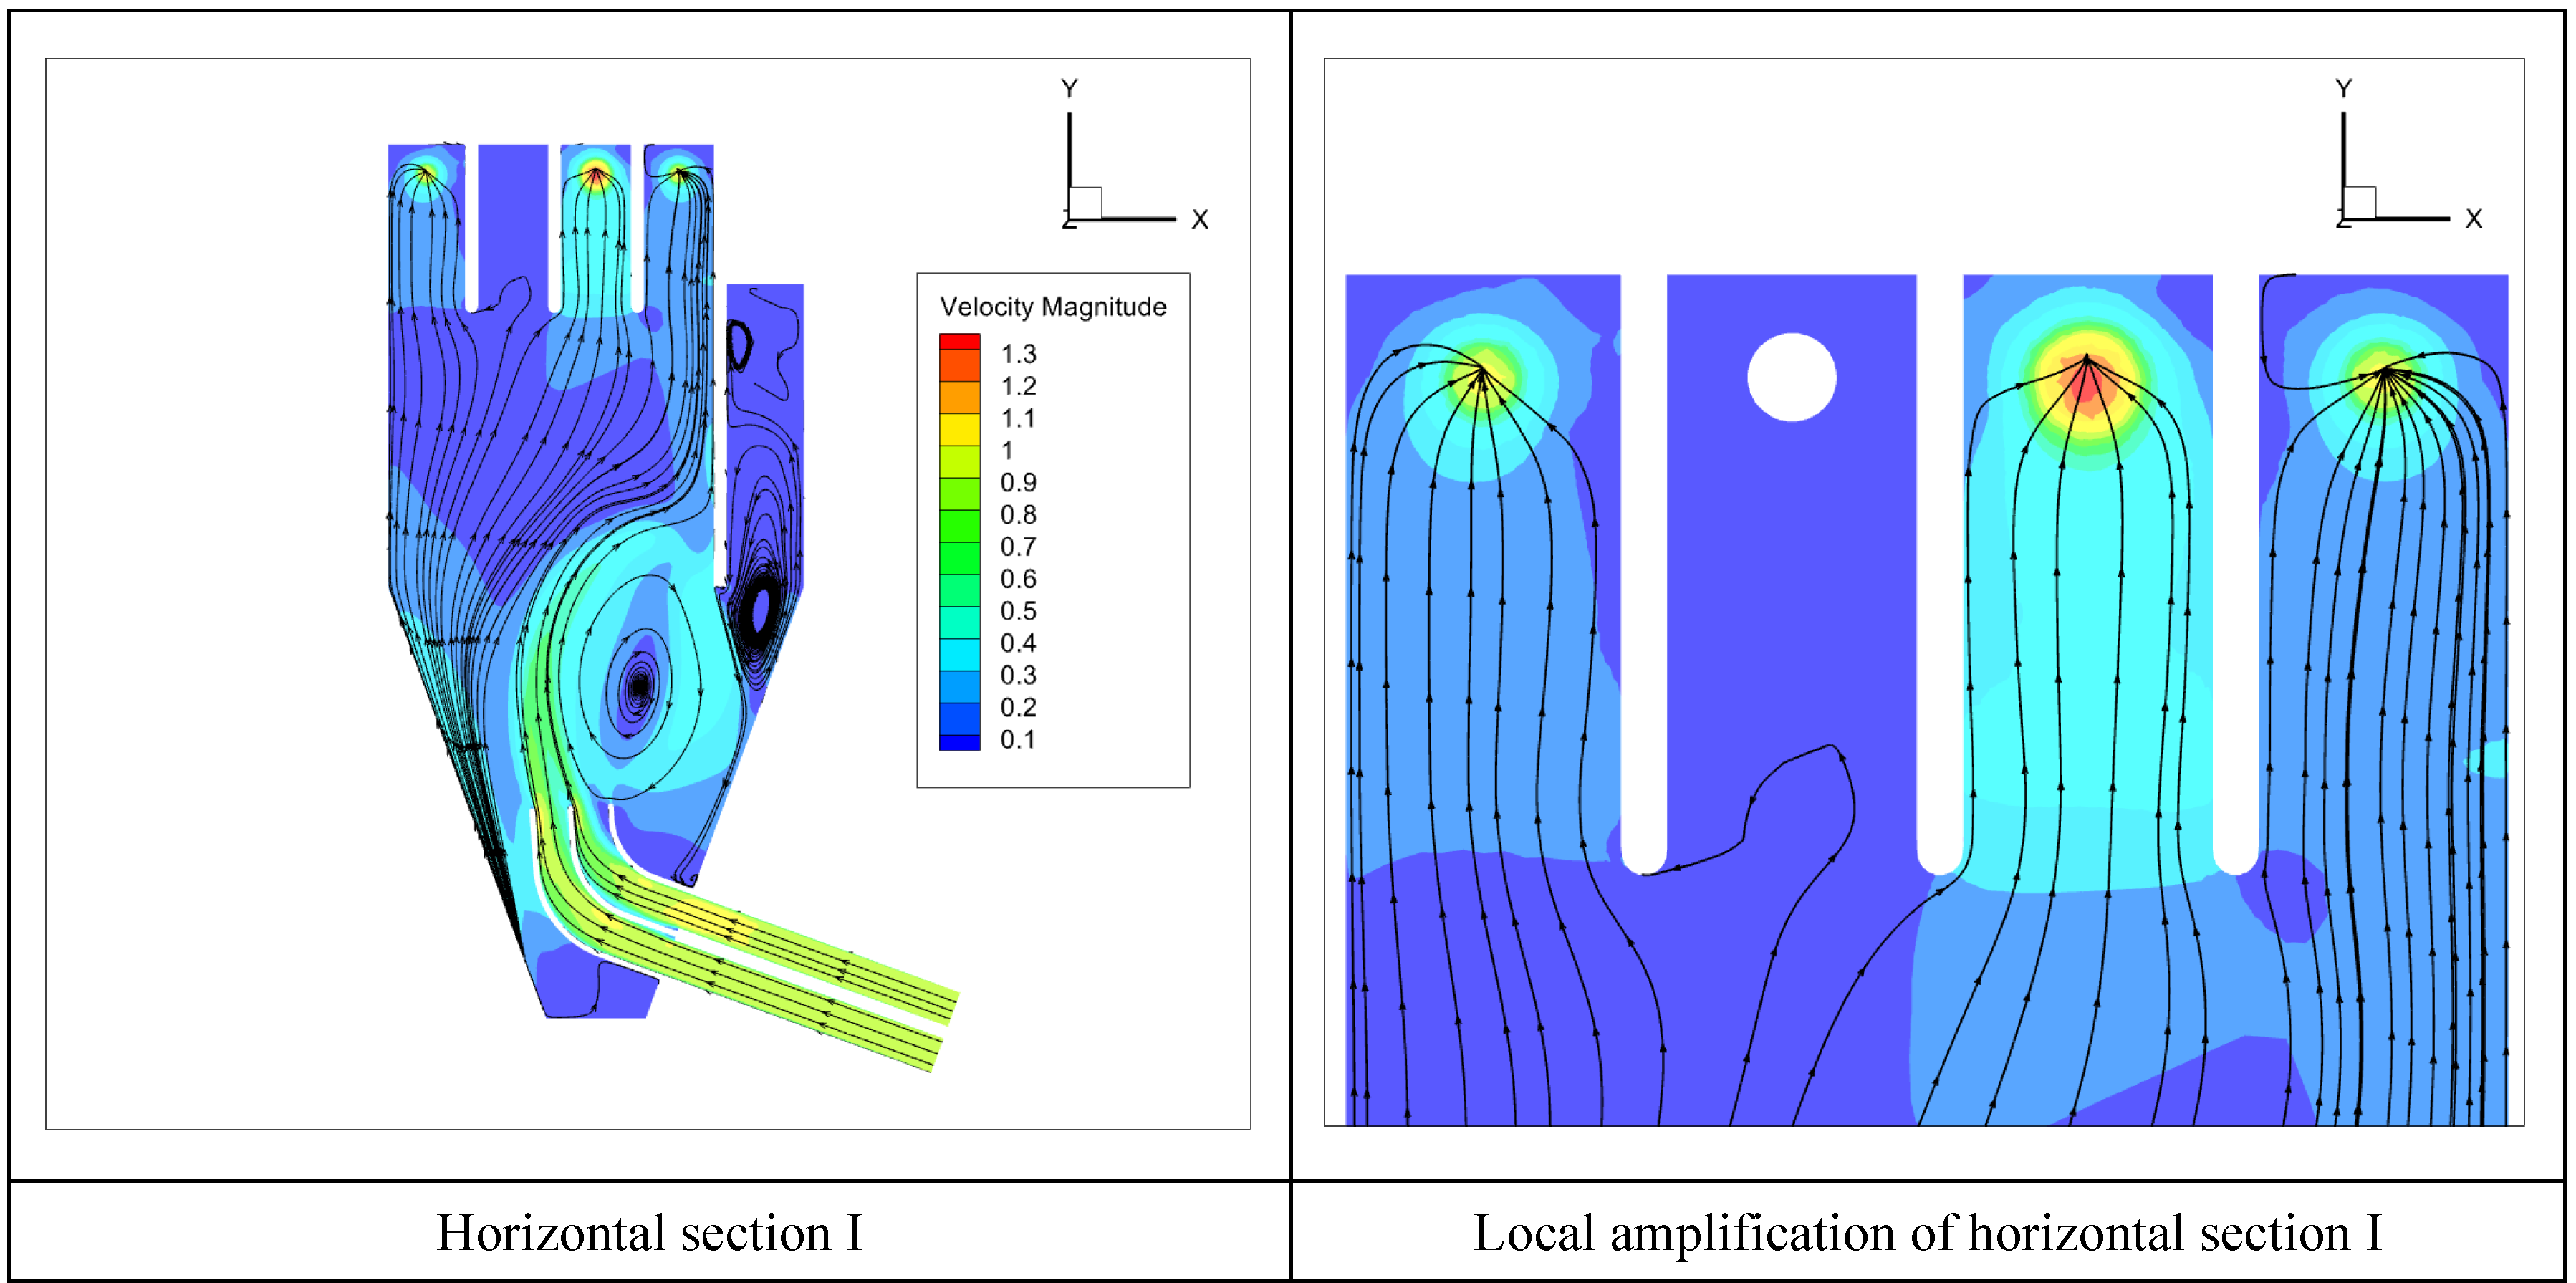

Figure 9.
The velocity vector of the approach diagram.
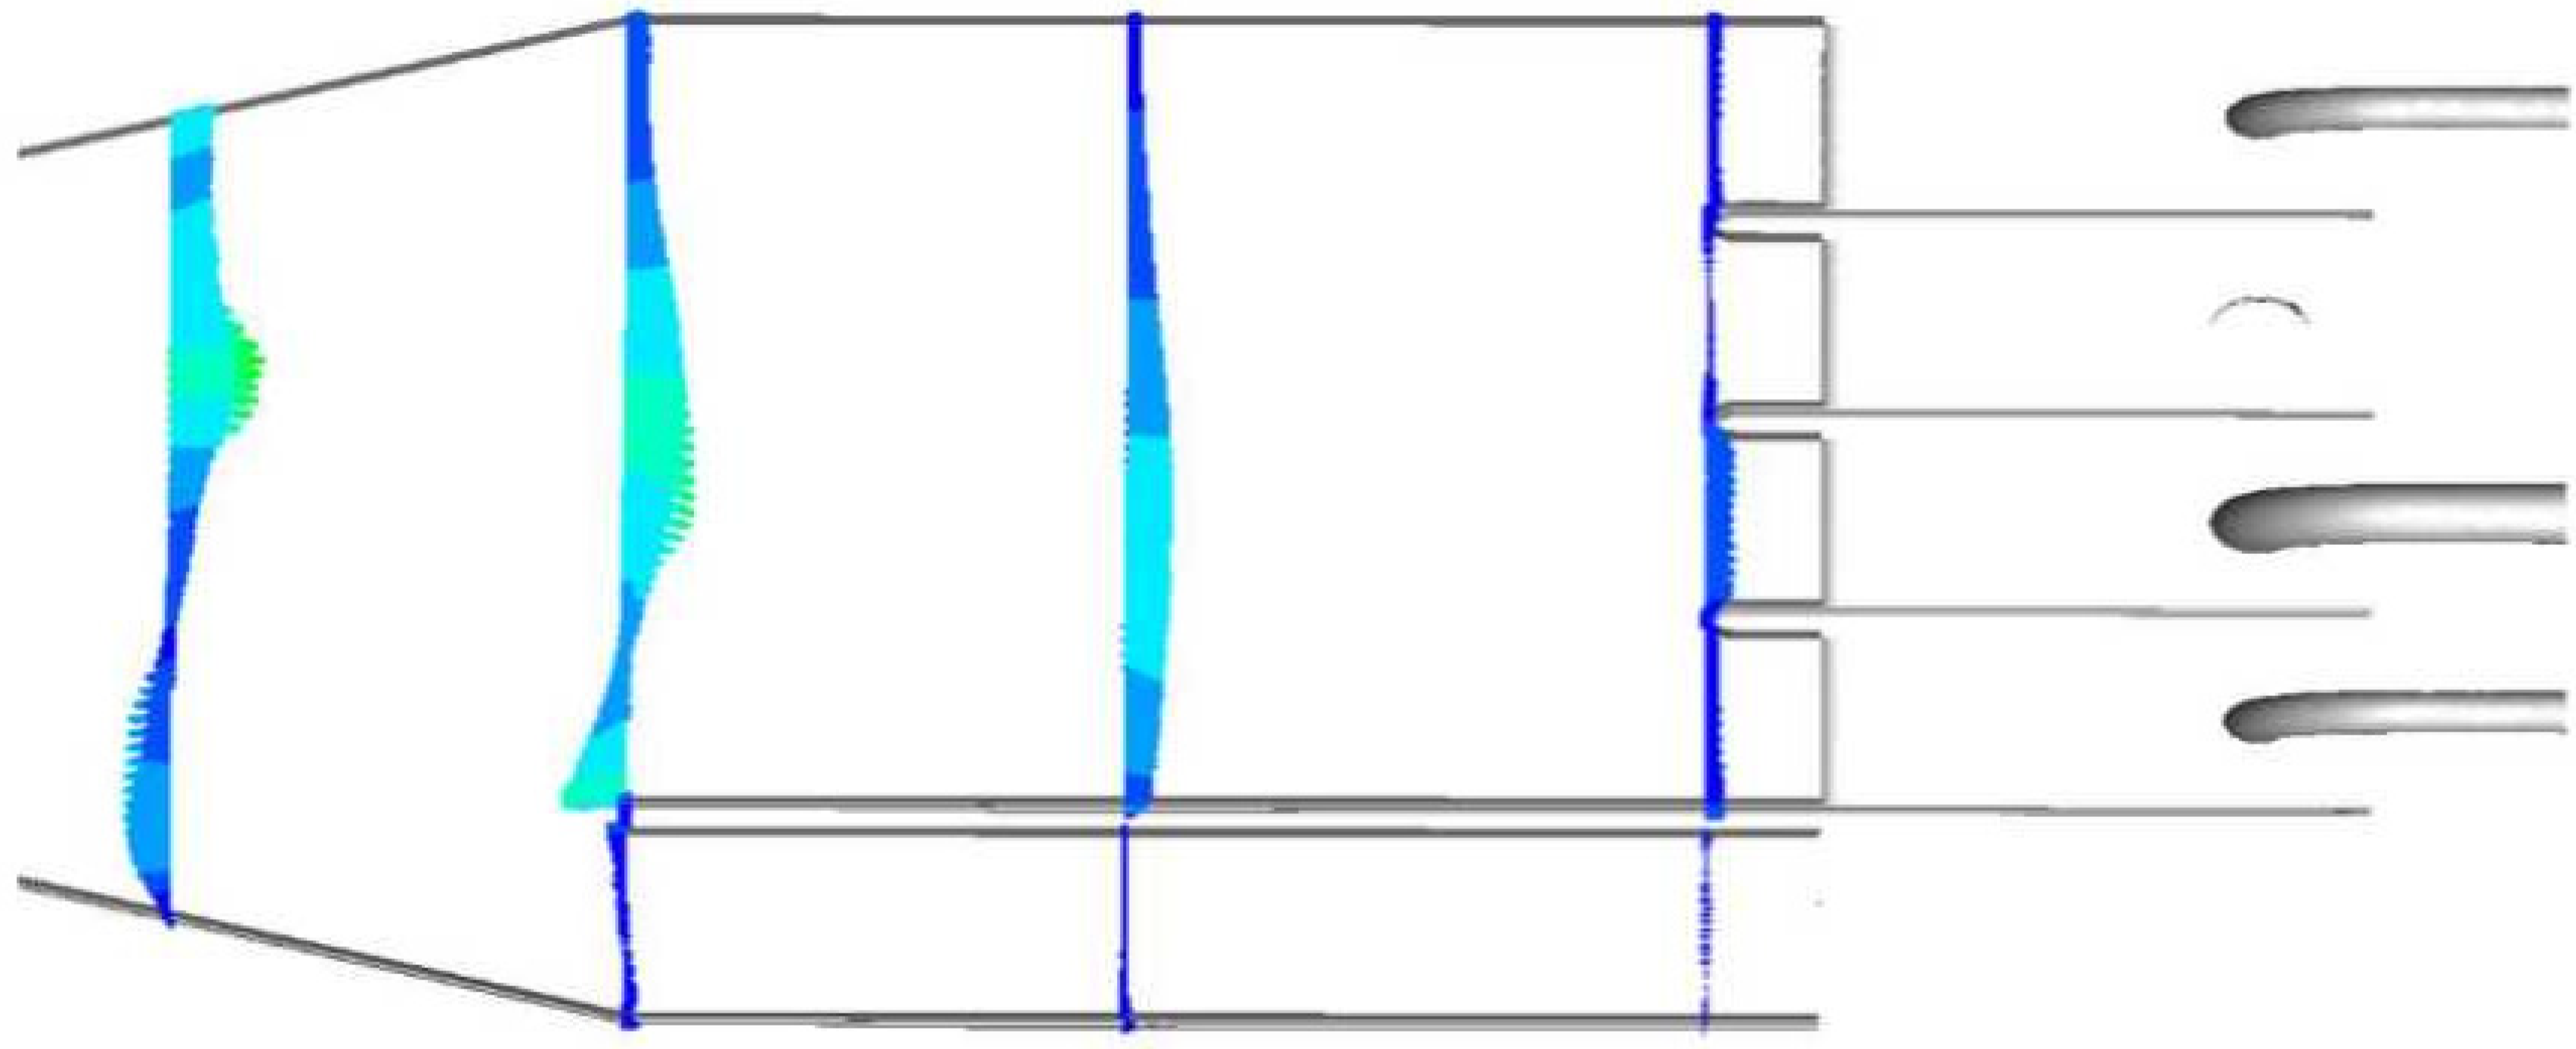
Figure 10.
Flow pattern for the optimal scheme of the diversion piers for operating pumps 1, 3, and 4.
Figure 10.
Flow pattern for the optimal scheme of the diversion piers for operating pumps 1, 3, and 4.

Table 1.
Three levels with four factors.
| Level | Factors | |||
|---|---|---|---|---|
| A | B (m) | C (m) | D | |
| 1 | 1.2 | 0.3 | 1 | 0.6 |
| 2 | 1.3 | 0.4 | 1.2 | 0.8 |
| 3 | 1.4 | 0.5 | 1.4 | 1 |
Table 2.
Orthogonal test results.
| Test Number | Factors | Results of Test | ||||
|---|---|---|---|---|---|---|
| A | B | C | D | UAFV (%) | CWAAFV (°) | |
| 1 | 1 | 1 | 1 | 1 | 85.665 | 7.398 |
| 2 | 1 | 2 | 2 | 2 | 88.528 | 22.473 |
| 3 | 1 | 3 | 3 | 3 | 79.698 | 37.819 |
| 4 | 2 | 1 | 2 | 3 | 76.714 | 33.429 |
| 5 | 2 | 2 | 3 | 1 | 82.426 | 12.775 |
| 6 | 2 | 3 | 1 | 2 | 80.727 | 14.701 |
| 7 | 3 | 1 | 3 | 2 | 73.546 | 25.101 |
| 8 | 3 | 2 | 1 | 3 | 82.402 | 31.221 |
| 9 | 3 | 3 | 2 | 1 | 77.980 | 13.649 |
Table 3.
Range analysis table.
| Range Analysis | UAFV | CWAAFV | ||||||
|---|---|---|---|---|---|---|---|---|
| A | B | C | D | A | B | C | D | |
| K1 | 253.890 | 235.925 | 248.794 | 246.071 | 67.690 | 65.927 | 53.319 | 33.821 |
| K2 | 239.867 | 253.356 | 243.222 | 242.801 | 60.904 | 66.469 | 69.551 | 62.274 |
| K3 | 233.928 | 238.405 | 235.670 | 238.814 | 69.970 | 66.168 | 75.695 | 102.469 |
| k1 | 84.630 | 78.642 | 82.931 | 82.024 | 22.563 | 21.976 | 17.773 | 11.274 |
| k2 | 79.956 | 84.452 | 81.074 | 80.934 | 20.301 | 22.156 | 23.184 | 20.758 |
| k3 | 77.976 | 79.468 | 78.557 | 79.605 | 23.323 | 22.056 | 25.232 | 34.156 |
| R | 6.654 | 5.810 | 4.375 | 2.419 | 3.022 | 0.181 | 7.458 | 22.883 |
Publisher’s Note: MDPI stays neutral with regard to jurisdictional claims in published maps and institutional affiliations. |
© 2022 by the authors. Licensee MDPI, Basel, Switzerland. This article is an open access article distributed under the terms and conditions of the Creative Commons Attribution (CC BY) license (https://creativecommons.org/licenses/by/4.0/).
Share and Cite
MDPI and ACS Style
Zhang, C.; Yan, H.; Jamil, M.T.; Yu, Y. Improvement of the Flow Pattern of a Forebay with a Side-Intake Pumping Station by Diversion Piers Based on Orthogonal Test Method. Water 2022, 14, 2663. https://doi.org/10.3390/w14172663
AMA Style
Zhang C, Yan H, Jamil MT, Yu Y. Improvement of the Flow Pattern of a Forebay with a Side-Intake Pumping Station by Diversion Piers Based on Orthogonal Test Method. Water. 2022; 14(17):2663. https://doi.org/10.3390/w14172663
Chicago/Turabian StyleZhang, Chen, Haodi Yan, Muhammad Tahir Jamil, and Yonghai Yu. 2022. "Improvement of the Flow Pattern of a Forebay with a Side-Intake Pumping Station by Diversion Piers Based on Orthogonal Test Method" Water 14, no. 17: 2663. https://doi.org/10.3390/w14172663
Note that from the first issue of 2016, this journal uses article numbers instead of page numbers. See further details here.