Abstract
Policies for promoting sustainable development of dam projects in the world have always been an argument due to the negative impacts on ecosystems. How to improve the efficiency of identifying the impacts and main indicators in the environmental impact assessment (EIA) process and post environmental impact assessment (PEIA) process is a common topic. Since the rapid dam construction in the past decades, most dam projects in China have turned to operation period. In order to identify the main impacts and provide scientific bases for the decision-making process, we optimized and applied the decision-support prototype (DSP) toolkit on the cascade dam projects on the Yangtze River. Through the optimization of the module and tools, the modified DSP was more applicable for China’s dams. Though the modified DSP cannot replace large-scale assessments for dam projects, it would assist the EIA and PEIA process by identifying the most relevant environmental concerns and knowledge gaps at early stages of negotiation, so that more attention can be focused on subsequent studies and evaluative processes. On the other hand, some new limitations were found in our practice. In response to the limitations, we propose several suggestions: (1) SBQ: to introduce a factor to balance the proportion evaluation result of new developed dams and existing dams in the study; (2) SBQ: to consider more about interactions between cascade dam projects and their impacts on different spatial scales; (3) EEM, extend the parameters for generating EEM from dams in areas outside of the U.S.
1. Introduction
To serve as water use, electricity, flood control, irrigation, shipping, and other purposes use for human beings, more and more dam projects are being constructed. Though it is a low-cost and low-carbon way to produce clean energy and has multiple uses, policies for promoting sustainable development of dam projects in the world have always been an argument [1,2,3]. The construction and operation of dam projects provide energy with long-term effects. Before the construction of projects, an environmental impact assessment (EIA) that relies upon environmental studies is required as common policy in many countries. However, sometimes it is not effective in rejecting projects with dubious justification, significant impacts, and little social utility [4]. Potential impacts and mitigation of construction and operation of the project are proposed after study, and then mitigation facilities and measures will be implemented. However, the effectiveness and effects of the mitigation are merely assessed for most projects and comprehensive data of mitigation facilities is lacking [5,6,7]. Costs of mitigation improvement can become a new decision variable for dam projects development in the U.S. due to the small scale of most of the remaining potential and the increasing stringency of environmental requirements [8,9,10,11]. Until now, there is no common policy for assessing the operation of dams, which guarantee the sustainable development of the projects. In the U.S., a time and resource-intensive regulatory process Federal Energy Regulatory Commission (FERC) license was applied for project re-license [12]. While standard EIA may were enough in the past, at least six more detailed guidelines are prescribed by many international institutions (e.g., FERC, LIHI, EAWAG, GHC, HSAP, IEA, and EBRD), and three guidelines are under or prepared for implementation in China (e.g., LIHI, HSAP, and GHC) [13,14,15]. Most of them use a consolidated set of metrics to help balance competing demands and achieve stakeholder goals in a timely and affordable manner, while others use a time and resource consuming method to cover all the effects [16]. In order to scientifically assess the impacts of operation, China proposed guidelines of post environmental impact assessment (PEIA) framework based on the three guidelines. However, a subset of indicators may not adequately address all components of sustainability, while complete covered indicators spend uneconomic cost and delay the assessment to several years.
To be effective in evaluating the environmental impacts of dams’ comprehensive cost-benefits, a decision-support prototype (DSP) toolkit was presented for determining the most relevant indicators to understand environmental impacts of dams [17]. The toolkit aims to increase the efficiency of the EIA process and assist the EIA process by identifying the most relevant environmental concerns and knowledge gaps at early stages based on the science-based questionnaire (SBQ), so that more attention can be focused on subsequent studies and evaluative processes. Furthermore, the toolkit can be applied to PEIA, and it can be used for determining the most relevant indicators of cascade dam projects after modification. Based on a database of environmental metrics collected from a series of studies, an Environmental Metrics of Hydropower that contains many indicators is proposed in six categories including biota and biodiversity (BB), water quality (WQ), geomorphology (GM), connectivity and fragmentation (CF), water quantity (HD), and land cover (LC). Moreover, then SBQ was built on the premise of eco-evidence approaches [18,19].
With rapid dam construction in the past decades, most dam projects in China have turned to operation period. Nearly half of the large dams of China have been built in the Yangtze River basin and the environmental impacts of the dams’ operation remain uncertain [20]. In order to evaluate the impacts of operation, we chose the first dam project, Gezhouba Dam Project (GZBP), and the largest dam project, Three Gorges Dam Project (TGP), on the mainstream of the Yangtze River as objects to identify the preliminary critical indicators. This is mainly because most dams in the mainstream of the Yangtze River are under construction or put into operation in the past ten years. Moreover, there lacks a comprehensive investigation of environmental processes in the project operation. Identifying the most relevant environmental concerns is the most important preliminary work before the implementation. Since GZBP has been in operation for four decades, and it has been nearly 30 years since the construction of TGP, it is needed to implement a post environmental impact assessment of GZBP and to determine the preliminary critical indicators of the cascade dam project. We modified the DSP toolkit by evaluating a single dam project to adapt the cascaded dam projects, and applied it to finish the evaluation. Moreover, many regional contents were added in the modified DSP and the toolkit is more adaptable for dam projects in China through this study.
2. Materials and Methods
2.1. Method
The DSP was developed by McManamay and Oak Ridge National Laboratory. The overall development of the DSP and connections among the three tools are introduced in McManamay’s paper. All three tools within the DSP were developed within Microsoft Excel with macro-enabled interactive features so it is very convenient to use and modify for a specific purpose. In this study, we modified the DSP for re-evaluation and post evaluation of cascade dam projects in China.
2.1.1. Science-Based Questionnaire (SBQ)
The first of the tools in the DSP is the science-based questionnaire (SBQ), which uses a question-driven weight-of-evidence approach to determine which river functions have been impacted by dam project construction and operation. A total of 52 river function indicators (Table 1, more details in Supplementary Table S1) were selected through a checklist study of Environmental Metrics for Hydropower (EMH). In the SBQ, two versions of the spreadsheet tool were provided for different projects: one for evaluating existing projects and a second for assessing potential impacts of new development projects.
Table 1.
River function indicators used to develop the science-based questionnaire presented in this paper (indicators and table taken and modified from Parish et al., 2019; Pracheil et al., 2019 and McManamay et al., 2020).
Through a series of structured questions, the SBQ aids in identifying knowledge gaps and selects which river function indicators may be worthy of further investigation, either through documentary analysis or field investigations. In this study, we modified the structured questions based on China’s reality and added some regional specific questions (Table S2). To structure the 140 questions in the SBQ, each of the questions was formulated to identify common environmental effects of dam projects implemented within a variety of contexts. Of these, 92 questions were reformatted to be applicable to new development projects. For both existing and new development projects, questions were organized into five major categories related to different spatial considerations and 18 subcategories aimed at more specific details (Table 2). Within the spreadsheet programs, answers to questions are summarized by river function indicators representing the dimensions of the terrestrial–aquatic environment potentially affected by cascade dam projects.
Table 2.
Number of questions within each section of the spreadsheet tools (“Existing” refers to the spreadsheet program for existing dams whereas “New” refers to the program for new development) and their relationship to each river function indicator category.
All questions were structured in a way that “yes” answers provided evidence of potential effects of dam projects on a given function. All questions must be answered “yes”, “no”, “uncertain”, or “not applicable”. Five questions were targeted per function in order to elicit enough information about each function while also providing a “tiebreaker” question. The questions were organized into a series of primary categories and subcategories. Primary categories of organization related to the spatial scales (basin, project-level, reservoir, or downstream). For biologically relevant questions, options were also provided for a user to specify which taxa groups were relevant (fish, amphibian, bird, mammal, reptile, crustacean, bivalve, insect, and plant).
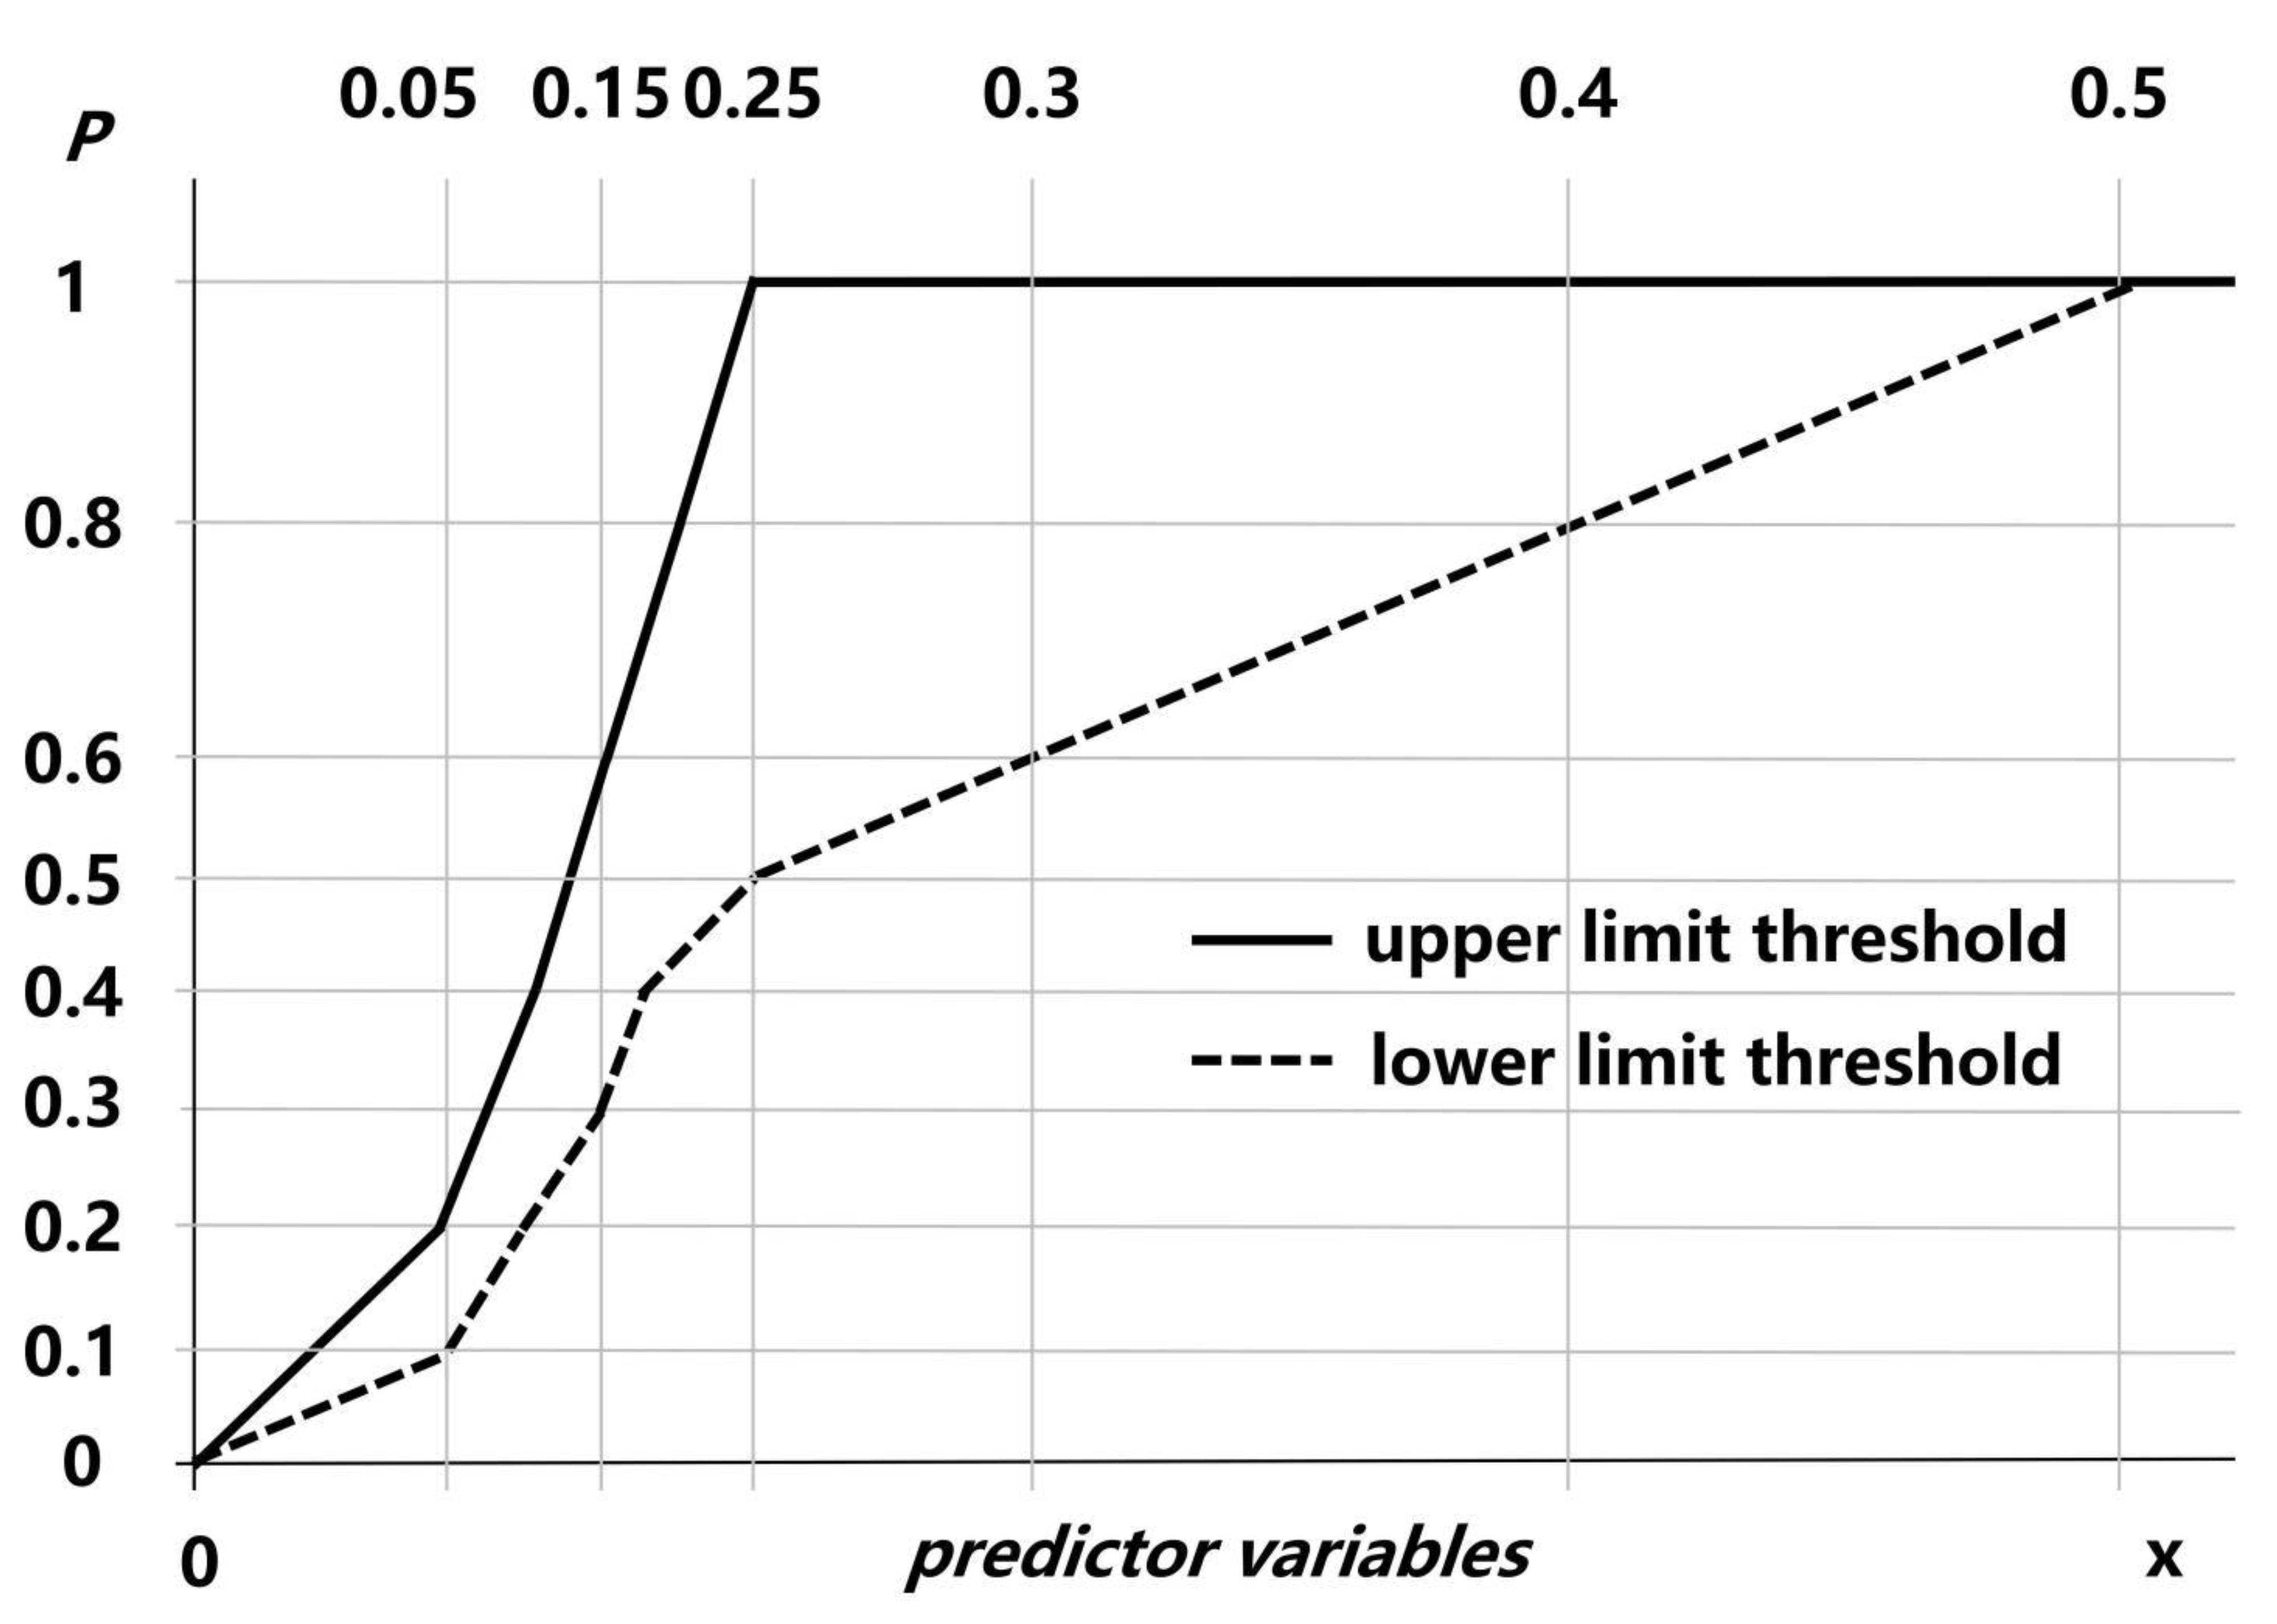
2.1.2. Environmental-Envelope Model (EEM)
The second tool is environmental envelope model (EEM) to predict the likelihood of river functions being affected by dam projects based on several variables. In cases of new development projects, answering questions about environmental impacts may be difficult as development has yet to occur and environmental responses are not observable. Information required to determine the potential impacts of a new project on river functions is generally limited by using the SBQ. Thus, the EEM was developed based on data envelopment analysis (DEA), by using EHM database of more than 3000 environmental metrics derived from global literature of several types.
DEA is a non-parametric mathematical method measuring relative performance or efficiency within a group of homogeneous decision-making units (DMUs) with multiple inputs and multiple outputs [21]. The Charnes–Cooper–Rhodes (CCR) DEA model and the Banker–Charnes–Cooper (BCC) DEA model are two standard DEA models. The CCR DEA model is a model of constant returns to scale. The BCC DEA model is a model of variable returns of scale. In this study, the CCR DEA model was used.
Let a set of DMUj be in the evaluation system. Define xij as the input vector of DMUj with the input weight vector vi, and define yij as the output vector of DMUj with the output weight vector ui. Assume that each DMUj consumes xij amount of input i to produce yrj amount of output r, and that the input and output of DMUj being evaluated are as in Equation (1).
In this study, 10 indicators of dam attributes (Table 3) were selected as the input vector vi of DMUj and predictive variables of EEM, and their influence on 52 river function “occurrence” probability was selected as the output vector ui, and the possibility of being impacted was selected by EEM.
Table 3.
Indicators of dam attributes as input vector of DMU and predictive variables used in developing the environmental envelope model (EEM), their description.
For unit j0 (1 ≤ jo ≤ n), the input-oriented DEA model has the form of Equation (2). The goal of the input-oriented DEA model is to minimize the virtual input, relative to a given virtual output, subject to the constraint that no DMU can operate beyond the production possibility set and the constrain relating to non-negative wights. While the optimal efficiency rating hj0 of P is 1, then j0 is considered 100% efficient.
To construct the non-linear envelop relationship between the 10 predictor variables and 52 river function indicators, the Generalized Reduced Gradient algorithm was used to maximize log likelihoods in Microsoft Excel. Moreover, two scenarios of river function indicator envelope curves were developed to determine the individual influence of each predictor variable on the probability of impacting each of the 52 river function indicators. In this study, the upper limit threshold where predictor variables’ values 25th percentile equals the maximum P is 1, and where percentiles of 0.05, 0.1, 0.15, and 0.2 equal P values of 0.2, 0.4, 0.6, and 0.8, respectively. The lower limit threshold where 50th percentile of predictor variables’ values equals the maximum P is 1, and where 0.1, 0.2, 0.25, 0.3, and 0.4 percentiles equal P of 0.2, 0.4, 0.5, 0.6, and 0.8, respectively (Figure 1). After that, the individual influence of each predictor variable on the probability of impacting each river functions indicator can be determined.
Figure 1.
Upper and lower threshold envelopes predicting the probability of each predictor variable on each river function indicator.
Furthermore, an indicator suitability scores (SS) was constructed to describe the individual influence of a dam project on the probability of impacting each river functions indicator (Equation (3)). SS consist of 10 individual influences of each predictor variable on the probability of impacting each river functions indicator ui. Based on the upper and lower limit threshold, max(SSj) and min(SSj) can be calculated. Moreover, the 52 max(SS) and min(SS) provide the individual influence range of new dam projects on the probability of impacting river function indicators.
where is the individual influence of a dam project on the probability of impacting jth river functions indicator, j = 1, 2,…, 52. is the individual influence of ith predictor variable on the probability of impacting jth river functions indicator, and i = 1, 2,…, 10. is the relative weight of the individual influence of ith predictor variable on the probability of impacting jth river functions indicator, 0 < < 10.
2.1.3. River Function Linkage Assessment Tool (RFLAT)
The third tool is the River Function Linkage Assessment Tool (RFLAT) for drawing graphical networks to visualize inter-dependence among river functions and indicators. A binary matrix of pair-wise directional hypothetical relationships between river functions was formed, where 1 indicates a viable relationship and 0 indicates no likely relationship. Visualizing network-type relationships required decomposing the matrix into node and edge datasets. The “node” dataset represented river functions as hubs of the network whereas the “edge” dataset represented the relationships (i.e., ‘from-to’ linkages) among river functions. The strength of relationships between indicators can further be informed using evidence from the SBQ, particularly the proportion of questions answered “yes” for each indicator participating in a relationship. Bayes’ theorem was used to infer causality between indicators (Equation (4) to Equation (6)), where the probability of causality is conditioned based on the probabilities that each indicator is independently affected. The RFLAT tool also requires the use of the R programming code to develop network visualizations. In this study, we extended the linkage from functions categories to function indicators in order to describe the details of the cause-and-effect relationship. Moreover, network visualizations were described by a “Circos” graph instead of a network type relationship graph.
where represents the strength of causal relationship of indicator and indicator , it is the conditional probabilities of being influenced by indicator . H is the hypothesized relationship, as indicated by binary values of 0 and 1. and are the proportions of questions answered “yes” for indicator and indicator . is the probability that is not impacted, and is the probability of being impacted when is not impacted. There is a hypothesis in the RFLAT development that some indicators cannot be affected by dam projects, the minimum value of is set 0.2; thus, if 1 − ≤ 0.2, then = 0.2, or, .
2.1.4. Evaluation for Cascade Dam Projects
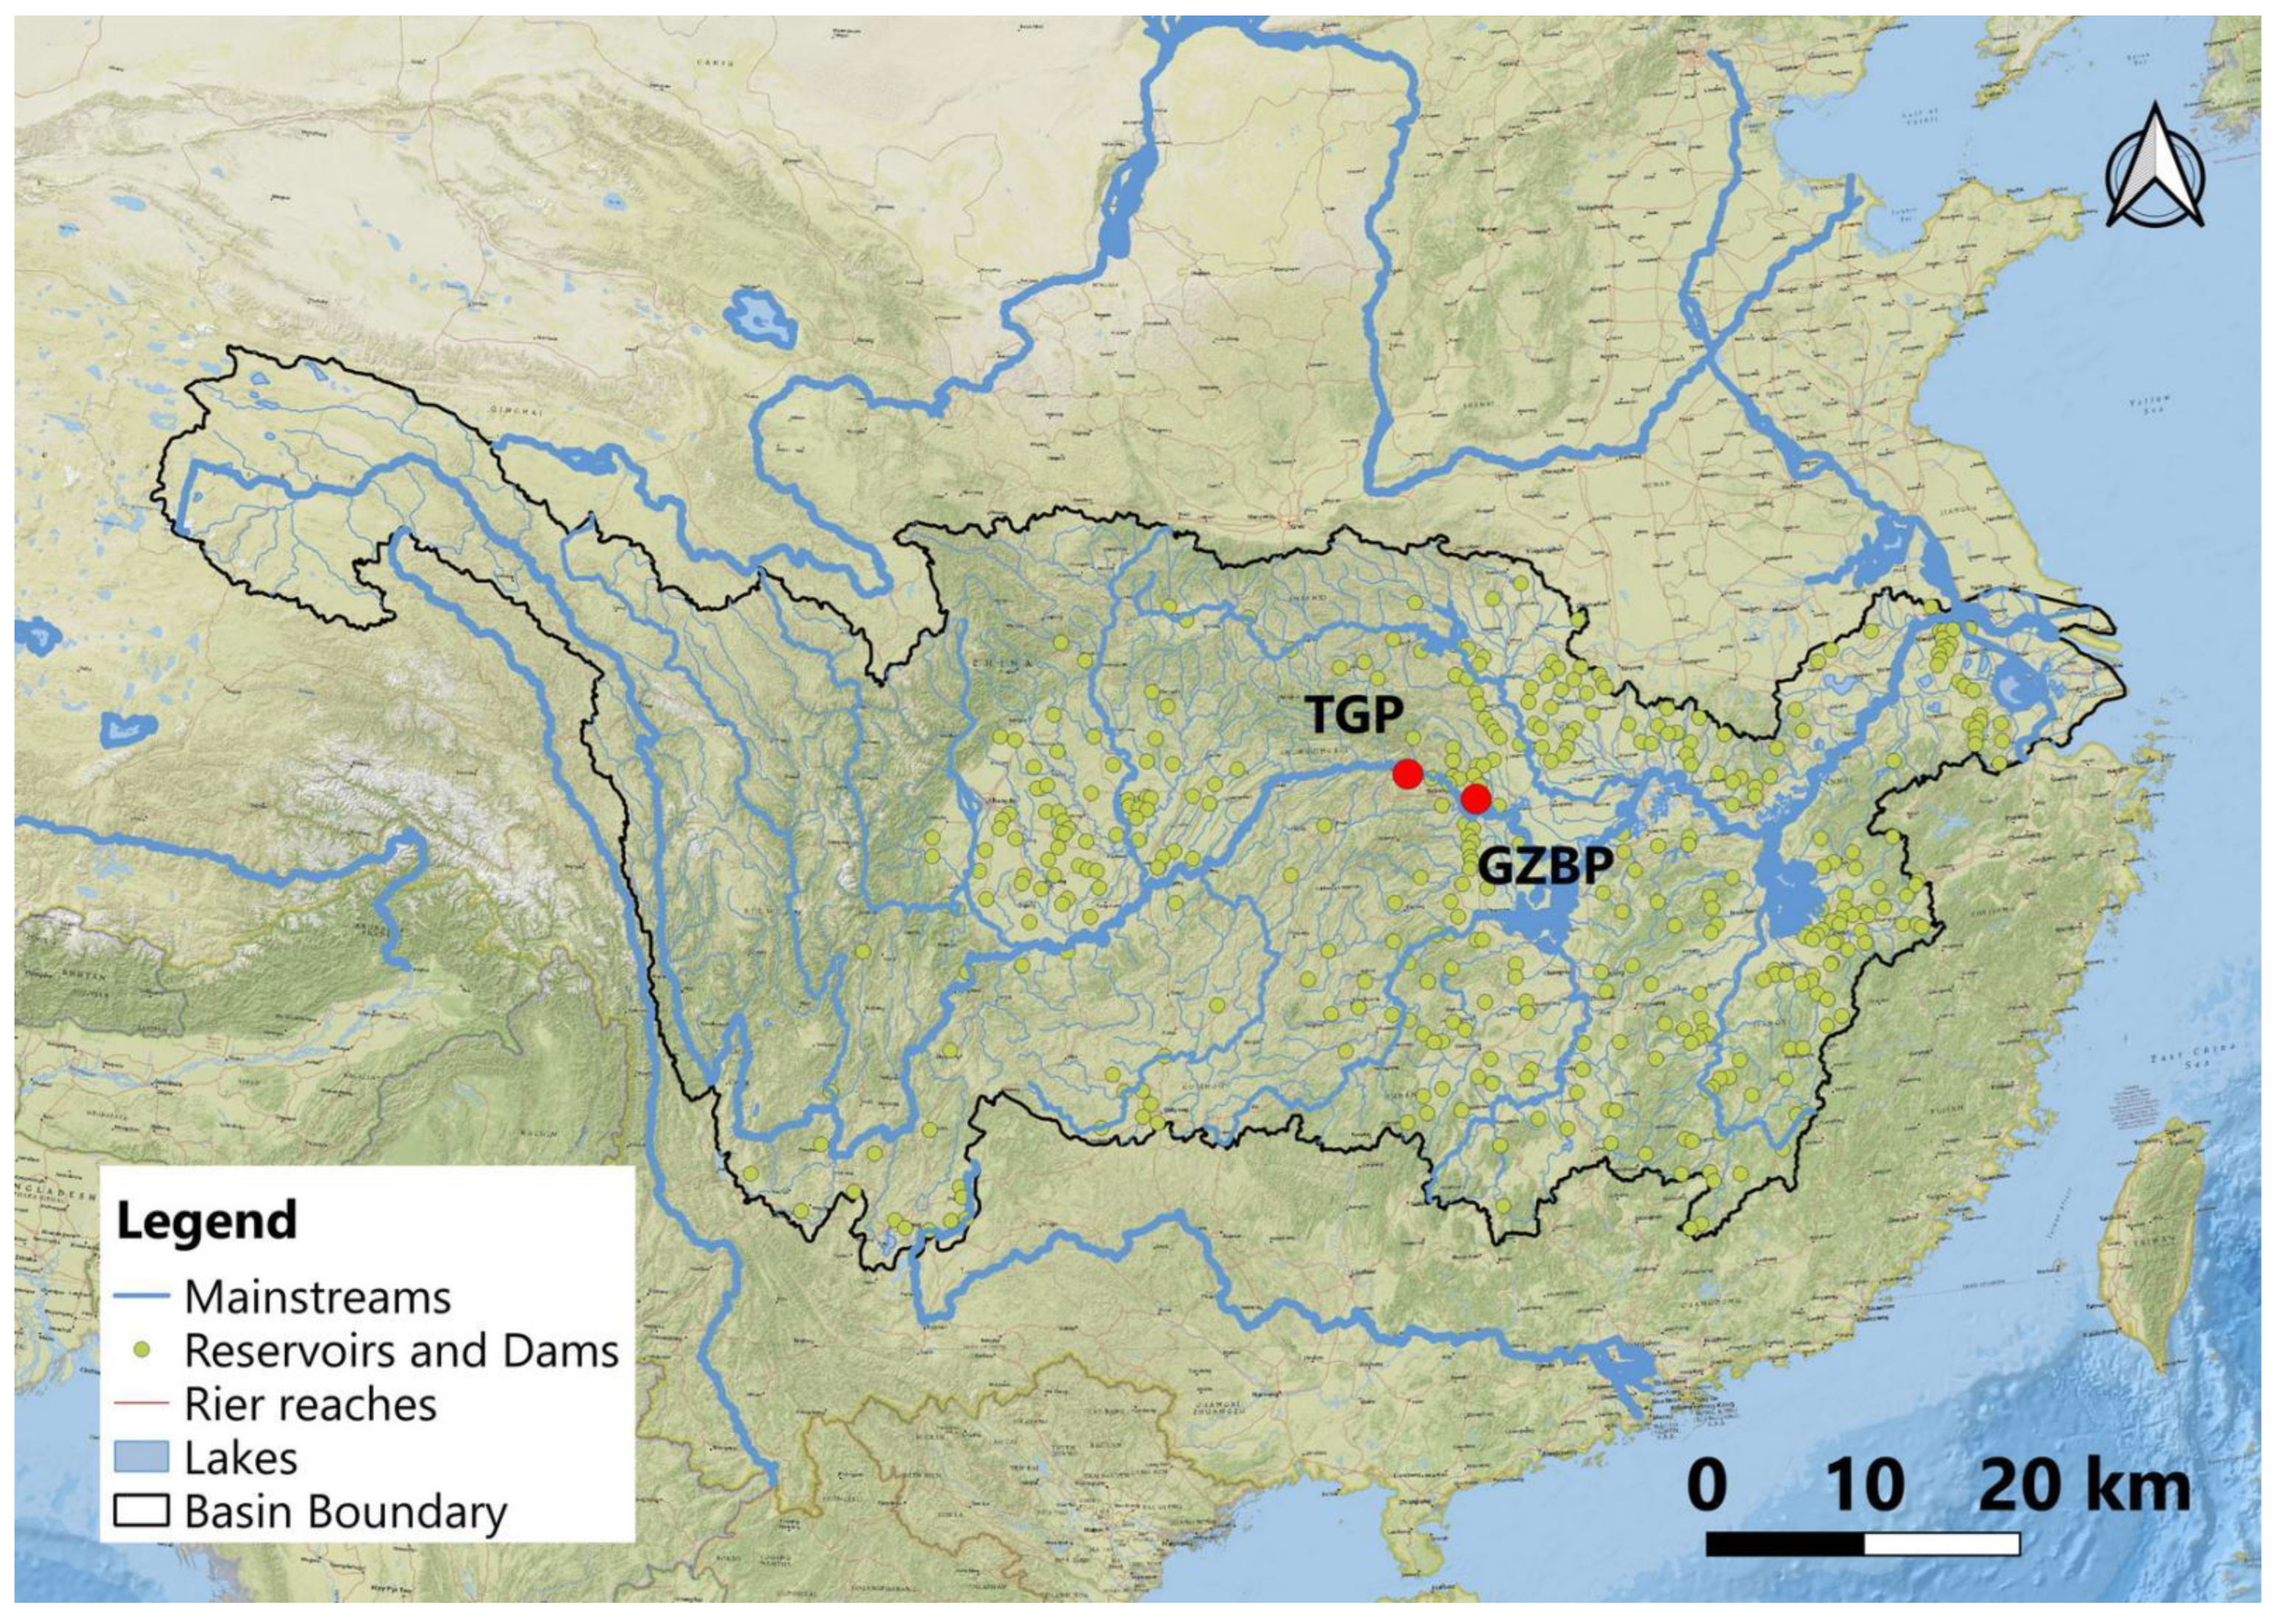
For under evaluation cascade dam projects, the target objects can be regarded as an entirety. Any elements or impacts of one project can be regarded as the entirety’s elements or impacts. As cascade dam projects in a basin might range from upstream to downstream, the nearest integrated dam project and re-regulated dam project were mainly considered in this study. Therefore, the evaluation period can be divided into several periods:
The first period is the predicative re-evaluation of planning dam projects. SBQ is used for the new DSP and EEM for the modified DSP to re-evaluate the predicative impacts of an individual dam project.
The second period is the post or review evaluation of a single dam project. SBQ is used for an existing project in modified DSP to evaluate the impacts of an individual dam project.
The third period is the post or review evaluation of cascade dam projects. Using SBQ for an existing project in modified DSP to evaluate the impacts of cascade dam projects.
For more than two cascaded projects, more periods need to be considered based on their contribution to joint operation.
2.2. Study Area
2.2.1. General Information
The study area is the Yangtze River basin in China (Figure 2). It is the world’s third longest river, with a length of 6300 km. The Yangtze River basin is a major development area for China, drains an area of 1.8 million km2, and has experienced rapid socioeconomic development in the past decades. There are more than 50,000 dams and reservoirs in the basin under the influence of both climate change and human activities. The basin is already home to 40% of the country’s total GDP. Most of the water use in the basin is for irrigation, primarily for water-intensive rice production. The dam project has made great contribution to water use. However, most of the dams are on the tributaries, the dams on the mainstream of the Yangtze River are mainly on the very upstream. The lowest two dam projects are GZBP and TGP.
Figure 2.
Yangtze river basin and cascade GZBP and TGP location.
GZBP is located in Yichang City of Hubei Province in China, 38 km away from the dam of TGP on the upstream of the Yangtze River. It is the first dam and first large-scale water control project on the mainstream of the Yangtze River, which started construction in 1970, generated in 1981, and finished construction in 1988. The project is the most downstream dam in the upper stream and water catching area is merely 1 million km2, which is about 56% of the Yangtze River basin area. It consists of two hydroelectric power stations with an installed capacity of 2715 MW, three navigation locks, and several sluice gates, some of which are used for accumulating water in dry seasons. There is a total storage capacity of 1.58 billion m3, and a maximum discharging capability of 110,000 m3/s.
TGP is on the upstream of the GZBP. It is the largest dam project in the world, which started construction in 1993, generated in 2003, and finished construction in 2015. The install capacity of TGP is 22,500 MW.
2.2.2. Temporal Limits
The main purpose of GZBP development is mainly for electricity, shipping, re-regulating, etc., while the main purpose of TGP development is flood control, electricity, shipping, and water replenishment. After TGP started generating in 2003, the two projects of TGP and GZBP started to operate in combination. Therefore, to identify the critical impacts of GZBP, the evaluation period was divided into three periods.
The first period is the natural period. Before 1981, there were no dam barriers on the mainstream of the Yangtze River, and the mainstream was free flowing. We need to predict and identify the main impacts of GZBP.
The second period is the individual dam period. From 1982 to 2002, there was only one dam barrier on the mainstream of the Yangtze River, GZBP was independently operated. We need to review the main impacts of GZBP in this period to identify the individual impacts of construction and operation.
The third period is the integrated operation period. Since 2003 until now, there are several dam barriers on the mainstream of the Yangtze River, GZBP, and TGP are the nearest two project in integrated operation. At the beginning, there were no other dam projects on the mainstream. Then, more and more cascade dam projects joined the cascade joint operation of the Yangtze River basin. Currently, there are six large dam projects on the mainstream of the Yangtze River, that are jointly operated.
2.2.3. Spatial Limits
The general spatial extent is mainly from the tail area of the TGP reservoir to the 80 km downstream below the GZBP dam. This spatial extent covered the main parts of GZBP and TGP, and the two dams are the boundary section of the concerned area, which is divided into three parts: upstream of the TGP dam, TGP dam to GZBP dam, and downstream of the GZBP dam. For some specific evaluation purpose such as basin context and biodiversity, the spatial scale extended to a wider range.
2.3. Data
The data sources are mainly peer-reviewed articles online from Web of Science, Google Scholar, China National Knowledge Infrastructure (CNKI), scientific reports, and files from official websites. These open source data were mainly used for providing answers evidence for SBQ and EEM.
Moreover, there are some basic data from preliminary investigation such as hydrological data, hydro-environment data, hydro-biological data, remote sensing, and Geographic Information System (GIS) data, etc., (Table 4). These basic data were mainly used for indirect analyzing to answer questions. For example, hydrological data analyzing was used for for Q_70 “Does the project changes any downstream monthly flows larger than 20%?”; land use data analyzing was used for Q_126 “Does agricultural landcover occupy at least 10% of area in upstream watershed above facility?”.
Table 4.
Data category and sources for evaluation.
For regional biological considerations, there was no natural barriers to fish migration in the downstream of project. For this cascade project, we chose protected fish in the “List of key protected wild animals in China (2021)” as species of concern. There are two fish species (Acipenser sinensis, Psephurus gladius) and two amphibian species (Lipotes vexillifer, Neophocaena asiaeorientalis) found adjacent to project waters. There are no invasive species found in project lands or waters [22].
3. Results and Discussion
We applied the modified DSP tools to cascade dam projects, representing three periods from new developed project, existing project, to cascade existing projects. Moreover, the results varied dramatically among predictive period and post period, and among individual project and cascade projects.
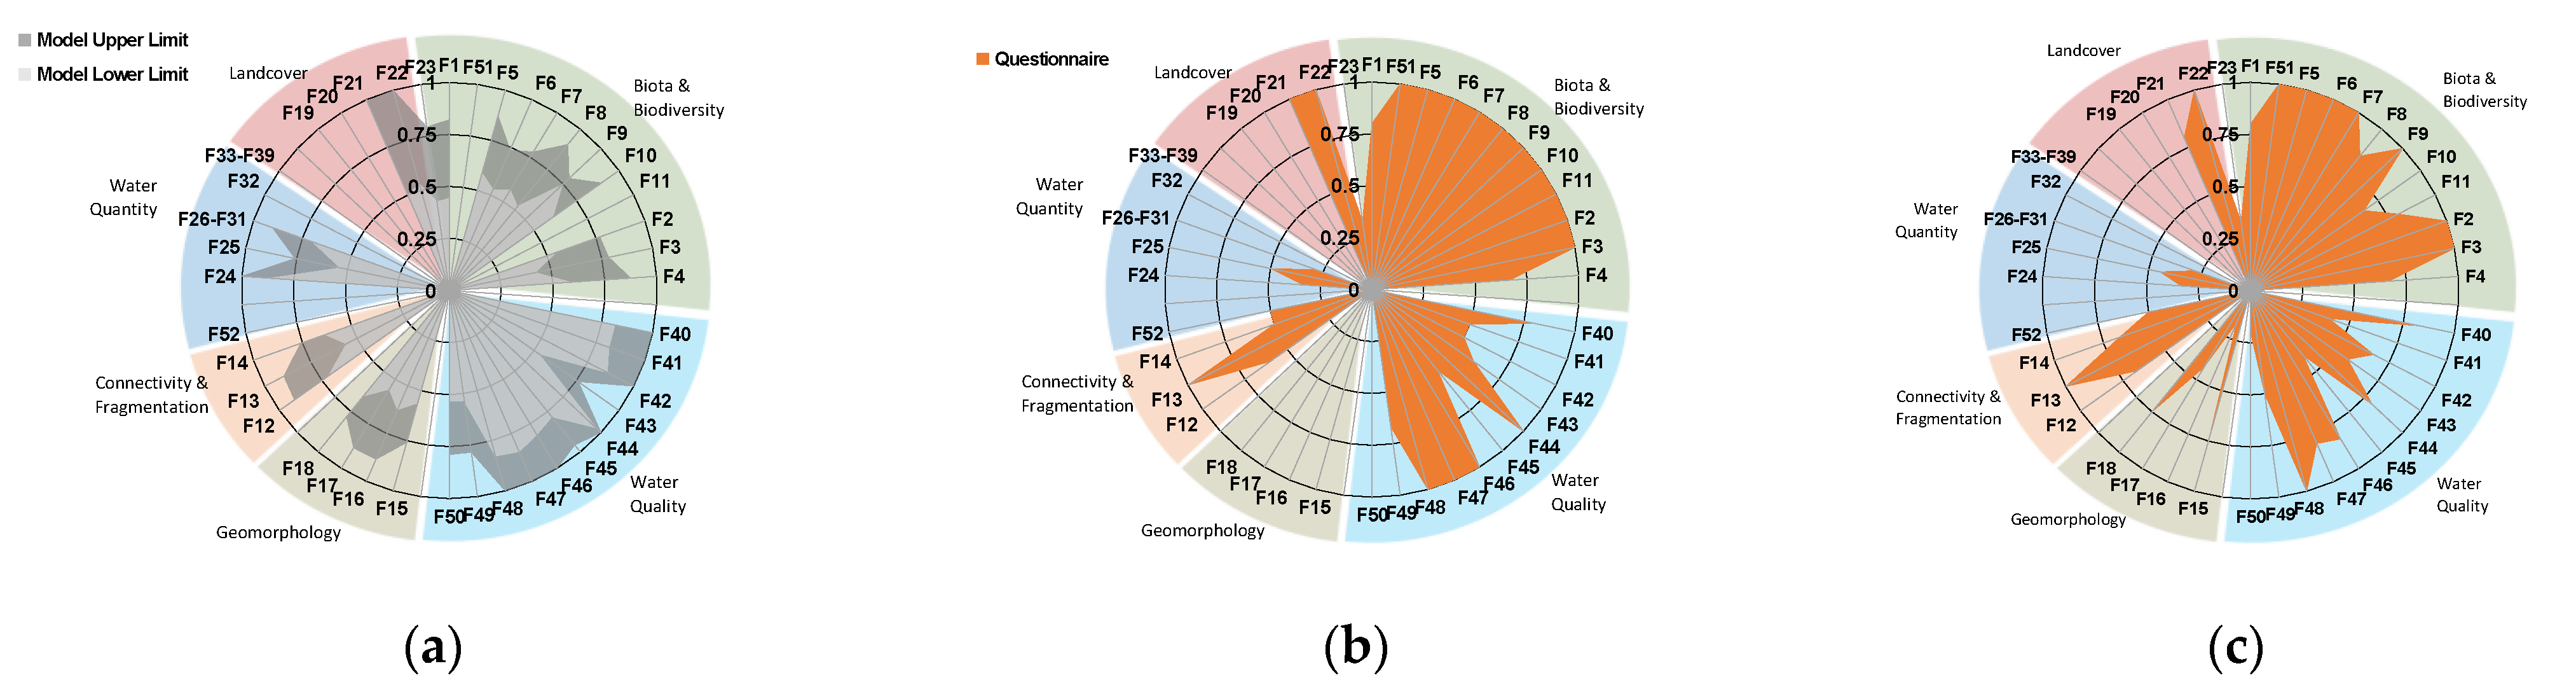
3.1. Impacts of Individual GZBP
The evidence of the EEM result and SBQ result associated with predictive GZBP showed major differences among different river function categories (Figure 3, details in Figures S1–S3). The EEM result displayed the impact ranges of possibility between 0.5 and 1, and the major impact of possibility was water quality, while the SBQ result displayed major impacts on biota and biodiversity. After post evaluation of GZBP using SBQ, the predictive SBQ for the new developed project was proven effective. The highest number of questions answered “yes” with evidence of affects by GZBP were 107 of 157 and 153 of 239 for predictive and post period, respectively.
Figure 3.
Spider diagram for GZBP (a) EEM result of new developed GZBP, (b) SBQ result of new developed GZBP, (c) and SBQ result of existing GZBP.
Because of the size of the project and extent of land assets, river functions with evidence of the impacts of construction and operations spanned multiple spatial scales and measures of terrestrial and aquatic taxonomic diversity (Figures S4–S7). In the predictive period, the basin scale functions were more estimated to be affected. However, project scale functions were more directly affected by construction or operations. The impacts on relevant specific taxonomic groups displayed obvious differences of water quality functions between predictive period and post period. Impacts on fish species were the main concern in post period.
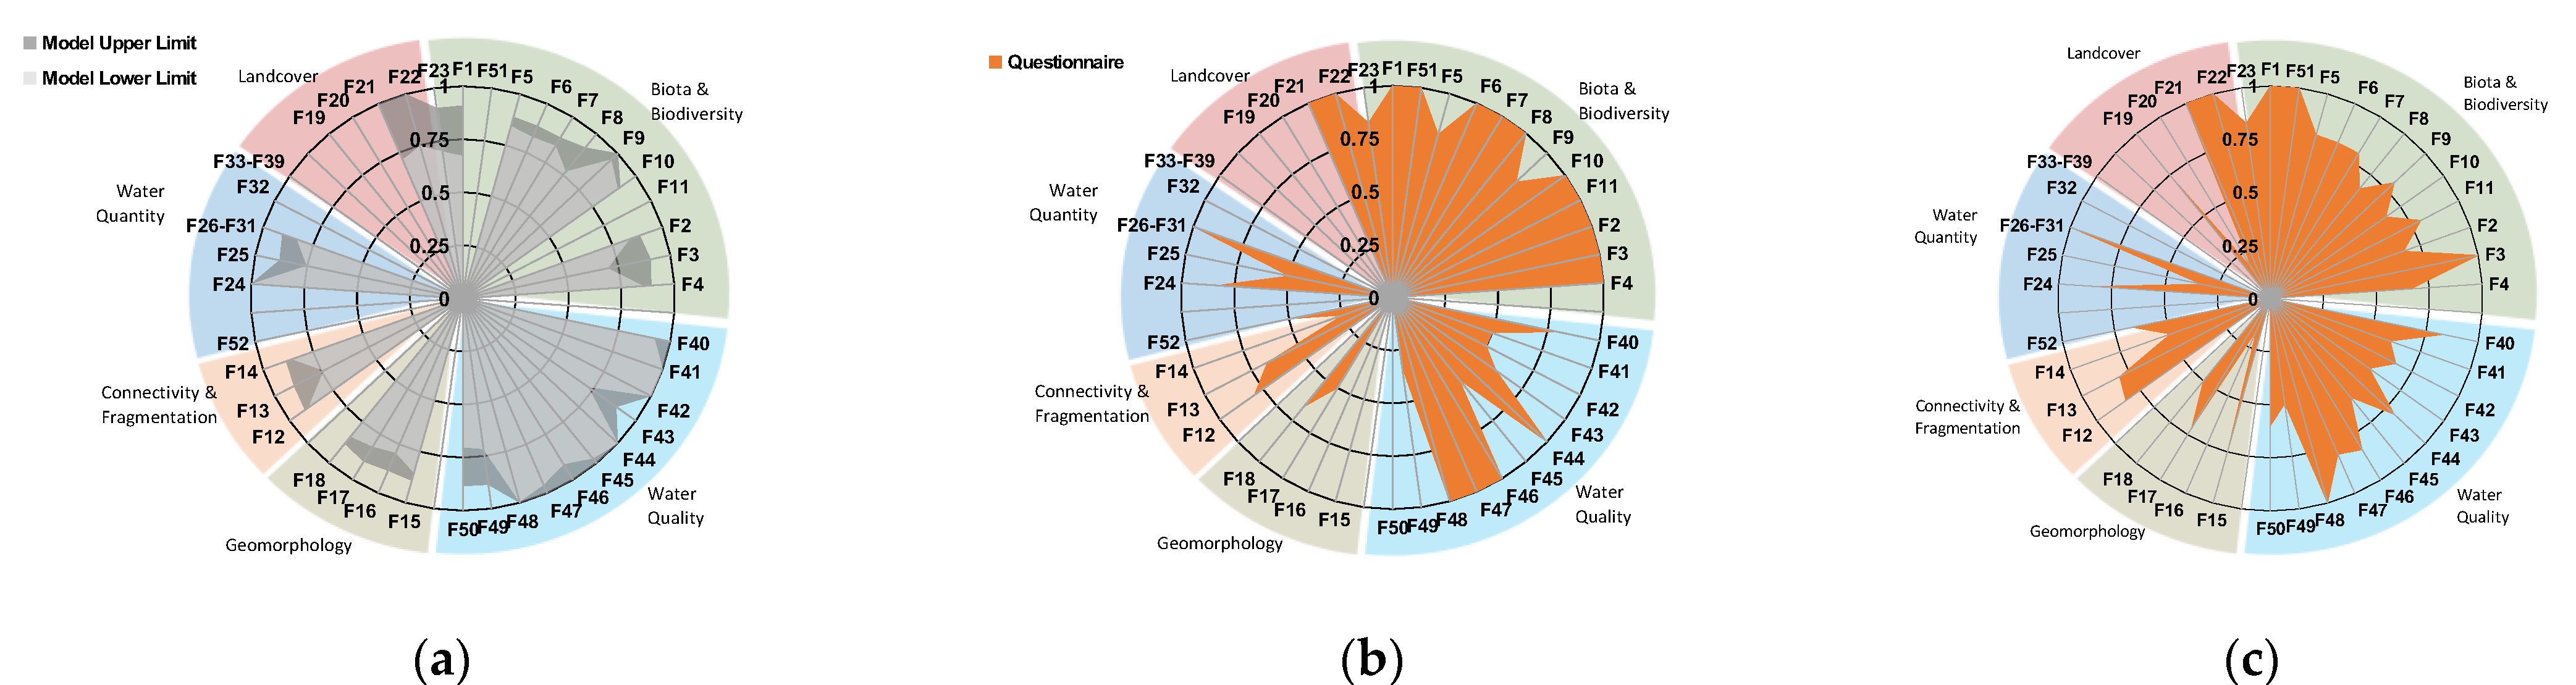
3.2. Impacts of Cascade GZBP and TGP
The evidence of the EEM result and SBQ result associated with predictive cascade GZBP and TGP showed major differences among different river function categories (Table S3. Figure 4, details in Supplementary Figures S8–S10). The EEM result displayed the impact ranges of possibility between 0.7 and 1, and the major impacts of possibility was water quality, while the SBQ result displayed major impacts on biota and biodiversity and water quality. After post evaluation of cascade GZBP and TGP using SBQ, the predictive SBQ for new developed projects was proven effective. The highest number of questions answered “yes” with evidence of affects by cascade GZBP and TGP were 120 of 157 and 167 of 239 for predictive and post period, respectively.
Figure 4.
Spider diagram for cascade GZBP and TGP, (a) EEM result of new developed cascade GZBP and TGP, (b) SBQ result of new developed cascade GZBP and TGP, (c) SBQ result of existing cascade GZBP and TGP.
Because of the size of the project and extent of land assets, river functions with evidence of the impacts of construction and operations spanned multiple spatial scales and measures of terrestrial and aquatic taxonomic diversity (Figures S11–S14). In the predictive period, the basin scale functions were more estimated to be affected. However, project scale functions were more directly affected by construction or operations. The impacts on relevant specific taxonomic groups displayed obvious differences of water quality functions between the predictive period and post period. Impacts on fish species were the main concern in post period.
3.3. River Function Linkages
We applied the modified RFLAT tool on GZBP and cascade GZBP and TGP. Information explained by various graphical network sizes were used to determine the optimal sizes of networks (Figure 5). Higher network complexity is expected for cascade GZBP and TGP based on the size of that cascade projects and number of environmental concerns. This linkage provided a sub-selection of relationships to consider when evaluating the most important river function indicators, and their relationships with other components of the river ecosystem.
Figure 5.
Application of the River Function Linkage Assessment Tool (RFLAT) (a) results of individual GZBP, (b) results of cascade GZBP and TGP.
The linkages of GZBP displayed that the impacted sequences of function categories were BB, WQ, CF, LC, HD, and GM, while the sequences of cascade GZBP and TGP were BB, HD, WQ, CF, LC, and GM. For individual GZBP, the relationships of BB, WQ, and LC function categories were obvious. For cascade GZBP and TGP, the relationships among BB, WQ, and CF, and among WQ, LC, and HD were obvious. To evaluate the impacts of cascade projects, there were some main function indicators to be concerned. In the biota and biodiversity category, we need to focus on F1, F51, F6, F7, F2, and F3. In the WQ category, we need to focus on F43, F 46, and F50. In the LC category, we need to focus on F20 and F21.
3.4. Optimization of Modified DSP Toolkit
The GZBP is located on the mainstream of the Yangtze River with multiple developments, while the TGP is 40 km on the upstream of GZBP. The GZBP construction was finished in 1988, thus the reservoir is relatively old. Moreover, the TGP construction and project acceptance was finished in 2020. Because of the long time span of the cascade projects, three periods were divided to separately evaluate the individual dam project and cascade dam projects. This is a new modification and innovation of the method that has not been proposed before. After this study, the modified DSP toolkit generally proved useful for applying in the study area. However, the different tools of the toolkit need to be optimized if used in China and other regions outside the U.S., because of too few parameter data in the current database. Moreover, if the toolkit is being used for cascade dam projects instead of an individual dam project, the higher complexity of cascade dam projects should be taken into consideration.
3.4.1. SBQ
SBQ provides a new way for stakeholders to make a decision through science-based questions. This method simplified the professional knowledge bases of stakeholders and bridged the gap between different aspects. From this study, we modified some questions to make it adapt to China’s reality. From the comparison of a new developed project and existing project, we found the similarity of predictive SBQ results and post SBQ results for both individual dam and cascade dams. However, because there were less questions for new developed dams, the proportion of “yes” for new developed dams might be larger than existing dams. We considered introducing a factor to balance the proportion evaluation result in a future study. Moreover, the cascade projects displayed a high number of river functions with evidence of effects. Setting a question to comprehensively describe the cascade dam projects was very difficult. The interaction between cascade dams was very complex, the current four spatial scales of questions need to be reconsidered especially for project scale and reservoir scale.
3.4.2. EEM
Parameters for generating EEM were mainly data from dams in the U.S., and it was not applicable for Chinese dams. There were 283 global dams’ data in the EEM, and 121 U.S. dams’ data, while only 5 Chinese dams’ data were in the EEM. According to China’s new investigation result of national dams and reservoirs, there were nearly 100,000 dams and reservoirs in 2021. The parameters of China’s dams need to be extended to provide a new envelop curve for determination. Moreover, a larger problem is that many parameters of dams were missing such as 153 blank (null) dam height data out of 283 and 89 blank (null) mean annual flow data out of 283. Though it is hard work, more participation and contribution of dams’ data and preliminary evaluation are in need (e.g., GRanD database).
3.4.3. RFLAT
This study provided a sub-category relationship of river functions to consider the river function linkages of under-evaluated dams and under-evaluated cascade dams. The methodology of RFLAT was not modified in this study, except the display form of the relationship. In the new “Circos” display graph instead of network type graph, the contributions of the function impacted by other functions were more clearly and easily identified.
4. Conclusions
Because of the size of the cascade projects and extent of land assets, river functions with evidence of the impacts of operations spanned multiple temporal and spatial scales. The majority of impacts were associated with the construction and operation of the original facility. The cascade GZBP and TGP are the most downstream dams on the mainstream of the Yangtze River. Moreover, the projects have no facilities located in close proximity up- or downstream. It is uncertain whether there is a free-flowing river habitat in the upstream or downstream of the project or between developments within the project. In the upstream basin, there are intense human activities that can influence hydrology and operations at the facility. Therefore, it is difficult to develop causal relationships between stress and ecosystem responses, which requires understanding interconnections among ecosystem components for the cascade projects. We introduced and modified the DSP to be used to isolate the most important hierarchical relationships among river function indicators, and to identify impacts of cascade projects in multiple periods. Moreover, the results varied dramatically among predictive period and post period, and among individual project and cascade projects. Though the modified DSP cannot replace large-scale assessments for dam projects, it can assist the EIA and PEIA process by identifying the most relevant environmental concerns and knowledge gaps at early stages of negotiation, so that more attention can be focused on subsequent studies and evaluative processes. When we applied the toolkit, some new limitations were found in the three tools:
- (1)
- In SBQ, because there were less questions for new developed dams, the proportion of “yes” for new developed dams might be larger than existing dams. We suggest introducing a factor to balance the proportion evaluation result in future study. Moreover, the cascade projects displayed a high number of river functions with evidence of effects. How to set the question to comprehensively described the cascade dam projects was very difficult. The interaction between cascade dams was very complex, the current four spatial scales of questions need to be reconsidered especially for project scale and reservoir scale;
- (2)
- In EEM, parameters for generating EEM were mainly data from dams in the U.S., and were not applicable for dams in other areas. Moreover, a larger problem is many parameters of dams were missing. We suggest more participation and contribution of dams’ data such as GRanD database;
- (3)
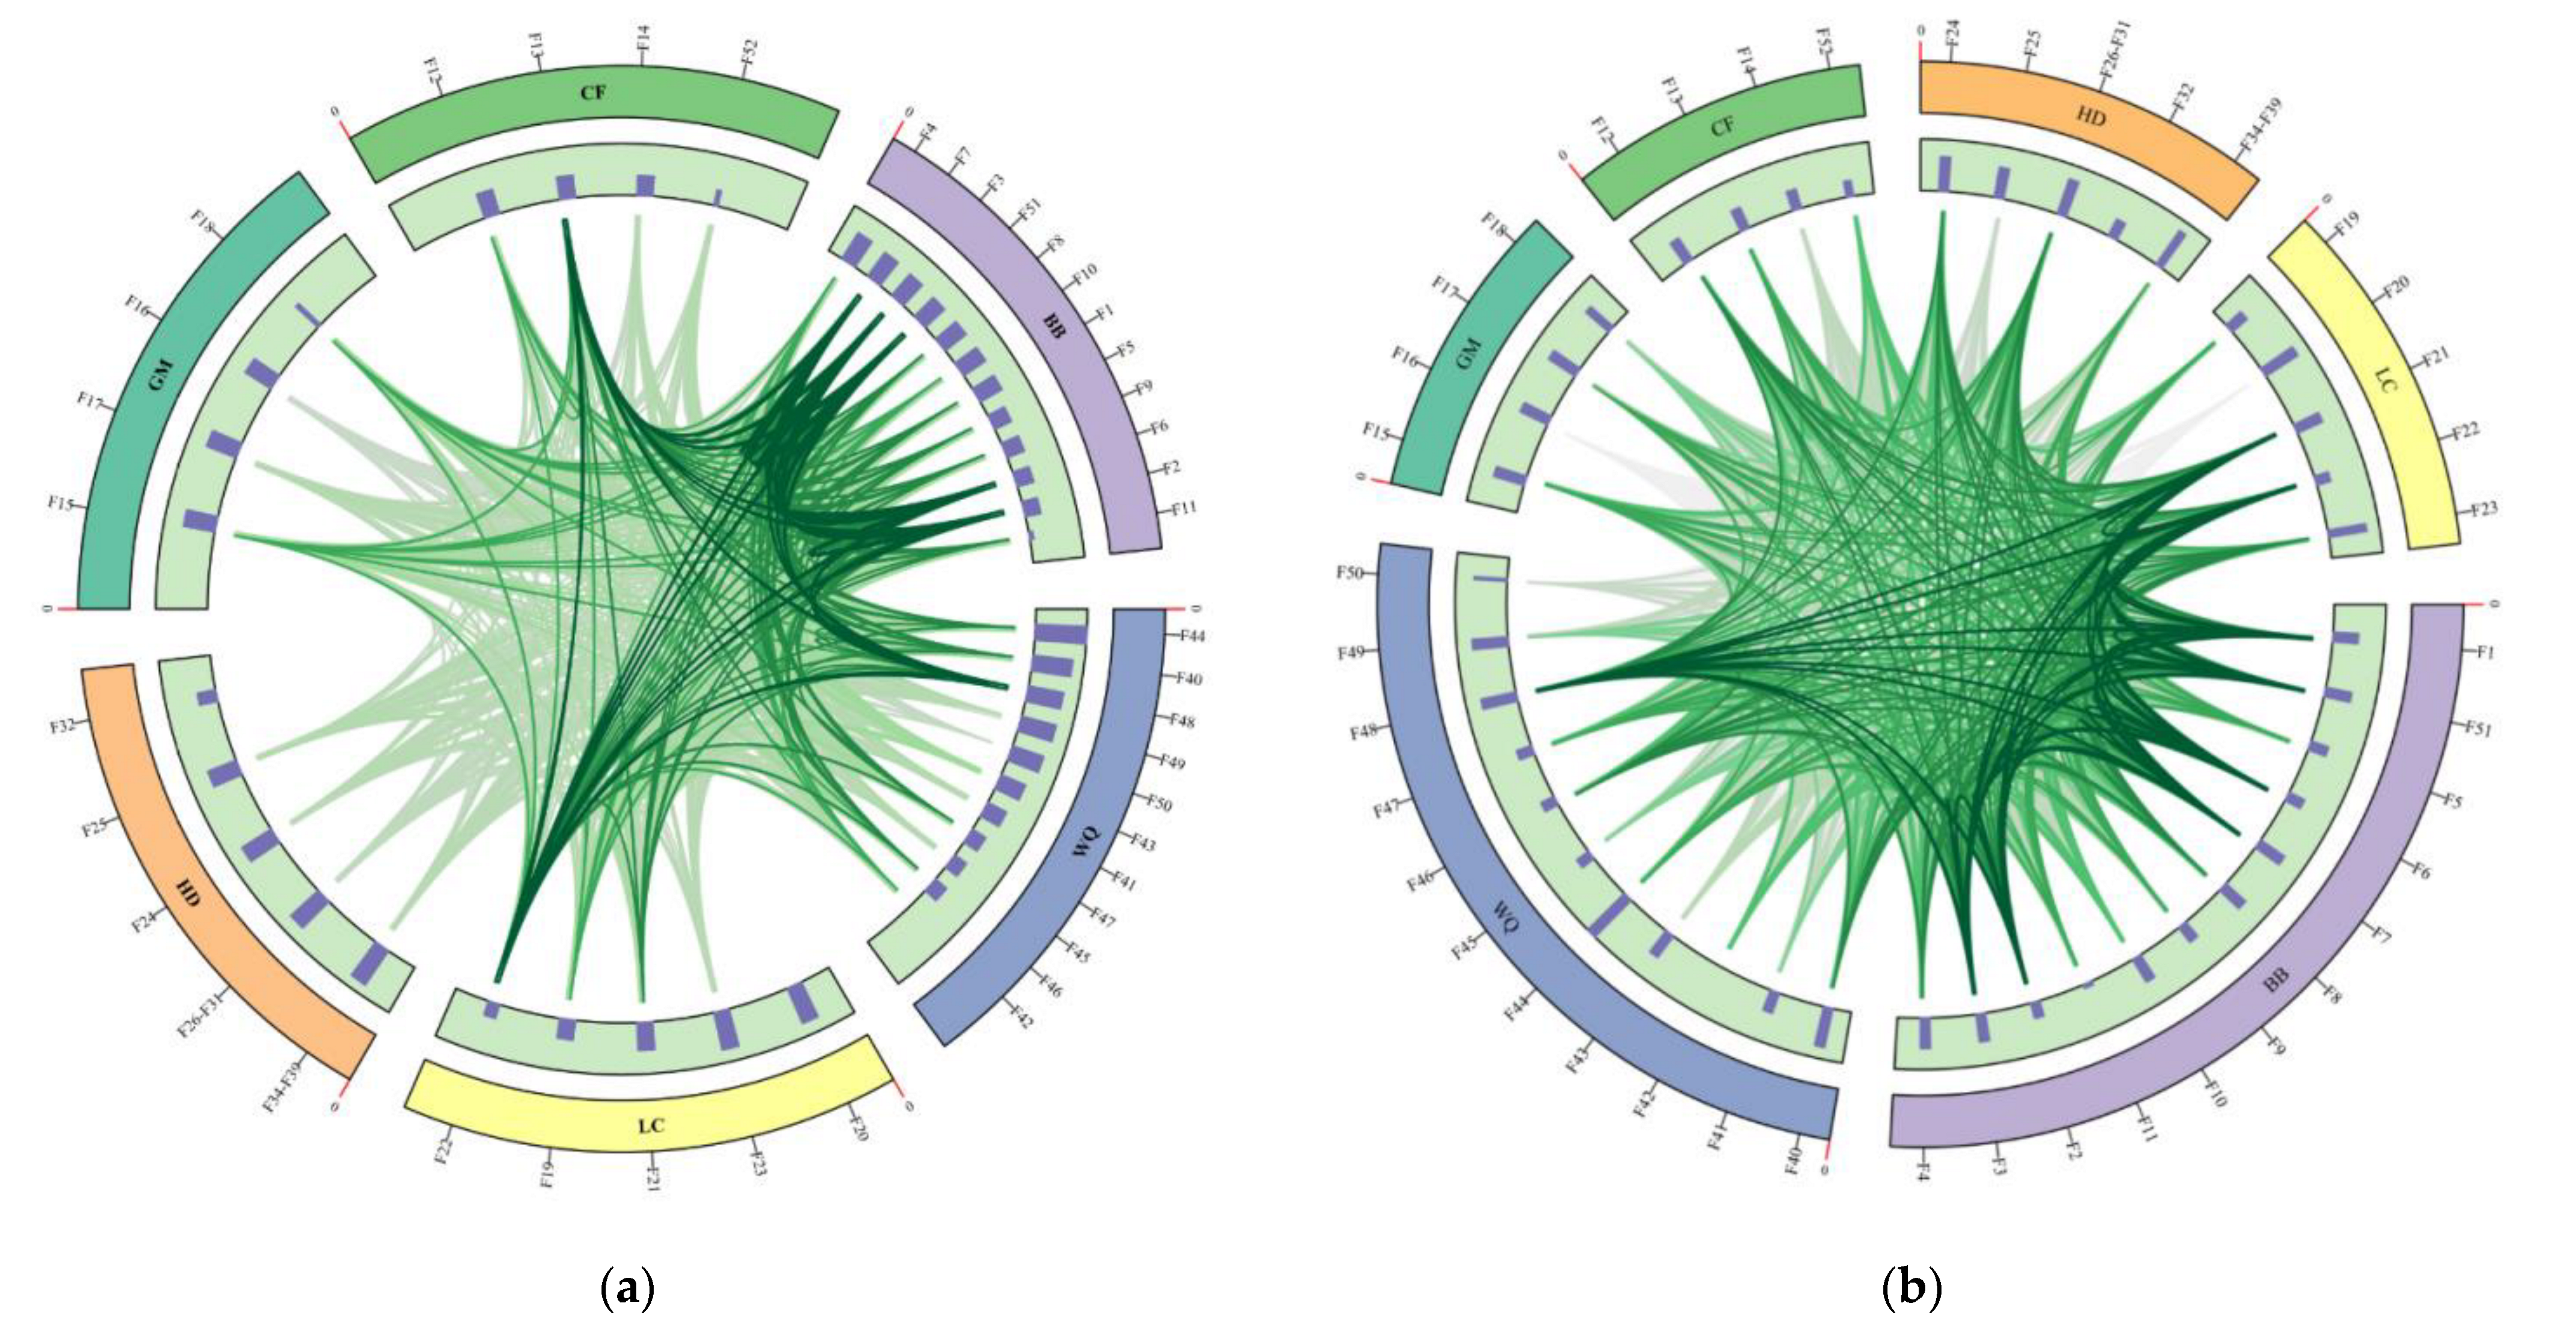
- In RFLAT, the new “Circos” display graph instead of network type graph was clearer and easier for users to identify the main functions being impacted.
5. Ethical Statement
The authors declare that:
(1) They have no known competing financial interests or personal relationships that could have appeared to influence the work reported in this paper;
(2) This paper has not been published in whole or in part elsewhere;
(3) This paper is not currently being considered for publication in another journal;
(4) All authors have been personally and actively involved in substantive work leading to the manuscript, and will hold themselves jointly and individually responsible for its content.
Supplementary Materials
The following supporting information can be downloaded at: https://www.mdpi.com/article/10.3390/w14162572/s1, Figure S1: Predictive EEM ranges of new developed GZBP; Figure S2: The proportion of questions answered “yes”, “no”, or “uncertain” relative to different river functions for new developed GZBP: The proportion of questions answered “yes”, “no”, or “uncertain” relative to different river functions for existing GZBP; Figure S4: The proportion of questions answered “yes” according to different river functions that are relevant to specific spatial scales for new developed GZBP; Figure S5: The proportion of questions answered “yes” according to different river functions that are relevant to specific spatial scales for existing GZBP; Figure S6: The proportion of questions answered “yes” according to different river functions that are relevant to specific taxonomic groups for new developed GZBP; Figure S7: The proportion of questions answered “yes” according to different river functions that are relevant to specific taxonomic groups for new developed GZBP; Figure S8: Predictive EEM ranges of new developed cascade GZBP&TGP; Figure S9: The proportion of questions answered “yes”, “no”, or “uncertain” relative to different river functions for new developed cascade GZBP&TGP; Figure S10: The proportion of questions answered “yes”, “no”, or “uncertain” relative to different river functions for existing cascade GZBP&TGP; Figure S11: The proportion of questions answered “yes” according to different river functions that are relevant to specific spatial scales for new developed cascade GZBP&TGP; Figure S12: The proportion of questions answered “yes” according to different river functions that are relevant to specific spatial scales for existing cascade GZBP&TGP; Figure S13: The proportion of questions answered “yes” according to different river functions that are relevant to specific taxonomic groups for new developed cascade GZBP&TGP; Figure S14: The proportion of questions answered “yes” according to different river functions that are relevant to specific taxonomic groups for new developed cascade GZBP&TGP; Table S1: River function indicators used to develop the science-based questionnaire presented in this paper; Table S2: Science-based questions (SBQ) provided to evaluate potential effects of dams on river functions; Table S3: Environmental-envelop model answers for GZBP and cascade GZBP&TGP.
Author Contributions
Conceptualization, A.C. and M.W.; methodology, A.C.; software, M.W.; validation, A.C. and M.W.; writing—original draft preparation, A.C.; writing—review and editing, M.W. All authors have read and agreed to the published version of the manuscript.
Funding
This research received no external funding.
Institutional Review Board Statement
Not applicable.
Informed Consent Statement
Not applicable.
Data Availability Statement
Not applicable.
Conflicts of Interest
The authors declare no conflict of interest.
References
- Lijie, S.; Dongxiao, N.; Keke, W.; Xiaomin, X. Sustainable development pathways of hydropower in China: Interdisciplinary qualitative analysis and scenario-based system dynamics quantitative modeling. J. Clean. Prod. 2021, 287, 125528. [Google Scholar]
- Miao, W.; Ang, C.; Xingnan, Z.; Michael, E.M. A Comment on Chinese Policies to Avoid Negative Impacts on River Ecosystems by Hydropower Projects. Water 2020, 12, 869. [Google Scholar]
- Ang, C.; Miao, W.; Sainan, W.; Xin, S.; Jingya, W.; Pengyuan, W.; Lin, C.; Guy, R.L.; Chunna, L.; Wanlin, J. Bridging gaps between environmental flows theory and practices in China. Water Sci. Eng. 2019, 12, 284–292. [Google Scholar]
- Enríquez-de-Salamanca, Á. Project justification and EIA: Anything goes? EIA Rev. 2021, 87, 106540. [Google Scholar] [CrossRef]
- Schramm, M.P.; Bevelhimer, M.S.; DeRolph, C.R. A synthesis of environmental and recreational mitigation requirements at hydropower projects in the United States. Environ. Sci. Policy 2016, 61, 87–96. [Google Scholar] [CrossRef]
- Ang, C.; Miao, W.; Kaiqi, C.; Zhiyu, S.; Chen, S.; Pengyuan, W. Main issues in research and practice of environmental protection for water conservancy and hydropower projects in China. Water Sci. Eng. 2016, 9, 312–323. [Google Scholar]
- Ang, C.; Miao, W. Managing for Sustainability: The Development of Environmental Flows Implementation in China. Water 2019, 11, 433. [Google Scholar]
- Gbadebo, A.O.; Joseph, W.; William, T.; Adam, W.; Miles, M.; Patrick, O. Costs of mitigating the environmental impacts of hydropower projects in the United States. Renew. Sustain. Energy Rev. 2021, 135, 110121. [Google Scholar]
- Ang, C.; Miao, W.; Michael, E.M. Classifying Dams for Environmental Flow Implementation in China. Sustainability 2020, 12, 107. [Google Scholar]
- Ang, C.; Xin, S.; Dongsheng, W.; Wengen, L.; Huaifeng, G.; Jie, T. Landscape and avifauna changes as an indicator of Yellow River Delta Wetland restoration. Ecol. Eng. 2016, 86, 162–173. [Google Scholar]
- Ang, C.; Jingya, W.; Miao, W.; Pengyuan, W. Review of global and China’s policies on fish passages. Water Policy 2019, 21, 708–721. [Google Scholar]
- Uría-Martínez, R.; Johnson, M.M.; Shan, R. Challenges in the post-licensing stage of U.S. hydropower development: Current status and some potential solutions. Electr. J. 2020, 33, 106729. [Google Scholar] [CrossRef]
- Tahseen, S.; Karney, B.W. Reviewing and critiquing published approaches to the sustainability assessment of hydropower. Renew. Sustain. Energy Rev. 2017, 67, 225–234. [Google Scholar] [CrossRef]
- Briones-Hidrovo, A.; Uche, J.; Martínez-Gracia, A. Hydropower and environmental sustainability: A holistic assessment using multiple biophysical indicators. Ecol. Indic. 2021, 127, 107748. [Google Scholar] [CrossRef]
- Conglin, Z.; Shaofeng, C.; Haijuan, Q.; Leihua, D.; Zhou, H.; Chuanqi, O. Small hydropower sustainability evaluation for the countries along the Belt and Road. Environ. Dev. 2020, 34, 100528. [Google Scholar]
- Esther, S.P.; Brenda, M.P.; Ryan, A.M.; Shelaine, L.C.; Christopher, R.D.; Brennan, T.S. Review of environmental metrics used across multiple sectors and geographies to evaluate the effects of hydropower development. Appl. Energ. 2019, 238, 101–118. [Google Scholar]
- Ryan, A.M.; Esther, S.P.; Christopher, R.D.; Adam, M.W.; William, L.G.; Alicia, B. Evidence-based indicator approach to guide preliminary environmental impact assessments of hydropower development. J. Environ. Manag. 2020, 265, 110489. [Google Scholar]
- Brenda, M.P.; Ryan, A.M.; Esther, S.P.; Shelaine, L.C.; Brennan, T.S.; Christopher, R.D.; Adam, M.W.; Shannon, A.; Mary, B.D.; Will, G.; et al. A Checklist of River Function Indicators for hydropower ecological assessment. Sci. Total Environ. 2019, 687, 1245–1260. [Google Scholar]
- Norris, R.H.; Webb, J.A.; Nichols, S.J.; Stewardson, M.J.; Harrison, E.T. Analyzing cause and effect in environmental assessments: Using weighted evidence from the literature. Freshw. Sci. 2012, 31, 5–21. [Google Scholar] [CrossRef]
- Boyan, L.; Nengcheng, C.; Wei, W.; Chao, W.; Schmitt, R.J.P.; Anwen, L.; Gretchen, C.D. Eco-environmental impacts of dams in the Yangtze River Basin, China. Sci. Total Environ. 2021, 774, 145743. [Google Scholar]
- Jorge, S.; Elsa, R.N.; Luís, C.S. Introduction to Data Envelopment Analysis. In Efficiency Measures in the Agricultural Sector; Mendes, A.L.D.G., Soares da Silva, E., Azevedo Santos, J., Eds.; Springer: Dordrecht, The Netherlands, 2013. [Google Scholar] [CrossRef]
- Zhenli, H. Biodiversity conservation for the Three Gorges Project. Biodivers. Sci. 2001, 9, 472. [Google Scholar] [CrossRef]
Publisher’s Note: MDPI stays neutral with regard to jurisdictional claims in published maps and institutional affiliations. |
© 2022 by the authors. Licensee MDPI, Basel, Switzerland. This article is an open access article distributed under the terms and conditions of the Creative Commons Attribution (CC BY) license (https://creativecommons.org/licenses/by/4.0/).


