
Monitoring and Analysis of Drought Characteristics Based on Climate Change in Burundi Using Standardized Precipitation Evapotranspiration Index


Abstract
:1. Introduction
2. Materials
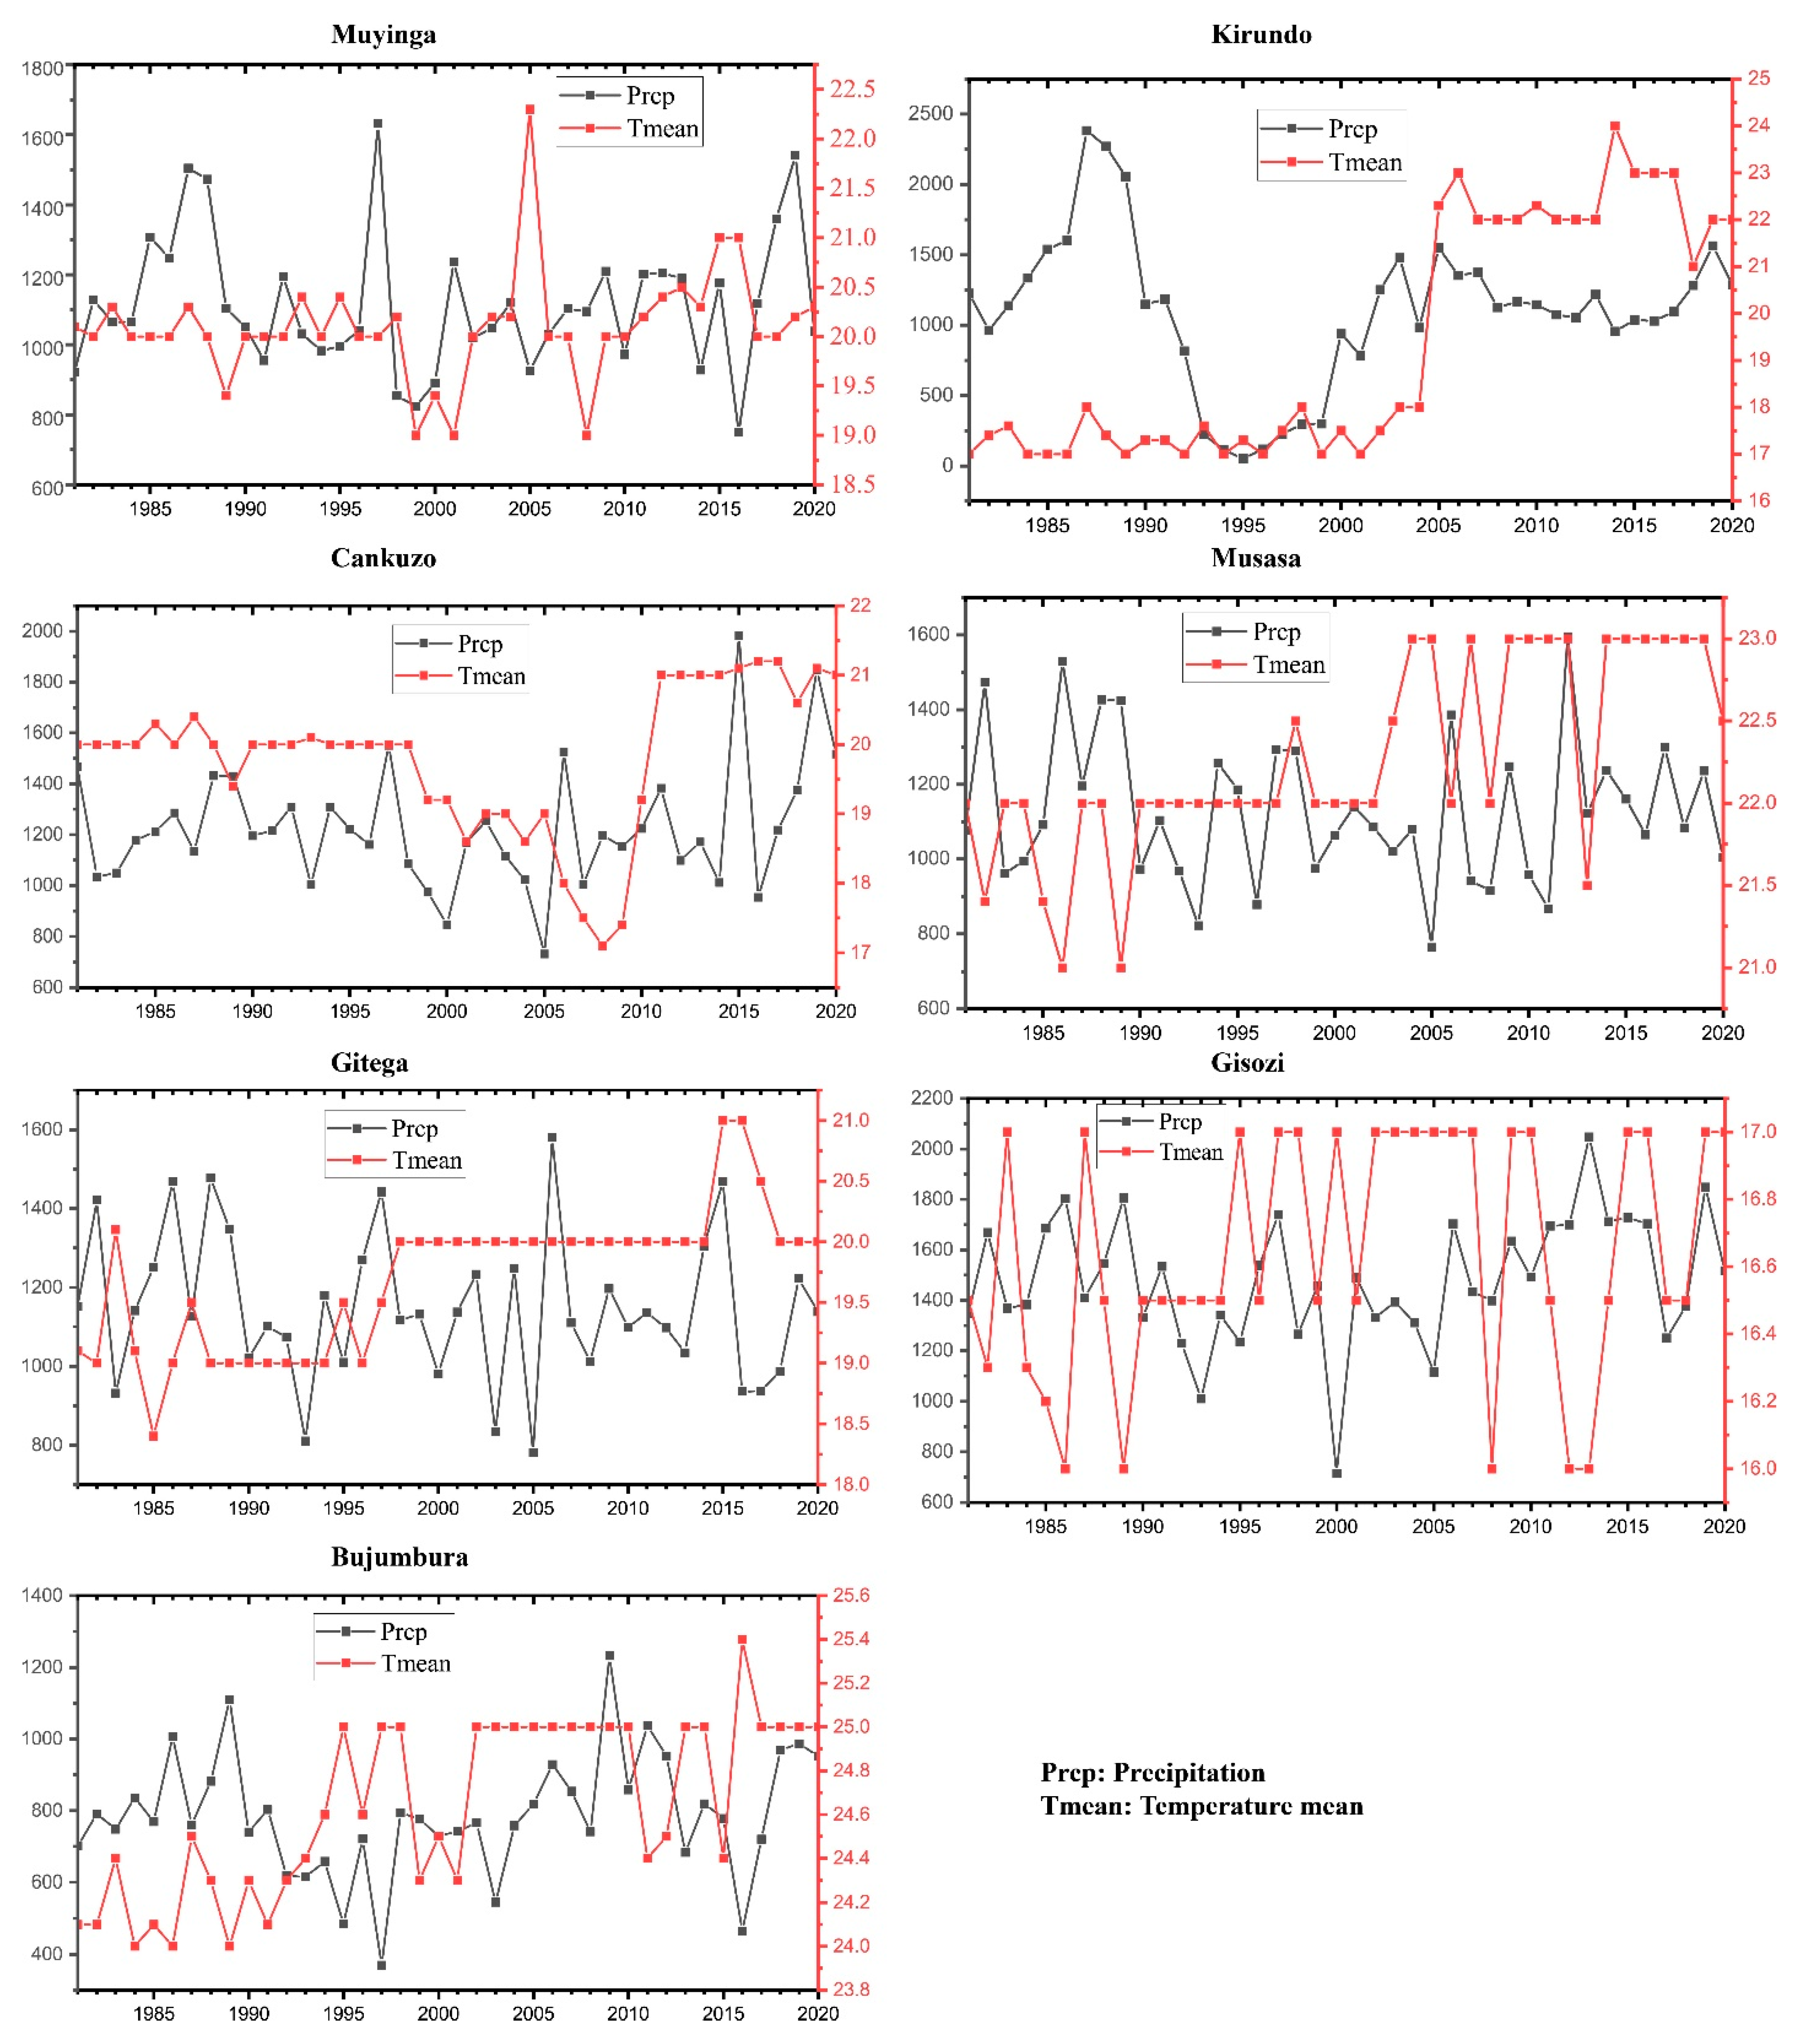
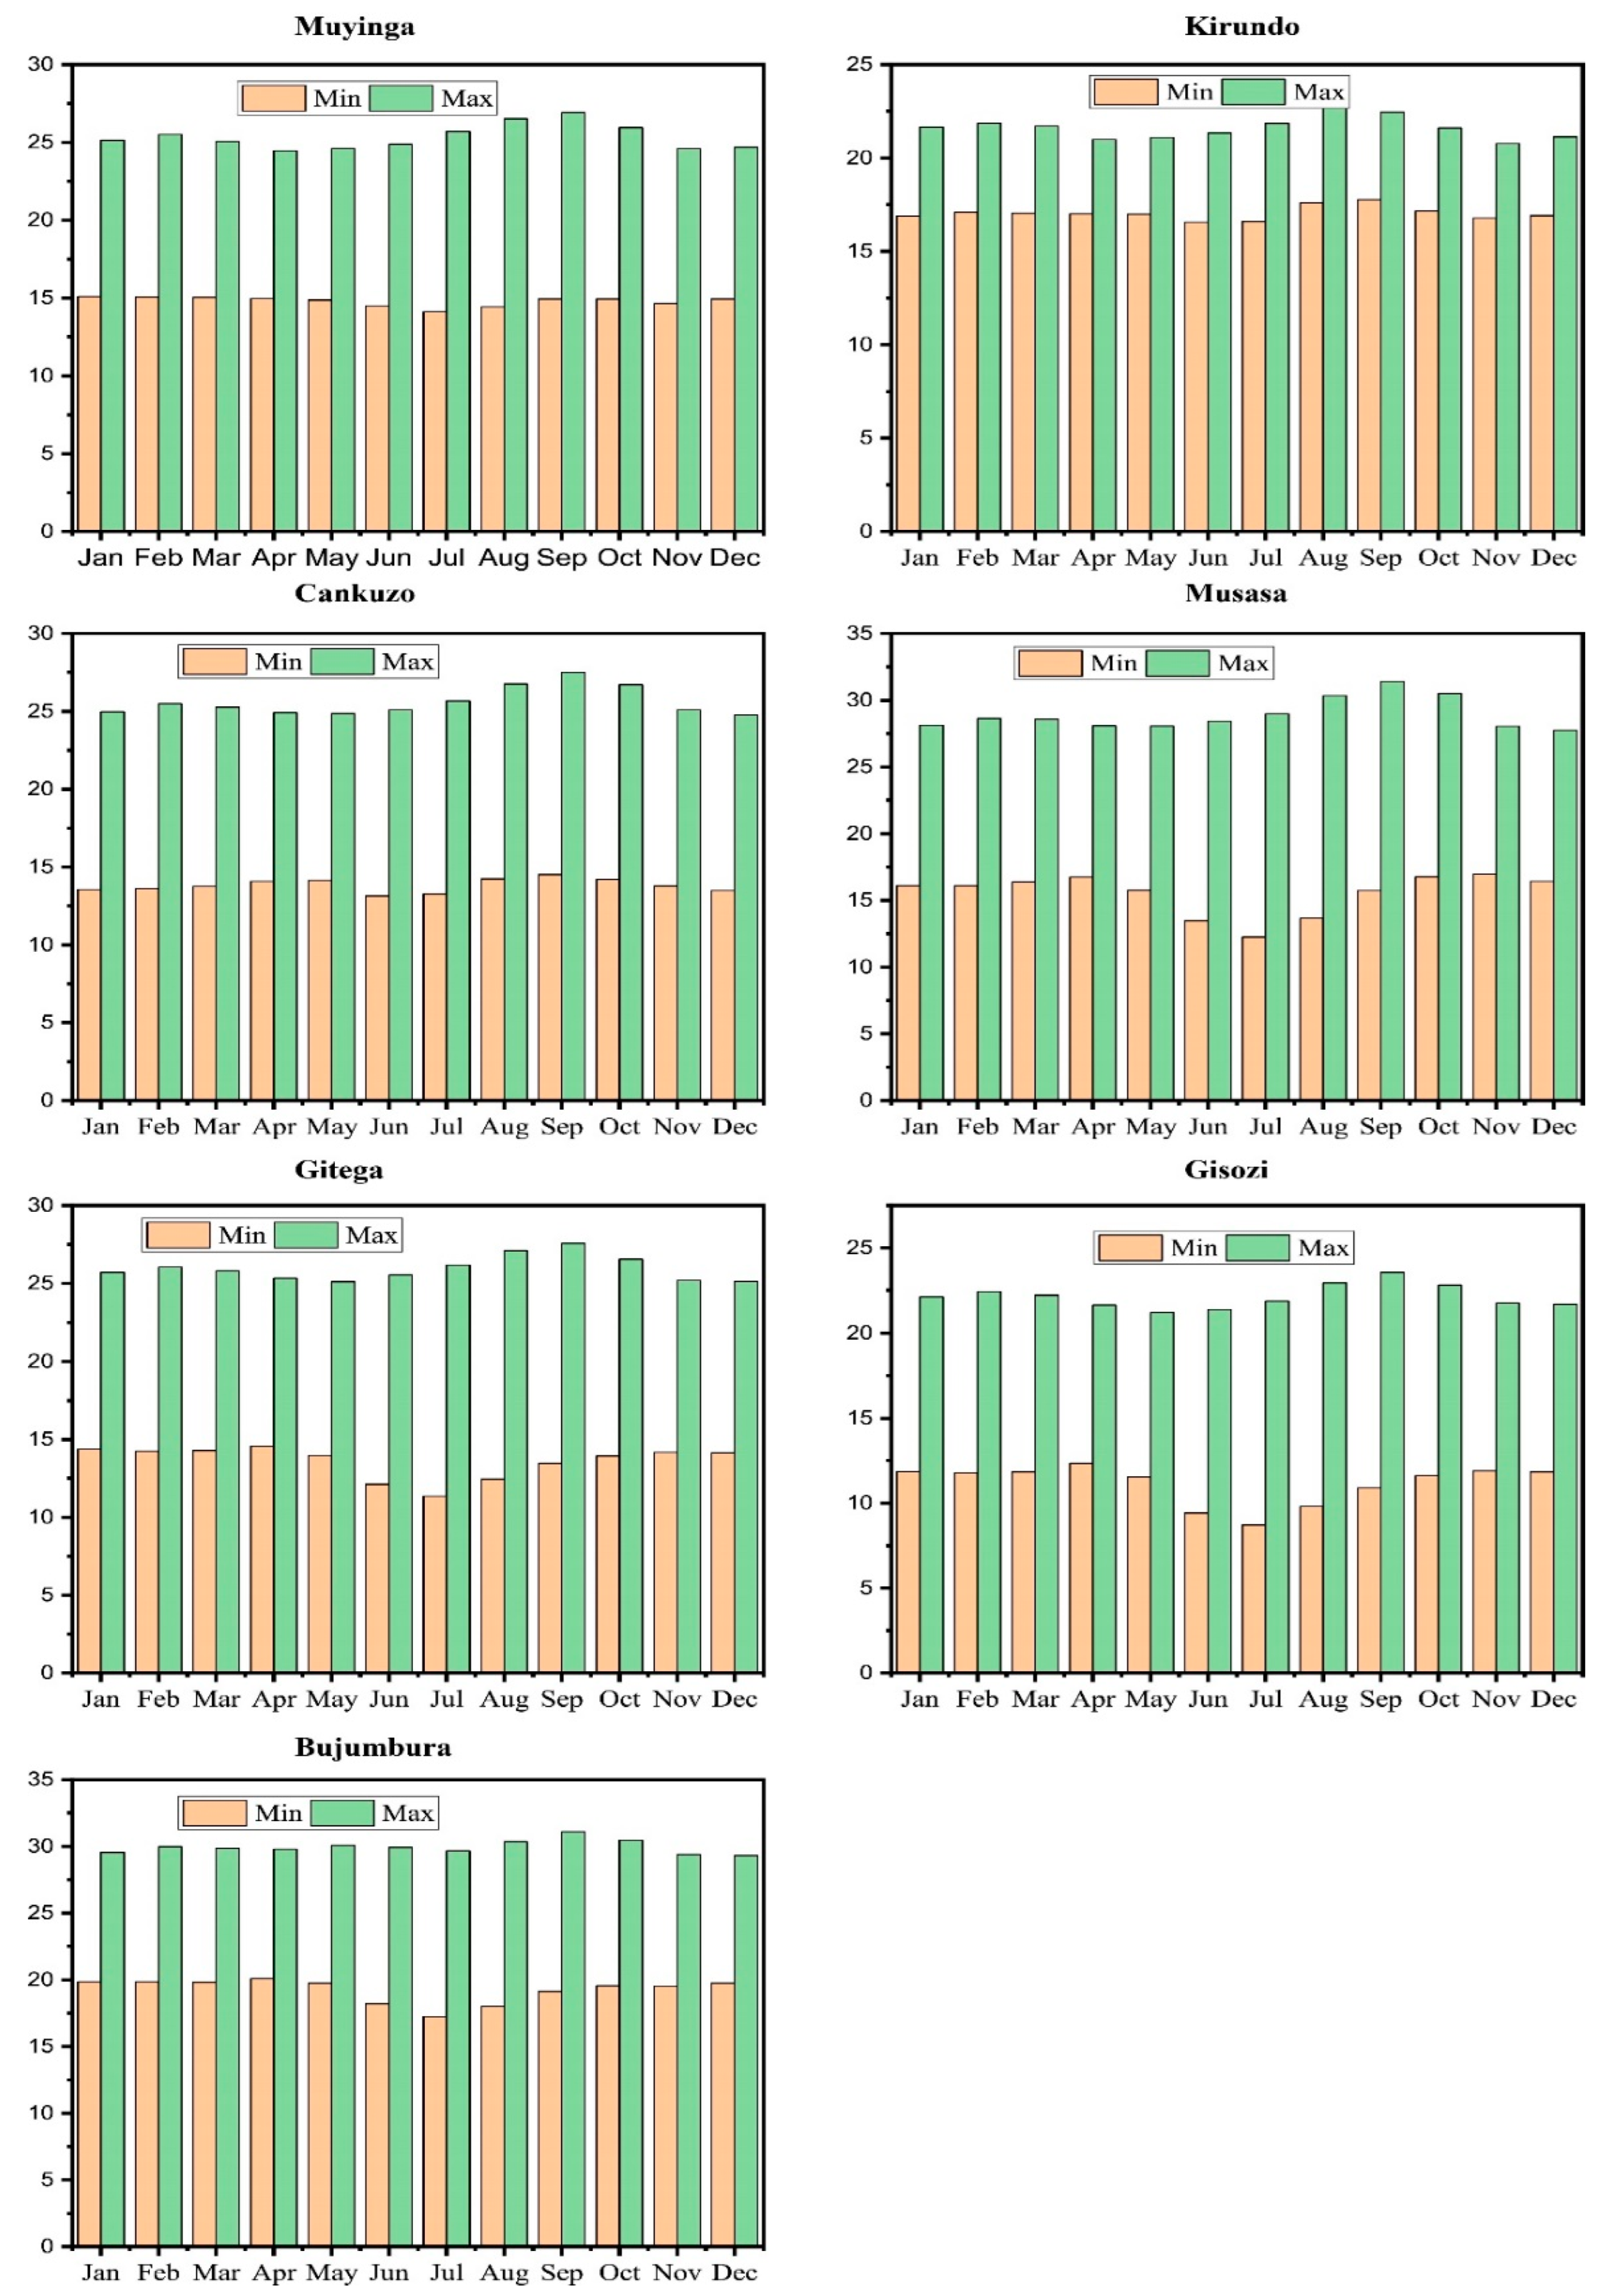
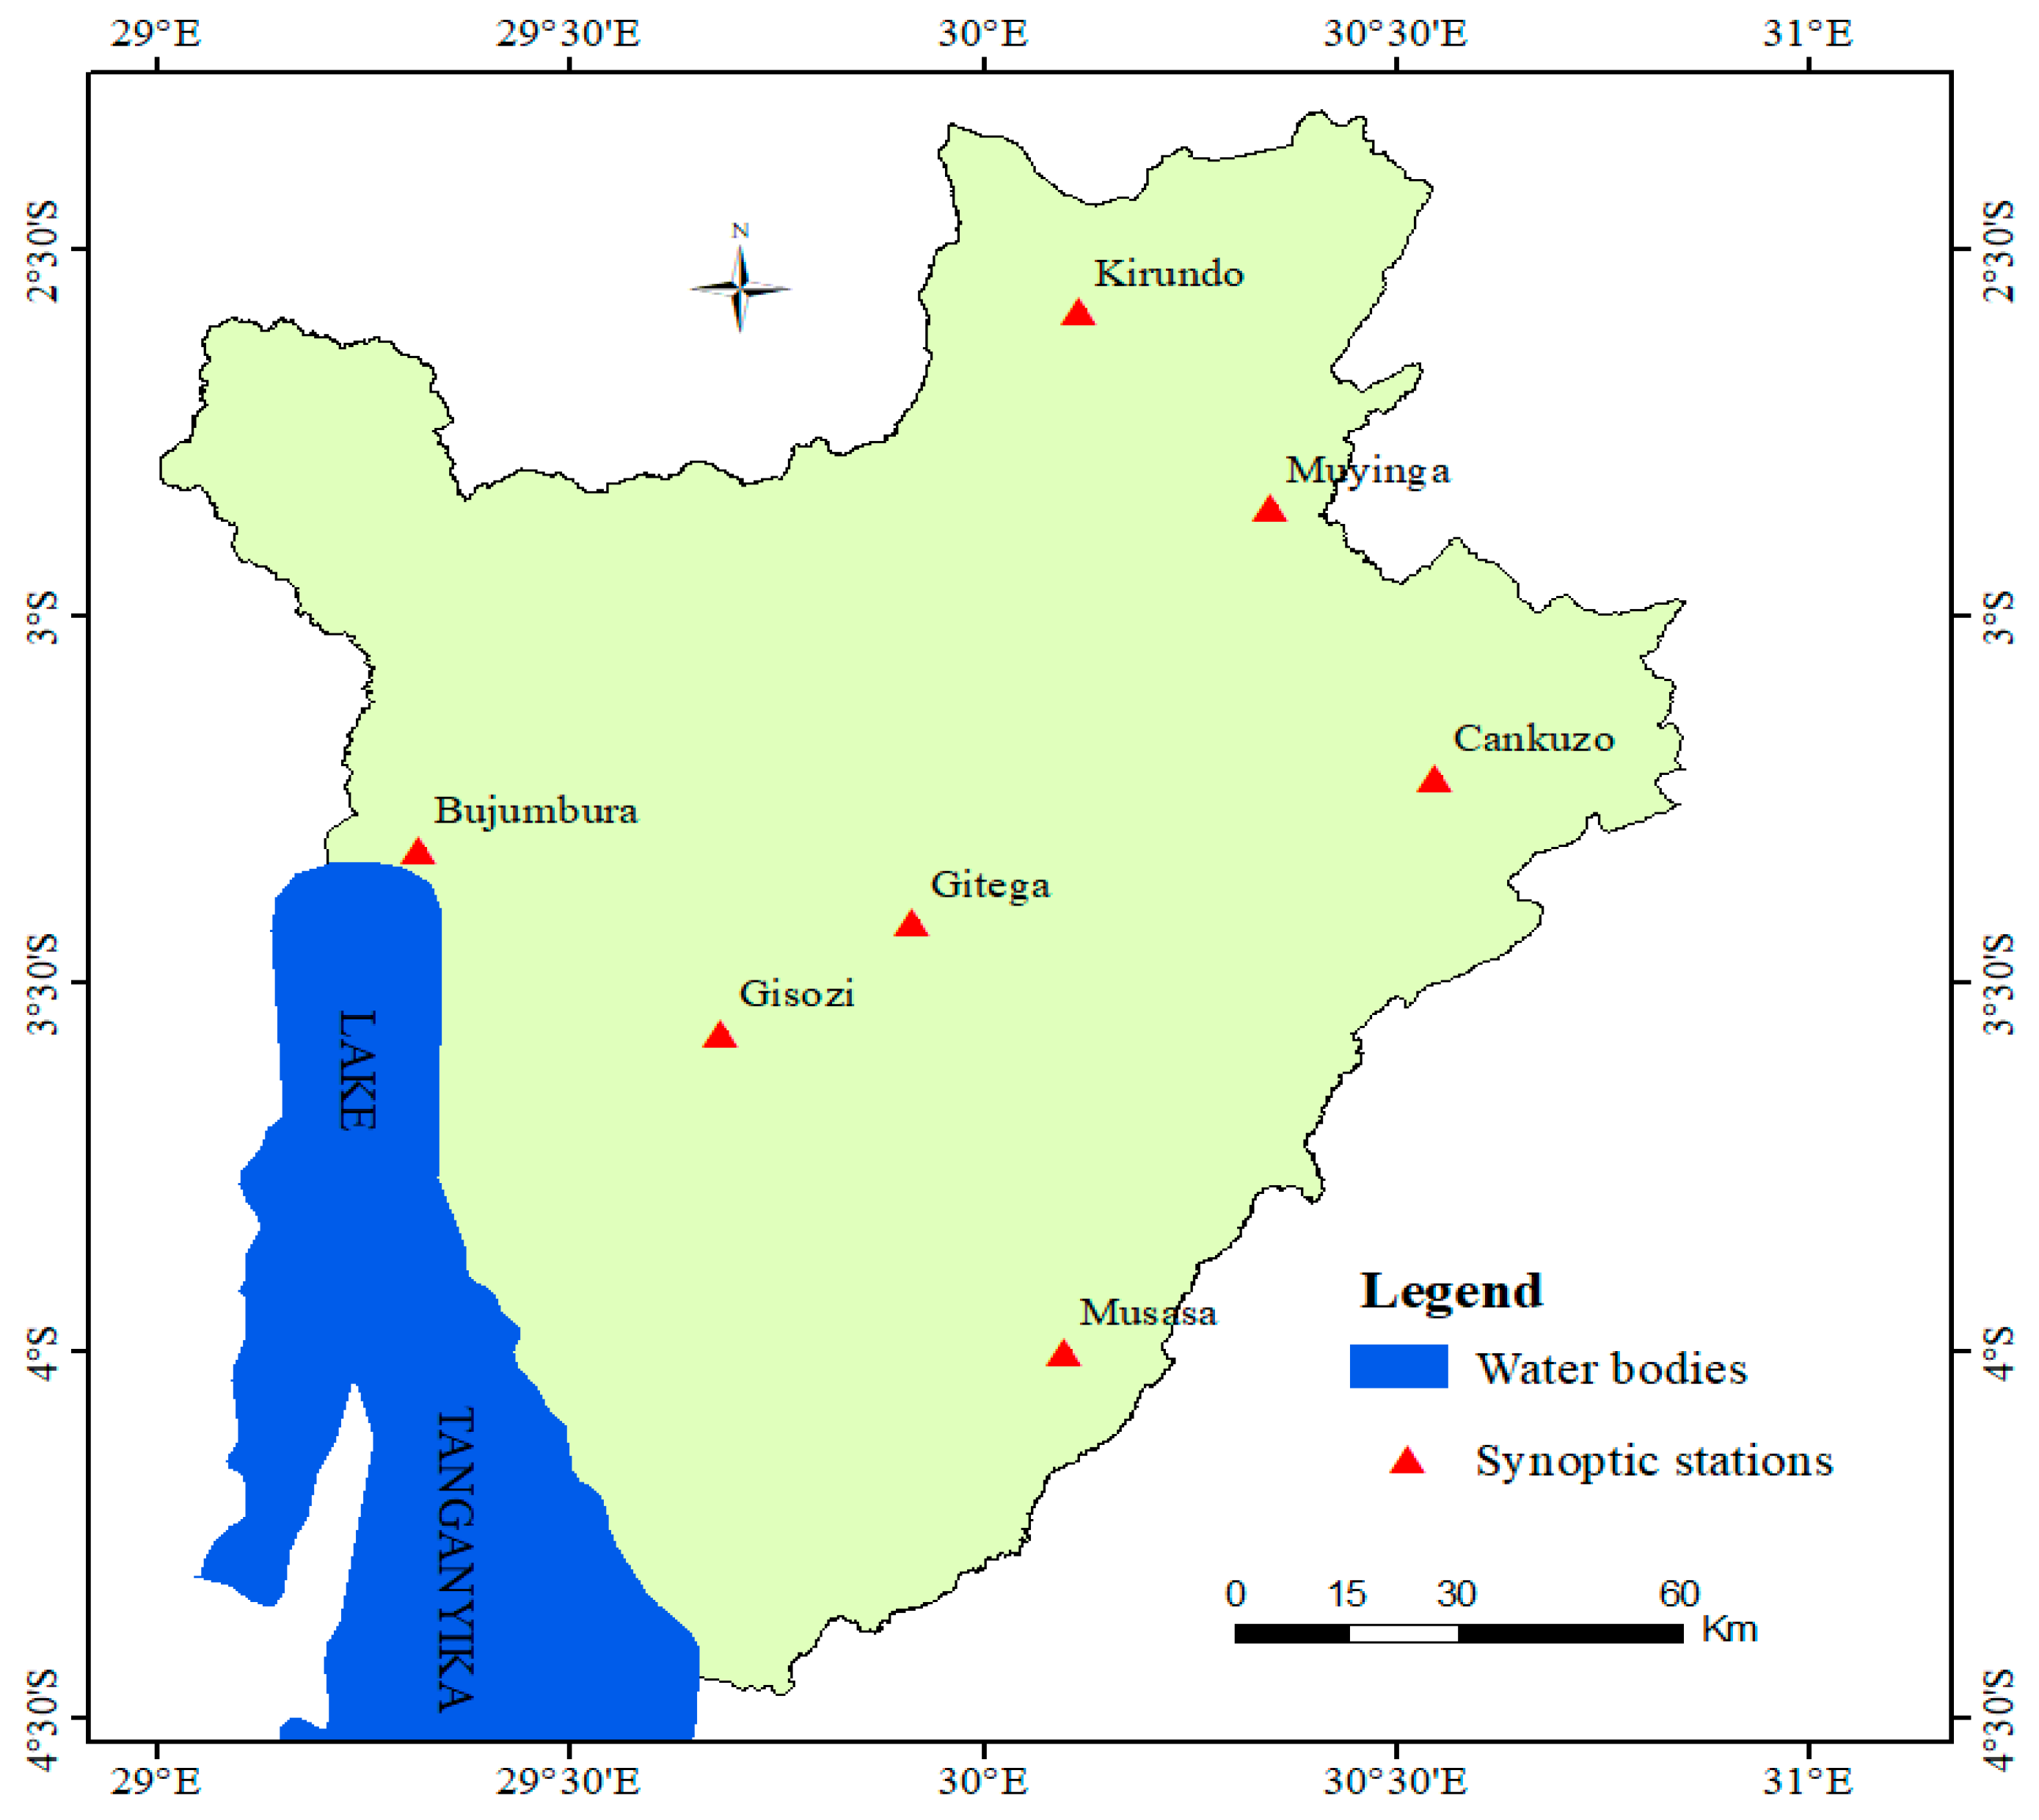
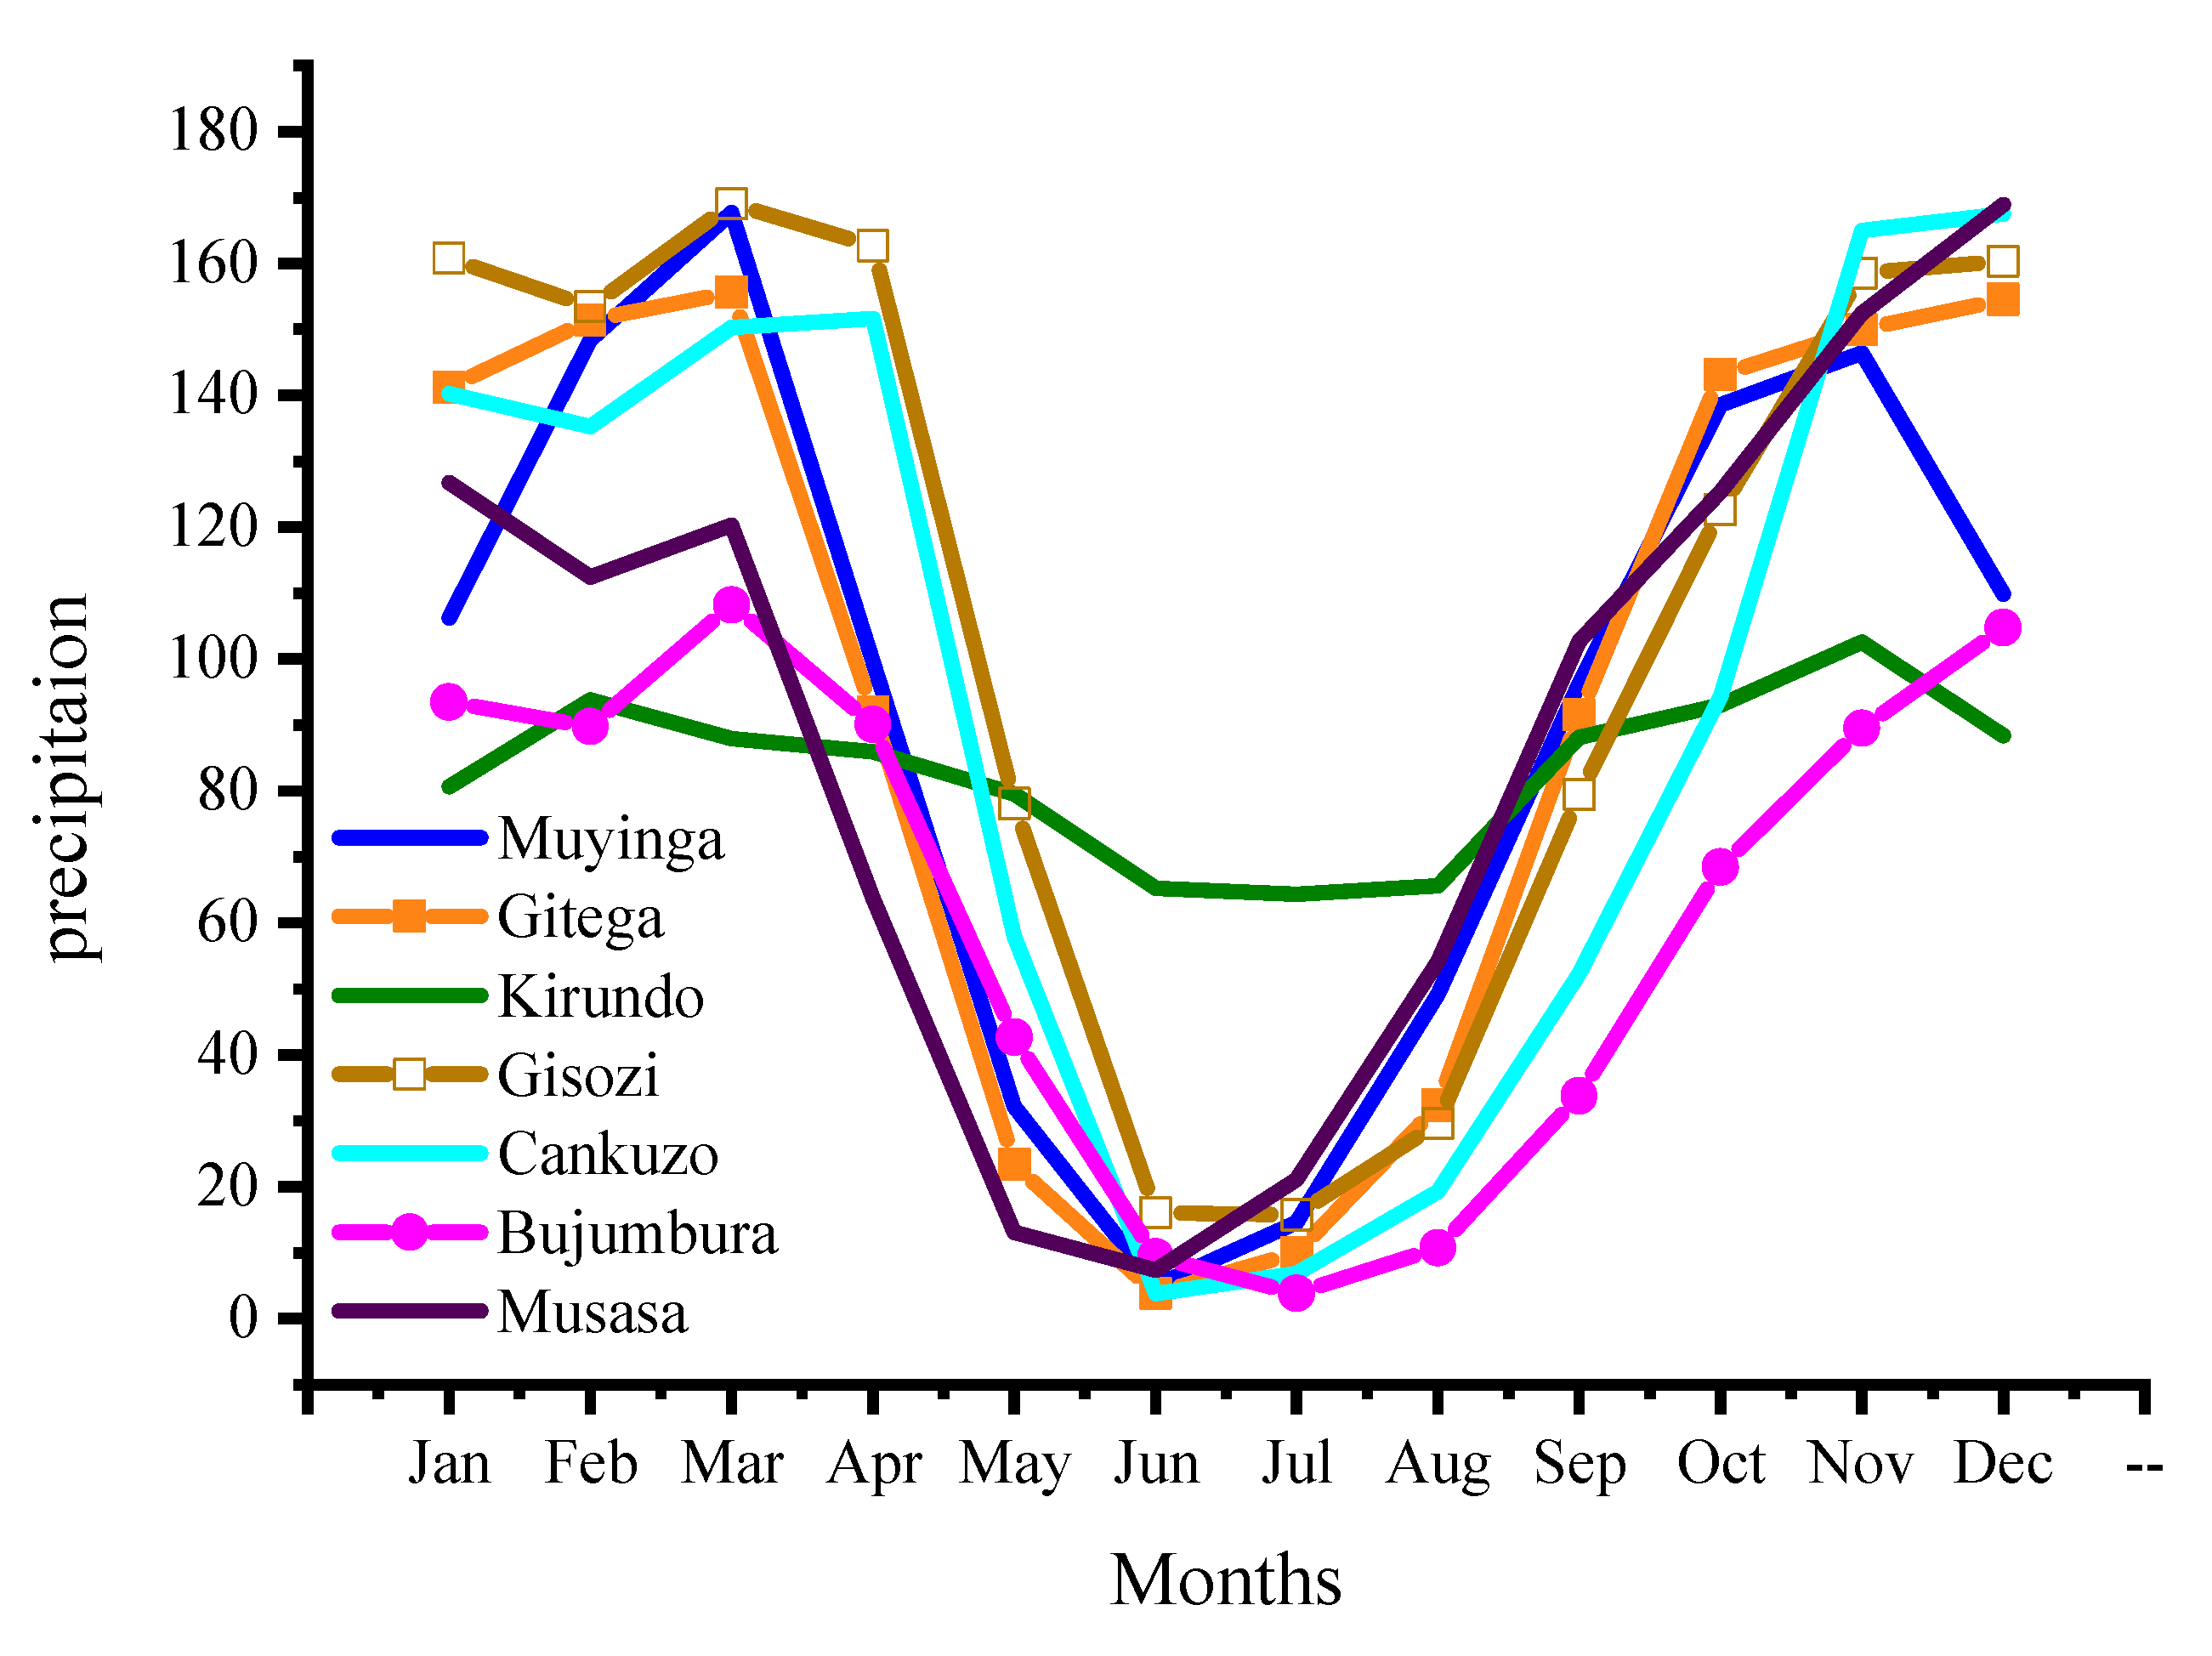
2.1. Description of the Study Area and Datasets
2.2. Datasets
3. Methodology
3.1. Standardized Precipitation Evapotranspiration Index
3.2. Mann–Kendall (MK) and Sen’s Slope Estimator
3.2.1. Mann–Kendall Test
3.2.2. Sen’s Slope Estimator Test
4. Results and Discussion
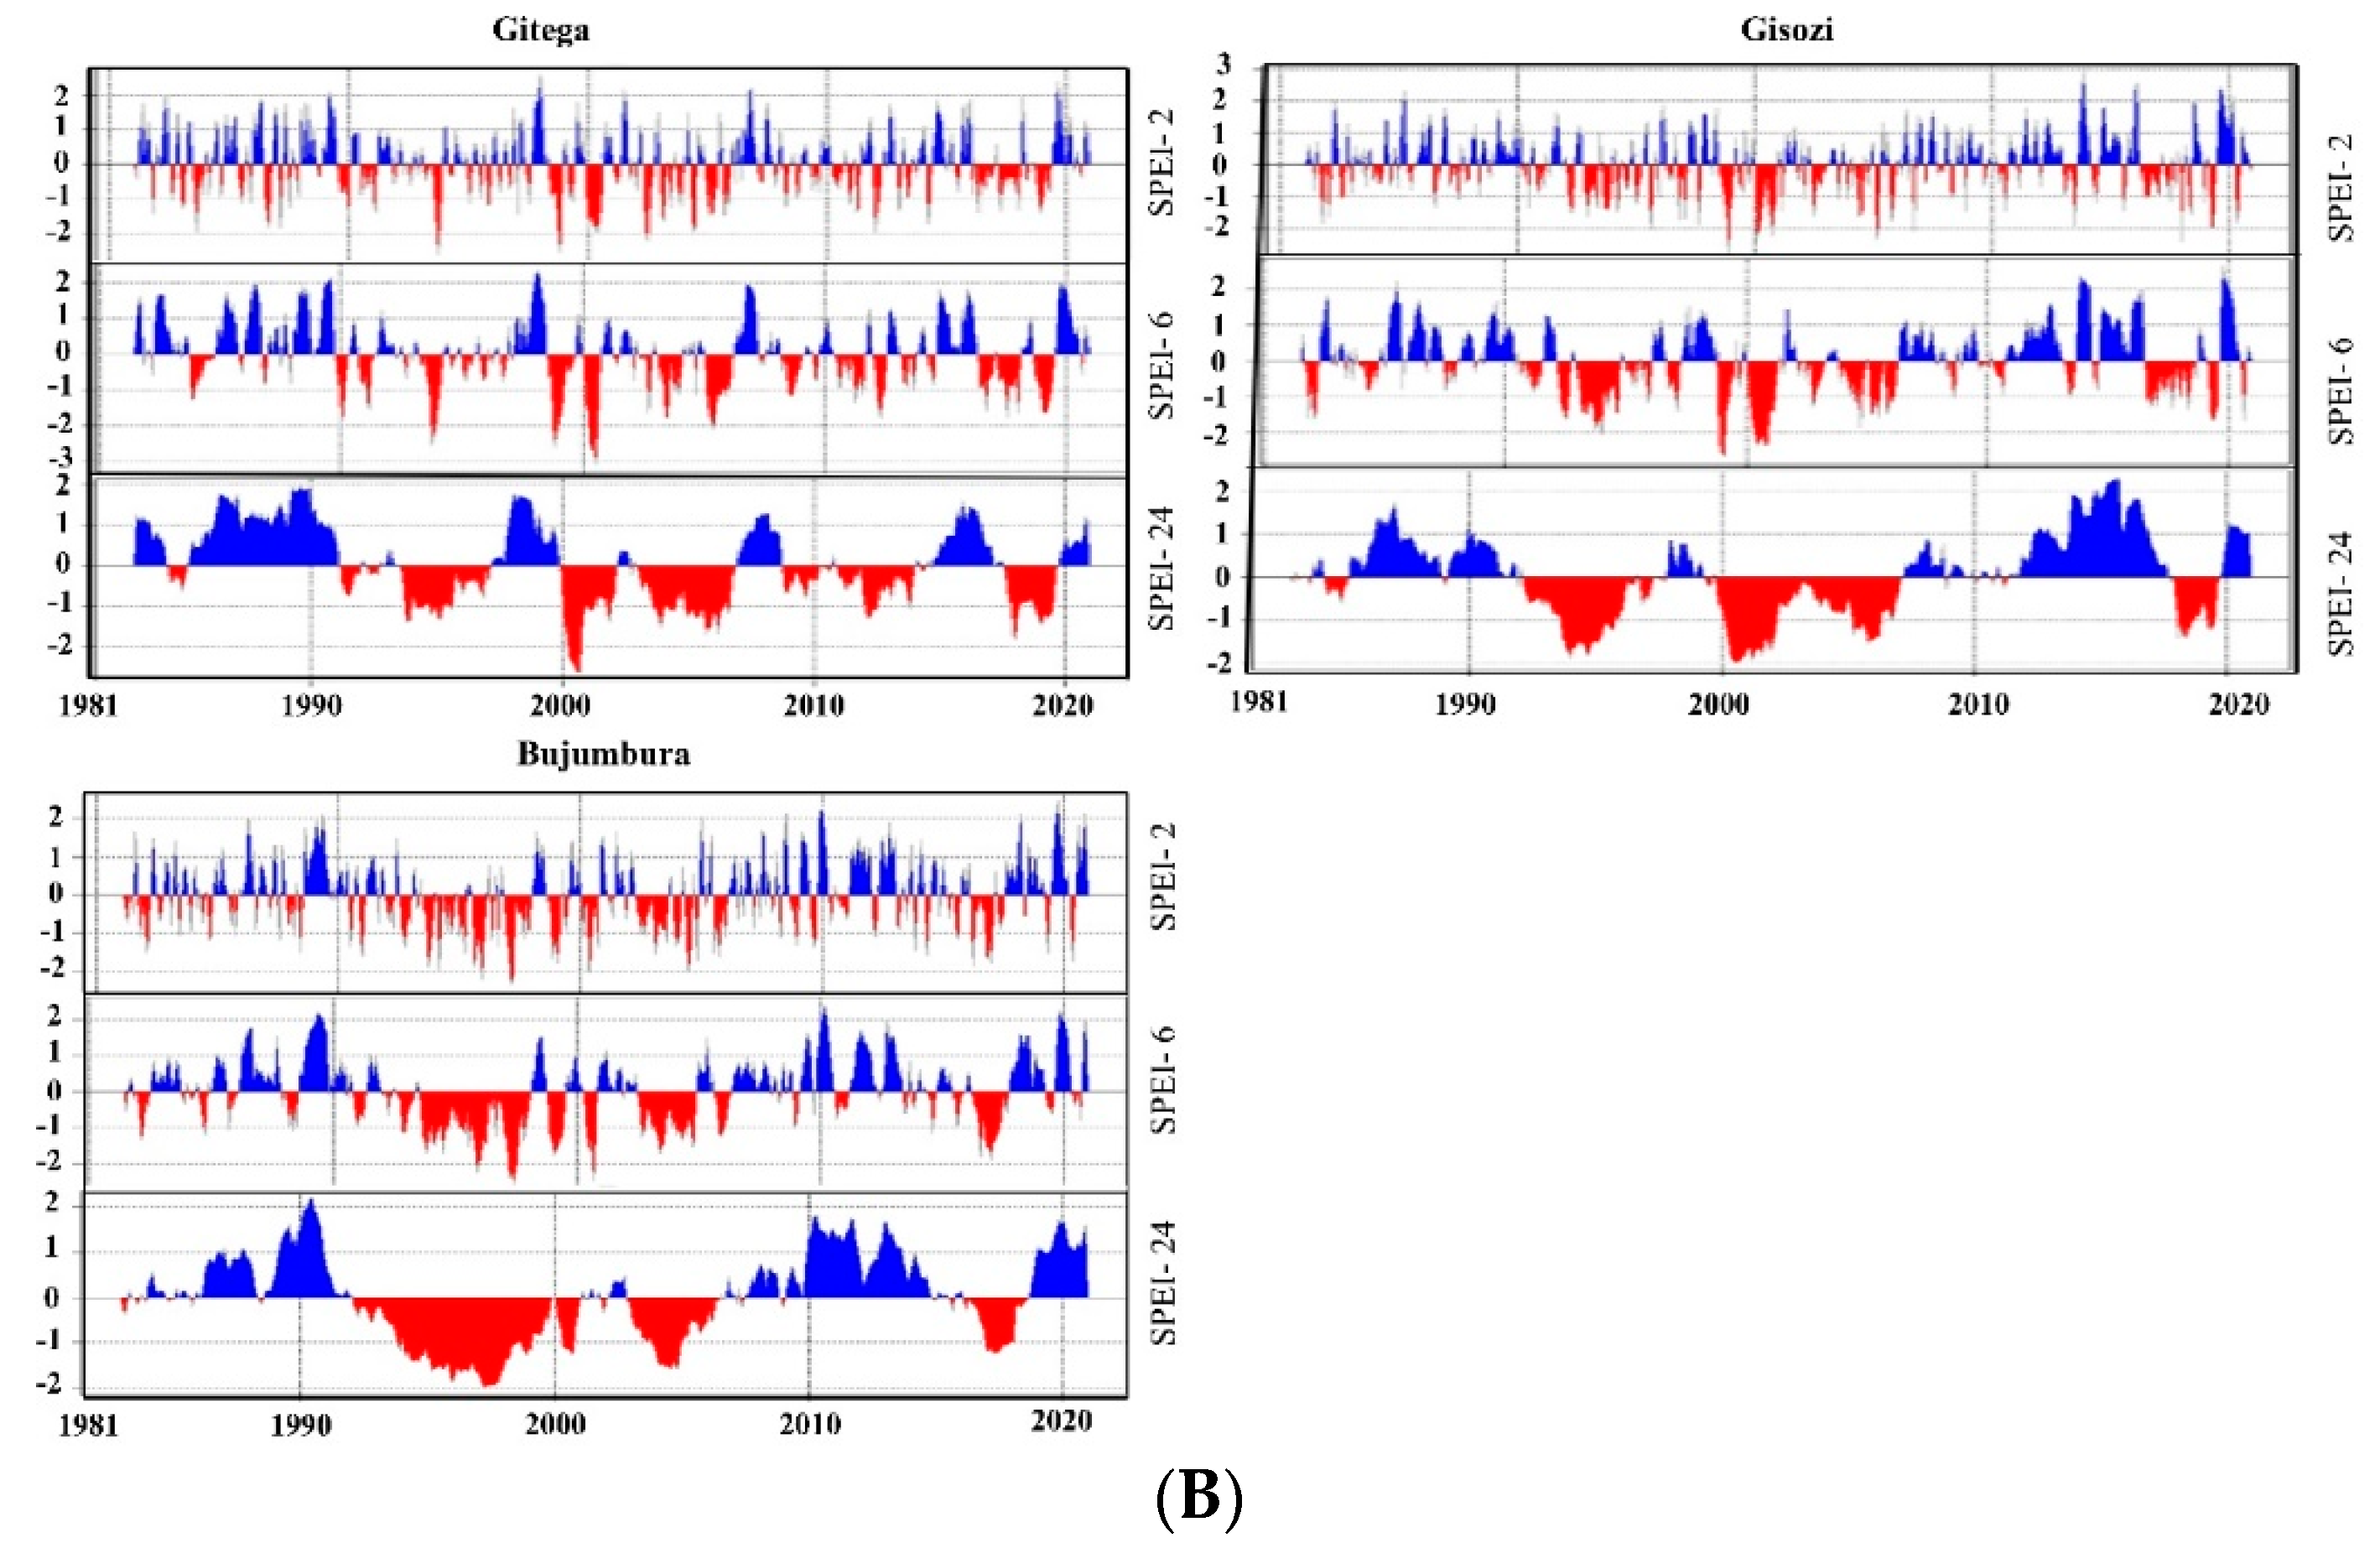
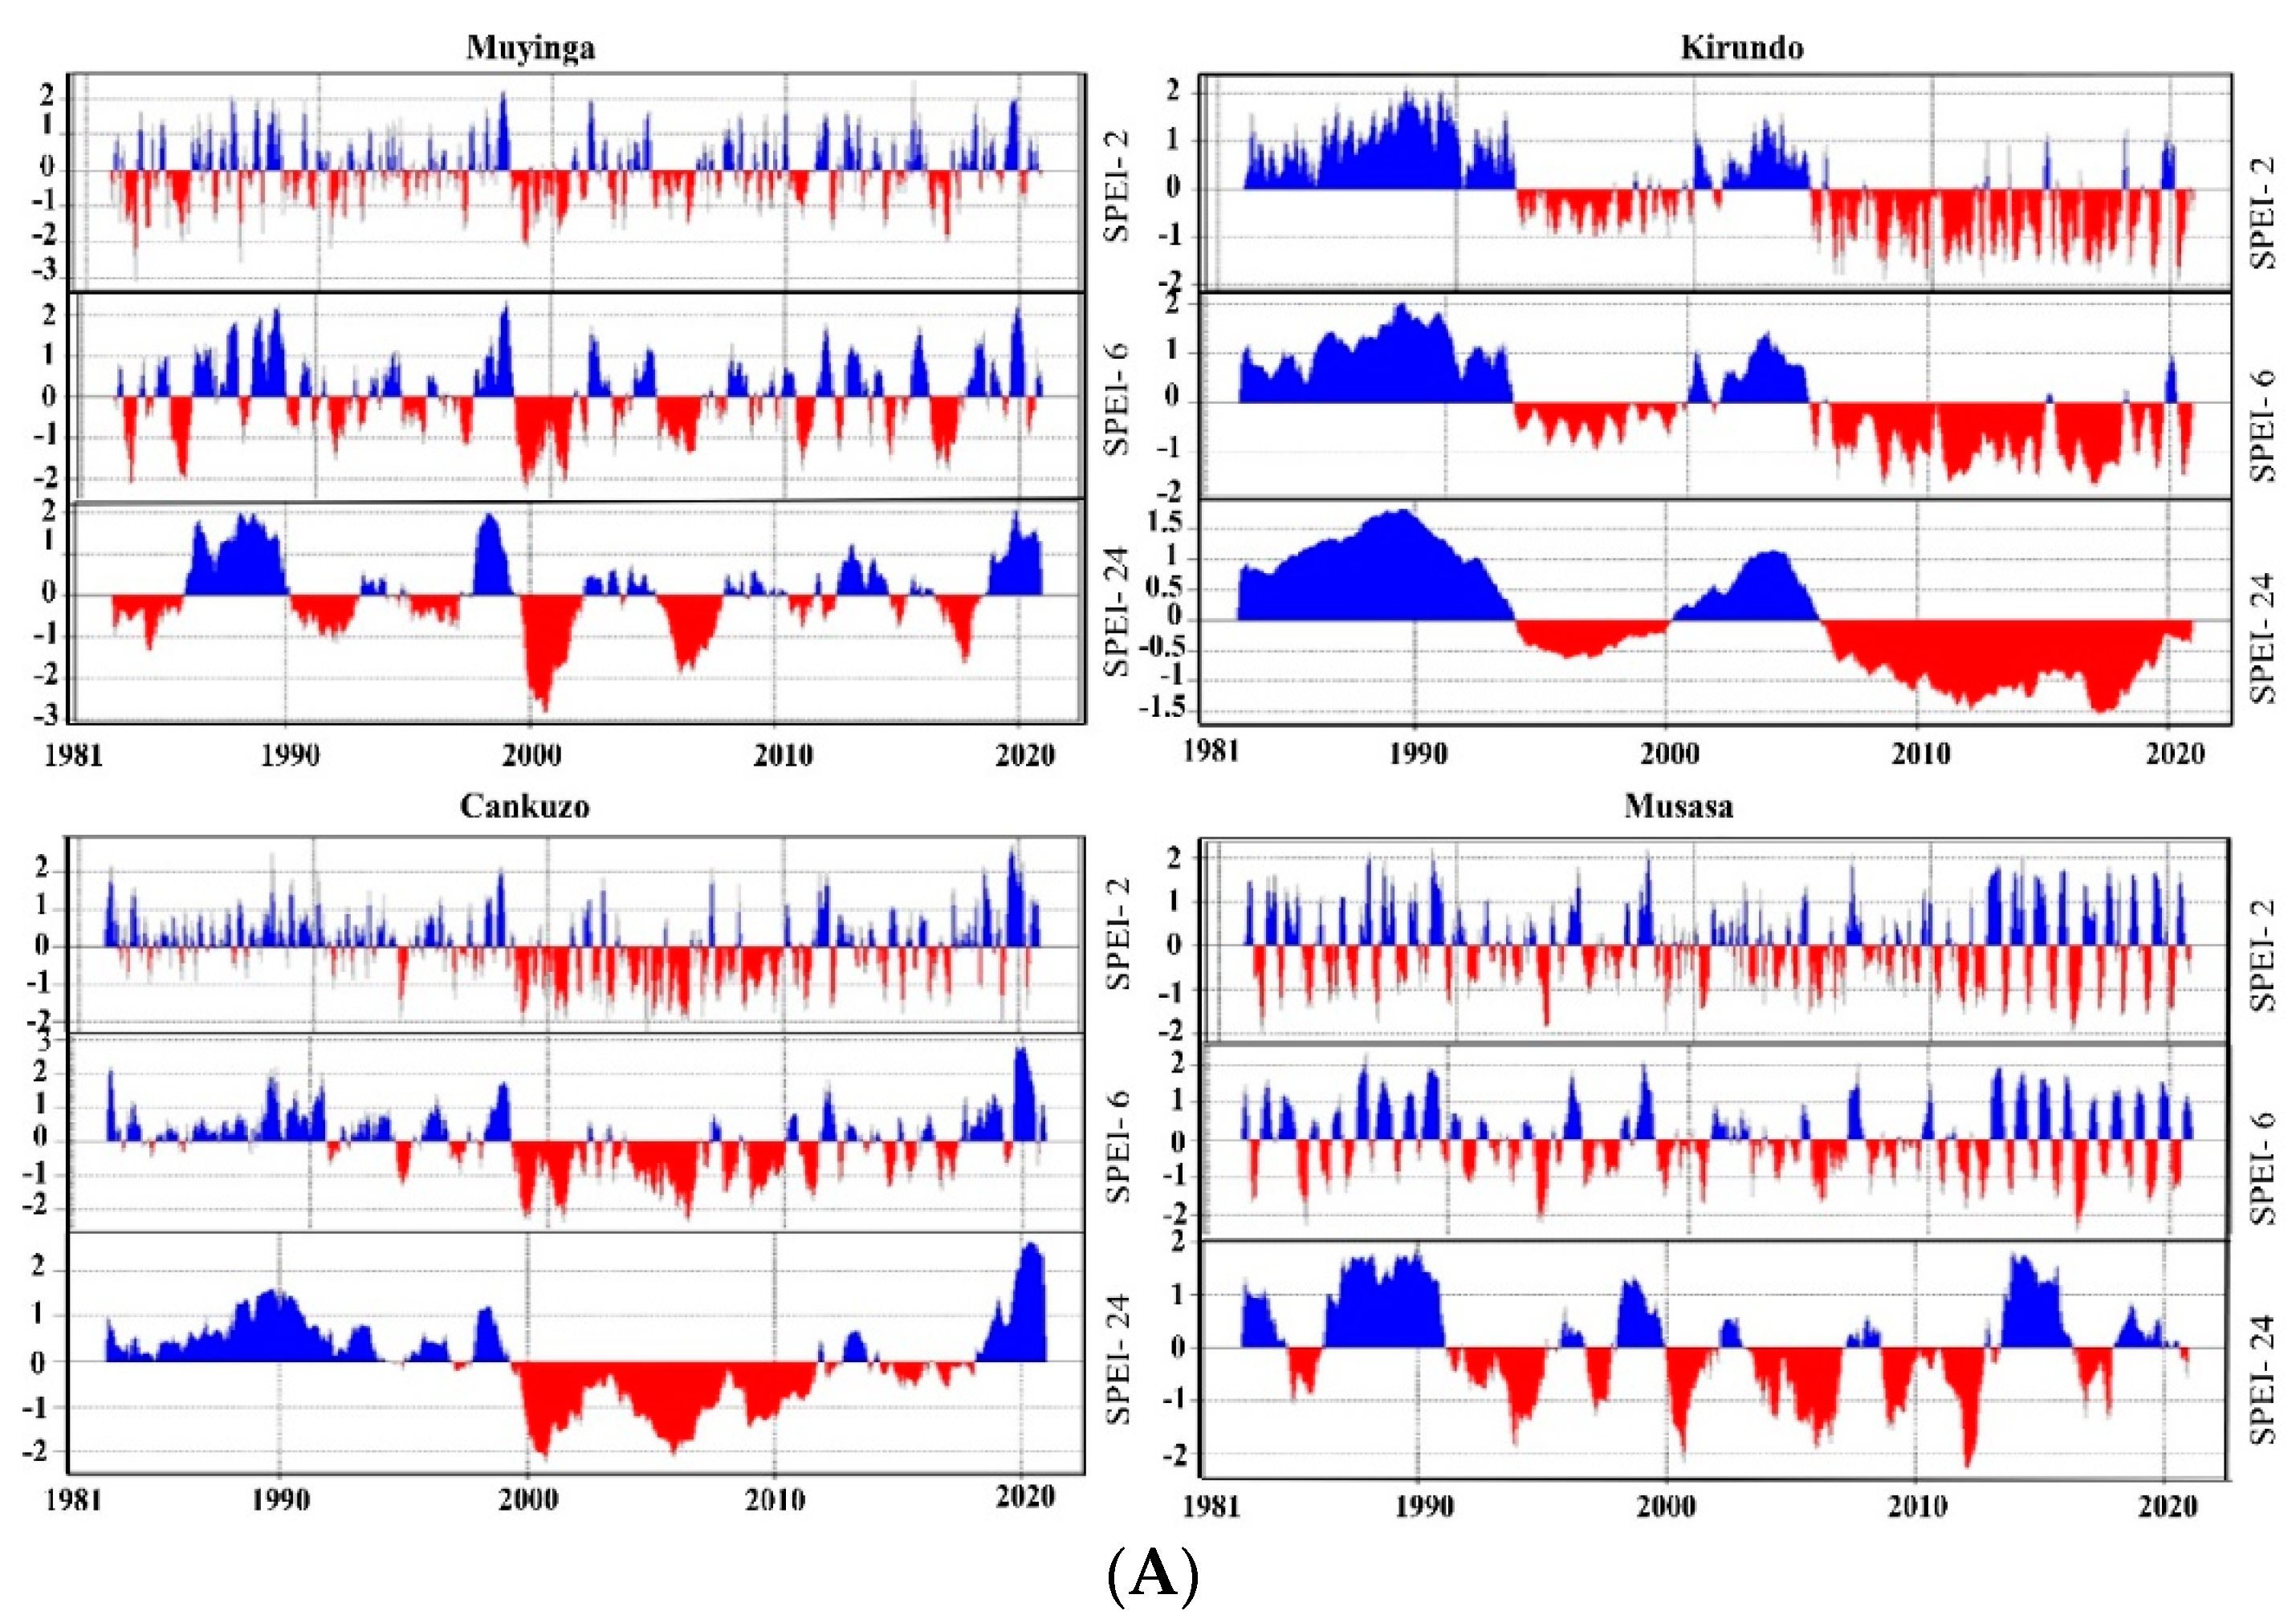
4.1. Assessment of Drought Characteristics on Annual and Seasonal Scales with SPEI Time Series
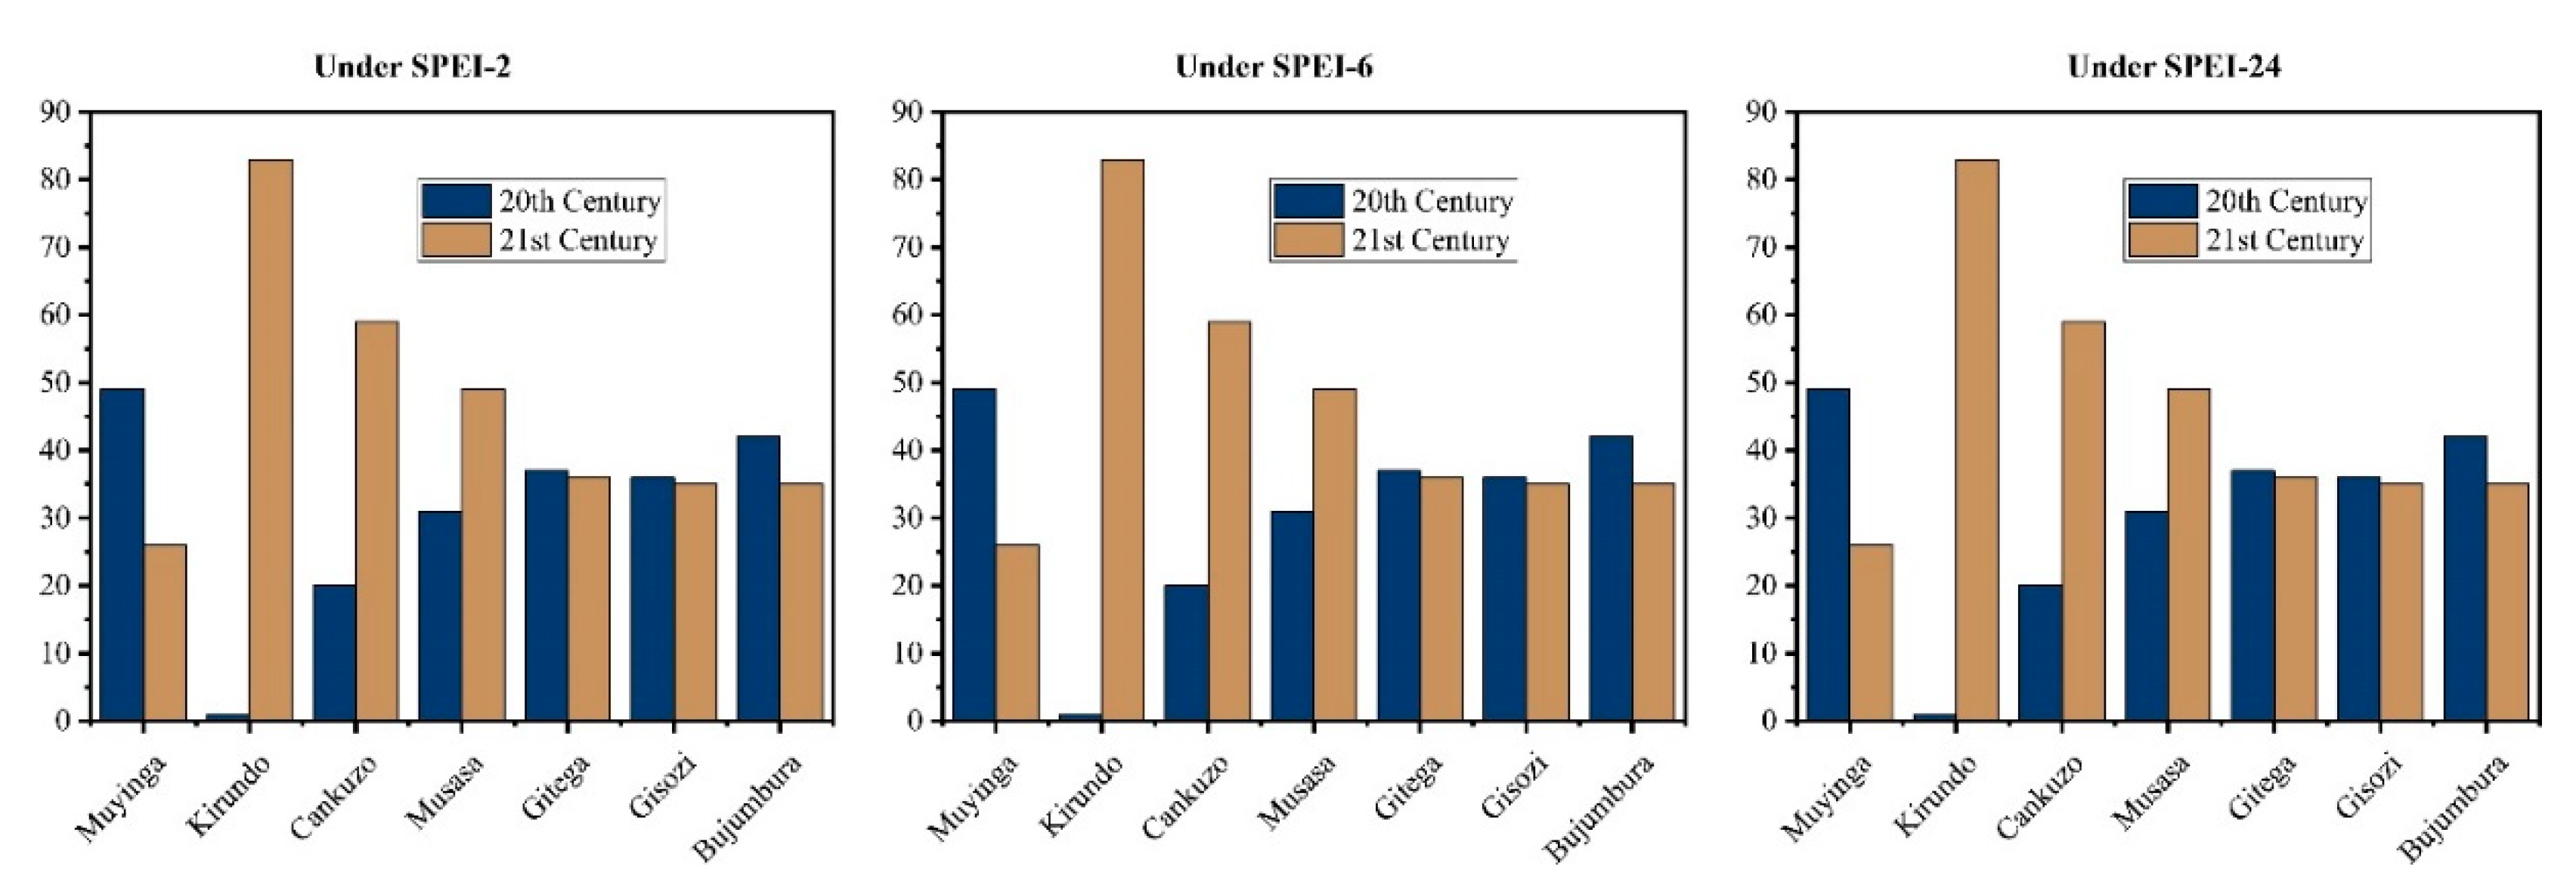
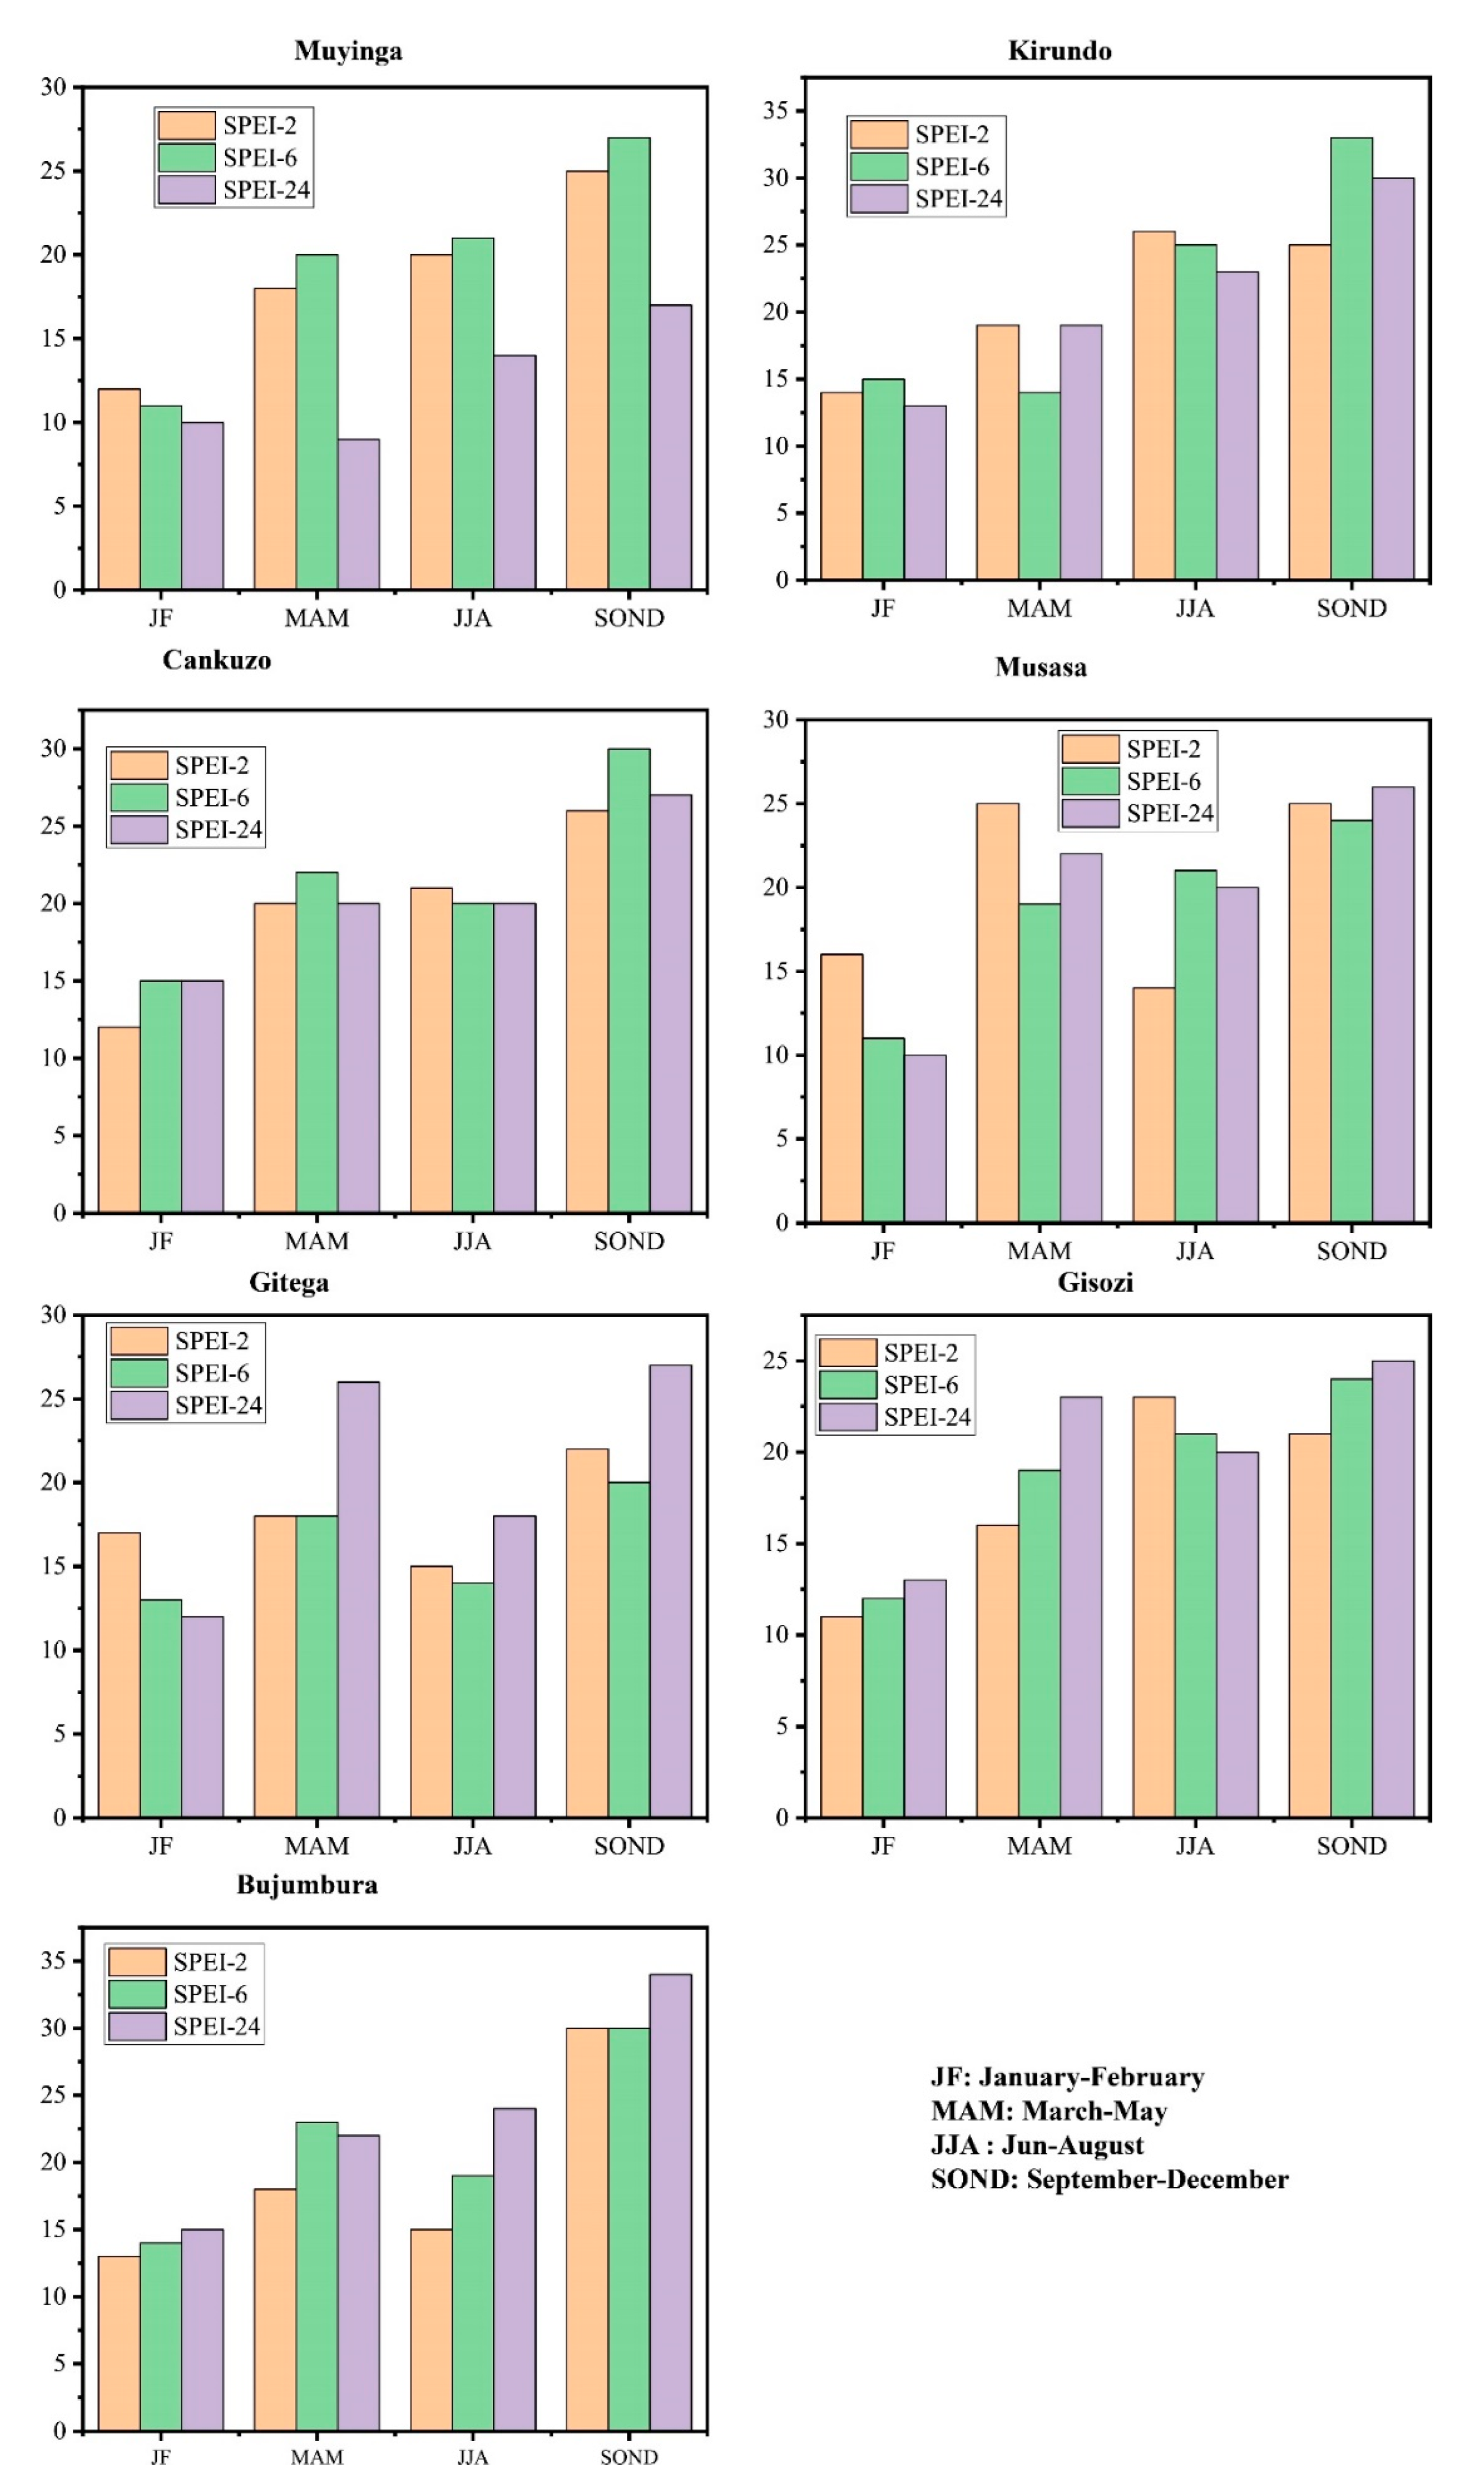
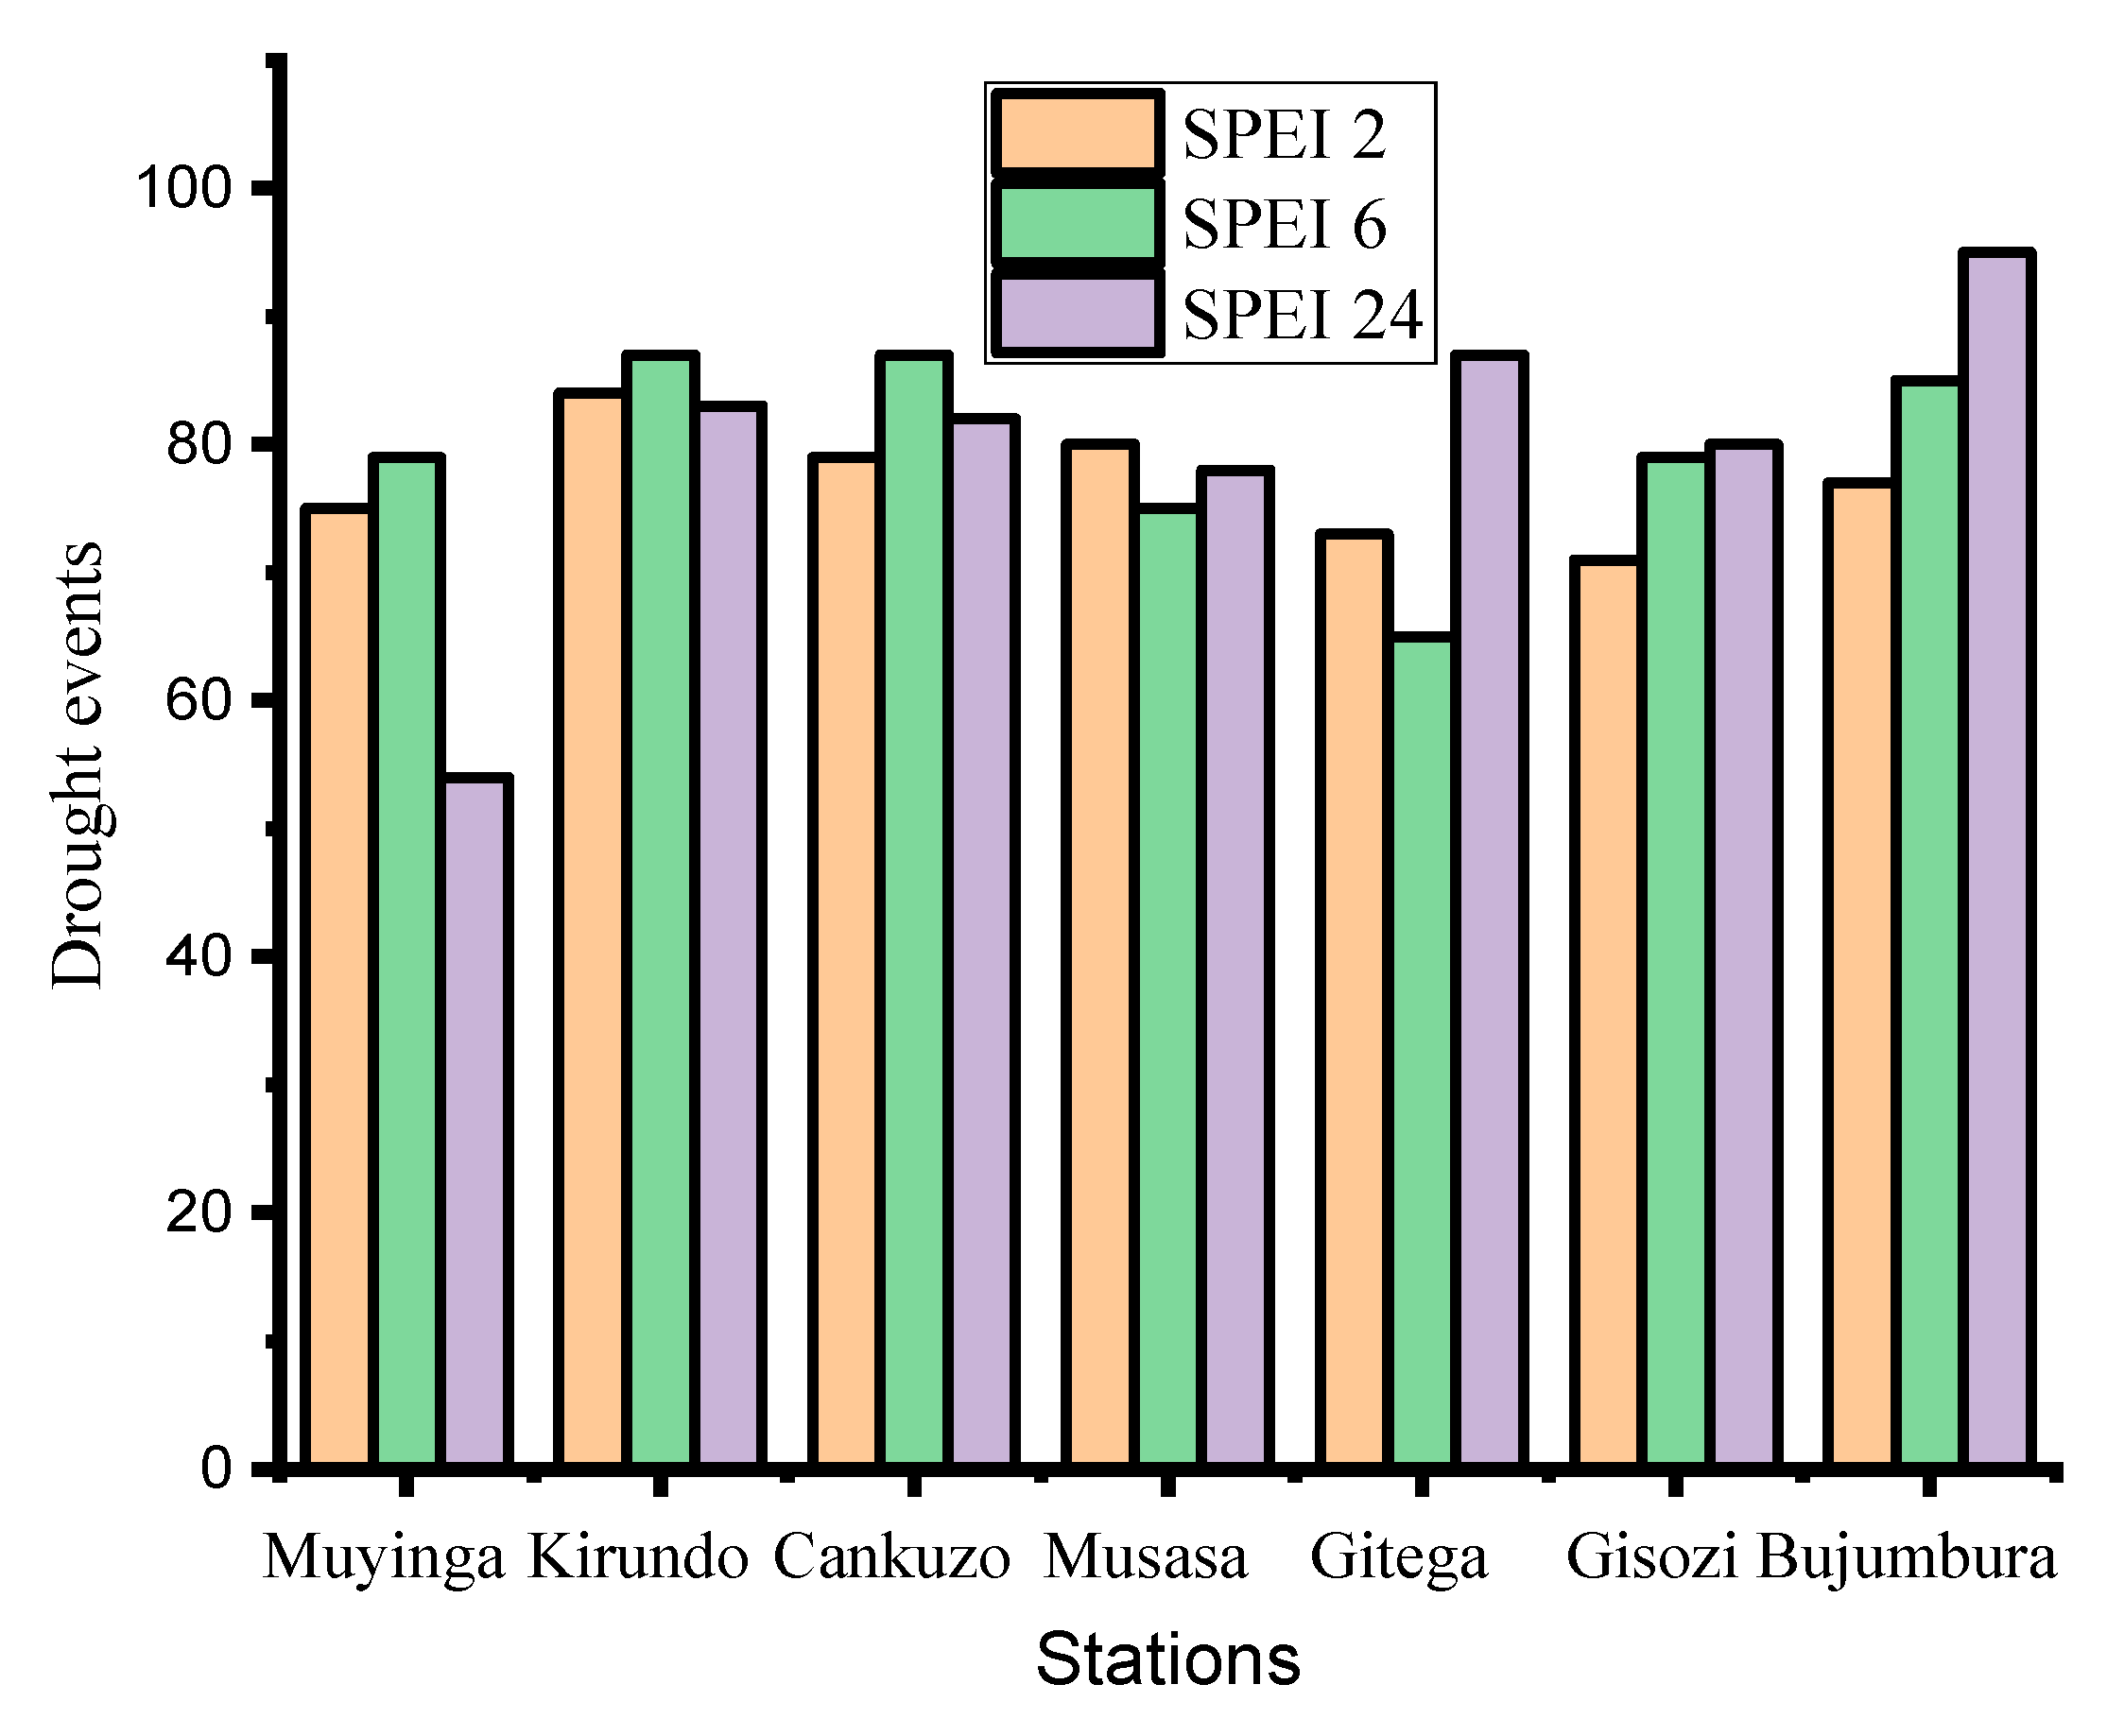
Drought Frequency of Seasonal SPEI Historical Values
4.2. Drought Characteristics Analysis
4.3. Trend Analysis of Annual Drought with SPEI Time Series
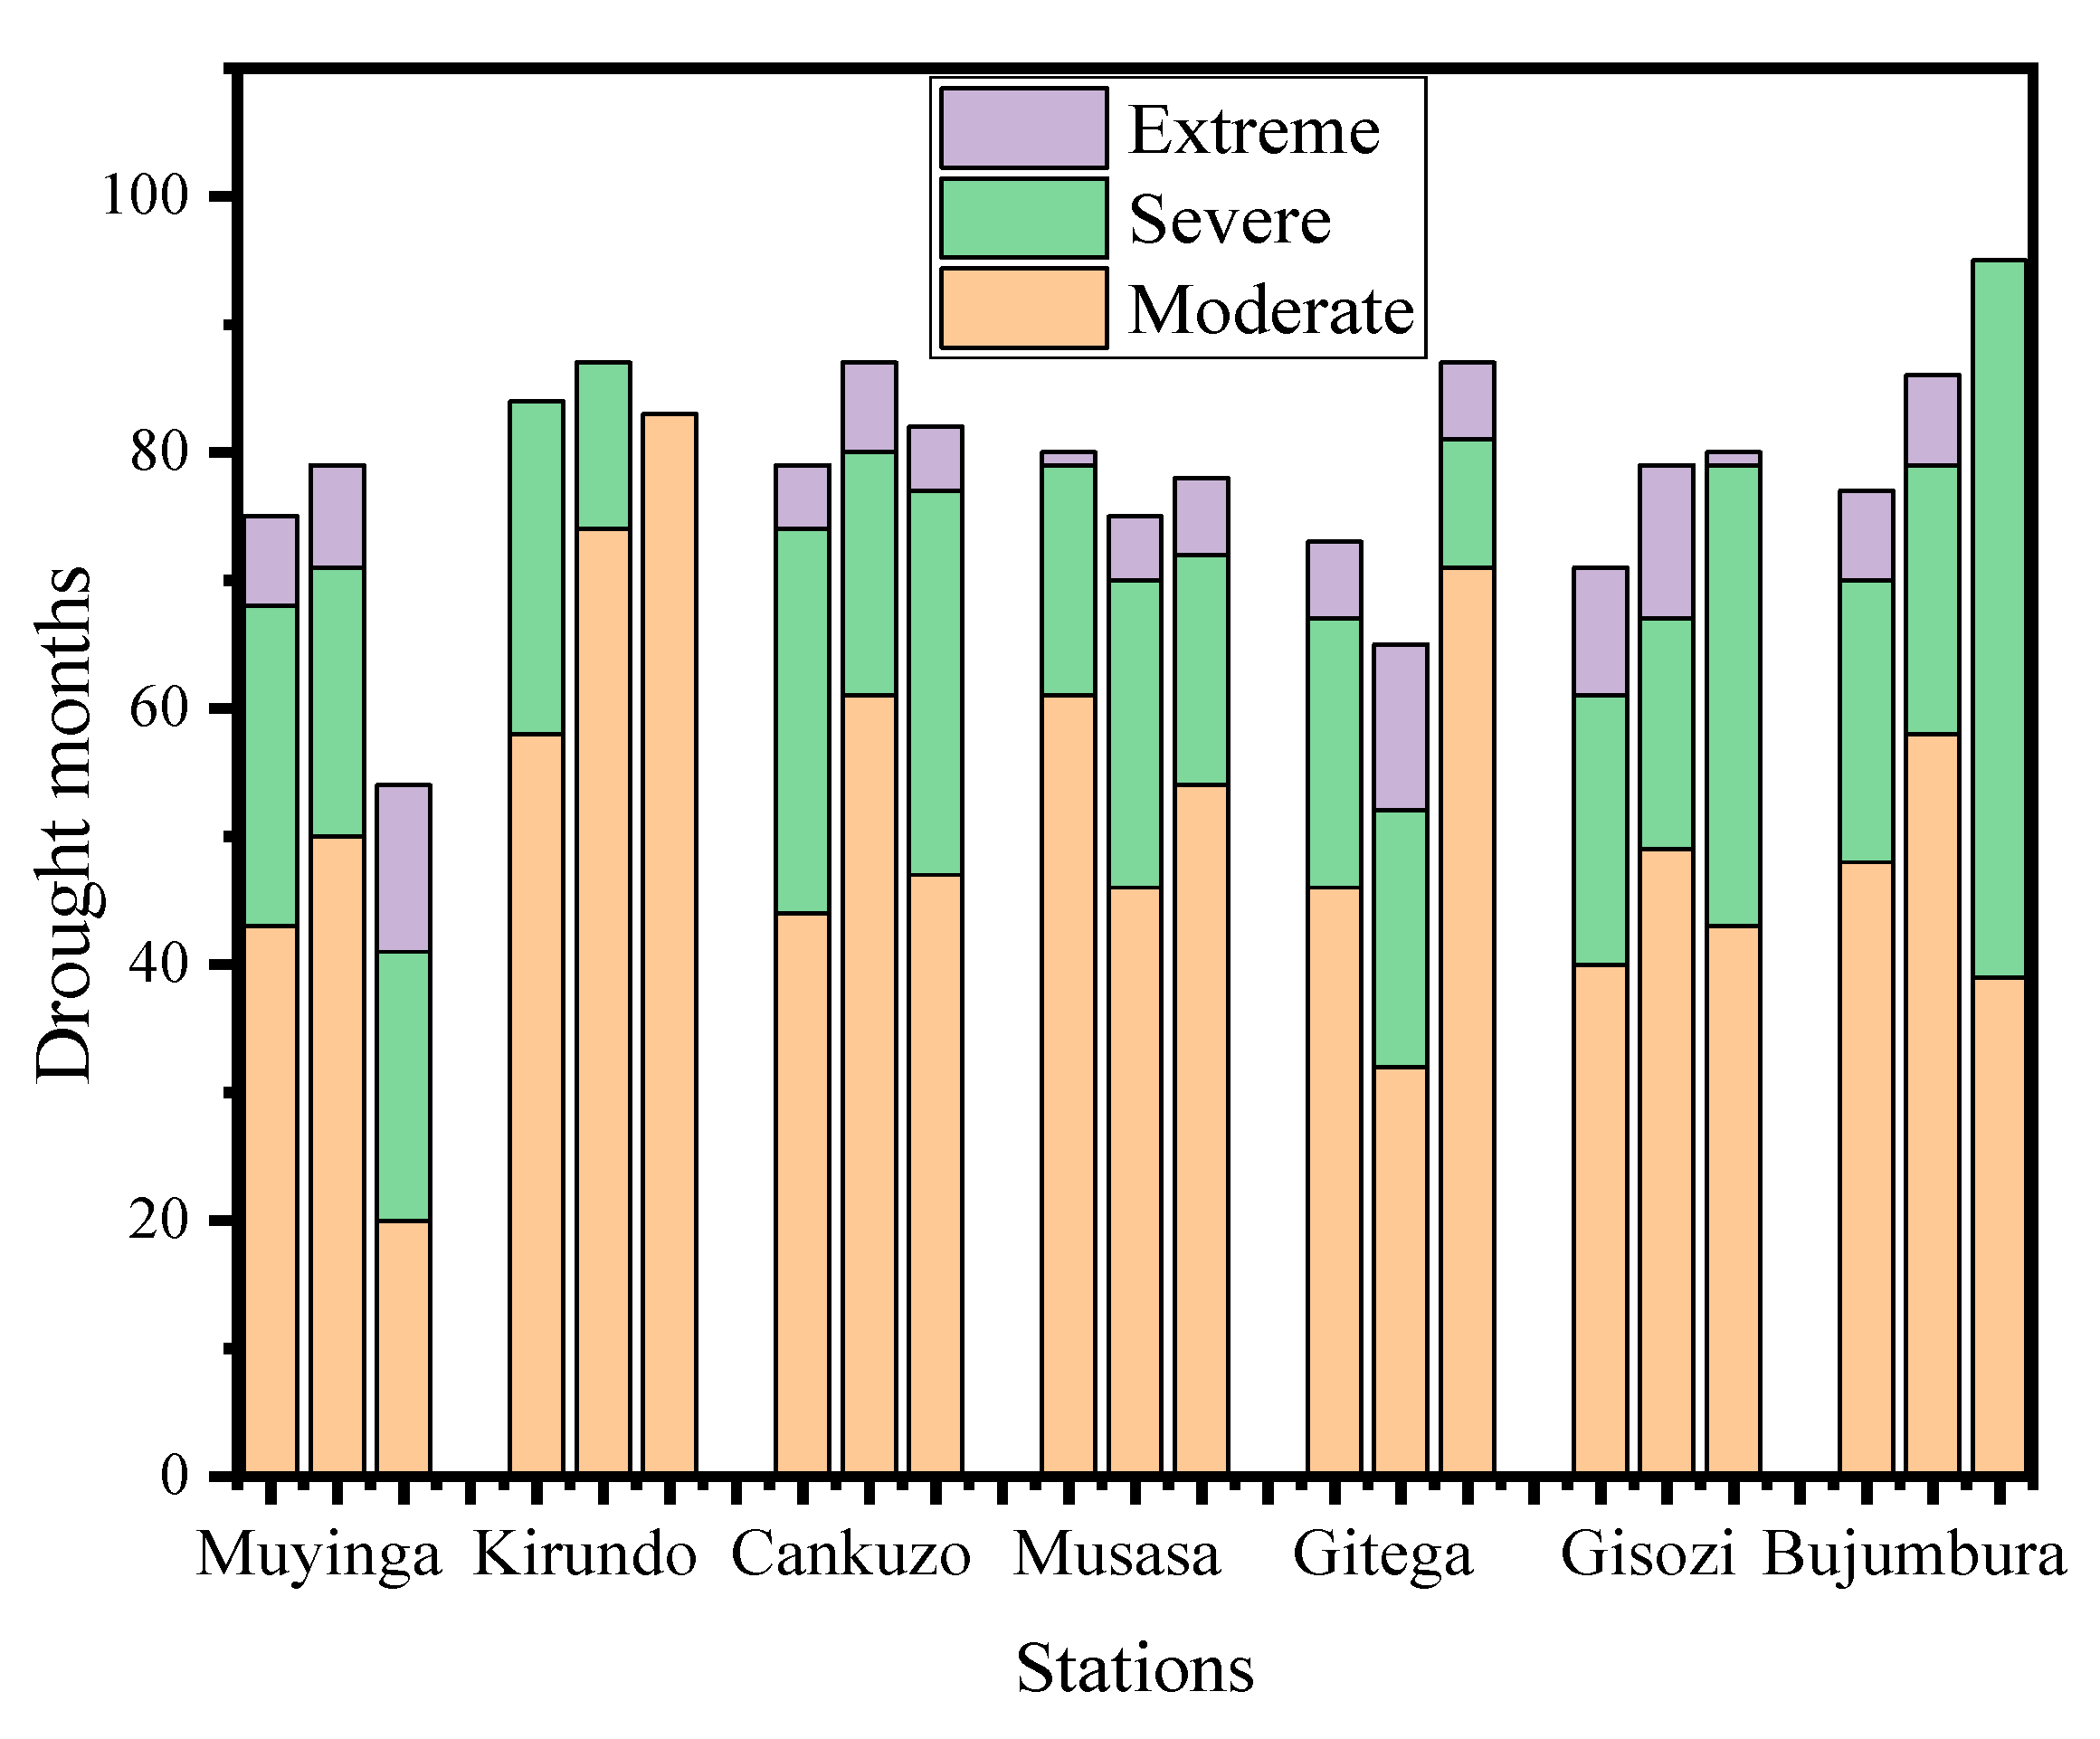
4.4. The Analysis of Drought Characteristics and Their Categories
5. Conclusions
Author Contributions
Funding
Institutional Review Board Statement
Informed Consent Statement
Data Availability Statement
Acknowledgments
Conflicts of Interest
References
- Crausbay, S.D.; Ramirez, A.R.; Carter, S.L.; Cross, M.S.; Hall, K.R.; Bathke, D.J.; Betancourt, J.L.; Colt, S.; Cravens, A.E.; Dalton, M.S.; et al. Defining Ecological Drought for the Twenty-First Century. Bull. Am. Meteorol. Soc. 2017, 98, 2543–2550. [Google Scholar] [CrossRef]
- Fagariba, C.J.; Song, S.; Soule, S.K.G. Livelihood Economic Activities Causing Deforestation in Northern Ghana: Evidence of Sissala West District. Open J. Ecol. 2018, 08, 57–74. [Google Scholar] [CrossRef]
- Guo, W.; Guo, M.; Tan, Y.; Bai, E.; Zhao, G. Sustainable Development of Resources and the Environment: Mining-Induced Eco-Geological Environmental Damage and Mitigation Measures-a Case Study in the Henan Coal Mining Area, China. Sustainability 2019, 11, 4366. [Google Scholar] [CrossRef]
- Shen, Z.; Zhang, Q.; Chen, D.; Singh, V.P. Varying Effects of Mining Development on Ecological Conditions and Groundwater Storage in Dry Region in Inner Mongolia of China. J. Hydrol. 2021, 597, 125759. [Google Scholar] [CrossRef]
- Zhang, T.; Su, X.; Zhang, G.; Wu, H.; Wang, G.; Chu, J. Evaluation of the Impacts of Human Activities on Propagation from Meteorological Drought to Hydrological Drought in the Weihe River Basin, China. Sci. Total Environ. 2022, 819, 153030. [Google Scholar] [CrossRef] [PubMed]
- CRED: 2021 Disasters in Numbers. Brussels: CRED; 2022. Available online: https://cred.be/sites/default/files/2021_EMDAT_report.pdf (accessed on 28 May 2022).
- Kamali, B.; Jahanbakhshi, F.; Dogaru, D.; Dietrich, J.; Nendel, C.; AghaKouchak, A. Probabilistic Modeling of Crop-Yield Loss Risk under Drought: A Spatial Showcase for Sub-Saharan Africa. Environ. Res. Lett. 2022, 17, 024028. [Google Scholar] [CrossRef]
- Masih, I.; Maskey, S.; Mussá, F.E.F.; Trambauer, P. A Review of Droughts on the African Continent: A Geospatial and Long-Term Perspective. Hydrol. Earth Syst. Sci. 2014, 18, 3635–3649. [Google Scholar] [CrossRef]
- Xu, C.; McDowell, N.G.; Fisher, R.A.; Wei, L.; Sevanto, S.; Christoffersen, B.O.; Weng, E.; Middleton, R.S. Increasing Impacts of Extreme Droughts on Vegetation Productivity under Climate Change. Nat. Clim. Chang. 2019, 9, 948–953. [Google Scholar] [CrossRef]
- Spinoni, J.; Barbosa, P.; Bucchignani, E.; Cassano, J.; Cavazos, T.; Christensen, J.H.; Christensen, O.B.; Coppola, E.; Evans, J.; Geyer, B.; et al. Future Global Meteorological Drought Hot Spots: A Study Based on CORDEX Data. J. Clim. 2020, 33, 3635–3661. [Google Scholar] [CrossRef]
- Sheffield, J.; Wood, E.F.; Chaney, N.; Guan, K.; Sadri, S.; Yuan, X.; Olang, L.; Amani, A.; Ali, A.; Demuth, S.; et al. A Drought Monitoring and Forecasting System for Sub-Sahara African Water Resources and Food Security. Bull. Am. Meteorol. Soc. 2014, 95, 861–882. [Google Scholar] [CrossRef]
- Mekonen, A.A.; Berlie, A.B.; Ferede, M.B. Spatial and Temporal Drought Incidence Analysis in the Northeastern Highlands of Ethiopia. Geoenviron. Disasters 2020, 7, 10. [Google Scholar] [CrossRef]
- Li, J.; Wang, Z.; Wu, X.; Xu, C.Y.; Guo, S.; Chen, X.; Zhang, Z. Robust Meteorological Drought Prediction Using Antecedent SST Fluctuations and Machine Learning. Water Resour. Res. 2021, 57, e2020WR029413. [Google Scholar] [CrossRef]
- Kalisa, W.; Zhang, J.; Igbawua, T.; Kayiranga, A.; Ujoh, F.; Aondoakaa, I.S.; Tuyishime, P.; Li, S.; Simbi, C.H.; Nibagwire, D. Spatial Multi-Criterion Decision Making (SMDM) Drought Assessment and Sustainability over East Africa from 1982 to 2015. Remote Sens. 2021, 13, 5067. [Google Scholar] [CrossRef]
- Mwangi, E.; Taylor, O.; Todd, M.C.; Visman, E.; Kniveton, D.; Kilavi, M.; Ndegwa, W.; Otieno, G.; Waruru, S.; Mwangi, J.; et al. Mainstreaming Forecast Based Action into National Disaster Risk Management Systems: Experience from Drought Risk Management in Kenya. Clim. Dev. 2021. [Google Scholar] [CrossRef]
- Ahmadalipour, A.; Moradkhani, H.; Demirel, M.C. A Comparative Assessment of Projected Meteorological and Hydrological Droughts: Elucidating the Role of Temperature. J. Hydrol. 2017, 553, 785–797. [Google Scholar] [CrossRef]
- Stagge, J.H.; Tallaksen, L.M.; Xu, C.-Y.; van Lanen, H.A.J. Standardized Precipitation-Evapotranspiration Index (SPEI): Sensitivity to Potential Evapotranspiration Model and Parameters; IAHS Publication: Montpellier, France, 2014; Volume 363. [Google Scholar]
- Mckee, T.B.; Doesken, N.J.; Kleist, J. The relation of drought frequency and duration to time scales. In Proceedings of the Eighth Conference on Applied Climatology, Anaheim, CA, USA, 17–22 January 1993; Department of Atmospheric Science Colorado State University: Fort Collins, CO, USA, 1993; Volume 17, pp. 179–184. [Google Scholar]
- Vicente-Serrano, S.M.; Beguería, S.; López-Moreno, J.I. A Multiscalar Drought Index Sensitive to Global Warming: The Standardized Precipitation Evapotranspiration Index. J. Clim. 2010, 23, 1696–1718. [Google Scholar] [CrossRef]
- Palmer, W.C. Keeping Track of Crop Moisture Conditions, Nationwide: The New Crop Moisture Index. Weatherwise 1968, 21, 156–161. [Google Scholar] [CrossRef]
- van Roy, M.P. A Rainfall Anomaly Index Independent of Time and Space. Notos 1965, 14, 43–48. [Google Scholar]
- Kalisa, W.; Zhang, J.; Igbawua, T.; Ujoh, F.; Ebohon, O.J.; Namugize, J.N.; Yao, F. Spatio-Temporal Analysis of Drought and Return Periods over the East African Region Using Standardized Precipitation Index from 1920 to 2016. Agricult. Water Manag. 2020, 237. [Google Scholar] [CrossRef]
- Rolbiecki, R.; Yücel, A.; Kocięcka, J.; Atilgan, A.; Marković, M.; Liberacki, D. Analysis of SPI as a Drought Indicator during the Maize Growing Period in the Çukurova Region (Turkey). Sustainability 2022, 14, 3697. [Google Scholar] [CrossRef]
- Zhao, Y.; Xu, X.; Liao, L.; Wang, Y.; Gu, X.; Qin, R.; Guo, Y.; Kang, Z.; Wang, F.; Wang, M. The Severity of Drought and Precipitation Prediction in the Eastern Fringe of the Tibetan Plateau. Theor. Appl. Climatol. 2019, 137, 141–152. [Google Scholar] [CrossRef]
- Pramudya, Y.; Onishi, T.; Senge, M.; Hiramatsu, K.; Nur, P.M.R. Evaluation of Recent Drought Conditions by Standardized Precipitation Index and Potential Evapotranspiration over Indonesia. Paddy Water Environ. 2019, 17, 331–338. [Google Scholar] [CrossRef]
- Musonda, B.; Jing, Y.; Iyakaremye, V.; Ojara, M. Analysis of Long-Term Variations of Drought Characteristics Using Standardized Precipitation Index over Zambia. Atmosphere 2020, 11, 1268. [Google Scholar] [CrossRef]
- Taji, S.G.; Keskar, A.P. Drought Identification and Analysis of Precipitation Trends in Beed District, Maharashtra. Mater. Today Proc. 2021. [Google Scholar] [CrossRef]
- Wang, Q.; Zhang, R.; Qi, J.; Zeng, J.; Wu, J.; Shui, W.; Wu, X.; Li, J. An Improved Daily Standardized Precipitation Index Dataset for Mainland China from 1961 to 2018. Sci. Data 2022, 9, 124. [Google Scholar] [CrossRef] [PubMed]
- Yang, M.; Yan, D.; Yu, Y.; Yang, Z. SPEI-Based Spatiotemporal Analysis of Drought in Haihe River Basin from 1961 to 2010. Adv. Meteorol. 2016, 2016, 1–10. [Google Scholar] [CrossRef]
- Hui-Mean, F.; Yusop, Z.; Yusof, F. Drought Analysis and Water Resource Availability Using Standardized Precipitation Evapotranspiration Index. Atmos. Res. 2018, 201, 102–115. [Google Scholar] [CrossRef]
- Feng, W.; Lu, H.; Yao, T.; Yu, Q. Drought Characteristics and Its Elevation Dependence in the Qinghai–Tibet Plateau during the Last Half-Century. Sci. Rep. 2020, 10, 14323. [Google Scholar] [CrossRef]
- Ogunrinde, A.T.; Olasehinde, D.A.; Olotu, Y. Assessing the Sensitivity of Standardized Precipitation Evapotranspiration Index to Three Potential Evapotranspiration Models in Nigeria. Sci. Afr. 2020, 8, e00431. [Google Scholar] [CrossRef]
- Wang, Q.; Zeng, J.; Qi, J.; Zhang, X.; Zeng, Y.; Shui, W.; Xu, Z.; Zhang, R.; Wu, X.; Cong, J. A Multi-Scale Daily SPEI Dataset for Drought Characterization at Observation Stations over Mainland China from 1961 to 2018. Earth Syst. Sci. Data 2021, 13, 331–341. [Google Scholar] [CrossRef]
- Jabbi, F.F.; Li, Y.; Zhang, T.; Bin, W.; Hassan, W.; Songcai, Y. Impacts of Temperature Trends and Spei on Yields of Major Cereal Crops in the Gambia. Sustainability 2021, 13, 12480. [Google Scholar] [CrossRef]
- Borona, P.; Busch, F.; Krueger, T.; Rufin, P. Uncertainty in Drought Identification Due to Data Choices, and the Value of Triangulation. Water 2021, 13, 3611. [Google Scholar] [CrossRef]
- Polong, F.; Chen, H.; Sun, S.; Ongoma, V. Temporal and Spatial Evolution of the Standard Precipitation Evapotranspiration Index (SPEI) in the Tana River Basin, Kenya. Theor. Appl. Climatol. 2019, 138, 777–792. [Google Scholar] [CrossRef]
- Ayugi, B.; Tan, G.; Rouyun, N.; Zeyao, D.; Ojara, M.; Mumo, L.; Babaousmail, H.; Ongoma, V. Evaluation of Meteorological Drought and Flood Scenarios over Kenya, East Africa. Atmosphere 2020, 11, 307. [Google Scholar] [CrossRef]
- Nguvava, M.; Abiodun, B.J.; Otieno, F. Projecting Drought Characteristics over East African Basins at Specific Global Warming Levels. Atmos. Res. 2019, 228, 41–54. [Google Scholar] [CrossRef]
- Tirivarombo, S.; Osupile, D.; Eliasson, P. Drought Monitoring and Analysis: Standardized Precipitation Evapotranspiration Index (SPEI) and Standardised Precipitation Index (SPI). Phys. Chem. Earth 2018, 106, 1–10. [Google Scholar] [CrossRef]
- Al-Najjar, H.; Ceribasi, G.; Dogan, E.; Abualtayef, M.; Qahman, K.; Shaqfa, A. Stochastic Time-Series Models for Drought Assessment in the Gaza Strip (Palestine). J. Water Clim. Chang. 2020, 11, 85–114. [Google Scholar] [CrossRef]
- Hao, Y.; Baik, J.; Fred, S.; Choi, M. Comparative Analysis of Two Drought Indices in the Calculation of Drought Recovery Time and Implications on Drought Assessment: East Africa’s Lake Victoria Basin. Stoch. Environ. Res. Risk Assess. 2021. [Google Scholar] [CrossRef]
- Salimi, H.; Asadi, E.; Darbandi, S. Meteorological and Hydrological Drought Monitoring Using Several Drought Indices. Appl. Water Sci. 2021, 11, 11. [Google Scholar] [CrossRef]
- Pei, Z.; Fang, S.; Wang, L.; Yang, W. Comparative Analysis of Drought Indicated by the SPI and SPEI at Various Timescales in Inner Mongolia, China. Water 2020, 12, 1925. [Google Scholar] [CrossRef]
- Wang, J.; Lin, H.; Huang, J.; Jiang, C.; Xie, Y.; Zhou, M. Variations of Drought Tendency, Frequency, and Characteristics and Their Responses to Climate Change under CMIP5 RCP Scenarios in Huai River Basin, China. Water 2019, 11, 2174. [Google Scholar] [CrossRef]
- Hu, Z.; Liu, S.; Zhong, G.; Lin, H.; Zhou, Z. Modified Mann-Kendall Trend Test for Hydrological Time Series under the Scaling Hypothesis and Its Application. Hydrologic. Sci. J. 2020, 65, 2419–2438. [Google Scholar] [CrossRef]
- Sen, P.K. Estimates of the Regression Coefficient Based on Kendall’s Tau. J. Am. Stat. Assoc. 1968, 63, 1379–1389. [Google Scholar] [CrossRef]
- Theil, H. A RankInvariant Method of Linear and Polynomial Regression Analysis, I, II, III. Proc. K. Ned. Akad. Wet. Ser. A Math. Sci. 1950, 53, 386–392, 521–525, 1397–1412. [Google Scholar]
- Schneiderbauer, S.; Baunach, D.; Pedoth, L.; Renner, K.; Fritzsche, K.; Bollin, C.; Pregnolato, M.; Zebisch, M.; Liersch, S.; López, M.d.R.R.; et al. Spatial-Explicit Climate Change Vulnerability Assessments Based on Impact Chains. Findings from a Case Study in Burundi. Sustainability 2020, 12, 6354. [Google Scholar] [CrossRef]
- FSNWG. FSNWG Update-Central & Eastern Africa, 11 March 2010. Humanitarian Emergency Declared in Northern Burundi. 2010. Available online: https://reliefweb.int/report/burundi/fsnwg-update-central-eastern-africa-11-march-2010 (accessed on 19 May 2022).
- Nkunzimana, A.; Shuoben, B.; Guojie, W.; Alriah, M.A.A.; Sarfo, I.; Zhihui, X.; Vuguziga, F.; Ayugi, B.O. Assessment of Drought Events, Their Trend and Teleconnection Factors over Burundi, East Africa. Theor. Appl. Climatol. 2021, 145, 1293–1316. [Google Scholar] [CrossRef]


| Name of Stations | Stations ID | Latitude | longitude | Elevation | Location | Period |
|---|---|---|---|---|---|---|
| Muyinga | 1130 | −2.85 | 30.35 | 1756 | North | 1981~2020 |
| Kirundo | 10079 | −2.58 | 30.11 | 1449 | 1981~2020 | |
| Cankuzo | 10030 | −3.31 | 30.53 | 1652 | East | 1981~2020 |
| Musasa | 10116 | −4.00 | 30.10 | 1260 | Southeast | 1981~2020 |
| Gitega | 10046 | −3.42 | 29.92 | 1645 | Center | 1981~2020 |
| Gisozi | 10044 | −3.56 | 29.68 | 2097 | 1981~2020 | |
| Bujumbura | 10011 | −3.32 | 29.32 | 783 | West | 1981~2020 |
| SPEI Values | Categories of Climatic Moisture |
|---|---|
| ≥2.00 | Extremely wet |
| 1.50 to 1.99 | Severely wet |
| 1.00 to 1.49 | Moderately wet |
| −1.00 to 1.00 | Near normal |
| −1.49 to −1.00 | Moderate dry |
| −1.99 to −1.50 | Severe dry |
| ≤−2 | Extremely dry |
| Station | Timescale | Year | Duration | Severity | Intensity | Months | Category |
|---|---|---|---|---|---|---|---|
| Muyinga | SPEI-2 | 1981 | 3 | −4.25 | −1.42 | October–December | Moderate dry |
| 1982 | 3 | −4.67 | −1.56 | August–October | Severely dry | ||
| 1984 | 3 | −4.67 | −1.56 | January–March | Severely dry | ||
| 1998–1999 | 4 | −8.11 | −2.03 | October–January | Extremely dry | ||
| 2000 | 5 | −7.30 | −1.46 | April–August | Moderate dry | ||
| 2005 | 3 | −4.20 | −1.40 | October–December | Moderate dry | ||
| SPEI-6 | 1982 | 3 | −5.40 | −1.80 | February–April | Severely dry | |
| 1983–1984 | 9 | −14.33 | −1.60 | November–July | Severely dry | ||
| 1996 | 4 | −4.57 | −1.14 | May–August | Moderate dry | ||
| 1998–1999 | 15 | −25.40 | −1.70 | August–October | Severely dry | ||
| 2000 | 7 | −11.70 | −1.67 | April–October | Severely dry | ||
| 2005–2006 | 6 | −8.00 | −1.33 | October–March | Moderate dry | ||
| 2010 | 5 | −6.71 | −1.34 | August–December | Moderate dry | ||
| 2014 | 4 | −5.20 | −1.30 | May–August | Moderate dry | ||
| 2016–2017 | 12 | −16.06 | −1.34 | May–April | Moderate dry | ||
| SPEI-24 | 1999–2001 | 23 | −48.21 | −2.10 | November–September | Extremely dry | |
| 2005–2007 | 18 | −27.33 | −1.52 | December–May | Severely dry | ||
| 2017 | 7 | −9.34 | −1.33 | June–December | Moderate dry | ||
| Kirundo | SPEI-2 | 2007–2008 | 6 | −8.51 | −1.42 | October–March | Moderate dry |
| 2010 | 6 | −8.13 | −1.35 | July–December | Moderate dry | ||
| 2011 | 4 | −5.00 | −1.25 | June–September | Moderate dry | ||
| 2013 | 4 | −5.61 | −1.40 | June–September | Moderate dry | ||
| 2014 | 4 | −5.47 | −1.37 | May–August | Moderate dry | ||
| 2015 | 4 | −5.43 | −1.36 | July–October | Moderate dry | ||
| 2016 | 5 | −7.67 | −1.53 | June–October | Severely dry | ||
| 2020 | 4 | −6.00 | −1.50 | April–July | Severely dry | ||
| SPEI-6 | 2008 | 5 | −7.27 | −1.45 | January–May | Moderate dry | |
| 2009 | 4 | −5.22 | −1.30 | February–May | Moderate dry | ||
| 2010–2011 | 16 | −22.10 | −1.38 | August–November | Moderate dry | ||
| 2012–2013 | 5 | −5.85 | −1.17 | October–February | Moderate dry | ||
| 2013 | 7 | −8.40 | −1.20 | June–December | Moderate dry | ||
| 2014 | 4 | −5.60 | −1.40 | June–September | Moderate dry | ||
| 2015–2016 | 9 | −11.01 | −1.22 | June–February | Moderate dry | ||
| 2016–2017 | 19 | −25.68 | −1.35 | June–December | Moderate dry | ||
| SPEI-24 | 2009–2010 | 9 | −9.72 | −1.08 | May–January | Moderate dry | |
| 2010–2014 | 52 | −62.72 | −1.21 | July–October | Moderate dry | ||
| 2016–2018 | 24 | −32.26 | −1.34 | September–August | Moderate dry | ||
| Cankuzo | SPEI-2 | 2000 | 7 | −11.00 | −1.57 | April–October | Severely dry |
| 2002 | 4 | −6.24 | −1.56 | July–October | Severely dry | ||
| 2003 | 4 | −4.46 | −1.12 | July–October | Moderate dry | ||
| 2005 | 6 | −10.40 | −1.73 | July–December | Severely dry | ||
| 2008 | 3 | −4.80 | −1.20 | Ape–June | Moderate dry | ||
| SPEI-6 | 1999 | 7 | −13.21 | −1.90 | January–July | Severely dry | |
| 2000 | 11 | −18.04 | −1.64 | February–December | Severely dry | ||
| 2004 | 4 | −5.60 | −1.40 | May–August | Moderate dry | ||
| 2005–2006 | 15 | −24.40 | −1.63 | February–April | Severe dry | ||
| 2009 | 4 | −5.33 | −1.33 | January–April | Moderate dry | ||
| 2011 | 5 | −7.10 | −1.42 | January–May | Moderate dry | ||
| SPEI-24 | 1999–2002 | 28 | −44.16 | −1.60 | December–March | Severely dry | |
| 2004–2007 | 33 | −52.00 | −1.60 | May–January | Severely dry | ||
| 2008–2010 | 17 | −21.30 | −1.26 | November–March | Moderate dry | ||
| Musasa | SPEI-2 | 1981 | 3 | −4.43 | −1.47 | October–December | Moderate dry |
| 1983 | 3 | −4.07 | −1.36 | October–December | Moderate dry | ||
| 1986 | 3 | −4.36 | −1.45 | August–October | Moderate dry | ||
| 1933 | 4 | −6.55 | −1.64 | September–December | Severely dry | ||
| 2000 | 4 | −5.45 | −1.11 | May–August | Moderate dry | ||
| 2011 | 3 | −4.00 | −1.33 | April–June | Moderate dry | ||
| 2013 | 3 | −4.32 | −1.44 | February–April | Moderate dry | ||
| 2014 | 3 | −4.21 | −1.40 | February–April | Moderate dry | ||
| 2015 | 4 | −5.35 | −1.34 | January–April | Moderate dry | ||
| 2015–2016 | 5 | −8.53 | −1.70 | December–April | Severely dry | ||
| 2019 | 3 | −4.48 | −1.50 | February–April | Severely dry | ||
| 2020 | 3 | −4.16 | −1.38 | February–April | Moderate dry | ||
| SPEI-6 | 1981–1982 | 3 | −4.67 | −1.56 | November–January | Severely dry | |
| 1983–1984 | 4 | −6.57 | −1.64 | November–February | Severely dry | ||
| 1990 | 3 | −3.31 | −1.10 | October–December | Moderate dry | ||
| 1993–1994 | 5 | −9.72 | −1.94 | October–February | Severely dry | ||
| 1995 | 3 | −3.70 | −1.23 | September–November | Moderate dry | ||
| 2005 | 6 | −8.56 | −1.43 | April–September | Moderate dry | ||
| 2012 | 3 | −4.47 | −1.50 | March–May | Severely dry | ||
| 2013 | 3 | −3.78 | −1.26 | May–July | Moderate dry | ||
| 2015 | 4 | −5.12 | −1.28 | March–June | Moderate dry | ||
| 2016 | 6 | −11.76 | −1.96 | February–July | Severely dry | ||
| 2019 | 5 | −6.87 | −1.37 | February–June | Moderate dry | ||
| 2020 | 4 | −5.05 | −1.26 | March–June | Moderate dry | ||
| SPEI-24 | 1993–1994 | 13 | −17.74 | −1,36 | October–October | Moderate dry | |
| 2000 | 10 | −15.06 | −1.51 | March–December | Severely dry | ||
| 2004 | 5 | −6.30 | −1.26 | March–July | Moderate dry | ||
| 2005–2006 | 21 | −30.34 | −1.44 | March–November | Moderate dry | ||
| 2009 | 8 | −9.78 | −1.22 | January–August | Moderate dry | ||
| 2011–2012 | 9 | −17.21 | −1.91 | November–July | Severely dry | ||
| Gitega | SPEI-2 | 1986 | 3 | −5.00 | −1.70 | August–October | Severely dry |
| 1993 | 3 | −6.35 | −2.12 | September–November | Extremely dry | ||
| 1998 | 3 | −6.36 | −2.12 | October–December | Extremely dry | ||
| 2000 | 8 | −13.47 | −1.68 | January–August | Severely dry | ||
| 2002 | 3 | −6.00 | −2.00 | June–August | Extremely dry | ||
| 2004 | 3 | −5.24 | −1.75 | May–July | Severely dry | ||
| 2005 | 4 | −5.23 | −1.30 | January–April | Moderate dry | ||
| 2012 | 3 | −4.72 | −1.57 | January–March | Severely dry | ||
| SPEI-6 | 1993–1994 | 6 | −10.78 | −1.80 | September–February | Severely dry | |
| 1998 -1999 | 7 | −13.25 | −1.90 | October–April | Severely dry | ||
| 2000 | 8 | −17.72 | −2.22 | February–September | Extremely dry | ||
| 2003 | 4 | −5.86 | −1.46 | May–August | Moderate dry | ||
| 2005 | 8 | −12.20 | −1.53 | March–October | Severely dry | ||
| 2012 | 4 | −5.72 | −1.43 | March–June | Moderate dry | ||
| 2019 | 5 | −7.61 | −1.52 | January–May | Severely dry | ||
| SPEI-24 | 1993 | 3 | −4.12 | −1.37 | October~ December | Moderate dry | |
| 1994 | 4 | −4.20 | −1.05 | March–June | Moderate dry | ||
| 1994–1995 | 7 | −8.30 | −1.18 | October–April | Moderate dry | ||
| 2000 | 11 | −23.28 | −2.12 | January–November | Extremely dry | ||
| 2003 | 5 | −6.22 | −1.24 | August–December | Moderate dry | ||
| 2004 | 5 | −5.50 | −1.10 | March–July | Moderate dry | ||
| 2004–2006 | 20 | −25.61 | −1.28 | November–June | Moderate dry | ||
| 2012 | 6 | −7.12 | −1.18 | February–July | Moderate dry | ||
| 2018–2019 | 10 | −12.54 | −1.25 | October–July | Moderate dry | ||
| Gisozi | SPEI-2 | 1992 | 3 | −4.18 | −1.40 | April–June | Moderate dry |
| 1993 | 4 | −5.41 | −1.35 | September–December | Moderate dry | ||
| 1998 ~1999 | 4 | −7.70 | −1.92 | October–January | Severely dry | ||
| 2000 | 9 | −16.00 | −1.77 | February–December | Severely dry | ||
| 2005 | 2 | −4.12 | −2.06 | March–April | Extremely dry | ||
| 2019 | 3 | −5.17 | −1.72 | April–June | Severely dry | ||
| SPEI-6 | 1982 | 3 | −5.67 | −1.42 | January–March | Moderate dry | |
| 1992 | 4 | −5.92 | −1.48 | May–August | Moderate dry | ||
| 1993–1994 | 13 | −17.84 | −1.37 | March–February | Moderate dry | ||
| 1998–1999 | 6 | −12.78 | −2.13 | November–April | Extremely dry | ||
| 2000–2001 | 13 | −25.26 | −1.94 | March–March | Severely dry | ||
| 2005 | 5 | −6.80 | −1.36 | March–July | Moderate dry | ||
| 2019 | 5 | −7.42 | −1.48 | April–August | Moderate dry | ||
| SPEI-24 | 1993–1995 | 26 | −39.27 | −1.51 | September–October | Severely dry | |
| 2000–2002 | 26 | −44. 05 | −1.69 | February–March | Severely dry | ||
| 2005–2006 | 14 | −18.60 | −1.33 | March–April | Moderate dry | ||
| 2018 | 8 | −10.07 | −1.25 | February–September | Moderate dry | ||
| 2019 | 4 | −4.76 | −1.19 | April–July | Moderate dry | ||
| Bujumbura | SPEI-2 | 1995–1996 | 6 | −10.00 | −1.66 | August–January | Moderate dry |
| 1997 | 4 | −8.00 | −2.00 | January–April | Extremely dry | ||
| 2000 | 2 | −4.04 | −2.04 | May–June | Extremely dry | ||
| 2004 | 3 | −5.28 | −1.76 | June–August | Moderate dry | ||
| 2016 | 3 | −4.50 | −1.50 | October–December | Moderate dry | ||
| SPEI-6 | 1993 | 4 | −5.89 | −1.47 | September–December | Moderate dry | |
| 1994 | 4 | −5.12 | −1.28 | February–May | Moderate dry | ||
| 1995–1996 | 8 | −12.06 | −1.51 | October–May | Severely dry | ||
| 1997 | 9 | −16.87 | −1.87 | January–September | Severely dry | ||
| 1999 | 6 | −9.00 | −1.50 | January–June | Severely dry | ||
| 2000 | 5 | −9.01 | −1.80 | June–October | Severely dry | ||
| 2003 | 5 | −5.62 | −1.12 | April–August | Moderate dry | ||
| 2004 | 9 | −11.73 | −1.30 | February–November | Moderate dry | ||
| 2016–2017 | 8 | −11.71 | −1.46 | October–May | Moderate dry | ||
| SPEI-24 | 1994–1999 | 60 | −90.34 | −1.50 | February–February | Severely dry | |
| 2003–2004 | 14 | −19.83 | −1.42 | November–December | Moderate dry | ||
| 2017 | 12 | −13.61 | −1.13 | January–December | Moderate dry |
| Regions | Stations | Z-Value | Sen’s Slope | ||||
|---|---|---|---|---|---|---|---|
| SPEI-2 | SPEI-6 | SPEI-24 | SPEI-2 | SPEI-6 | SPEI-24 | ||
| North | Muyinga | 1.86 * | 0.28 | 1.53 | 0.00 | 0.00 | 0.00 |
| Kirundo | −13.75 ** | −15.86 ** | −17.29 ** | 0.00 | 0.00 | 0.00 | |
| East | Cankuzo | −2.74 ** | −3.73 ** | −6.16 ** | 0.00 | 0.00 | 0.00 |
| South East | Musasa | −0.06 | −1.79 | −3.81 ** | 0.00 | 0.00 | 0.00 |
| Center | Gitega | −1.14 | −3.43 ** | −5.92 ** | 0.00 | 0.00 | 0.00 |
| Gisozi | 1.21 | 0.93 | 2.75 ** | 0.00 | 0.00 | 0.00 | |
| Ouest | Bujumbura | 1.77 | 1.80 | 3.42 ** | 0.00 | 0.00 | 0.00 |
Publisher’s Note: MDPI stays neutral with regard to jurisdictional claims in published maps and institutional affiliations. |
© 2022 by the authors. Licensee MDPI, Basel, Switzerland. This article is an open access article distributed under the terms and conditions of the Creative Commons Attribution (CC BY) license (https://creativecommons.org/licenses/by/4.0/).
Share and Cite
Ndayiragije, J.M.; Li, F. Monitoring and Analysis of Drought Characteristics Based on Climate Change in Burundi Using Standardized Precipitation Evapotranspiration Index. Water 2022, 14, 2511. https://doi.org/10.3390/w14162511
Ndayiragije JM, Li F. Monitoring and Analysis of Drought Characteristics Based on Climate Change in Burundi Using Standardized Precipitation Evapotranspiration Index. Water. 2022; 14(16):2511. https://doi.org/10.3390/w14162511
Chicago/Turabian StyleNdayiragije, Jean Marie, and Fan Li. 2022. "Monitoring and Analysis of Drought Characteristics Based on Climate Change in Burundi Using Standardized Precipitation Evapotranspiration Index" Water 14, no. 16: 2511. https://doi.org/10.3390/w14162511
APA StyleNdayiragije, J. M., & Li, F. (2022). Monitoring and Analysis of Drought Characteristics Based on Climate Change in Burundi Using Standardized Precipitation Evapotranspiration Index. Water, 14(16), 2511. https://doi.org/10.3390/w14162511