Article

A Field Study for the Effects of Grass Cover, Rainfall Intensity and Slope Length on Soil Erosion in the Loess Plateau, China

1
College of Surveying and Geoinformation, North China University of Water Resources and Electric Power, Zhengzhou 450046, China
2
Key Laboratory of Soil and Water Loss Process and Control on the Loess Plateau of Ministry of Water Resources, Yellow River Institute of Hydraulic Research, Zhengzhou 450003, China
3
Key Laboratory of State Forestry Administration on Soil and Water Conservation, School of Soil and Water Conservation, Beijing Forestry University, Beijing 100083, China
*
Author to whom correspondence should be addressed.
Water 2022, 14(14), 2142; https://doi.org/10.3390/w14142142
Submission received: 22 April 2022 / Revised: 29 June 2022 / Accepted: 30 June 2022 / Published: 6 July 2022

Abstract

:
Slope length is an important topographic factor for controlling soil erosion. There exists limited knowledge of the interactions of slope length, vegetation restoration, and rainfall intensity on soil erosion. This study investigated the impact of the slope length on soil erosion for different grass coverages and different rainfall intensities via simulated rainfall experiments. The experiments included five rainfall intensity treatments (1, 1.5, 2, 2.5, and 3 mm min−1), four grass cover treatments (0%, 30%, 60%, and 90%), and five slope length treatments (2, 4, 6, 8, and 10 m). The change process of soil loss was significantly different (p < 0.05) for different slope lengths. The trend of soil loss changing with slope length is: under a grass cover of 0 or 30%, the soil erosion increased exponentially with increasing slope length. However, under a grass cover of 60%, the soil erosion rate peaked at a slope length of 8 m, and under a grass cover of 90%, the soil erosion rate peaked at a slope length of 6 m. At rainfall intensities of 1.5–2 mm min−1, the overall soil erosion amount was small. The soil loss increased drastically with slope length when the rainfall intensity exceeded 2 mm min−1. Compared with a slope length of 2 m, longer slope lengths increased the erosion rate by 225–930% under different grass coverages treatments. Regression analysis showed that grass cover and rainfall intensity change the trend of erosion with slope length, and the negative effect of slope length on erosion is strengthened with the increase of grass cover, while this negative effect gradually weakens with the increase of rainfall intensity.

1. Introduction

Soil erosion is a form of soil degradation that severely threatens the sustainable development of ecosystems worldwide. It destroys the soil structure and causes a decline of soil fertility and ground surface fragmentation, which is closely related to water pollution and the sedimentation of rivers and reservoirs [1]. Many factors affect soil erosion, such as rainfall characteristics, ground cover, ground morphology, and soil characteristics [2]. Therefore, it is essential to investigate the underlying mechanism and control factors of soil erosion processes under multifactor interaction to improve erosion management, mitigate land degradation, and promote the sustainability of land-water ecosystems.
Hillslopes are an important source of erodible sediment. The contribution of erosion in sloping farmlands to soil loss may reach 60% in the heavily eroded Loess Plateau [3]. The Chinese government encourages the conversion of sloped arable land into grassland, bush, or forests through the implementation of the Project of Returning Farmland to Forest and Grass [4]. This project aims to protect soil and water resources and restore already damaged areas [5]. The role of vegetation for controlling soil erosion has received widespread attention [6,7]. The interception of the vegetation canopy decreases the final velocity and the number of raindrops that reach the soil surface [8]. The vegetation litter increases the roughness of the slope surface and decreases the flow velocity [9]. The roots of the vegetation improve soil parameters, such as soil porosity, bulk density, and organic matter content [10]. Consequently, they increase the soil infiltration volume and infiltration depth [11]. Roots also enhance the water-stable aggregate content and the network bonding of the root system increases the erosion resistance of the soil [12]. Soil erosion decreases with coverage rates following a linear or exponential function; however, when the coverage rate reaches a certain level (i.e., the threshold), the effects of the vegetation toward reducing soil erosion remain stable [13,14]. However, increased vegetation coverage (especially in artificial forests and grasslands that have previously been farmland) has increased the soil moisture and triggered the emergence of dry soil layers [15]. Feng et al. evaluated the vegetation capacity threshold for the Loess Plateau and found that the vegetation approached sustainable water resource limitation [16]. Therefore, analyzing the control effects of different vegetation coverages on soil erosion is very important for the regional vegetation restoration strategy.
The active global hydrological cycle has aggravated soil erosion caused by runoff [17], and the water erosion across large areas of the world is caused by strong or extreme rainfall events [7]. The impact of rainfall on soil erosion mainly manifests in four aspects. The first aspect is the splashing of soil particles by rainfall, which promotes soil erosion [18]. The second aspect is that rainfall characteristics control both the generation and amount of runoff on slopes [19]. The third aspect is that the impact of raindrops increases the turbulence of runoff and enhances its sediment transport capacity [20]. The fourth aspect is that rainfall intensity impacts the surface soil structure, which in turn affects both slope infiltration and runoff [16]. Rachman et al. suggested that rainfall intensity severely affected runoff and soil erosion processes, and a rainfall intensity of 1–2 mm min−1 could cause runoff, while a rainfall intensity above 2 mm min−1 causes flooding in arid environments [21]. Wu et al. investigated soil erosion under four erosion degrees and found that soil properties, rainfall intensity, and rainfall duration control both the erosion process and sediment delivery [22].
The slope length is an important topographic factor that affects erosion and sediment transport [23]. It determines the changes along the slope water flow energy by changing the rain-receiving area, which in turn, affects the movements of water and sediment. There are currently three different views on the effect of slope length on erosion. The first view implies that the sediment content in the runoff increases with slope length, and the flow energy is mostly consumed by sediment carrying, which weakens erosion [24]. The second view implies that as the water depth gradually increases (from uphill to downhill), erosion increases correspondingly [25]. The third view implies that the amount of erosion changes as a wave with increasing slope length [26]. Bagarello and Ferro analyzed natural rainfall data in natural plots and showed that for slope lengths ranging within 11–33 m, the erosion modulus of the inter rill erosion was proportional to the power of the slope length [27]. Liu et al. showed that the soil loss of forest, shrub, and grass-covered slopes decreased with increasing slope length, and short slopes responded quicker to this change [28]. Smets et al. found that variability in the effectiveness of different surface covers (rock debris, organic cover, and vegetation cover) in reducing runoff and erosion was strongly correlated with slope length. For slopes less than 11 m, the effectiveness of surface cover in reducing erosion varied considerably. However, as slope length increases (up to 50 m), this variability decreases and surface cover of rock debris, organic mulch and vegetation becomes more effective in reducing soil loss due to water erosion. A possible reason for this is that vegetation reduces soil erodibility and increases critical shear stress [29]. Due to the influences imposed by topography, vegetation coverage, rainfall intensity, and other relevant factors, different experiments may find different results, which complicates the identification of the relationship between slope length and erosion intensity. The above-reviewed studies that investigated soil erosion in response to vegetation coverage, rainfall intensity, and slope length were mostly at the small watershed scale. This reflects the pooled effects of vegetation restoration, which drives erosion and sediment changes; however, the process and dynamic mechanism underlying the influence of vegetation restoration on soil erosion has not received much attention. In the context of ecological restoration of vegetation and increasing prevalence of extreme rainfall events, the interactions of slope length, vegetation restoration, and rainfall intensity on soil erosion have not been reported to date. To fill these gaps, this study addressed the effect of slope length on soil erosion with different vegetation coverages and rainfall intensities under extreme rainfall events under the background of vegetation restoration. The specific objectives were to: (1) investigate the impact of slope length on soil loss, (2) identify the changes of these effects with grass coverage and rainfall intensity, and (3) quantify the relationship of soil loss with slope length, grass cover, and rainfall intensity.

2. Materials and Methods

2.1. Study Area

The experiment was conducted in the Luoyugou watershed (34°34′–34°40′ N, 105°30′–105°40′ E; 1199.8–1896.9 m elevation), which is a typical region in western China (Figure 1). The density of the gully was 3.54 km/km2 and the average slope was 18° [30]. The annual average temperature in this region ranges between 7–11 °C. The annual average precipitation is about 533.7 mm, about 80% of which occur between May and October [31]. In this area, precipitation is predominantly classified as heavy rain, which occurs over a small area, characterized by short duration and high intensity. The main types of soil in the study area are cinnamon soil, black loess soil, and red clay. The soil in the study area has poor resistance to soil erosion and is readily broken. The average annual erosion modulus in the study area is 5510 t km−2 a−1 [30,31]. The agricultural land accounts for 55.0% of the total area of Luoyugou watershed, natural vegetation is poor, coverage is about 30.0%. The main crops are wheat, corn, yams, etc. [30]. The arbors in the watershed are all artificial vegetation, and the shrubs are all-natural growth. There are more than 230 species of 49 families of higher plants in the watershed, among which arbors trees mainly include silver poplar (Pop-ulus olba), dry willow (Salix malsuclama Roidz), white elm (Uemus Pumila), acacia (Ro-binia pseudoacacia), toon (Toona sinensis Roem), and 39 other species. 19 species of shrubs mainly including wolfsbane (Sophora viciifolia Honce), purple-fringed locust (Amorpha fruticosa), and pepper (Zanthoxyhum bungeanum Maxim). There are 172 species of her-baceous plants in the legume family, such as alfalfa (Medicago sativa), grass miscanthus (Meli sucuealens Ledeb), lychee (Aeeuro lopidium clasy), white grass (Bothriochia ischaemum) and artemisia [30,31]. Due to the destruction of artificial logging and overgrazing, a large area of barren slope has been formed and cultivated by rotation, and the vegetation is decreasing year by year.
After an in-situ investigation and comparison, 10 experimental plots were selected on the hillslope of a natural wasteland (tillage had been abandoned for 20 years) in the lower reaches of the Luoyugou watershed. The hillslope of the plots was 15° and the elevation was 1500 m. The plots were 10 m long and 2 m wide. The natural vegetation consists of grasses, mainly Coronilla varia L. and Eriophorum comosum Nees. The management of these plots continued throughout the life cycle of the vegetation. Two plots were kept bare, three plots were transformed to high-cover grassland by regular watering, and three plots were transformed to low-cover grassland by daily pruning. Two further untreated plots reflected the natural restoration of the hillslope. The experiment was conducted from June to September 2017, 2018 and 2019. Table 1 describes the vegetation status of the study area. Table 2 describes soil physical properties of experimental plots.

2.2. Experimental Set-Up

The QYJY-501 rainfall device (Qing yuan, Xi’an, China) was used. Five groups of rainfall nozzles were used, each with three different aperture sizes. During rainfall simulation, different rainfall intensities were achieved by using different nozzle combinations and pressures. Rainfall intensity was controlled via real-time rain gauge data feedback. With respect to raindrop velocity and raindrop size, the uniformity of the simulated rainfall exceeded 80%. A Thies LAM Laser Raindrop Spectrometer was used to record both the velocity and size of raindrops during rainfall experiments.

2.3. Experimental Treatments

According to the local seasonal rainfall [30] and vegetation coverage characteristics [29], orthogonal experiments of slope length (2, 4, 6, 8, 10 m) and grass covered (0, 30%, 60%, 90%) were designed under 1.5 mm/min rainfall intensity, a of 20 experiment groups. In view of the increasing trend of extreme rainfall in the Loess Plateau [32], in order to quantify the impact of natural vegetation restoration on soil erosion control under extreme rainfall conditions, orthogonal experiments of slope length (2, 4, 6, 8, 10 m) and rainfall intensity (1, 1.5, 2, 2.5, 3 mm/min) were designed were designed under the natural grass cover (60%), a total of 25 experiment groups.
Regarding the design of the slope length, a 10 m slope length experiment was first carried out, and then, a marble slab was used to divide 2 m from the top of the slope to construct an 8 m slope length experimental plot. A rain cloth was used to cover the divided upper area during the rainfall experiment. There was a water outlet between the division 2 m from the top of the slope and the boundary of the plot to avoid the precipitation influencing the covered area on the plot length of the test slope. This process was repeated to setup experiments with slope lengths of 6 m, 4 m, and 2 m. The day before the experiment, a WET soil moisture meter was used to measure the soil moisture content.
The time required for runoff to be generated was recorded and all flow discharge from each plot was collected at the outlet every 2 min, including all suspended and bed sediments. The water flow velocity was obtained by the dye method. The time for the dye (KMnO4) to pass a certain length (0.5 m) in the water flow was recorded, and the water flow velocity was calculated. The velocity measurement started after the apparent runoff had occurred on the slope and continued until the end of the simulated rainfall. For plots with a length of 10 m, the flow velocity was measured 1, 3, 5, 7, and 9 m from the top of the slope, while for plots with a length of 8 m flow velocity was measured 1, 3, 5, and 7 m from the top of the slope. For plots with a length of 2 m, the flow velocity was measured 1 m from the top of the slope. However, the dye method can only measure the maximum surface velocity, not the average velocity. This experiment used the method of Chen et al. to obtain the average velocity of the water flow [33]. A straight edge was used to measure the flow depth on the slope, and the measuring position was the same as that used for measuring the velocity. Once rainfall had been simulated for 60 min, runoff samples were measured volumetrically and allowed to stand for 12 h, after which, most of the clean water was poured out. Then, the sediment was dried to obtain its dry weight.

2.4. Indexes Calculation

Rainfall erosivity (R) is an index by which to quantify the rainfall energy. Rainfall erosivity was calculated by:
e m = 0.29 [ 1 0.72 e x p 0.05 i m ]
E = i = 1 n P i e m i
R = E I 30
where e m is the break-point rainfall kinetic energy (MJ ha−1 mm−1), i m is the break-point rainfall intensity (mm h−1), E is the total kinetic energy of the rainfall event (MJ ha−1), and P i and e m i are the rainfall amount (mm) and kinetic energy of the ith break point of a storm event. I 30 is the maximum 30 min rainfall intensity. In the current study, the rainfall intensity was stable during the rainfall event. Therefore, the rainfall erosivity was a function of the rainfall duration and actual rainfall intensity.
Stream power (ω, W m−2) is an effective indicator used to represent the energy of overland flow on hillslopes. The stream power can be calculated by:
ω = ρ g h S u = ρ g S q
where ρ is the water density (assume to be 1000 kg m−3), g is the gravitational acceleration (m s−2), S is the slope gradient (m m−1), q is the unit discharge (m2 s−1), and u is the mean flow velocity (m s−1).

2.5. Data Analysis

The slope length effect of soil erosion (ELI) for a given grass cover and rainfall intensity is defined as the ratio of the soil erosion rate to the reduction rate at a slope length of 2 m. The ELI was calculated by:
E L I = S L R i S L R 2 / S L R 2
where SLRi represents the erosion rate of the i slope length (g m−2 min−1) and SLR2 represents the erosion rate at the 2 m slope (g m−2 min−1).

3. Results

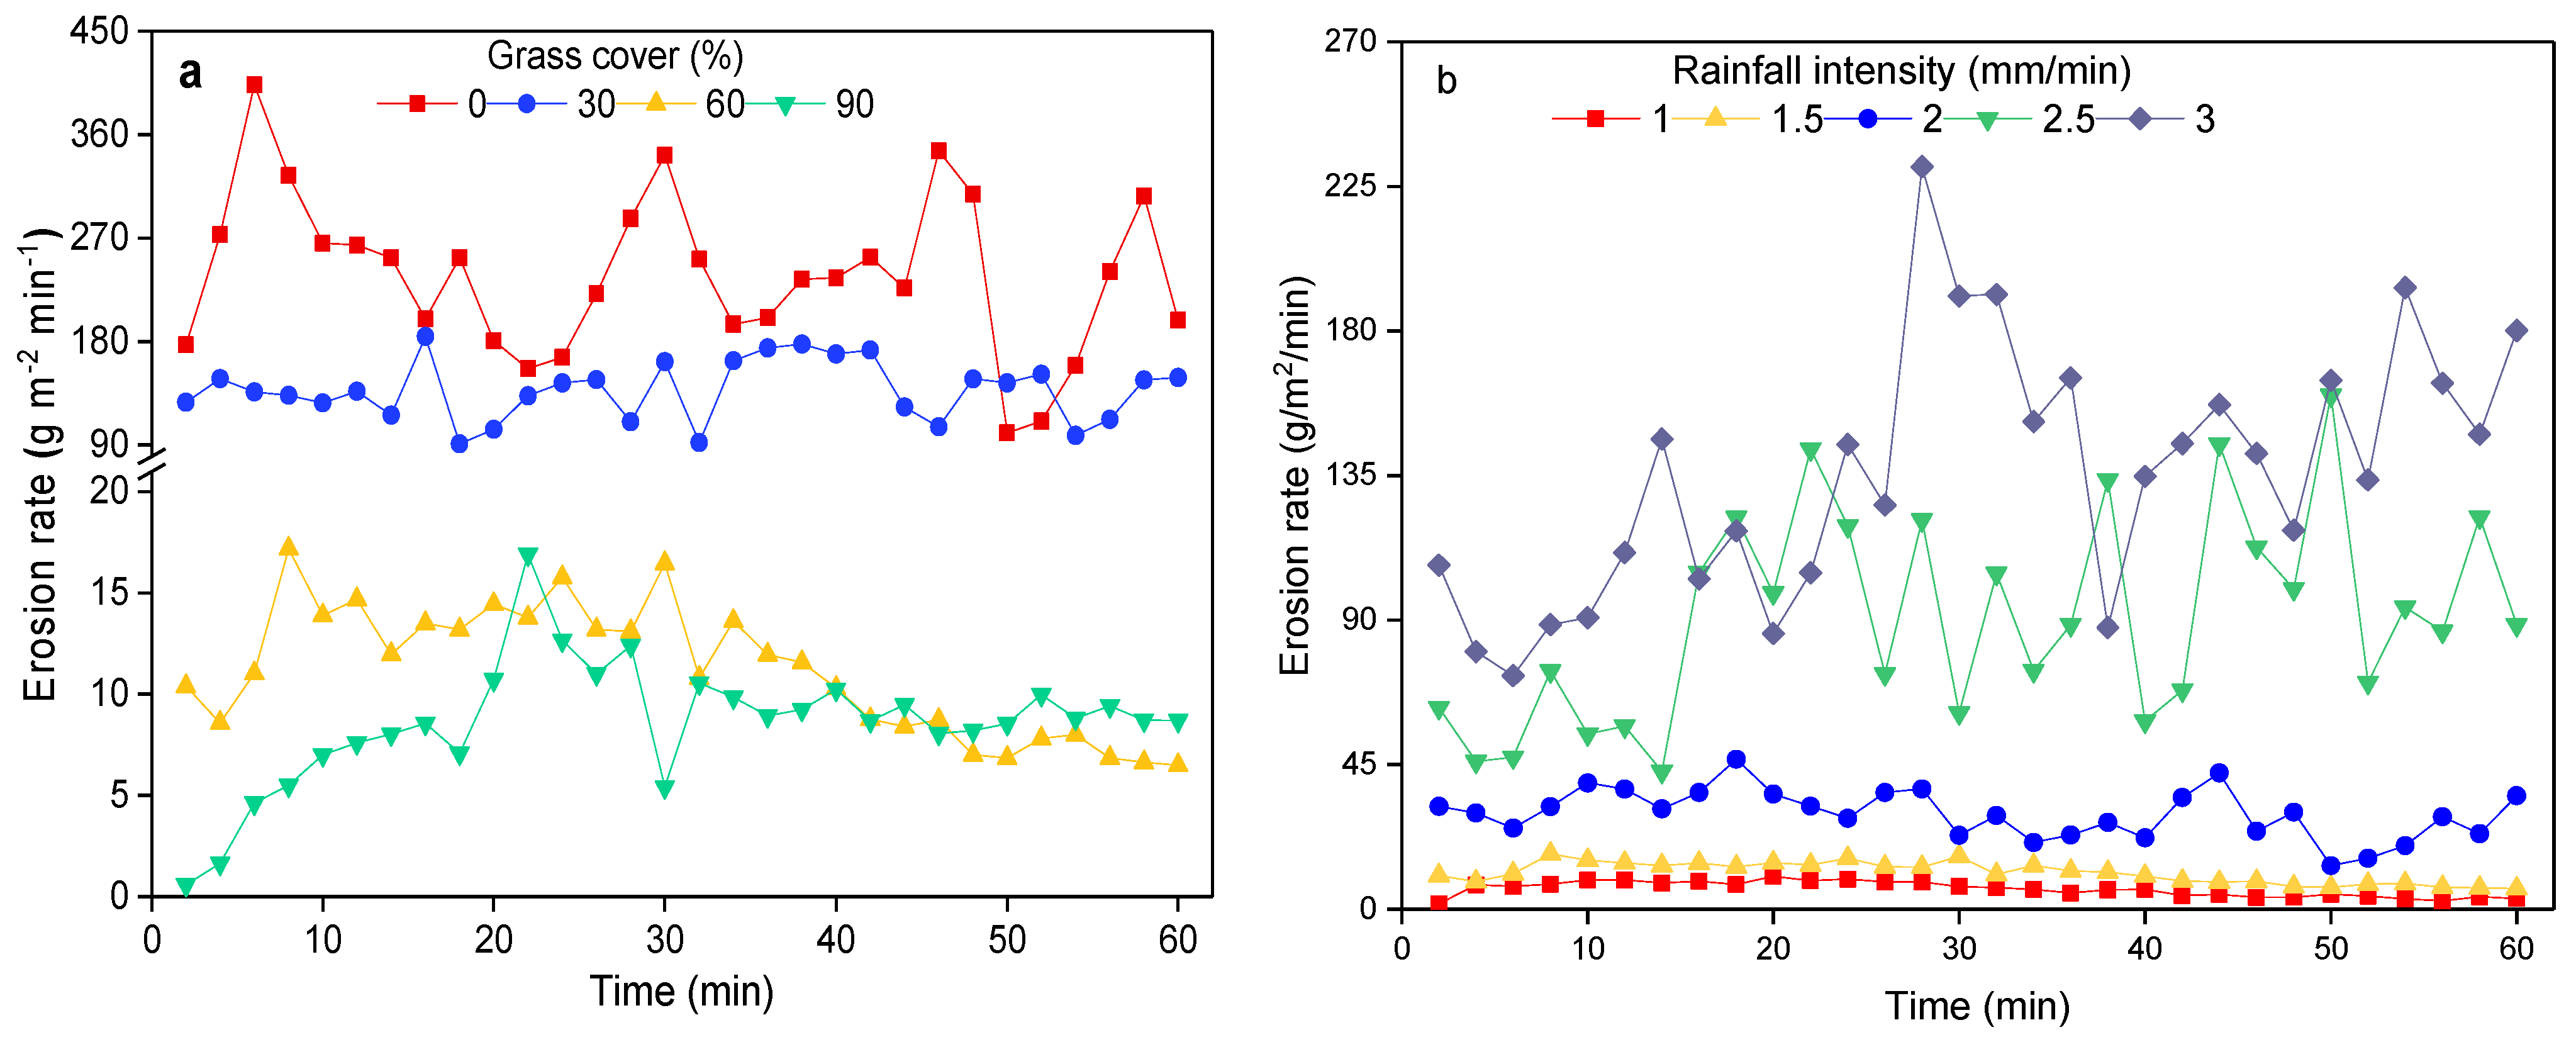
3.1. Soil Erosion Process

The soil erosion process differed in different treatments (Figure 2). Under a rainfall intensity of 1.5 mm/min, the range of erosion rate for bare slopes and 30% grass cover was 90–400 g m−2 min−1, and the range of erosion rate for 60% and 90% grass cover was 0–20 g m−2 min−1. The increased rainfall intensity caused increased soil loss. The erosion rate under rainfall intensities of 2.5 and 3 mm min−1 increased linearly with the time of continuous rainfall. The higher the rainfall intensity, the higher the rate of the increase. The soil loss process was divided into two stages: rapid increase and stable fluctuation. Grass cover decreased the rate of increase and the duration at the first stage and the fluctuation range at the second stage. The denser the coverage, the stronger the effect. Rainfall intensity had the opposite effect. Tukey’s HSD method was used to analyze the differences of water and sand parameters at different slope lengths. Under different hydraulic conditions, significant differences were found in the process of soil loss and changes in sand content of different slope lengths (p < 0.05) (Table 3 and Table 4). This difference was determined by the differences in runoff, runoff width, and runoff between different slope lengths (p < 0.05) (Table 3 and Table 4). Correlation analysis showed that slope length is significantly positively correlated with flow depth and flow velocity (p < 0.01) (Table 5). The amount of soil erosion increased with slope length, but the associated growth rate gradually decreased. With increasing slope length, the sand content followed a decreasing trend at first and then increased. Under different slope lengths, compared with bare slopes, the average soil loss of grass covers decreased by 47–90%, and the average reduction was 70%. Compared with a rainfall intensity of 1 mm min−1, the average soil erosion of other rainfall intensity increased 2–13 times, and the average increased 7 times.

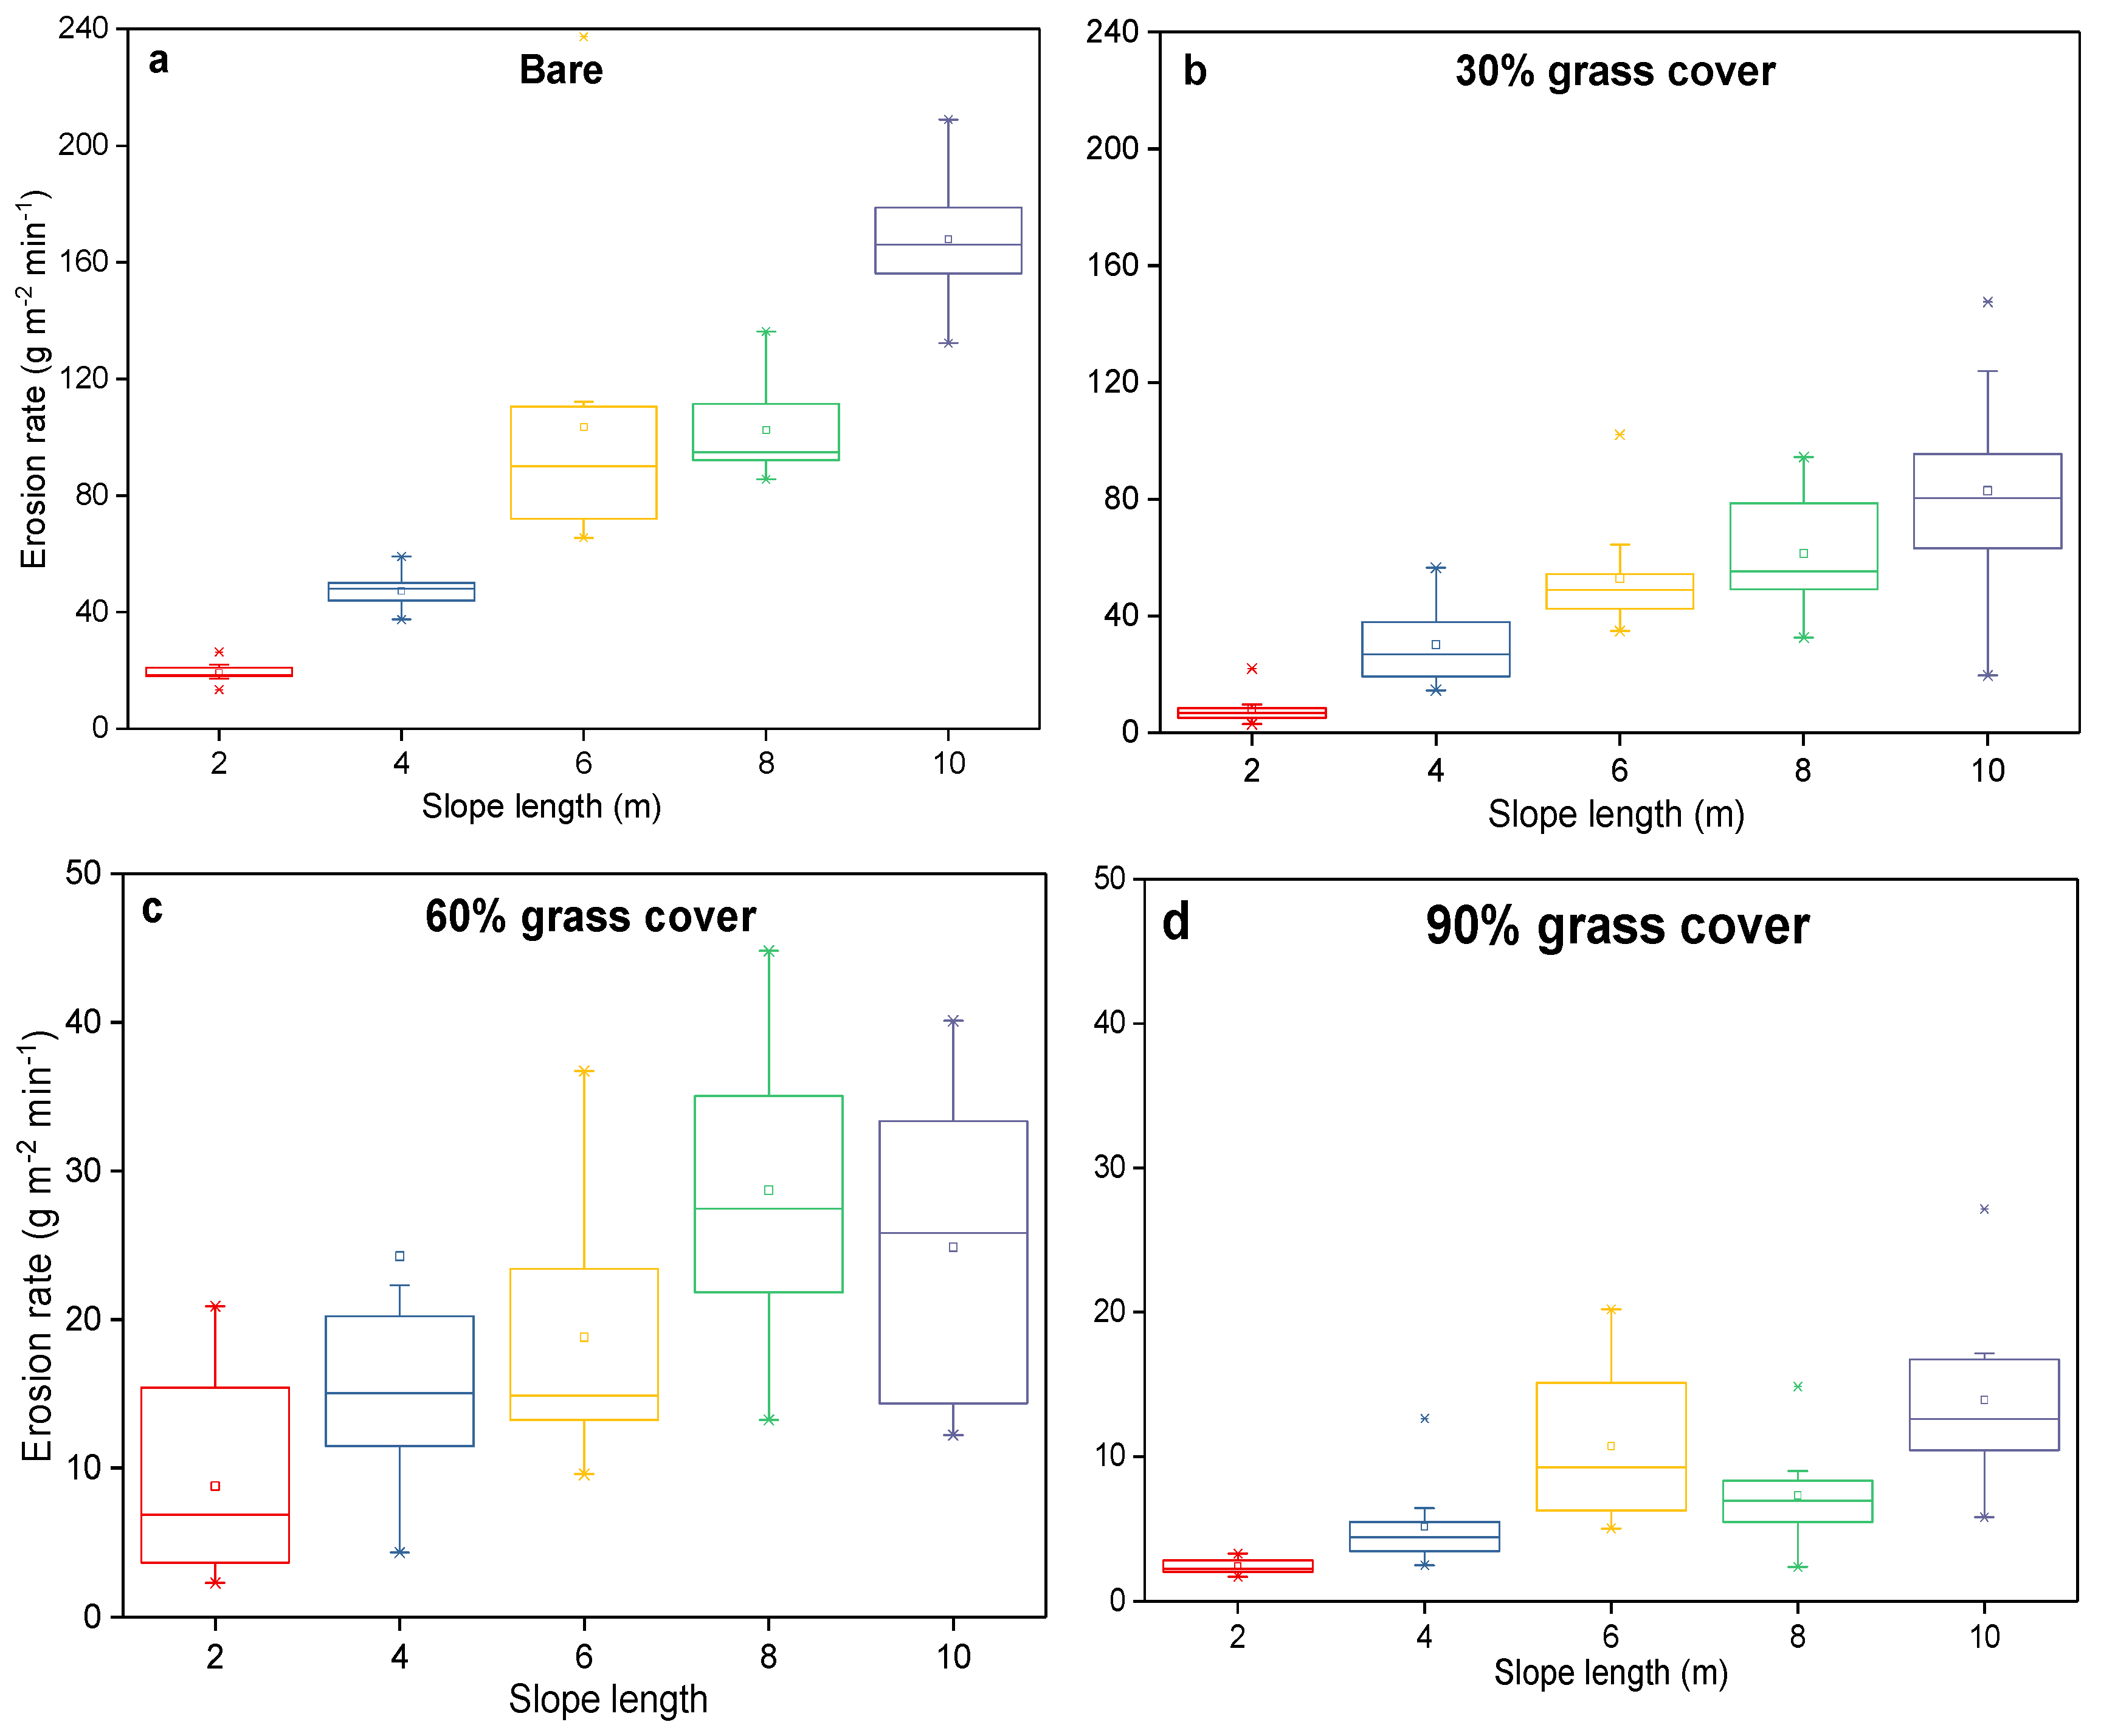
3.2. Changes in the Impact of Slope Length on Soil Loss with Grass cover

The effects of grass cover and slope length on the erosion rate were analyzed under a rainfall intensity of 1.5 mm min−1. The average erosion rate and runoff sediment content increased with slope length (Figure 3). However, this trend was altered by changes in grass cover. Correlation analysis between soil erosion parameters and hydrodynamic parameters showed that the correlation between grass cover and runoff rate and flow depth was not significant, but was significantly negatively correlated with flow velocity (p < 0.01) (Table 5). When the grass cover was 0 or 30%, the erosion rate power function increased with slope length, and this increase of slope length promoted soil loss. However, at 60% grass cover, the soil erosion rate peaked at a slope length of 8 m, and at 90% grass cover, the soil erosion rate peaked at a slope length of 6 m. With increasing grass cover, the number of erosion parameters and hydrodynamic parameters without obvious difference between different slope lengths increased (Table 3). Under four different mulches (under bare slope, 30%, 60%, and 90%), compared with the 2 m slope length, the maximum increase rates of erosion rate were 775% (10 m), 930% (8 m), 225% (6 m), and 475% (4 m).

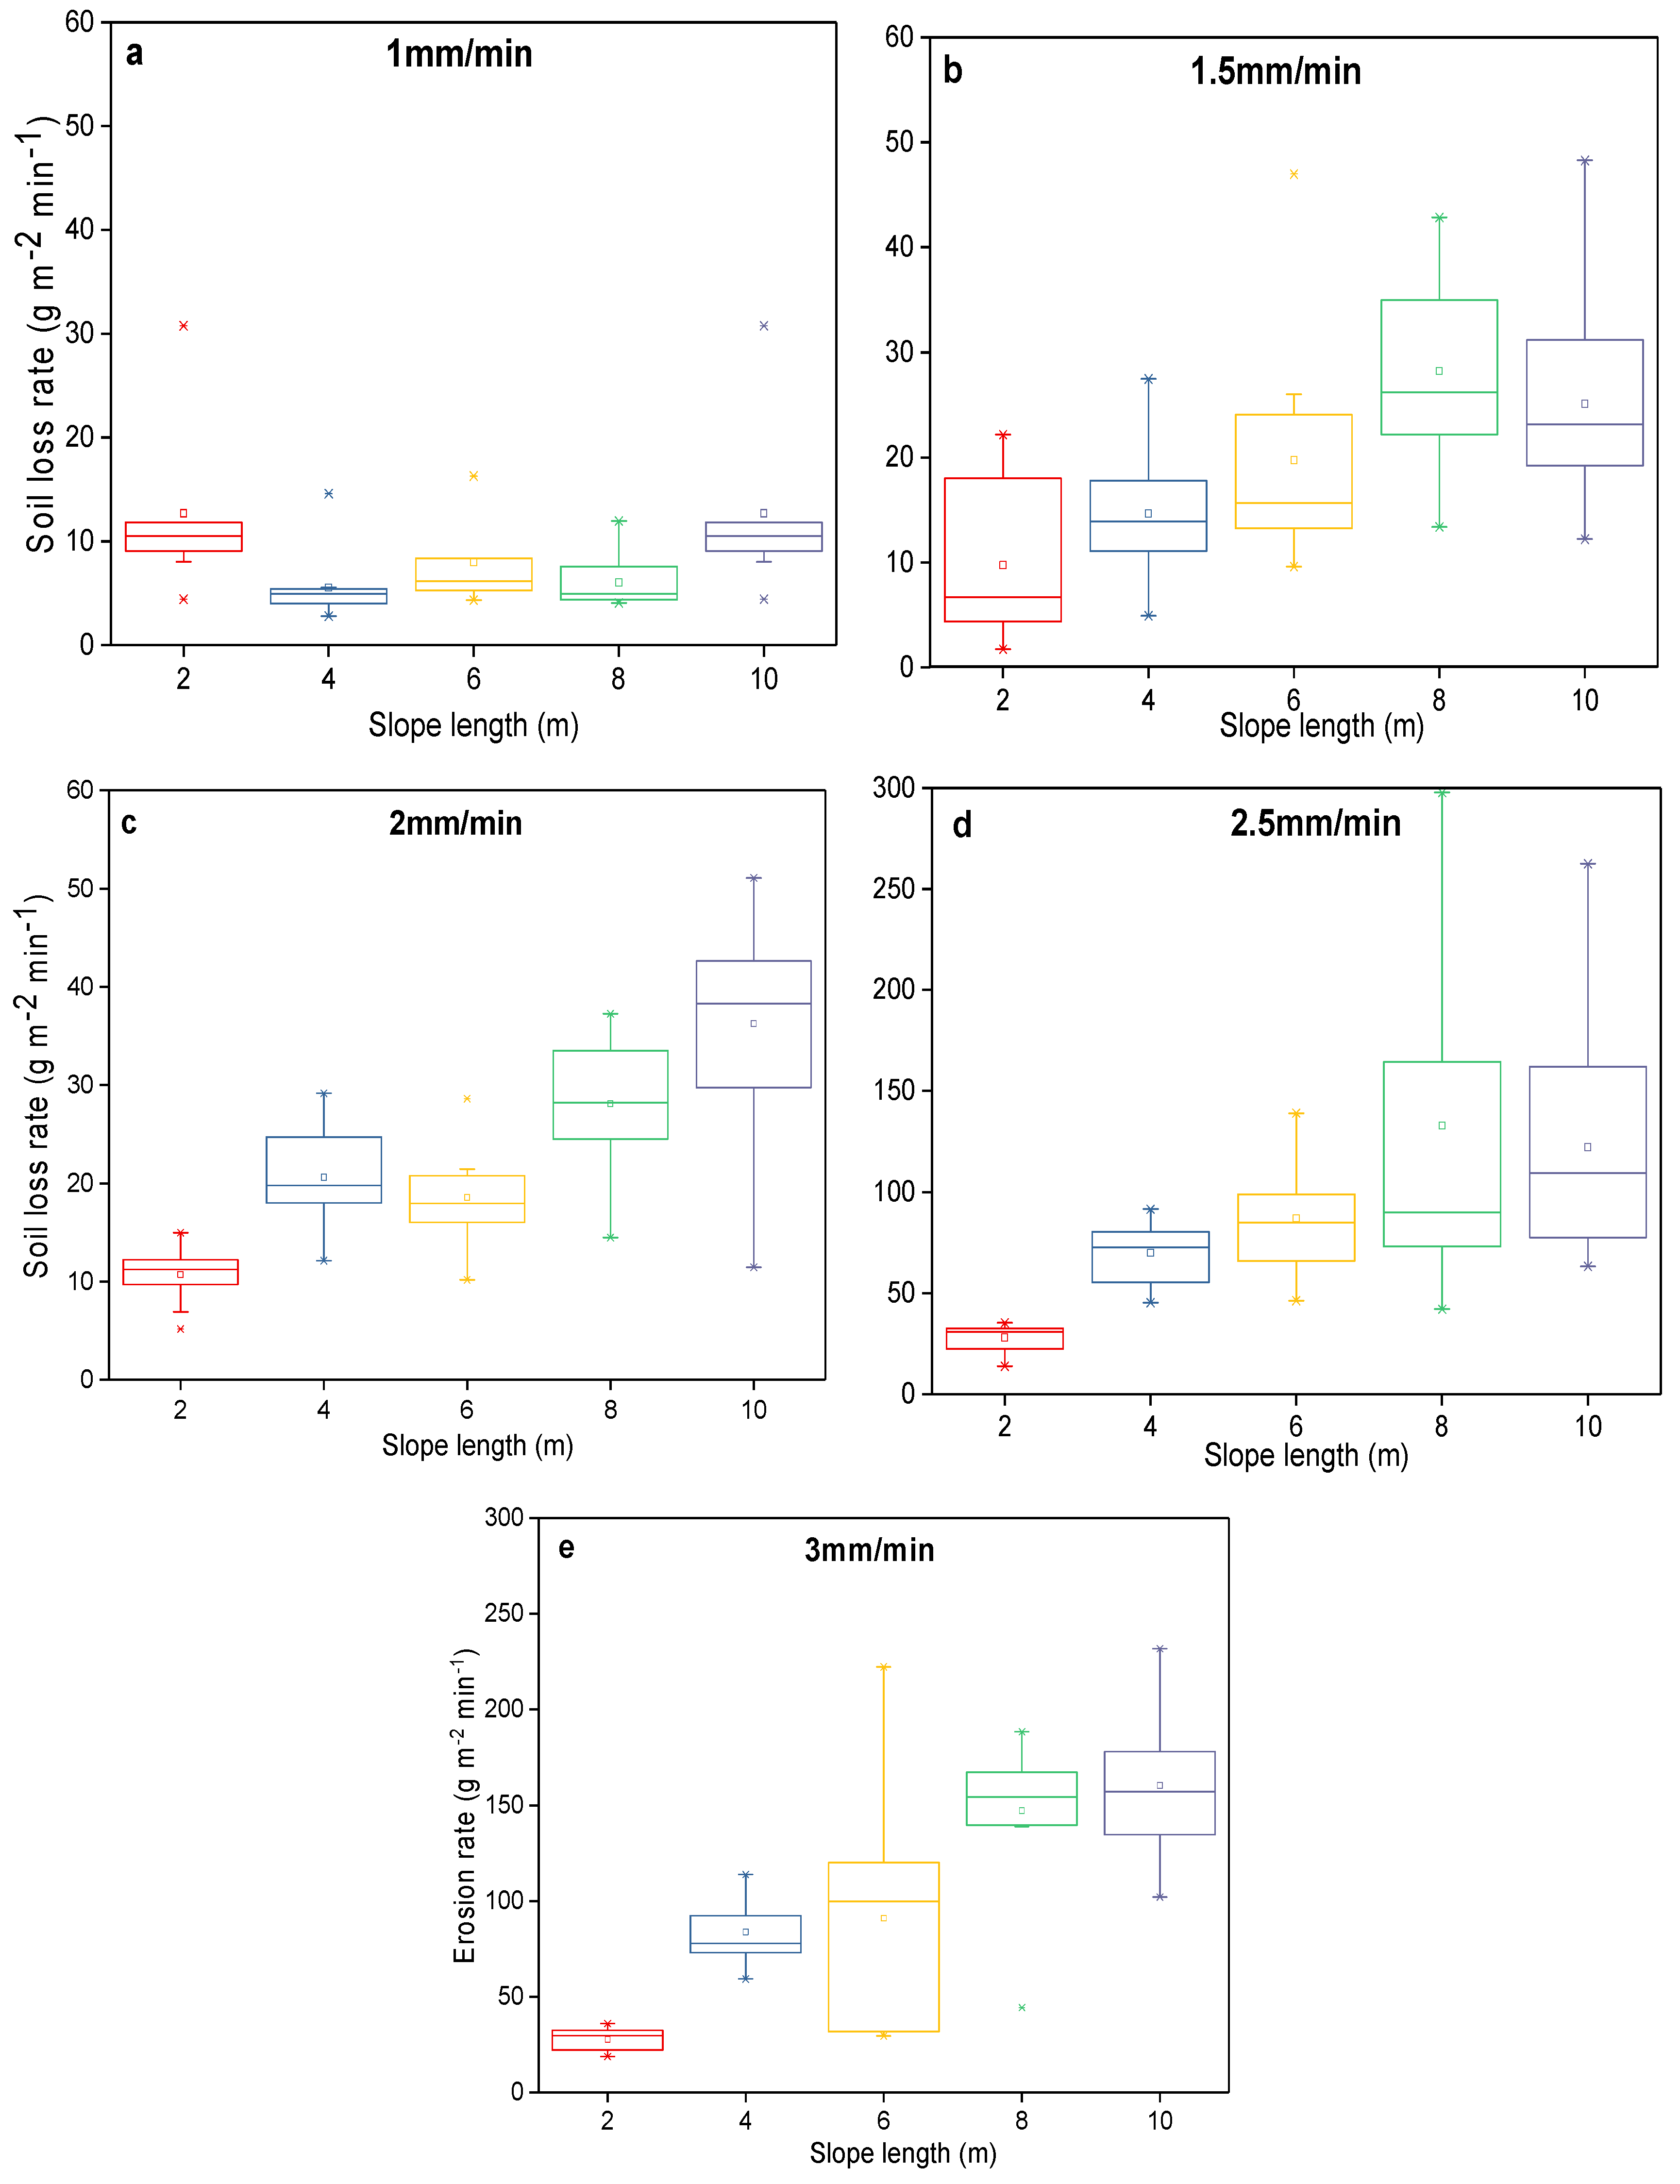
3.3. Changes of the Impact of Slope Length on Soil Loss with Rainfall Intensity

The impacts of rainfall intensity and slope length on the erosion rate were analyzed under natural restoration of natural grass (60% vegetation cover). At a rainfall intensity of 1 mm min−1, the average erosion rate followed an increasing–decreasing–increasing fluctuation with slope length. With increasing rainfall intensity, the average erosion rate gradually changed and increased with slope length (Figure 4). Correlation analysis of soil erosion parameters and hydrodynamic parameters showed that the correlation between rainfall intensity and flow depth and flow velocity was not significant, but was significantly positively correlated with runoff (p < 0.01). With increasing rainfall intensity, the number of slope lengths with significant differences in erosion parameters and hydrodynamic parameters between different slope lengths increased (Table 4). Under rainfall intensities of 1, 1.5, 2, 2.5, and 3 mm min−1, compared with a slope length of 2 m, the maximum increase rates of erosion rate were 3% (10 m), 225% (8 m), 237% (10 m), 373% (8 m), and 497% (10 m). The maximum decrease rate of the soil erosion rate was 56% (4 m) under a rainfall intensity of 1 mm min−1 (Table 4).

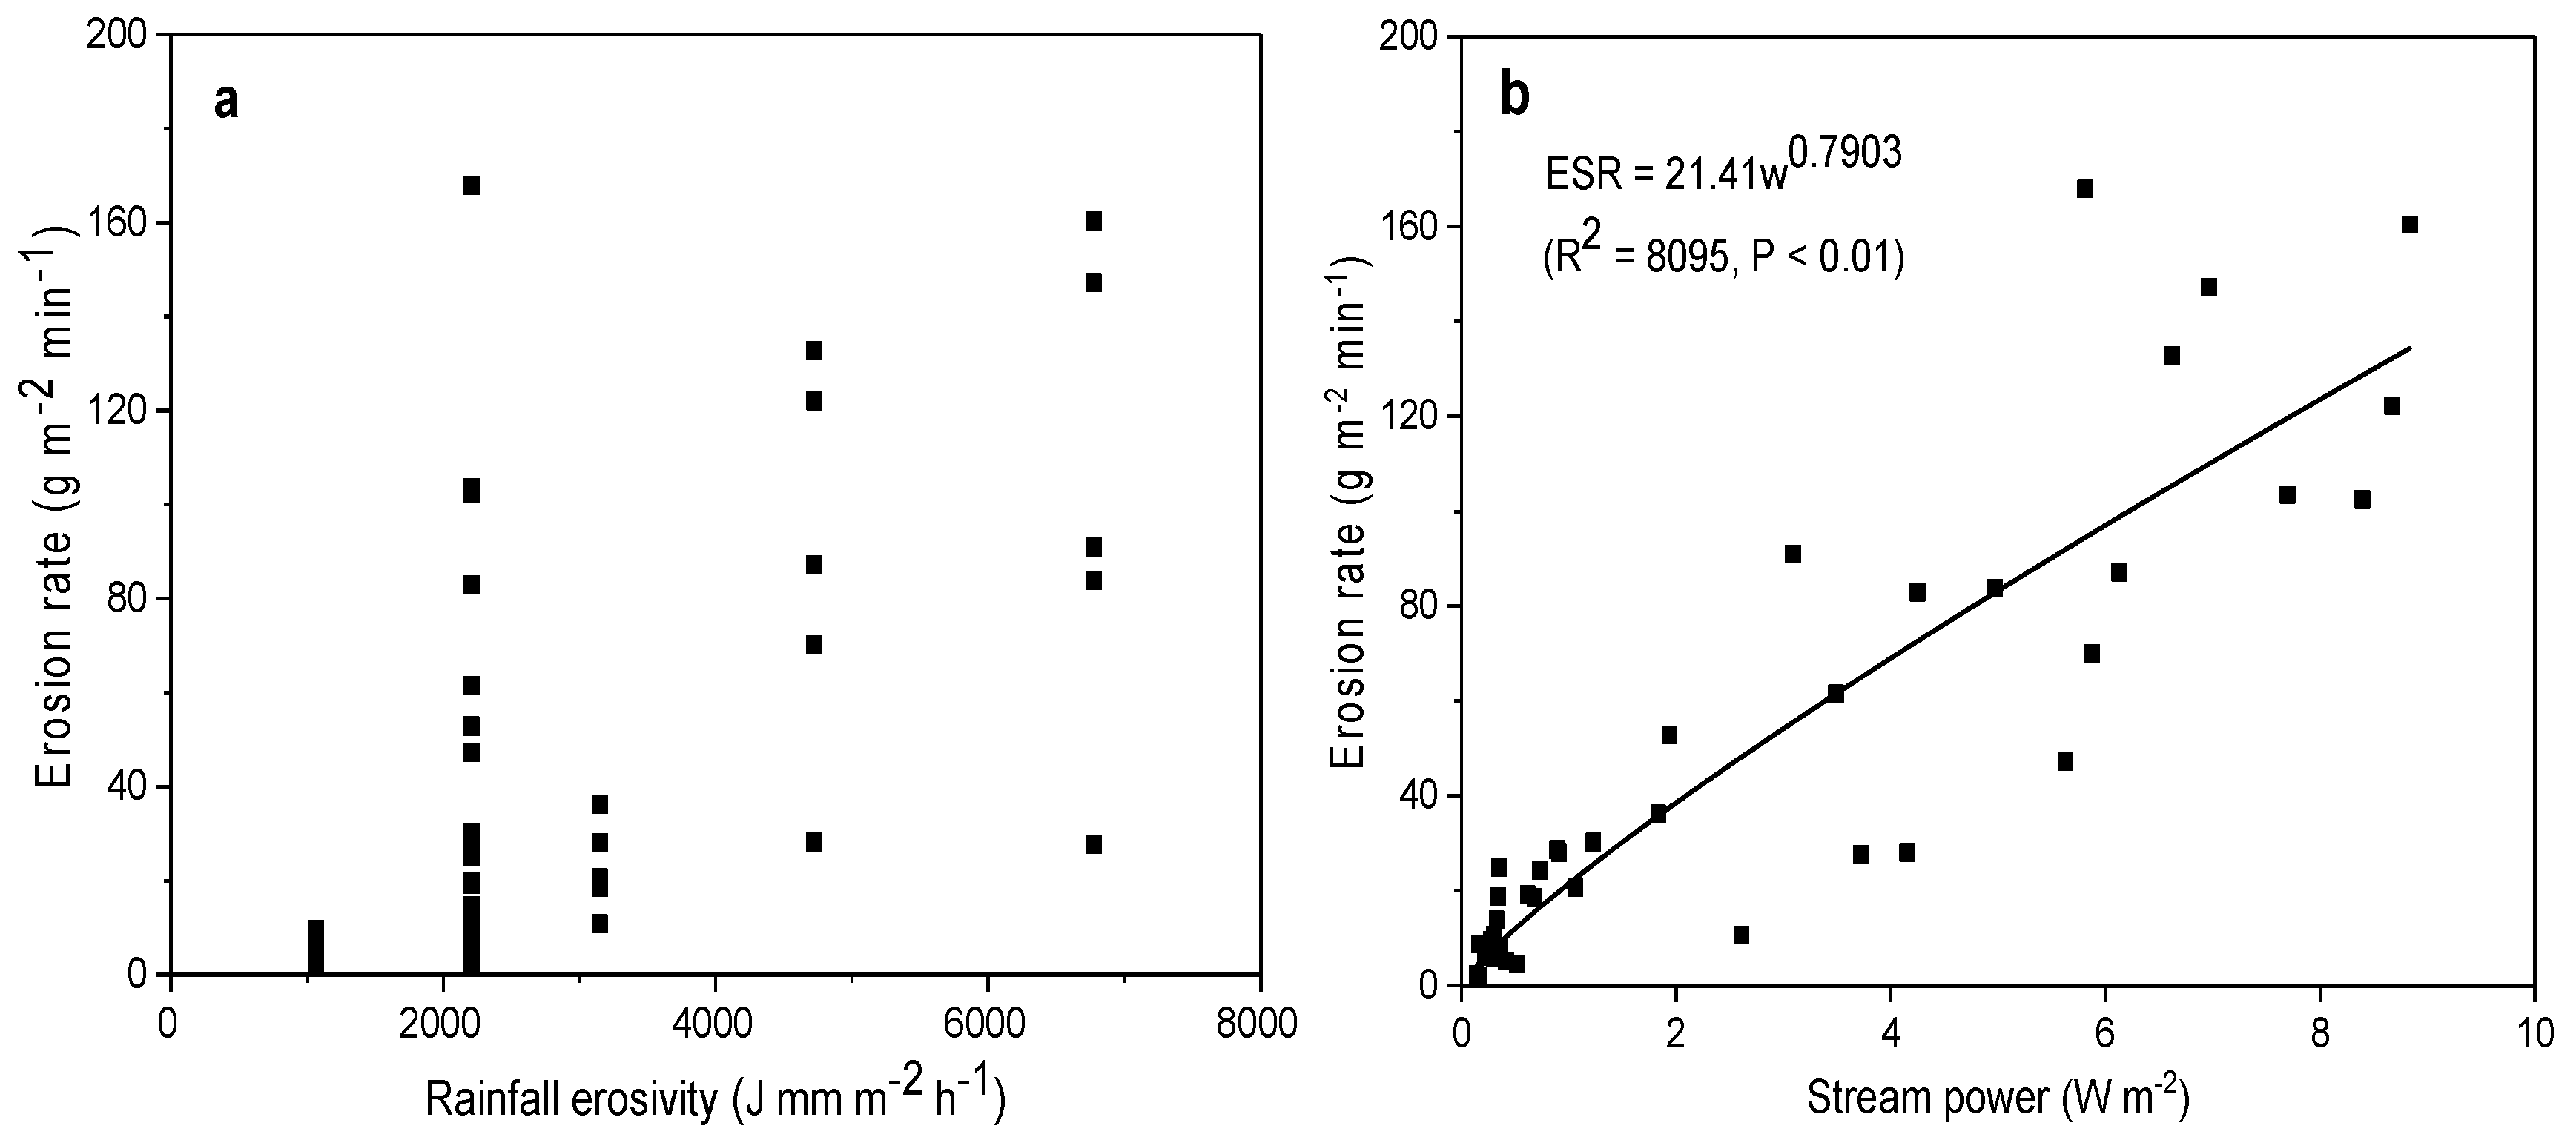
3.4. Relationship between Grass Cover, Rainfall Intensity, Slope Length, and Erosion Rate

The impact of the slope length on soil erosion varied with grass cover and rainfall intensity. To further analyze the effect of slope length, grass cover, and rainfall intensity on soil erosion, nonlinear regression analyses of the relationship between erosion rate and slope length, as well as between grass cover and rainfall intensity were performed. The fitting equations were:
Z = 19.1836   x 0.2124   e 0.1917   y   ( R 2 = 0.8416 ,   n = 20 )
Z = 2.8327   I 2.5912   e 0.1436   y   ( R 2 = 0.8651 ,   n = 25 )
where Z represents the erosion rate (g m−2 min−1), x represents the grass cover (%), y represents the slope length (m), and I represents the rainfall intensity (mm min−1). A comparison of the standard regression coefficients of slope length with grass cover and rainfall intensity showed that compared with slope length, the relationship between soil loss and grass cover and rainfall intensity was stronger.

4. Discussion

4.1. Effect of Slope Length on Soil Loss

Slope length is an important topographic factor affecting erosion. The average erosion rate increased with slope length. The difference of different slope length measurement indicators indicated that the changes of runoff, runoff depth, flow velocity, soil loss rate, and runoff sediment content in different slope lengths were significantly different (p < 0.05). The average erosion rate increased with increasing slope length. Bagio et al. reported the same [34]. They assumed that soil loss increased exponentially with the increase of slope length, and explained that the exponential growth of soil loss was caused by the large runoff and high velocity formed by long slopes. In this study, the correlation analysis shown in Table 5 indicated that slope length was significantly positively correlated with flow velocity and flow depth (p < 0.01), while slope length also positively correlated with runoff, but not significantly (p > 0.05). This suggests that the impact of slope length on soil loss was caused by the increase in flow velocity and runoff depth, and slope length increased the convergence of runoff and the intensity of flow scouring. There was a “runoff degradation phenomenon” in runoff with increasing slope length [35,36], and long slope lengths decreased the amount of slope runoff [37,38]. The long slope length increased the time for runoff to pass and also increased infiltration, and the high flow depth formed by the long slope length also increased infiltration. The sediment content of runoff increased with the slope length, indicating that the sediment transport capacity also increased with the slope length. The higher flow velocity increased the sediment transport capacity, but the longer distance for carrying the sediment consumes more energy [24,39]. Therefore, the rate of runoff sediment content gradually slowed down with increasing slope length, which indicates that the effects of increasing the slope length gradually balance infiltration and energy consumption. The long slope has an important influence on fine gully formation and development. Gordon et al. suggest that rill incision and network development and extension occurred due to actively migrating head cuts formed at the flume outlet by base level lowering [40]. This suggests that long slopes promote the development of fine gullies and intensify soil erosion. The increase of flow velocity caused by long slope is the main reason for aggravating soil erosion [41].

4.2. Influence of the Slope Length on the Effect of Grass Cover on Soil Loss

Ecological restoration of vegetation is an important measure for the prevention and control of soil erosion [42]. In the study, grass cover reduced soil loss by about 70%. Grass cover also changed the trend of soil loss with slope length in the following way. With increasing grass cover, the number of erosion parameters and hydrodynamic parameters without obvious difference between different slope lengths increased (Figure 3, Table 3). On bare slopes and under low grass cover, long slopes promote erosion. However, under high grass cover (60% and 90%), soil erosion followed a fluctuating trend of increasing-decreasing-increasing with increasing slope length. Vegetation mainly affects hydraulic characteristics (e.g., runoff, runoff depth, and flow velocity) through the above-ground canopy and underground root system, and thus reduce soil erosion. Generally, high vegetation cover increases slope roughness, promotes infiltration, and delays the development of slope hydrological connectivity [43,44]. Correlation analysis showed that vegetation cover has a significant negative correlation with flow velocity (p < 0.01), and an insignificant negative correlation with runoff (Table 5). This indicates that the effect of vegetation cover for reducing flow velocity is stronger than that for increasing infiltration. This is because E. comosum, which grows in this experimental cluster, exerts a good blocking effect on runoff. Plant roots can change soil properties and increase soil permeability by decreasing soil bulk density and increasing soil total porosity [45]. Thick-rooted vegetation was more efficient in transporting water vertically downwards compared with capillary-rooted vegetation [46], while the thick-rooted C. varia accounts for less (Table 1). Under high vegetation cover, the short slope length is insufficient to make the runoff converge into a larger runoff and increase the velocity (Table 3). The maximum slope length of the experimental design has not yet played a role for the erosion. Quantifying the impacts of slope length and grass cover on soil erosion showed that the impact of grass cover on soil loss was stronger than that of the slope length, which is similar to the results of Bircher et al. [47]. The effects of the interference of the grass canopy and the change of root system on soil properties also hold positive significance for the control of soil erosion [48]. The above-ground part of vegetation has been harvested or removed; the root system of the vegetation still exerts a good control effect on soil erosion [49]. Fitting the relationship between erosion rate and runoff shear force showed that the critical shear force increased with increasing grass cover (Table 5). Baets et al. reached a similar conclusion [50]. The combination of plant roots and soil particles forms an overall improvement of soil shear strength. Root exudates can cement the soil and form a stable aggregate structure, thus enhancing soil cohesion.

4.3. Influence of Slope Length on the Impact of Rainfall Intensity on Soil Loss

The effect of the slope length on soil loss on ecologically restored grassland slopes varied with rainfall intensity. The greater the rainfall intensity, the greater the increase in soil loss with slope length (Figure 4, Table 4). This result is similar to the results reported by Wu et al. [22]. The impact of rainfall on slope erosion was mainly the result of the effect of raindrops on the loose topsoil and the potential erosive force of runoff [6]. In this study, the relationship between rainfall erosivity and the soil erosion rate was not significant, because grass cover responded differently to rainfall erosion at different rainfall intensities (Figure 5a). However, the erosion rate increased significantly with increasing water flow power, following a power function (R2 = 0.8095, p < 0.01) (Figure 5b). Flow power as the best hydrodynamic parameter to characterize the dynamic mechanism of slope erosion [7,51]. However, rainfall intensity also exerts an important effect on soil properties (i.e., soil compaction and sealing) [20]. The current study showed that the critical runoff shear force decreased with increasing rainfall intensity. A heavy rainfall intensity promoted soil compaction and sealing, which is inconsistent with the results of the present study [52]. This difference may be caused by differences in underlying surface conditions. Under natural grass cover, the grass is blocked by the canopy from the direct effect of raindrops on the soil, which is not conducive to the formation of surface soil crusts. At the same time, heavy rainfall increases soil infiltration, thus leading to a higher water content in the soil before runoff.
The impact of rainfall intensity on soil erosion was stronger than that of the slope length, which is consistent with the report of Fu et al. [53]. The presence of grass cover could intercept rainfall, increase soil infiltration, and block the direct effect of rainfall on soil, thereby delaying the impact of rainfall on slope length erosion [54,55,56]. Several previous studies have reported a critical rainfall intensity for soil erosion. When the rainfall intensity exceeds the critical rainfall intensity, the erosion is further intensified under the influence of the slope length factor [3,57]. In the current study, the correlation between flow velocity, soil loss, and slope length was not significant under a rainfall intensity of 1 mm min−1 (Table 4 and Figure 4). This indicates that the ecologically restored grass cover could control soil loss very well without being affected by slope length. At rainfall intensities of 1.5–2 mm min−1, the total amount of soil erosion was small, indicating that within this rainfall intensity range, the grass that recovered naturally achieved a good control effect on soil loss within a slope length of 10 m. However, the amount of soil loss increased drastically with increasing slope length when the rainfall intensity exceeded 2 mm min−1. Chen et al. pointed out that the slope length effects of soil loss differed with different I30 (maximum 30 min rain intensity) [31]. For I30 > 0.21 mm min−1, as the slope length increases in the range of 20–60 m, the amount of soil erosion first increased and then stabilized. Xing et al. showed that soil loss increased with slope length [58]. The increasing rainfall intensity would increase the amount of soil loss, but it did not affect the relationship between soil loss and slope length. Rainfall erosion responds differently to the slope length under different factors, e.g., different study areas and different rain intensities. In combination with the conclusions of previous research, the slope length of the experimentally designed runoff plot in this study was small (the longest was only 10 m). Therefore, the effects of slope length on erosion on sloping farmlands under the background of ecological restoration need to be further explored in subsequent experiments.

5. Conclusions

Studying the influence of slope length on the processes of runoff and erosion can provide an important theoretical basis for the deployment of soil erosion prevention measures on slopes. For different treatments, the soil loss process was divided into two stages: rapid increase and stable fluctuation. The average erosion rate increased with slope length. Grass cover changed this trend of soil loss with slope length: at grass covers of 0 and 30%, the rate of erosion rate increased exponentially with increasing slope length ranging from 90–400 g m−2 min−1. However, under a grass cover of 60%, the soil erosion rate peaked at a slope length of 8 m, and under a grass cover of 90%, the soil erosion rate peaked at a slope length of 6 m. At a rainfall intensity of 1 mm min−1, natural grass (60% vegetation cover) was able to control soil loss very well, which was independent of slope length. At rainfall intensities of 1.5–2 mm min−1, the overall soil erosion amount was small. The soil loss increased drastically with slope length when the rainfall intensity exceeded 2 mm min−1. Compared with a slope length of 2 m, longer slope lengths increased the erosion rate by 225–930% under different grass coverages. Different rainfall intensities increased the erosion rate in the range of −56% to 497%. Regression analysis showed that a non-linear relationship between soil loss rate and rainfall intensity, grass cover and slope length. In addition, the relationship between soil loss, grass cover, and rainfall intensity was stronger than that between soil loss and slope length.

Author Contributions

All authors contributed extensively to the work presented in this paper. Z.H., P.X. and X.Y. contributed to the subject of research, analysis of study data, and the writing of the paper. Z.H., P.X., X.Y. and S.H. adjusted the parameters and processed the data. S.H., G.J. and C.Y. proofread the data and provided the basics for the optimization of the figures. All authors have read and agreed to the published version of the manuscript.

Funding

This research was supported by the National Natural Science Foundation of China, grant number U2243210; the Scientific Research Foundation of the Yellow River Institute of Hydraulic Research, grant number HKY-JBYW-2020-09; and the Project of the Key Laboratory of Soil Erosion Process and Control in the Loess Plateau of the Ministry of Water Resources, grant number WSCLP202201.

Institutional Review Board Statement

Not applicable.

Informed Consent Statement

Not applicable.

Data Availability Statement

Data is contained within the article.

Acknowledgments

This work was financially supported by the National Natural Science Foundation of China, grant number U2243210; the Scientific Research Foundation of the Yellow River Institute of Hydraulic Research, grant number HKY-JBYW-2020-09; and the Project of the Key Laboratory of Soil Erosion Process and Control in the Loess Plateau of the Ministry of Water Resources, grant number WSCLP202201. The authors want to thank the anonymous reviewers and editors for their valuable comments and suggestions that significantly contributed to this manuscript’s improvement.

Conflicts of Interest

The authors declare no conflict of interest.

References

  1. Heimhuber, V.; Hannemann, J.C.; Rieger, W. Flood Risk Management in Remote and Impoverished Areas—A Case Study of Onaville, Haiti. Water 2015, 7, 3832–3860. [Google Scholar] [CrossRef]
  2. Winchell, M.F.; Jackson, S.H.; Wadley, A.M.; Srinivasan, R. Extension and validation of a geographic information system-based method for calculating the Revised Universal Soil Loss Equation length-slope factor for erosion risk assessments in large watersheds. J. Soil Water Conserv. 2008, 63, 105–111. [Google Scholar] [CrossRef]
  3. Fu, X.T.; Zhang, L.P. Impact of slope length on soil erosion of sloping farmland with crop in red soil hilly region. Trans. Chin. Soc. Agric. Eng. 2014, 30, 91–98. [Google Scholar]
  4. Jia, X.; Wang, Y.; Shao, M.A.; Luo, Y.; Zhang, C. Estimating regional losses of soil water due to the conversion of agricultural land to forest in China’s Loess Plateau. Ecohydrology 2017, 10, e1851. [Google Scholar] [CrossRef]
  5. Masia, S.; Sušnik, J.; Marras, S.; Mereu, S.; Spano, D.; Trabucco, A. Assessment of Irrigated Agriculture Vulnerability under Climate Change in Southern Italy. Water 2018, 10, 209. [Google Scholar] [CrossRef] [Green Version]
  6. Liu, Y.; Wu, G.L.; Ding, L.M.; Tian, F.P.; Shi, Z.H. Diversity-Productivity Trade-off During Converting Cropland to Perennial Grassland in the Semi-arid Areas of China. Land Degrad. Dev. 2016, 28, 699–707. [Google Scholar] [CrossRef]
  7. Wang, L.; Zhang, G.; Wang, X.; Zhu, P. Soil loss response to plant the litter incorporation rate under simulated rainfall conditions. Land Degrad. Dev. 2019, 30, 1193–1203. [Google Scholar] [CrossRef]
  8. Liu, Z.Q.; Liu, Q.Q.; Wei, Z.J.; Yu, X.X.; Jia, G.D.; Jiang, J. Partitioning tree water usage into storage and transpiration in a mixed forest. For. Ecosyst. 2021, 8, 13. [Google Scholar] [CrossRef]
  9. Lee, G.; McLaughlin, R.A.; Whitely, K.D.; Brown, V.K. Evaluation of seven mulch treatments for erosion control and vegetation establishment on steep slopes. J. Soil Water Conserv. 2018, 73, 434–442. [Google Scholar] [CrossRef] [Green Version]
  10. Erktan, A.; Cécillon, L.; Graf, F.; Roumet, C.; Legout, C.; Rey, F. Increase in soil aggregate stability along a Mediterranean successional gradient in severely eroded gully bed ecosystems: Combined effects of soil, root traits and plant community characteristics. Plant Soil 2016, 398, 121–137. [Google Scholar] [CrossRef]
  11. Fischer, C.; Tischer, J.; Roscher, C.; Eisenhauer, N.; Ravenek, J.; Gleixner, G.; Attinger, S.; Jensen, B.; Kroon, H.; Mommer, L.; et al. Plant species diversity affects infiltration capacity in an experimental grassland through changes in soil properties. Plant Soil 2015, 397, 1–16. [Google Scholar] [CrossRef]
  12. Wang, Z.J.; Jiao, J.Y.; Rayburg, S.; Wang, Q.L.; Su, Y. Soil erosion resistance of “Grain for Green” vegetation types under extreme rainfall conditions on the Loess Plateau, China. Catena 2016, 141, 109–116. [Google Scholar] [CrossRef]
  13. Liu, J.; Gao, G.; Wang, S.; Jiao, L.; Wu, X.; Fu, B.J. The effects of vegetation on runoff and soil loss: Multidimensional structure analysis and scale characteristics. J. Geogr. Sci. 2017, 28, 59–78. [Google Scholar] [CrossRef] [Green Version]
  14. Chen, J.; Xiao, H.; Li, Z.; Liu, C.; Wang, D.; Wang, L.; Tang, C. Threshold effects of vegetation coverage on soil erosion control in small watersheds of the red soil hilly region in China. Ecol. Eng. 2019, 132, 109–114. [Google Scholar] [CrossRef]
  15. Jia, X.; Zhao, C.; Wang, Y.; Zhu, Y.; Wei, X.; Shao, M.A. Traditional dry soil layer index method overestimates soil desiccation severity following conversion of cropland into forest and grassland on China’s Loess Plateau. Agric. Ecosyst. Environ. 2020, 291, 106794. [Google Scholar] [CrossRef]
  16. Feng, X.; Vico, G.; Porporato, A. On the effects of seasonality on soil water balance and plant growth. Water Resour. Res. 2012, 48, 5. [Google Scholar] [CrossRef]
  17. Liu, Z.Q.; Zhuang, H.; Jia, G.D.; Yu, X.X.; Jiang, J. Evidence of foliar water uptake in a conifer species. Agric. Water Manag. 2021, 255, 106993. [Google Scholar] [CrossRef]
  18. Ziadat, F.M.; Taimeh, A.Y. Effect of rainfall intensity, slope, land use and antecedent soil moisture on soil erosion in an arid environment. Land Degrad. Dev. 2013, 24, 582–590. [Google Scholar] [CrossRef]
  19. Serrano-Muela, M.P.; Nadal-Romero, E.; Lana-Renault, N.; González-Hidalgo, J.C.; López-Moreno, J.I.; Beguería, S.; García-Ruiz, J.M. An Exceptional Rainfall Event in the Central Western Pyrenees: Spatial Patterns in Discharge and Impact. Land Degrad. Dev. 2013, 26, 249–262. [Google Scholar] [CrossRef] [Green Version]
  20. Shen, H.; Zheng, F.; Wen, L.; Han, Y.; Hu, W. Impacts of rainfall intensity and slope gradient on rill erosion processes at loessial hillslope. Soil Tillage Res. 2016, 155, 429–436. [Google Scholar] [CrossRef]
  21. Rachman, A.; Anderson, S.H.; Gantzer, C.J.; Thompson, A.L. Influence of Long-term Cropping Systems on Soil Physical Properties Related to Soil Erodibility. Soil Sci. Soc. Am. J. 2003, 67, 637. [Google Scholar] [CrossRef]
  22. Wu, X.; Wei, Y.; Wang, J.; Xia, J.; Cai, C.; Wu, L.; Wei, Z. Effects of erosion degree and rainfall intensity on erosion processes for Ultisols derived from quaternary red clay. Agric. Ecosyst. Environ. 2017, 249, 226–236. [Google Scholar] [CrossRef]
  23. Qin, R.J.; Li, G.F.; Li, P. Impacts of Precipitation and Land Use Change on Runoff and Sediment in Luoyugou Watershed. J. Soil Water Conserv. 2018, 32, 29–34. [Google Scholar]
  24. Xu, X.L.; Liu, W.; Kong, Y.P.; Zhang, K.L.; Yu, B.; Chen, J.D. Runoff and water erosion on road side-slopes: Effects of rainfall characteristics and slope length. Transp. Res. Part D: Transp. Environ. 2009, 14, 497–501. [Google Scholar] [CrossRef]
  25. Kara, Ö.; Şensoy, H.; Bolat, İ. Slope length effects on microbial biomass and activity of eroded sediments. J. Soils Sediments 2010, 10, 434–439. [Google Scholar] [CrossRef]
  26. Fu, G.; Yu, J.; Yu, X.; Ouyang, R.; Zhang, Y.; Wang, P.; Min, L. Temporal variation of extreme rainfall events in China, 1961–2009. J. Hydrol. 2013, 487, 48–59. [Google Scholar] [CrossRef]
  27. Bagarello, V.; Ferro, V. Analysis of soil loss data from plots of differing length for the Sparacia experimental area, Sicily, Italy. Biosystes Eng. 2010, 105, 411–422. [Google Scholar] [CrossRef]
  28. Liu, J.; Gao, G.; Wang, S.; Fu, B.J. Combined effects of rainfall regime and plot length on runoff and soil loss in the Loess Plateau of China. Earth Environ. Sci. Trans. R. Soc. Edinb. 2019, 109, 397–406. [Google Scholar] [CrossRef]
  29. Lv, X.; Zuo, Z.; Sun, J.; Ni, Y.; Wang, Z. Climatic and human-related indicators and their implications for evapotranspiration management in a watershed of Loess Plateau, China. Ecol. Indic. 2019, 101, 143–149. [Google Scholar] [CrossRef]
  30. Qin, W.; Guo, Q.; Cao, W.; Yin, Z.; Yan, Q.; Shan, Z.; Zheng, F. A new RUSLE slope length factor and its application to soil erosion assessment in a Loess Plateau watershed. Soil Tillage Res. 2018, 182, 10–24. [Google Scholar] [CrossRef]
  31. Chen, Y.; Wang, F.; Liu, G.; Yu, X.X.; Jia, G.D.; Gan, P. Modified vegetation-erosion dynamics model and its application in typical watersheds in the loess plateau. Int. J. Sediment Res. 2011, 26, 81–89. [Google Scholar] [CrossRef]
  32. Zhang, J.; Gao, G.; Fu, B.J.; Wang, C.; Gupta, H.V.; Zhang, X.; Li, R. A universal multifractal approach to assessment of spatiotemporal extreme precipitation over the Loess Plateau of China. Hydrol. Earth Syst. Sci. 2020, 24, 809–826. [Google Scholar] [CrossRef] [Green Version]
  33. Chen, L.; Lei, T.; Ban, Y.; Gao, Y. Effect of soil freeze on flow velocity in loess rills. Trans. Chin. Soc. Agric. Mach. 2018, 49, 282–289. [Google Scholar]
  34. Bagio, B.; Bertol, I.; Wolschick, N.H.; Schneiders, D.; Santos, M.N. Water Erosion in Different Slope Lengths on Bare Soil. Rev. Bras. Ciência Solo 2017, 41, 1–15. [Google Scholar] [CrossRef] [Green Version]
  35. Koomson, E.; Muoni, T.; Marohn, C.; Nziguheba, G.; Cadisch, G. Critical slope length for soil loss mitigation in maize-bean cropping systems in sw Kenya. Geoderma Reg. 2020, 22, e00311. [Google Scholar] [CrossRef]
  36. Han, Z.; Zhong, S.; Ni, J.; Shi, Z.; Wei, C. Estimation of soil erosion to define the slope length of newly reconstructed gentle-slope lands in hilly mountainous regions. Sci. Rep. 2019, 9, 4676–4688. [Google Scholar] [CrossRef]
  37. Panagos, P.; Borrelli, P.; Meusburger, K. A New European Slope Length and Steepness Factor (LS-Factor) for Modeling Soil Erosion by Water. Geosciences 2015, 5, 117–126. [Google Scholar] [CrossRef] [Green Version]
  38. Schmidt, S.; Tresch, S.; Meusburger, K. Modification of the RUSLE slope length and steepness factor (LS-factor) based on rainfall experiments at steep alpine grasslands. MethodsX 2019, 6, 219–229. [Google Scholar] [CrossRef]
  39. Wang, X.; Tang, Y.; Huang, B.; Hu, T.; Ling, D. Review on numerical simulation of the internal soil erosion mechanisms using the discrete element method. Water 2021, 13, 169. [Google Scholar] [CrossRef]
  40. Gordon, L.M.; Bennett, S.J.; Wells, R.R. Response of soil-mantled experimental landscape to exogenic forcing. Water Resour. Res. 2012, 48, W10514. [Google Scholar] [CrossRef] [Green Version]
  41. Wells, R.R.; Alonso, C.V.; Bennett, S.J. Morphodynamics of headcut development and soil erosion in upland concentrated flows. Soil Sci. Soc. Am. J. 2009, 73, 521–530. [Google Scholar] [CrossRef] [Green Version]
  42. Vannoppen, W.; Vanmaercke, M.; De Baets, S.; Poesen, J. A review of the mechanical effects of plant roots on concentrated flow erosion rates. Earth-Sci. Rev. 2015, 150, 666–678. [Google Scholar] [CrossRef] [Green Version]
  43. Zhang, X.; Zhou, Y.; Dong, Y.; Zhang, H.; Zhang, C.; Zhang, Q. Measurement of the connectivity of runoff source areas on a bare soil surface in a laboratory experiment. J. Soil Water Conservation. 2019, 74, 513–519. [Google Scholar] [CrossRef]
  44. Fang, H. The effect of soil conservation measures on runoff, soil erosion, TN, and TP losses based on experimental runoff plots in northern china. Water 2021, 13, 2334. [Google Scholar] [CrossRef]
  45. Li, Y.; Yu, H.Q.; Zhou, N.; Tian, G.; Poesen, J.; Zhang, Z.D. Linking fine root and understory vegetation to channel erosion in forested hillslopes of southwestern China. Plant Soil 2015, 389, 323–334. [Google Scholar] [CrossRef]
  46. Alaoui, A.; Caduff, U.; Gerke, H.h.; Weingartner, R. A preferential flow effects on infiltration and runoff in grassland and forest soils. Vadose Zone J. 2011, 10, 367–377. [Google Scholar] [CrossRef]
  47. Bircher, P.; Liniger, H.P.; Prasuhn, V. Comparing different multiple flow algorithms to calculate RUSLE factors of slope length (L) and slope steepness (S) in Switzerland. Geomorphology 2019, 346, 106850. [Google Scholar] [CrossRef]
  48. Chen, Z.; Guo, M.; Wang, W. Variations in soil erosion resistance of gully head along a 25-year revegetation age on the loess plateau. Water 2020, 12, 3301. [Google Scholar] [CrossRef]
  49. Zhang, X.; Yu, G.Q.; Li, Z.B.; Li, P. Experimental study on slope runoff, erosion and sediment under different vegetation types. Water Resour. Manag. 2014, 28, 2415–2433. [Google Scholar] [CrossRef]
  50. De Baets, S.; Poesen, J.; Reubens, B.; Wemans, K.J.; De Baerdemaeker, J.; Muys, B. Root tensile strength and root distribution of typical Mediterranean plant species and their contribution to soil shear strength. Plant Soil 2008, 305, 207–226. [Google Scholar] [CrossRef]
  51. Reichert, J.M.; Norton, L.D. Rill and interrill erodibility and sediment characteristics of clayey Australian Vertosols and a Ferrosol. Soil Res. 2013, 51, 1–9. [Google Scholar] [CrossRef]
  52. Vaezi, A.R.; Ahmadi, M.; Cerdà, A. Contribution of raindrop impact to the change of soil physical properties and water erosion under semi-arid rainfalls. Sci. Total Environ. 2017, 583, 382–392. [Google Scholar] [CrossRef]
  53. Fu, X.T.; Zhang, L.P.; Wang, Y. Effect of Slope Length and Rainfall Intensity on Runoff and Erosion Conversion from Laboratory to Field. Water Resour. 2019, 46, 530–541. [Google Scholar] [CrossRef]
  54. Yang, D.; Xiong, D.; Zhang, B.; Guo, M.; Su, Z.; Dong, Y.; Lu, X. Effect of grass basal diameter on hydraulic properties and sediment yield processes in gully beds in the dry-hot valley region of Southwest China. Catena 2017, 152, 299–310. [Google Scholar] [CrossRef]
  55. Mei, X.; Zhu, Q.; Ma, L.; Zhang, D.; Wang, Y.; Hao, W. Effect of stand origin and slope position on infiltration pattern and preferential flow on a Loess hillslope. Land Degrad. Dev. 2018, 29, 1353–1365. [Google Scholar] [CrossRef]
  56. Bracken, L.J.; Wainwright, J.; Ali, G.A.; Tetzlaff, D.; Smith, M.W.; Reaney, S.M.; Roy, A.G. Concepts of hydrological connectivity: Research approaches, pathways and future agendas. Earth-Sci. Rev. 2013, 119, 17–34. [Google Scholar] [CrossRef] [Green Version]
  57. Diodato, N. Estimating RUSLE’s rainfall factor in the part of Italy with a Mediterranean rainfall regime. Hydrol. Earth Syst. Sci. 2004, 8, 103–107. [Google Scholar] [CrossRef] [Green Version]
  58. Xing, W.; Yang, P.; Ren, S.; Ao, C.; Li, X.; Gao, W. Slope length effects on processes of total nitrogen loss under simulated rainfall. Catena 2016, 139, 73–81. [Google Scholar] [CrossRef]
Figure 1. Location of the study area.
Water 14 02142 g001
Figure 2. Changes of erosion rate with time under (a) different grass coverage and (b) rainfall intensity.
Water 14 02142 g002
Figure 3. The effect of different grass cover downhill length on erosion. The symbols (ad) represent bare, 30% grass cover, 60% grass cover, 90% grass cover, respectively.
Water 14 02142 g003
Figure 4. Effect of slope length on erosion under different rainfall intensity. The symbols (ae) represent 1 mm/min, 1.5 mm/min, 2 mm/min, 2.5 mm/min, 3 mm/min rainfall intensity, respectively.
Water 14 02142 g004
Figure 5. Fitting of erosion rate with rainfall erosivity (a,b) stream power.
Water 14 02142 g005
Table 1. Basic description of the experimental plots.
Grass Covers (%)Slope Aspect (°)SamplesMain Plant TypeCanopy CharacteristicsRoot Characteristics at the Soil Depth of 0–100 cm
090°
3090°3: 20 cm × 20 cmEN:CV = 7:3H(EN): 12.5 ± 0.4 cm; H(CV): 20.3 ± 0.5 cm; Biomass: 14.23 ± 0.52 g/m2L(EN): 26.6 ± 1.2 cm, dia < 0.5 mm; L(CV): 72.5 ± 3.5 cm, dia 7.3 ± 2.1 mm; Biomass: 28.74 ± 1.45 g/m2
6090°3: 20 cm × 20 cm EN:CV = 65:35H(EN): 12.2 ± 0.6 cm; H(CV): 21.5 ± 0.8 cm; Biomass: 87.26 ± 1.12 g/m2L(EN): 32.5 ± 1.6 cm, dia < 0.5 mm; L(CV): 69.3 ± 5.4 cm, dia 6.8 ± 2.5 mm; Biomass: 170.43 ± 7.86 g/m2
9090°3: 20 cm × 20 cm EN:CV = 7:3H(EN): 12.8 ± 0.7 cm; H(CV): 19.6 ± 0.8 cm; Biomass: 165.68 ± 1.22 g/m2L(EN): 35.5 ± 1.8 cm, dia < 0.5 mm; L(CV): 80.3 ± 6.2 cm, dia 7.1 ± 2.6 mm; Biomass: 325.43 ± 10.23 g/m2
Note: Date represent means and standard deviation (S.D.). EN: Eriophorum comosum Nees, CV: Coronilla varia Linn, H: height, L: length, dia: diameter.
Table 2. The soil physical properties of experimental plots.
Grass Covers (%)Slope Length (m)Pre-Rainfall Soil Water Content/%Soil Bulk Density/(g·cm−3)Soil Void RatioParticle Size
Sand (%) (0.02–2 mm)Silt (%) (0.002–0.02 mm)Clay (%) (<0.002 mm)
0220.82 ± 0.561.44 ± 0.150.869.21 ± 0.2368.18 ± 3.1722.61 ± 2.18
420.04 ± 0.441.43 ± 0.210.889.14 ± 0.2568.27 ± 2.6822.59 ± 2.64
619.57 ± 0.521.41 ± 0.180.889.16 ± 0.1368.06 ± 2.7522.78 ± 2.12
819.88 ± 0.471.43 ± 0.160.899.12 ± 0.1868.12 ± 3.1622.76 ± 2.23
1020.41 ± 0.611.41 ± 0.180.889.23 ± 0.1668.09 ± 3.2422.68 ± 2.31
30219.33 ± 0.781.38 ± 0.240.959.45 ± 0.1570.83 ± 2.1319.72 ± 2.79
420.14 ± 0.861.37 ± 0.250.979.42 ± 0.2170.94 ± 2.1319.64 ± 2.66
619.26 ± 0.871.37 ± 0.210.989.37 ± 0.1670.77 ± 2.1319.86 ± 2.73
819.35 ± 0.861.36 ± 0.180.979.38 ± 0.1870.86 ± 2.1319.76 ± 2.83
1019.63 ± 0.751.37 ± 0.310.969.41 ± 0.2370.93 ± 2.1319.66 ± 2.72
60219.71 ± 1.041.34 ± 0.331.0211.06 ± 0.1969.84 ± 2.7519.10 ± 4.20
420.38 ± 0.941.33 ± 0.351.0311.36 ± 0.2169.97 ± 2.6418.67 ± 4.25
620.25 ± 1.011.32 ± 0.281.0311.12 ± 0.2469.96 ± 2.6818.92 ± 4.31
820.49 ± 1.041.35 ± 0.361.0411.23 ± 0.1569.94 ± 2.8718.83 ± 4.35
1020.37 ± 1.021.34 ± 0.321.0311.15 ± 0.1869.86 ± 2.7218.99 ± 4.27
90219.88 ± 0.771.30 ± 0.211.049.43 ±0.2271.23 ± 2.5519.34 ± 2.75
420.13 ± 0.791.31 ± 0.221.039.12 ±0.2371.45 ± 2.6419.43 ± 2.73
620.54 ± 0.761.32 ± 0.271.059.05 ±0.2871.31 ± 2.6119.64 ± 2.68
820.03 ± 0.881.31 ± 0.261.069.25 ±0.3371.34 ± 2.6819.41 ± 2.88
1020.11 ± 0.961.31 ± 0.291.059.16 ± 0.2471.42 ± 2.5919.42 ± 2.74
Note: Date represent means and standard deviation (S.D.).
Table 3. Runoff erosion characteristics under different grass cover.
Grass Covers (%)Slope Length
(mm)
RR
(mm min−1)
RRD
(mm)
U
(m s−1)
SLR
(g m−2 min−1)
SC
(g L−1)
ELI
%
020.96 ± 0.17d1.46 ± 0.03e0.13 ± 0.00e19.19 ± 3.22d13.37 ± 4.92d0
40.97 ± 0.13c2.33 ± 0.03d0.24 ± 0.01d47.28 ± 6.18c53.39 ± 8.30c146
60.99 ± 0.20b3.04 ± 0.03c0.27 ± 0.01c103.52 ± 17.20b101.06 ± 27.17b439
81.04 ± 0.22b3.26 ± 0.04b0.30 ± 0.01b102.41 ± 16.63b92.95 ± 13.88b434
101.08 ± 0.29a3.94 ± 0.04a0.41 ± 0.01a167.95 ± 19.85a224.41 ± 29.76a775
3020.87 ± 0.50d1.69 ± 0.08d0.12 ± 0.01e8.05 ± 5.03d9.69 ± 5.64d0
40.89 ± 0.41c2.70 ± 0.06c0.19 ± 0.02d30.26 ± 12.67c30.2 ± 14.49c21
60.92 ± 0.41b3.39 ± 0.05bc0.23 ± 0.01c52.89 ± 18.33b49.57 ± 16.51b44
80.95 ± 0.37b3.81 ± 0.05ab0.27 ± 0.01b61.51 ± 18.21b58.15 ± 21.50b32
100.99 ± 0.38a4.83 ± 0.04a0.31 ± 0.01a82.89 ± 33.95a142.36 ± 24.89a930
6020.59 ± 0.61d1.66 ± 0.11d0.12 ± 0.03d8.83 ± 1.00c9.03 ± 1.32ac0
40.64 ± 0.31bc3.25 ± 0.08c0.16 ± 0.02c14.27 ± 1.91bc14.67 ± 1.32ac10
60.71 ± 34c3.82 ± 0.08ab0.22 ± 0.02b18.81 ± 2.13b18.81 ± 1.89a16
80.76 ± 0.31b3.82 ± 0.08a0.28 ± 0.01a28.7 ± 4.80b24.87 ± 3.47a24
100.75 ± 0.41a4.34 ± 0.07a0.27 ± 0.01a24.87 ± 3.80a15.32 ± 1.81b182
9020.35 ± 0.14c1.73 ± 0.05c0.10 ± 0.01c2.42 ± 0.53b3.30 ± 1.50b0
40.39 ± 0.10bc2.68 ± 0.05b0.15 ± 0.00bc5.18 ± 2.73ab5.50 ± 1.76ab15
60.46 ± 0.12ab3.41 ± 0.04a0.17 ± 0.01b10.71 ± 5.03a12.31 ± 4.96a29
80.53 ± 0.16a3.41 ± 0.03a0.17 ± 0.01a7.34 ± 3.11a8.37 ± 4.15a20
100.51 ± 0.17a3.88 ± 0.04a0.20 ± 0.01a13.91 ± 5.48a14.44 ± 4.53a475
Notes: date represent means and standard deviation (S.D.). U, flow velocity; RR, runoff rate; RRD, runoff depth; SC, sediment concentration; SLR, erosion rate; ELI, efficiency for reducing soil loss. The different letters indicate significant differences in RR, RRD, U, SLR, SC within the different slope length.
Table 4. Runoff erosion characteristics under different rainfall intensities.
Rainfall Intensities (mm/min−1)Slope Length
(mm)
RR
(mm min−1)
RRD
(mm)
U
(m s−1)
SLR
(g m−2 min−1)
SC
(g L−1)
ELI
%
120.40 ± 0.14d1.61 ± 0.05d0.12 ± 0.00d13.21 ± 3.48b10.10 ± 2.48b0
40.45 ± 0.12c2.44 ± 0.05c0.15 ± 0.01c5.86 ± 1.14ab4.00 ± 1.13c−56
60.51 ± 0.10b3.08 ± 0.04b0.20 ± 0.01b8.39 ± 2.10a6.50 ± 1.67c−36
80.58 ± 0.07b3.45 ± 0.04ab0.17 ± 0.00b6.13 ± 2.33a4.07 ± 1.22ac−54
100.63 ± 0.16a4.05 ± 0.04a0.25 ± 0.01a13.61 ± 2.07a11.01 ± 1.53a3
1.520.59 ± 0.61d1.66 ± 0.11c0.12 ± 0.03c8.83 ± 1.00c9.03 ± 1.32ab0
40.64 ± 0.31cd3.25 ± 0.08b0.16 ± 0.02b14.27 ± 1.91ac14.67 ± 1.32ab62
60.71 ± 34c3.82 ± 0.08ab0.22 ± 0.02a18.81 ± 2.13a18.81 ± 1.89a113
80.76 ± 0.31a3.82 ± 0.08a0.28 ± 0.01a28.7 ± 4.80a24.87 ± 3.47a225
100.75 ± 0.41b4.34 ± 0.07a0.27 ± 0.01a24.87 ± 3.80b15.32 ± 1.81c182
220.93 ± 0.48d2.29 ± 0.07c0.10 ± 0.01e10.74 ± 2.81e12.25 ± 1.46c0
40.97 ± 00.46c3.11 ± 0.07bc0.17 ± 0.01d20.62 ± 4.73d19.98 ± 1.88bc92
61.02 ± 0.46c3.45 ± 0.06a0.18 ± 0.00c18.57 ± 4.53c28.61 ± 1.72b73
81.08 ± 0.51b3.86 ± 0.06a0.22 ± 0.01b28.1 ± 6.27b31.25 ± 3.48ab162
101.14 ± 0.55a4.31 ± 0.07a0.25 ± 0.01a36.23 ± 10.69a26.98 ± 2.33a237
2.521.43 ± 0.95c2.03 ± 0.08c0.11 ± 0.01e28.1 ± 6.43e35.4 ± 3.85e0
41.47 ± 0.89b2.85 ± 0.07bc0.16 ± 0.00d70.08 ± 14.80de91.66 ± 8.76a149
61.51 ± 0.92b3.49 ± 0.08ab0.18 ± 0.01c87.18 ± 18.48cd88.72 ± 10.48b210
81.56 ± 1.02a3.60 ± 0.08ab0.24 ± 0.01b132.80 ± 29.27a86.56 ± 6.26d373
101.62 ± 1.06a3.75 ± 0.09a0.25 ± 0.01a122.15 ± 27.63b88.22 ± 7.35c335
321.85 ± 1.25d1.65 ± 0.06d0.11 ± 0.01e27.69 ± 5.50e32.44 ± 2.37d0
41.89 ± 1.08c3.30 ± 0.05c0.18 ± 0.01d83.82 ± 16.80d74.49 ± 6.85c203
61.93 ± 1.07b4.20 ± 0.06b0.23 ± 0.01c90.99 ± 18.16bc31.75 ± 3.12d229
81.98 ± 1.07ab4.43 ± 0.05ab0.25 ± 0.01b147.21 ± 32.35b147.65 ± 19.87b432
102.03 ± 1.23a4.61 ± 0.05a0.29 ± 0.01a160.36 ± 31.67a165.39 ± 22.66a479
Notes: date represent means and standard deviation (S.D.). U, flow velocity; RR, runoff rate; RRD, flow depth; SC, sediment concentration; SLR, erosion rate; ELI, efficiency for reducing soil loss. The different letters indicate significant differences in RR, RRD, U, SLR, SC within the different slope length.
Table 5. Correlation between the relevant parameters of soil erosion and hydraulic parameters.
Grass CoversRainfall IntensitiesSlope LengthRRRRDUSLRSC
grass covers1
rainfall intensities 1
Slope length 1
RR−0.1500.928 **0.1321
RRD0.0880.1900.901 **0.2761
U−0.444 **0.0050.818 **0.2330.767 **1
SLR−0.380 *0.554 **0.466 **0.724 **0.489 **0.685 **1
SC−0.438 **0.415 **0.445 **0.591 **0.457 **0.701 **0.927 **1
Notes: RR, runoff rate; RRD, flow depth; U, flow velocity; SC, sediment concentration; SLR, erosion rate. ** means significant correlation at p < 0.01; * means significant correlation at p < 0.05.
Publisher’s Note: MDPI stays neutral with regard to jurisdictional claims in published maps and institutional affiliations.

