Article

Research on Water Rights Allocation of Coordinated Development on Water–Ecology–Energy–Food

Yellow River Institute of Hydraulic Research, Yellow River Conservancy Commission, Zhengzhou 450003, China
*
Author to whom correspondence should be addressed.
Water 2022, 14(13), 2140; https://doi.org/10.3390/w14132140
Submission received: 21 June 2022 / Revised: 2 July 2022 / Accepted: 4 July 2022 / Published: 5 July 2022

Abstract

:
Water rights trading is an important way to solve the problem of water shortage by market mechanism. The allocation of water rights among ecological water, energy water, and grain planting water are the basis of the regional water rights trade. In this paper, the concept of coordinated development of water–ecology–energy–food is proposed. We build a water rights allocation model with fairness, efficiency, and coordinated development as the goal, to achieve water security for various industries. Taking Yinchuan city as an example, the results showed that compared with the current water rights the water rights of life increased by 1.07%, the water rights of ecology increased by 1.85%, the water rights of energy industry decreased by 1.09%, the water rights of food planting decreased by 3.27%, the water rights of other agriculture increased by 0.83%, and the water rights of the general industry increased by 0.65%. After the allocation of water rights, the cooperativity of water–ecology–energy–food increased by 7.56%, and the total value of water resources in various industries increased by 2.31 × 10⁸ CNY. A new water rights allocation model is developed in this paper, which can provide a reference for the allocation of water rights among regional industries.

1. Introduction

Water, ecology, energy, and food form the basic conditions of human survival [1], and these four resources are associated with each other [2,3]. The coordination and effective uses of them not only alleviates the resource crisis [4], but also promotes the coordination of the urban social economy [5]. As a basic natural resource, strategic economic resource, and an ecological environment of important control elements [6], water can become the carrier of the coordinated development of effective regulation and the control of various resources. Reasonable water rights allocations between industries can solve the contradiction between supply and demand of regional resources [7]. It is also an important measure to promote local water–ecology–energy–food coordinated development and to effectively promote the ecological protection and high-quality development of the Yellow River Basin.
The middle and upper reaches of the Yellow River Basin Is a typical arid and semi-arid area due to the shortage of water resources and the fragile ecological environment. At the same time, this region is also an important energy production base and food planting base. Water, ecology, energy, and food are important influential factors of the regional social and economic development. The scientific analysis of the coordination among the four resources can play an important role in solving the contradiction between the supply and demand of regional resources and promoting the sustainable development of the regional economy. Many scholars have studied the coordination between regional resources. In the water-ecological-energy-food system, the relationship among water-energy-food (WEF) has been extensively studied worldwide [8,9,10]. The study of the WEF system consists mainly of two aspects: firstly, the link between the energy and water consumption, the food industry relations, and the feedback mechanism [11,12,13] (for example, such as Wu [14] and Jesus [15] revealed the associated mechanism to establish a link between the WEF model using integrated resource management for an area). Secondly, is the comprehensive safety assessment of the regional water-energy-food system (see Chen [16] and Zhang [17], respectively) on China’s Inner Mongolia and China’s global water-energy-food comprehensive safety evaluation. The development and utilization of water, food production, and energy production are directly affecting the state of the local ecological environment. It is very urgent to protect the ecological environment. However, few scholars add ecology to WEF for discussion. In this study, the ecological security is added in the water-energy-food system in order to form the water-ecological-energy-food (WEEF) composite system.
In the water–ecology–energy–food system, water, with its unique liquidity and circularity, becomes the link of the WEEF system. Reasonable water rights allocations can effectively relieve the contradiction between the water industries [18,19], and it can be an important means to promote the coordinated development of water–ecology–energy–food in the region. The water rights allocation mode aims at the coordinated development of water, ecology, energy, and food, and is an important measure to solve the increasingly prominent contradiction [20] among ecology–water, energy–water, and food–water. If we take water resources as the carrier and the object of regulation, and rationally allocate the water rights of ecology, energy, and food to make WEEF resources mutually promote development, we can realize mutual benefit and a win-win of multiple resources, and achieve the goal of coordinated development of water, ecology, energy, and food.
In this paper, the coordinated developmental relationship of regional water, ecology, energy, and food is analyzed. We take water as the control carrier and water rights allocation as the means to promote the coordinated development of water, ecology, energy, and food. The water rights allocation model is constructed according to the maximum water efficiency, the most equitable distribution, and the highest collaborative of water–ecology–energy–food. Water rights must be allocated to life, ecology, the energy industry, food planting, other agricultural and the general industrial six water industries. The water rights allocation model of coordinated development on water–ecology–energy–food is put forward in this paper. It will provide reference and basis for the optimal allocation of water rights and water rights trading in the region, and help promote the concept of coordinated development of water–ecology–energy–food.

2. Materials and Methods

2.1. The Correlation Theory

2.1.1. The Concept and Basic Principles of Water Rights Allocation

Water rights is a type of property rights, which has a different connotation after a long time of formation and development in different countries. In China, water rights are considered to be the ownership and the rights to use water resources [21]. China’s water law stipulates that the ownership of water resources belongs to the state, so what is actually allocated is the right to use the water resources. Water rights allocation refers to the distribution process of water resources use of a river basin or a region according to certain rules and mechanisms. A water rights distribution system can solve the scarcity of water resources and improve the efficiency of water resources utilization. It is an effective method to realize the optimal management of water resources.
The principles of water rights allocation generally include fairness, efficiency, basic domestic water security, basic ecological water security, etc. In order to ensure the safety of production water in ecological restoration, key energy industries, and food planting areas, the water rights allocation principle of coordinated development of water-ecology- energy-food is put forward in this study. This principle is helpful to solve the contradiction between the supply and demand of water resources among regional industries and promote the harmonious development of regional key industries.

2.1.2. The Definition of Coordinated Development on Water–Ecology–Energy–Food

Haken [22] believes that “coordinated development” is a process of co-evolution and development in a positive direction through mutual influence, interaction, continuous feedback, control, and adjustment among units. Water, ecology, energy, and food are important basic resources in the development of economy and society, as they interact with each other and are connected with each other. The ultimate goal of the coordinated development of water, ecology, energy, and food is to fully and reasonably develop and utilize various resources, meeting the needs of population growth, urban development, and maintaining economic, social, and ecological environment stability.
Based on this, the coordinated development of water–ecology–energy–food can be understood as: aiming at the rational development and sustainable utilization of water, ecology, energy, and food resources. Through the mutual cooperation and mutual feed linkage between the resource subsystems, the resources promote the development of each other, so as to achieve a mutually beneficial and a win-win situation of multiple resources. The circularity and scarcity, the mobility within and between resources, and the infinity of social demand make water resources an indispensable carrier in the construction of the water–ecology–energy–food composite system. Therefore, water resource is taken as the control object in this paper, to achieve the purpose of the coordinated development of water–ecology–energy–food. This process of mutual promotion and common development among resources can be called the coordinated development of resources. The coordinated development of various resources is of great significance to human survival, social progress, economic development and the sustainable development of maintaining a good ecological environment.

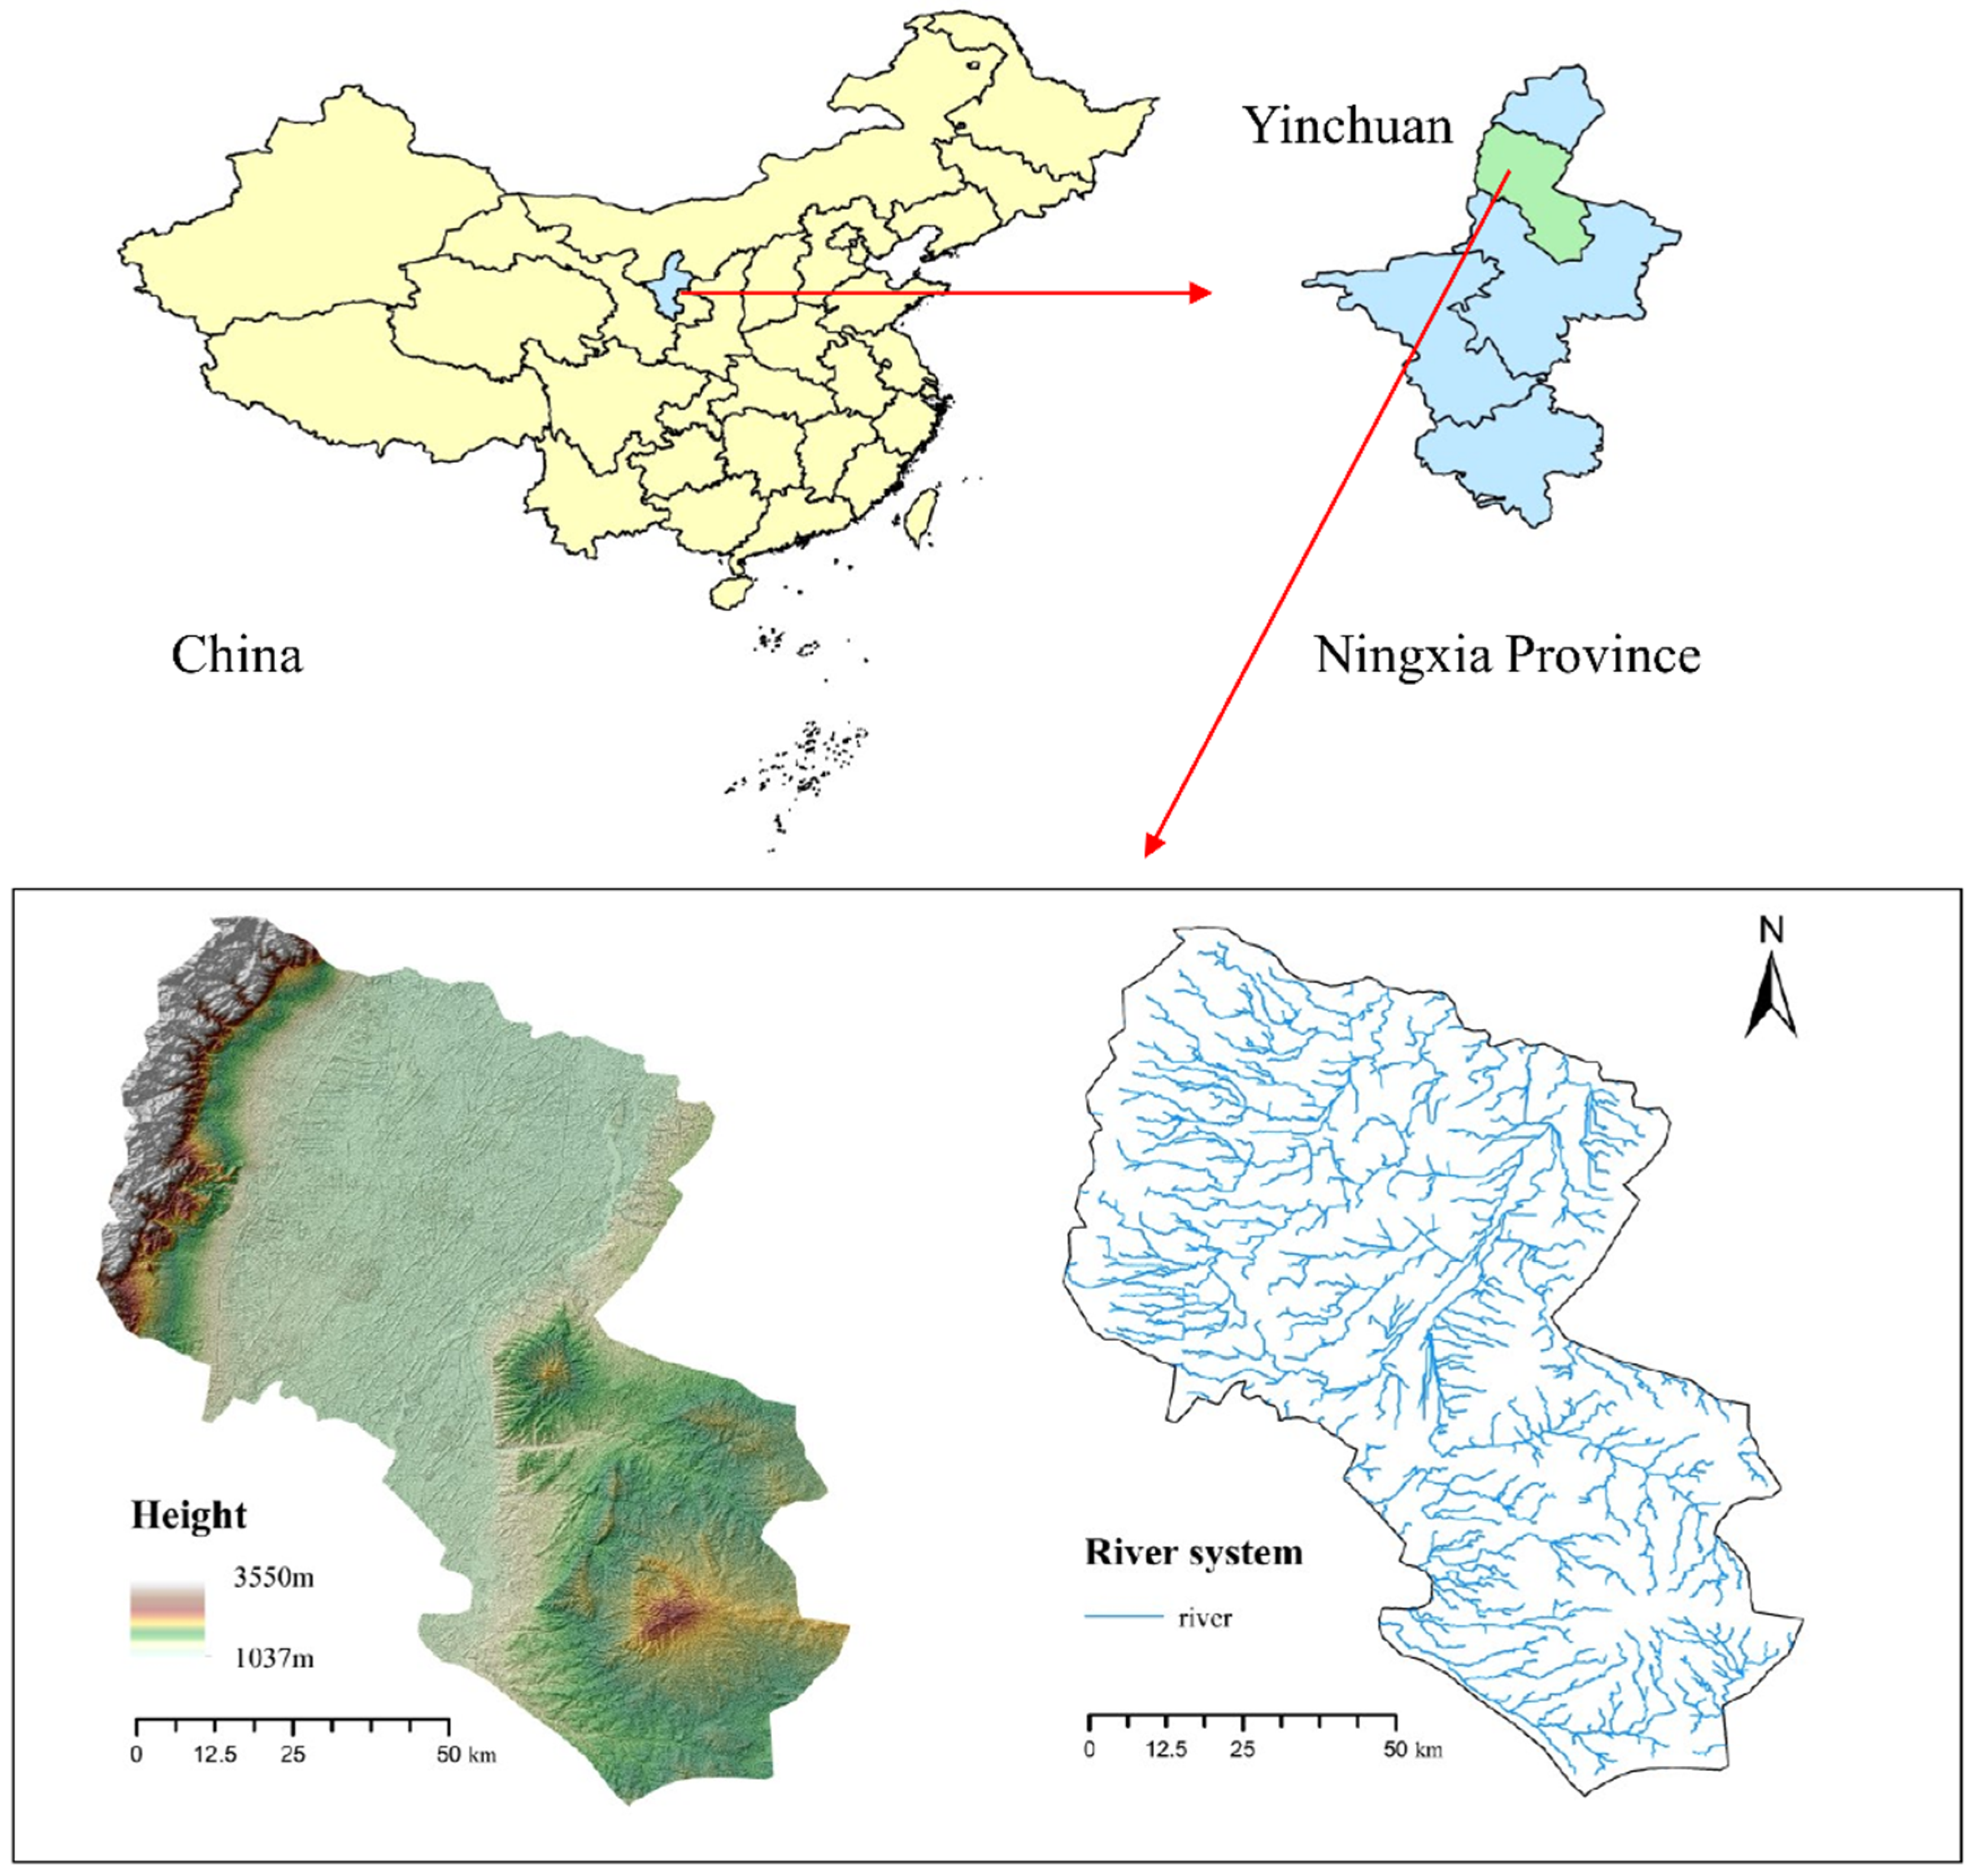
2.2. Regional Overview of the Study Area

Yinchuan, as the capital of Ningxia Hui Autonomous Region, is an important central city in Northwest China, and an important trade town on the ancient Silk Road. By the end of 2020, Yinchuan had a total area of 9025.38 km2, and a resident population of 2.29 million. On the water resources situation, the average annual precipitation in Yinchuan is only 210 mm. The Yellow River flows through the center of Yinchuan, bringing a large number of water resources, as nearly 90% of urban water comes from the Yellow River. The per capita available water resource in Yinchuan is 640 m3, which is 1/11 of the global per capita. Yinchuan crosses the northwest arid region and the eastern monsoon region, so it has various types of ecological uses. However, the natural ecosystem function of Yinchuan is on the low side, and the ecological environmental capacity is small. Its human activities have a strong influence on the environment, and in some areas cause serious environmental degradation. In terms of energy exploitation and processing, there is a large national coal production base, the “West-to-East Power Transmission” thermal power base and coal chemical industry base in Yinchuan. In terms of food planting, Yinchuan is located in the Yellow River irrigation area, which is an important food planting area. The location, terrain, and water system in Yinchuan are shown in Figure 1.

2.3. Construction of the Water Rights Allocation Model

To build a water right allocation model, the allocation principle should be established first [21]. A multi-objective water rights allocation model is established by taking the principles of fairness, efficiency, and coordinated development of water–ecology–energy–food as the objective function, and the principle of water security in the industry as the constraint.

2.3.1. The Objective Function of Fairness

The objective function of fairness is reflected by the satisfaction function of water rights allocation in each industry. The smaller the value, the smaller the difference in satisfaction with the allocated water rights among industries; that is, the fairer the water rights allocation between the industries is. The equation is as follows:
max R F = max h = 1 H W h / W Q h h = 1 H W h / W Q h = 1 H W h / W Q 2 ,
where RF is the objective function of fairness; Wh is the allocated water rights of industry h (m3); WQh is the current water rights of industry h (m3); and WQ is the sum of current water rights of various industries (m3).

2.3.2. The Objective Function of Efficiency

The objective function of efficiency needs to quantify the water resource benefits of various industries, to make the total benefit of water resources after allocation as high as possible. There are differences in the quantitative methods for the benefits of water resources in different fields, so it is necessary to select appropriate methods to uniformly quantify the benefits of water resources in various industries. The emergy analysis method is chosen to quantify the benefits of water resources in this paper. Emergy is a metric created by the American ecologist Odum [23,24], which uses solar energy as a standard to convert different substances and energy into the solar energy that forms it. The emergy method can convert the water resources benefits of various industries into the same dimension for analysis, making the distribution results more real and reliable.
(1)
Water resources benefit life, energy, food planting, other agricultural systems, and the general industry
The water resource benefits of the living, industrial, and agricultural system are reflected in the contribution of water resources as a factor of production in the activities of each system [25]. The water resource benefit of the ecosystem is calculated separately according to the benefit of different ecological water use. By analyzing the energy input and output of the system, the ratio of water resource benefit input to the total input energy of all production factors in each system, it can be multiplied by the total output emergy of the system to obtain the output emergy of water resources. The equation is:
E M h = E M W h E M I N h × E M O U T h .
where EMh is the output water emergy of industry h (sej), that is, the objective function of efficiency in h industry, including life (EML), energy industry (EMN), food planting (EMF), other agriculture (EMO), general industry (EMI); EMWh is the input water emergy of industry h (sej); EMINh is the total input emergy of industry h (sej); EMOUTh is the total output emergy of industry h (sej).
(2)
The water resources benefit for ecology
In this paper, urban ecological water use is divided into three parts: artificial lake replenishment, urban road sprinkling, and green space irrigation. Artificial lake replenishment can produce dilution and purification benefit. Watering urban roads can produce cooling and humidifying benefit and dust removal benefit. Irrigation of urban green space is a necessary condition for the growth and development of green plants, which will bring benefits of carbon fixation and oxygen release. The equation is:
E M E = W E a × τ D B + W E b × L × τ E + W E b × Δ P M 10 × τ D × 48.62 % + B C × τ C + B O × τ O × W E c W E c + W P ,
where EME is water emergy of ecology system (sej), that is, the objective function of efficiency in ecology; WEa is the quantity of artificial lake replenishment in ecological water (m3); τS is the transformity of surface water (sej/m3); WEb is the quantity of urban road sprinkling in ecological water (m3); L is the latent heat of evaporation (J/g), L = 2507.4−2.39 T, T is the average annual temperature in the study area (°C); τE is the transformity of evaporation (sej/J); ΔPM10 is the variable quantity of PM10 before and after sprinkling (μg/m3); τD is the transformity of dust (sej/μg); 48.62% is the control efficiency of sprinkling on dust particles [26]; BC is the amount of carbon fixation (g); BO is the amount of oxygen release (g); τC and τO are the transformities of carbon fixation and oxygen release (sej/g) [25]; WEc is the quantity of green space irrigation (m3); WP is natural precipitation (m3).
(3)
The efficiency objective function of water rights allocation established according to the above items is:
max R S = max E M L + E M E + E M N + E M F + E M O + E M I ,
where RS is the objective function of efficiency.

2.3.3. The Objective Function of Coordinated Development

In order to demonstrate the principle of water–ecology–energy–food coordinated development in the process of water rights allocation, the existing coordinated development status can be quantified into a specific value, which is called the coordinated development index. The greater the coordinated development index is, the better the coordinated development status of the four resources is. The maximum index of coordinated development is taken as the objective function. The comprehensive evaluation method is used to calculate the coordinated development index. The comprehensive evaluation method [27,28] can select objective indicators from the regional economic, social, and ecological environment. Multiple indicators can be evaluated systematically and normatively at the same time, and the evaluation results can be quantified. Finally, a general numerical value is formed, and the evaluation purpose is achieved through numerical comparison.
(1)
The selection of comprehensive evaluation indicators for coordinated development is shown in Table 1.
(2)
The coordinated development index can be quantified with the entropy weight method:
(A)
Normalization treatment
when the indicator is positive
y i j = x i j min x j max x j min x j ,
when the indicator is negative
y i j = max x j x i j max x j min x j ,
where yij is normalized data; max(xj) is the maximum indicator j in n years; and min(xj) is the minimum indicator j in n years.
(B)
The calculation of the index
Calculate the weight of the indicator in the year i under the index j:
P i j = y i j i = 1 n y i j ,   i = 1 , 2 , , n .
Calculate the information entropy of indicator j:
E j = 1 ln n × i = 1 n P i j × ln P i j .
Determine the weight of indicator j:
M j = 1 E j k j = 1 k E j ,   j = 1 , 2 , , l .
Calculate the coordinated development indicator Gi in the year i:
G i = j = 1 k M j × y i j .
(C)
The objective function of coordinated development
max R G = max G ,
where RG is the objective function of the coordinated development on water–ecology–energy–food.

2.3.4. The Constraints of Industry Water Rights

The current water rights security for industrial and agricultural production and the water rights security for future life are taken, as constraints in this model. Domestic water is the sum of water for the daily life of residents and urban public water. Ecological water includes artificial lake replenishment, urban road sprinkler, and green space irrigation. The energy industry includes coal mining, coal washing, coking, crude oil refining (including gasoline, diesel, kerosene and other crude oil processing industries), and thermal power generation. Food planting includes the cultivation of rice, corn, wheat, and beans (potatoes do not grow in Yinchuan). Other agriculture includes planting industries other than food crops, as well as timber, livestock products, and fishery products. Other agriculture includes farming other than food crops, as well as timber, animal, and fish products.
(1)
The constraints of water rights of life:
W L 1 + N U a P U × Q U + 1 + N R a P R × Q R + G D P U P 1 + N U P a × M G D P ,
where WL is the water rights of life (m3); PU, PR are the number of urban people and rural people; NU, NR are the population growth rate of urban and rural; QU, QR are the per capita domestic water quota for urban and rural; GDPUP is the GDP of urban public industry; NUP is GDP growth rate of urban public industry; and MGDP is the water consumption per CNY 10,000 GDP; a is the year for future domestic water security.
(2)
The constraints of water rights of ecology:
W E S G × M G + S L × E L + K L + S R × M R ,
where WE is the water rights of ecology (m3); SG is the greening coverage area; MG is the quota for greening irrigation; SL is the area of artificial lake; EL is the evaporation supply quota of local lakes; KL is the infiltration supply quota of local lakes; SR is the area of urban roads; and MR is quota of urban road sprinkling.
(3)
The constraints of water rights of energy industry:
W N R N k × M N k ,
where WN is the water rights of energy industry (m3); RNk is the production of energy k; MNk is the water quota for the exploitation or processing of energy k.
(4)
The constraints of water rights of food planting:
W F R F k × M F k .
(5)
The constraints of water rights of other agriculture:
W O R O k × M O k ,
where WO is the water rights of other agriculture (m3); ROk is the production of other agriculture k; MOk is the water quota of other agriculture.
(6)
The constraints of water rights of general industry:
W I R I k × M I k ,
where WI is the water rights of general industry (m3); RIk is the production of general industry k; MIk is the water quota of general industry.
(7)
The constraints of total water rights:
W L + W E + W N + W F + W O + W I W R ,
where WR is the total water rights in this city.
(8)
The method to solve model
The MATLAB software and particle swarm optimization algorithm are used to solve the water rights allocation model in this study.

3. Results

According to the water rights allocation model proposed above, Yinchuan in 2019 is taken as an example to calculate the water rights allocation of coordinated development on water–ecology–energy–food. Among the data required for calculation, the water resources data are from Ningxia Water Resources Bulletin (2013–2019) [29,30,31,32,33,34,35], and social and economic data are from Yinchuan Statistical Yearbook (2014–2020) [36,37,38,39,40,41,42]. The total amount data of water rights allocation in Yinchuan comes from the Yellow River Institute of Hydraulic Research. We put the data into Equations (1) to (18), using MATLAB software to compile the particle swarm optimization algorithm for iterative solution. The result of water rights allocation for the coordinated development on water–ecology–energy–food in Yinchuan is obtained, as shown in Table 2:

4. Discussion

4.1. Results Analysis of Water Resources Value in Various Industries

(1)
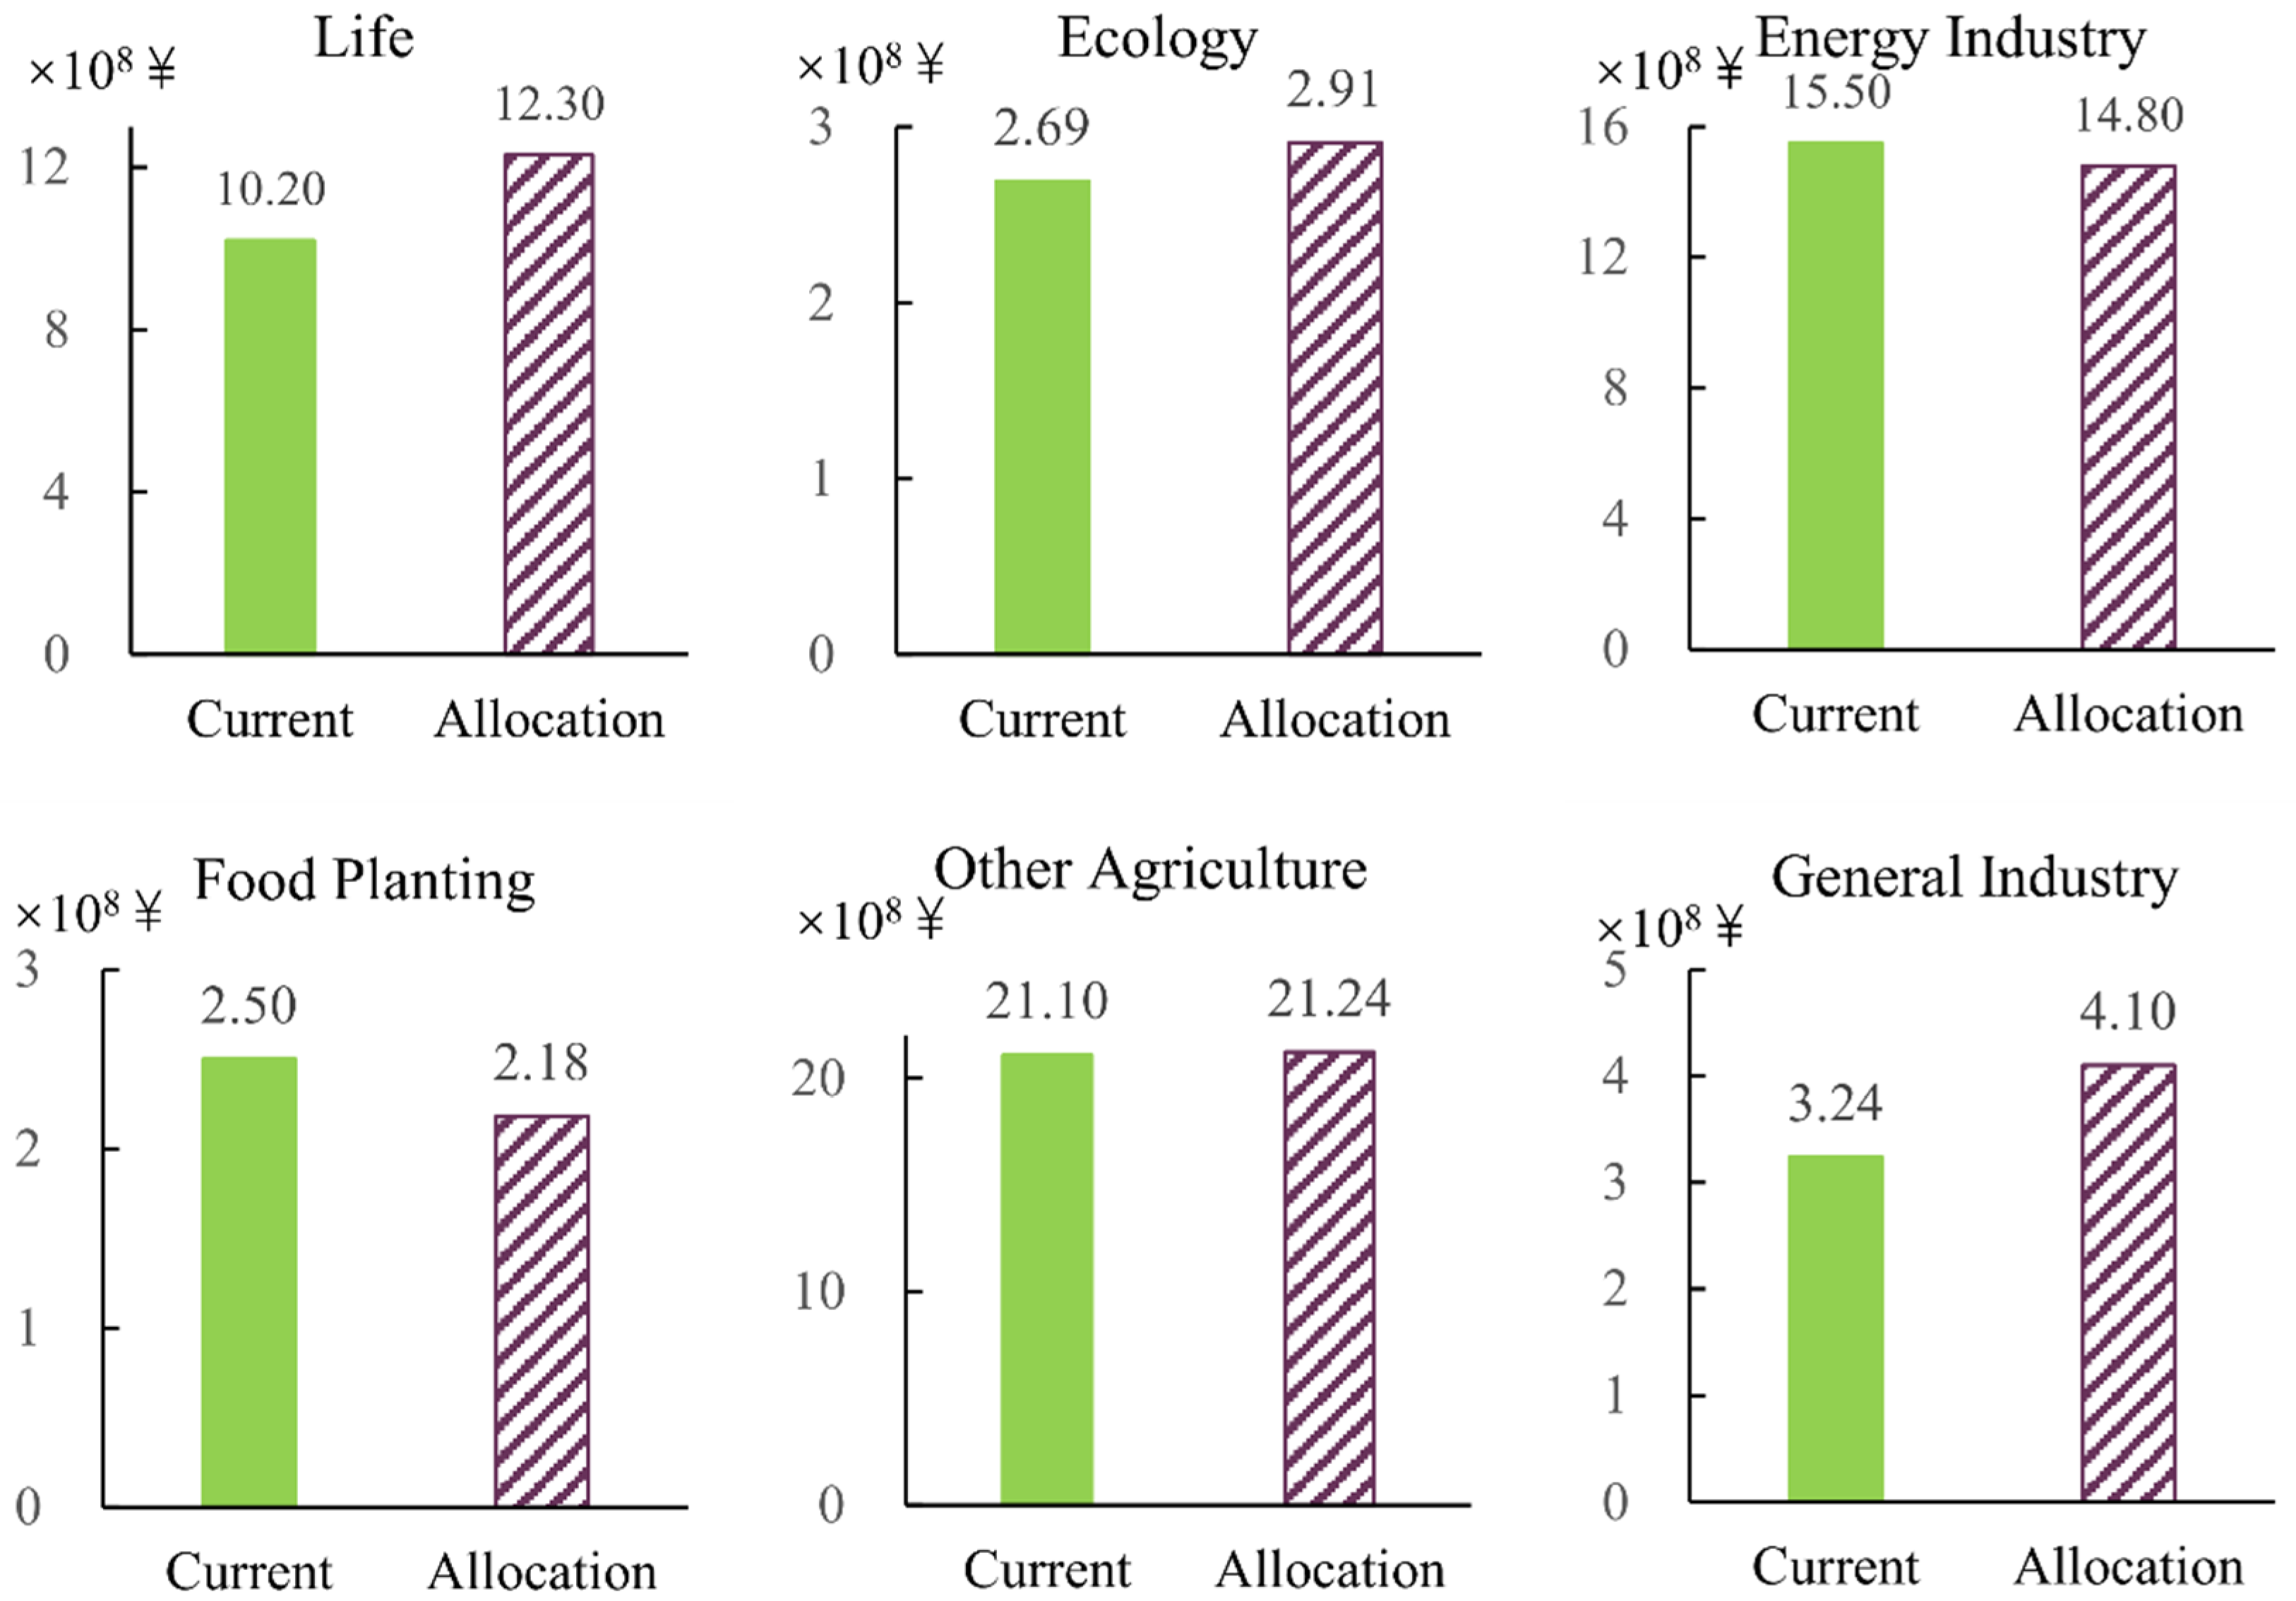
Comparison of the water resources value in various industries under current water rights and allocated water rights. In the efficiency objective of city-industry water rights allocation model, the emergy method is used to calculate the value of water resources in various industries in this paper. The comparison of water resources value in various industries before and after water rights allocation is shown in Figure 2:
It can be seen from Figure 2, after the allocation of water rights for the coordinated development on water- ecology-energy-food, the value of water resources in various industries in Yinchuan has changed. The water resources value in the living system it increased by 2.10 × 10⁸ CNY, in the ecosystem it increased by 0.22 × 10⁸ CNY, in the energy industry system it decreased by 0.70 × 10⁸ CNY, in the food planting system it decreased by 0.32 × 10⁸ CNY, it increased by 0.14 × 10⁸ CNY in other agricultural systems, and it increased by 0.86 × 10⁸ CNY in general industrial systems. The total water resources value increased by 2.31 × 10⁸ CNY compared with before allocation. It can be seen that after the allocation of water rights, the overall value of water resources in Yinchuan city has increased, and the efficiency of water resources utilization has improved. When Li et al. [43] optimized the regional water use structure based on water resource vulnerability, they also took the industrial water resource value as an important influencing factor to allocate water resources. In this paper, emergy method is used to quantify the water resources value in various industries, which is conducive to obtain the objective and reliable allocated results.
(2)
Comparison of the value of water resources per cubic meter in various industries. According to the calculation of the value of water resources and the allocation results of water rights in various industries, the value of water resources per cubic meter in Yinchuan city can be obtained. The value of water resources per cubic meter of the living system is the highest, reaching 15.54 CNY/m3, followed by that of the energy industry system, reaching 10.28 CNY/m3, and that of the food production system is the lowest, only 0.67 CNY/m3. The value of water resources per cubic meter in the ecosystem is 2.05 CNY/m3, that of other agricultural systems is 4.94 CNY/m3, and that of general industrial systems is 5.37 CNY/m3. Wang Yu et al. [44] used the emergy method to calculate the value of water resources per cubic meter of the four sectors (life, industry, extra-river ecology, and agriculture) in nine provinces and autonomous regions in the Yellow River Basin. They also obtained the result that the value of water resources per cubic meter of life sector is the largest and that of the agriculture sector is the smallest. Li et al. [43] also suggested that the value of water resources per cubic meter of agriculture is minimal. The food planting industry is faced with the problem of low water efficiency, and it is a trend that accelerates the development of regional water-saving agricultural engineering renovation.

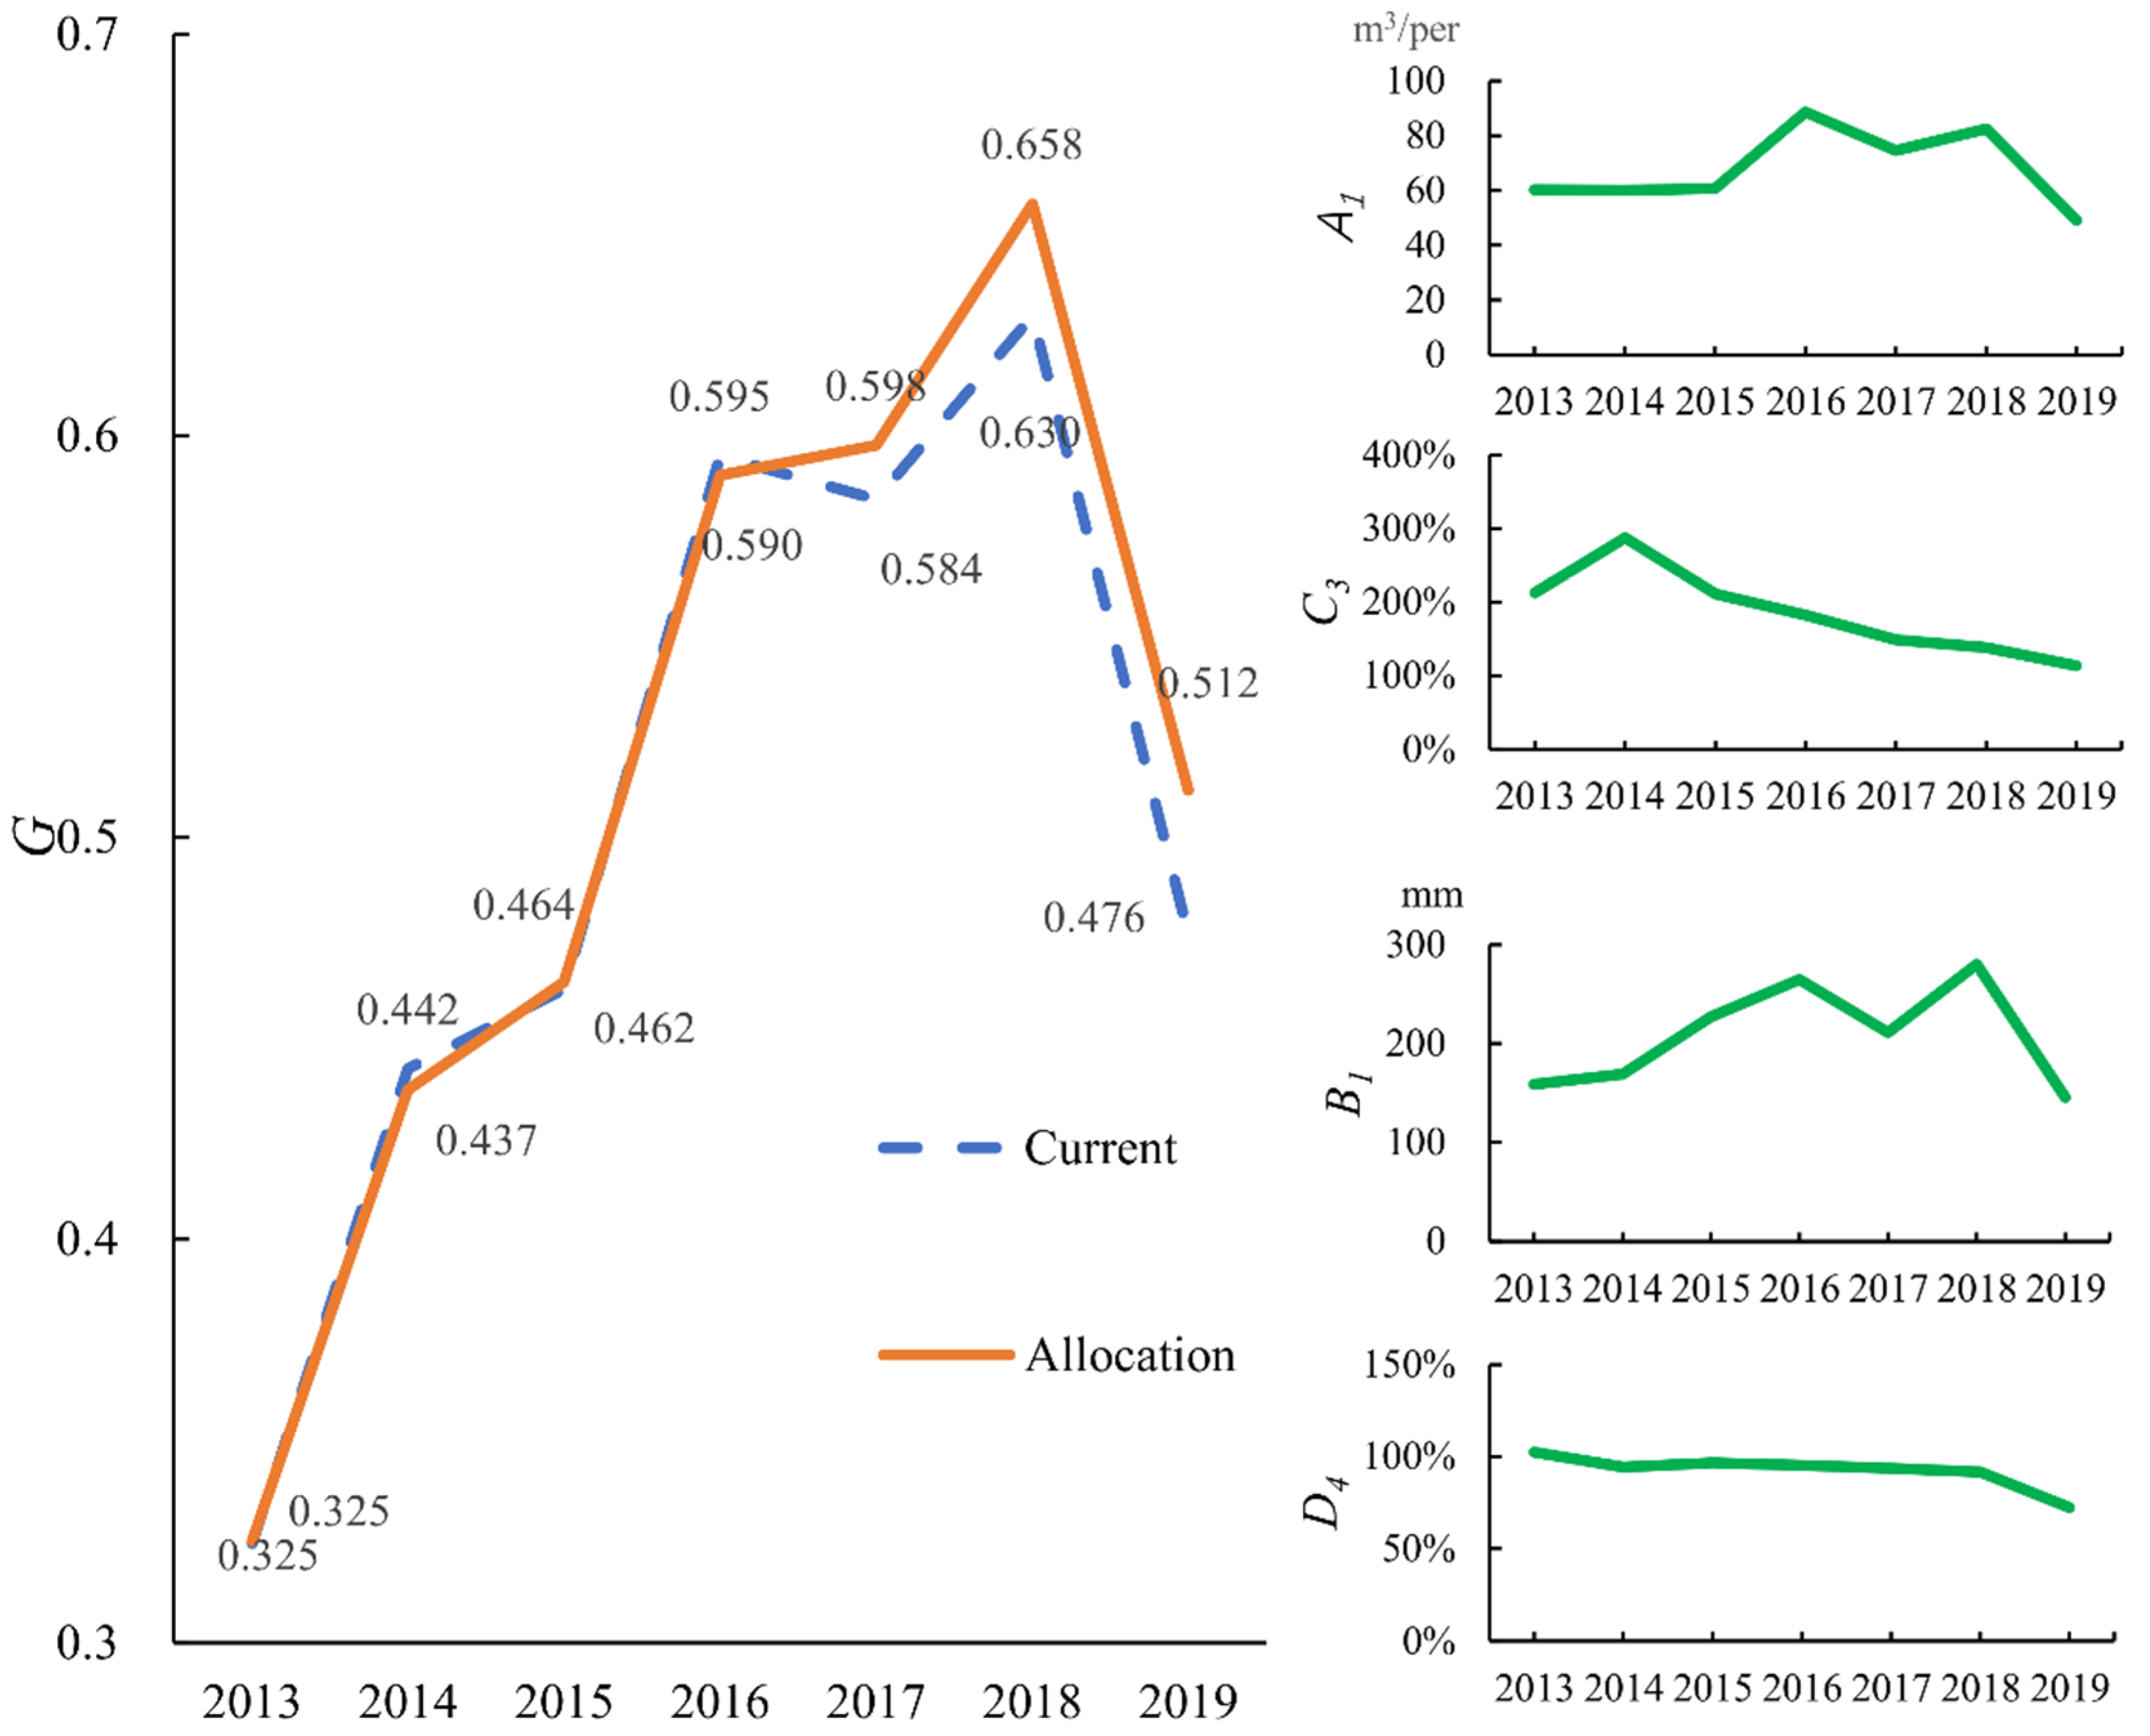
4.2. Results Analysis of Coordinated Development Index G

Through the optimal allocation of the right to use water resources of various industries in Yinchuan in 2019, the change of water rights of various industries will directly affect the values of some comprehensive evaluation indicators. It will thus change the size of the coordinated development index on water–ecology–energy–food. The trend and comparative analysis of that in Yinchuan from 2013 to 2019 under the condition of current water rights and allocated water rights are shown in Figure 3:
As can be seen from Figure 3, in terms of the extended development trend of the water–ecology–energy–food coordinated development index, except that the current water rights declined in 2017, the current indexes and the allocated indexes basically showed an upward trend from 2013 to 2018. Both dropped significantly in 2019 compared to the previous year. Through the analysis of comprehensive evaluation indicators data, it is found that natural annual precipitation (B1) decreased significantly in Yinchuan in 2019, and the energy exploitation and food crop yield was decreased. As the result, the per capita water resources (A1), energy self-sufficiency rate (C3) and food self-sufficiency rate (D4) and other positive indicators decreased significantly, which has an impact on the coordinated development index in this year. The coordinated development index under the current water rights condition has a slight decline in 2017, which is due to the obvious decline of annual precipitation (B1) in this year compared with 2016.
It can also be seen from Figure 3 that in 2014 and 2016, the coordinated development index under current water rights is slightly larger than that under allocated water rights, which is mainly caused by the changing trend of the proportion of water rights in food planting (AD1). The proportion of water rights of food planting (AD1) peaked in 2014 and 2016, at 52.36% and 51.54%. Compared with the situation of current water rights in 2019, it is 30.90%, and the proportion of water rights of food planting (AD1) under allocated water rights is even smaller, only 27.62%. Under the condition of allocated water rights, the proportion of water rights of food planting (AD1) is more discrete than the current water rights, which leads to the decrease of the coordinated development index of water–ecology–energy–food.
From 2013 to 2016, the coordinated development index under the condition of allocated water rights was basically equal to that under the condition of current water rights. From 2017 to 2019, the coordinated development index under the condition of allocated water rights was significantly higher than that under the condition of current water rights. It can be shown that the regional water–ecology–energy–food coordinated development state obtained by water rights allocation in this paper is superior to the current situation. The water rights allocation model established in this paper can provide reference and help to promote the coordinated development of regional water–ecology–energy–food.

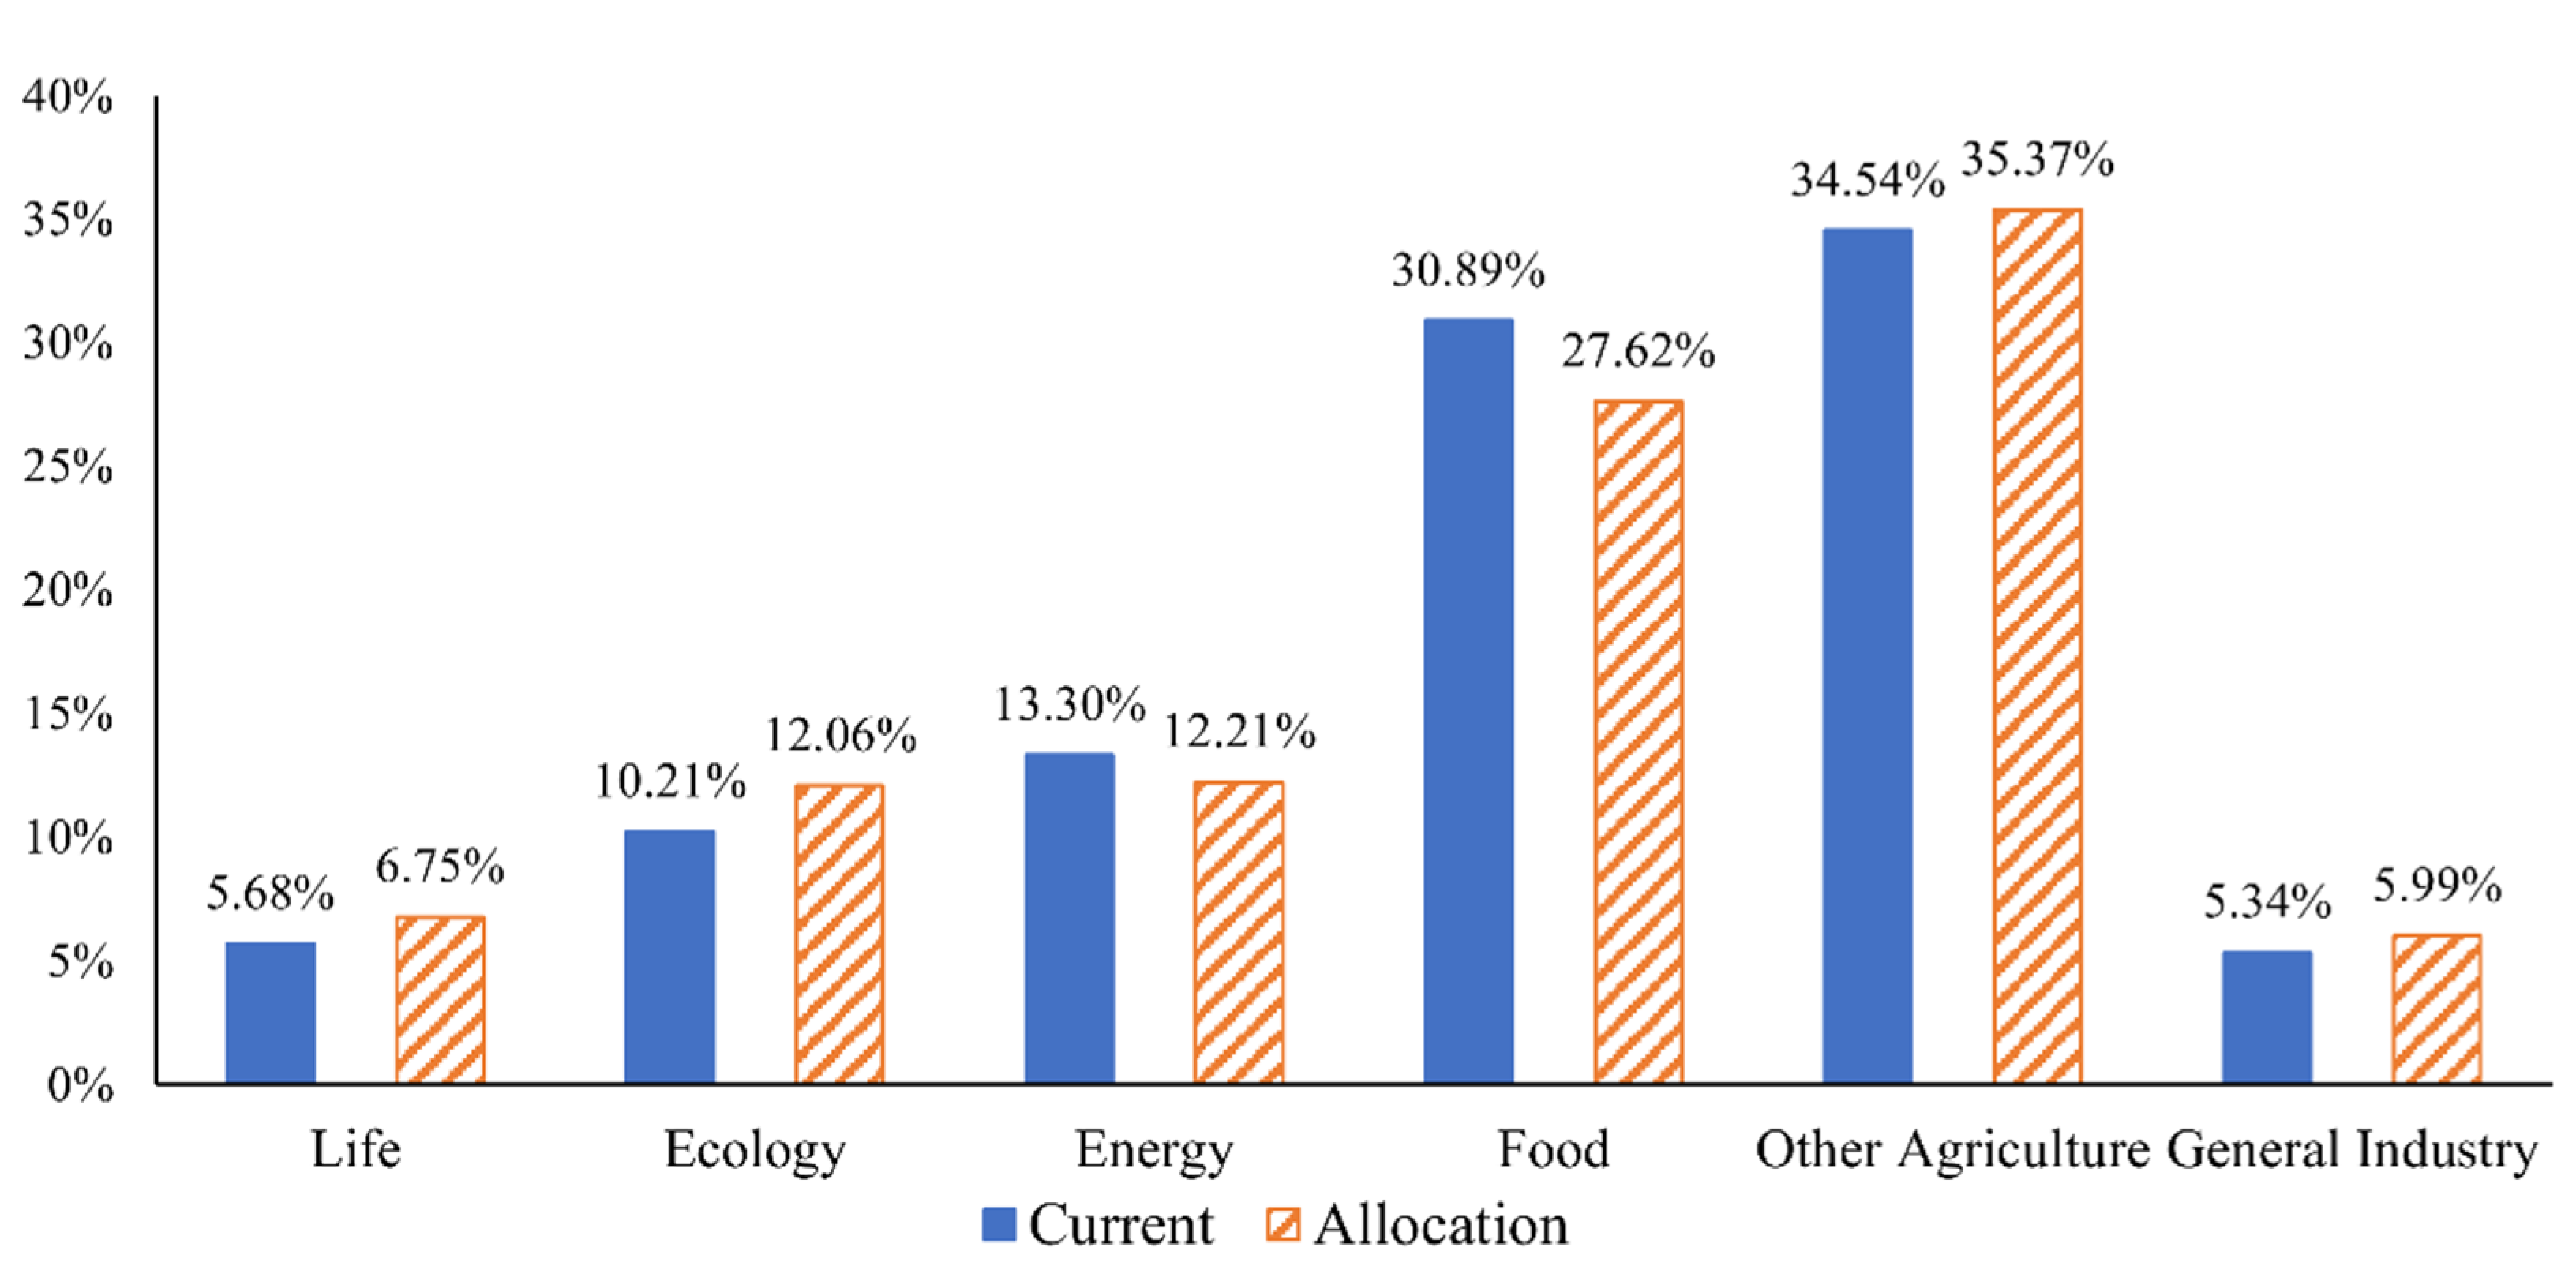
4.3. Results Analysis of Water Rights Allocation

A comparative analysis is made between the current water rights of various industries in Yinchuan in 2019 and the allocated water rights in various industries based on the coordinated development of water–ecology–energy–food in this paper, as shown in Figure 4.
As can be seen from Figure 4, the allocated water rights of life in Yinchuan increased by 1.07%, the allocated water rights of ecology increased by 1.85%, the allocated water rights of energy industry decreased by 1.09%, that of food planting decreased by 3.27%, that of other agriculture increased by 0.83%, and general industry increased by 0.65% compared with the current water rights. Water rights of life and ecology have increased, while agricultural water rights have decreased and industrial water rights have little change, which is consistent with the optimization trend of water resources in the Yellow River Basin proposed by Xia et al. [45]. In addition, according to Yinchuan’s future economic and social development focus, urban planning and industrial and agricultural construction characteristics, the water rights allocation scheme based on coordinated development of water–ecology–energy–food in this paper is reasonable and sustainable, which can provide some reference for the reasonable allocation of regional water rights.

5. Conclusions

In this paper, the water resource is taken as the object of control, and a municipal-industry water rights allocation model for the coordinated development of water–ecology–energy–food is established. The fairness objective of the model is established by satisfaction function, the efficiency objective is established by the emergy method, and the coordinated development objective is calculated by comprehensive evaluation method. We calculate the water security for each industry as constraints of the water right allocation model. The conclusions are as follows:
(1)
Water, ecology, energy, and food crises are major challenges to current global development. These four resources are intertwined and affect each other, and can therefore not be discussed individually. Therefore, starting from their coordinated development, they can better solve the crisis. The quantitative method of water–ecology–energy–food coordinated development constructed in this study, and the quantitative calculation results of Yinchuan coordinated development, can provide management reference for management departments;
(2)
In this paper, the emergy method is used to achieve a unified and objective quantitative calculation of the value of water resources in various industries, which makes the result of water rights allocation more reliable. At the same time, it also has certain fairness significance. The Emergy method can realize the unified quantification of the economic, social, and ecological environmental value of water resources. The value of water resources calculated by this method is more scientific and reasonable;
(3)
The water rights allocation model of regional water–ecology–energy–food coordinated development established in this paper has ensured the water security of ecological restoration, key energy industries, and food planting. It can take reference and help for effectively solving the contradiction between the supply and demand of regional water resources, promoting the harmony of water use in various industries. It can also promote the sustainable development of economy, society, and ecology.
There are still some shortcomings in this paper: It is difficult to completely distinguish the cross industries when dividing the industries, and it is also difficult to make comprehensive statistics of all water use units in the industry. Further research is needed in the future.

Author Contributions

All authors contributed to the study conception and design. Data curation, H.Y.; formal analysis, W.Z.; methodology, Y.H.; writing—original draft, Y.H.; writing—review and editing, W.Z. All authors commented on previous versions of the manuscript. All authors have read and agreed to the published version of the manuscript.

Funding

This research was funded by Basic R&D Special Fund of Central Government for Non-profit Research Institutes (HKY-JBYW-2020-17) and National Natural Science Foundation of China (No. 51979119).

Institutional Review Board Statement

Not applicable.

Informed Consent Statement

Not applicable.

Data Availability Statement

The original data used during the study were provided by a third party. The data that support the findings of this study are available in “Ningxia Water Resources Bulletin” and “Yinchuan Statistical Yearbook”. These data were derived from the following resources available in the public domain: Ningxia Water Resources Bulletin: http://slt.nx.gov.cn/xxgk_281/fdzdgknr/gbxx/szygb/ accessed on 20 June 2022. Yinchuan Statistical Yearbook: http://www.yinchuan.gov.cn/xxgk/zfxxgkml/tjxx/tjnj/ accessed on 20 June 2022. The authors have made sure that all data and materials as well as software application or custom code comply with field standards.

Conflicts of Interest

The authors have no conflict of interest to declare that are relevant to the content of this article.

References

  1. Deng, C.; Wang, H.; Hong, S.; Zhao, W.; Wang, C. Meeting the challenges of food-energy-water systems in typical mega-urban regions from final demands and supply chains: A case study of the Bohai mega-urban region, China. J. Clean. Prod. 2021, 320, 128663. [Google Scholar] [CrossRef]
  2. Lai, Y. A Study on Regional Characteristics of China’s Water-Energy-Food Synergy Demand. Beijing Plan. Rev. 2019, 1, 74–77. [Google Scholar]
  3. Sun, C.; Yan, X. Security evaluation and spatial correlation pattern analysis of water resources-energy-food nexus coupling system in China. Water Resour. Prot. 2018, 34, 1–8. [Google Scholar]
  4. Brenda, C.; Aurora del, C.; José, M. A water-energy-food security nexus framework based on optimal resource allocation. Environ. Sci. Policy 2022, 133, 1–16. [Google Scholar] [CrossRef]
  5. Hao, L.; Wang, P.; Yu, J.; Ruan, H. An integrative analytical framework of water-energy-food security for sustainable development at the country scale: A case study of five Central Asian countries. J. Hydrol. 2022, 607, 127530. [Google Scholar] [CrossRef]
  6. Chen, R. Preliminary study on water resources regulation model in western basin based on Ecological Reconstruction. Bull. Chin. Acad. Sci. 2005, 20, 37–41. [Google Scholar] [CrossRef]
  7. Mu, L.; Liu, Y.; Chen, S. Alleviating water scarcity and poverty through water rights trading pilot policy: A quasi-natural experiment based approach. Sci. Total Environ. 2022, 823, 153318. [Google Scholar] [CrossRef]
  8. Smajgl, A.; Ward, J.; Pluschke, L. The water-food-energy nexus-realizing a new paradigm. J. Hydrol. 2016, 533, 533–540. [Google Scholar] [CrossRef]
  9. Jalilov, S.M.; Keskinen, M.; Varis, O.; Amer, S. Managing the water-energy-food nexus: Gains and losses from new water development in Amu Darya River basin. J. Hydrol. 2016, 539, 648–661. [Google Scholar] [CrossRef]
  10. Scanlon, B.R.; Ruddell, B.L.; Reed, P.M.; Hook, R.I.; Zheng, C.; Tidwell, V.C.; Siebert, S. The food-energy-water nexus: Transforming science for society. Water Resour. Res. 2017, 53, 3550–3556. [Google Scholar] [CrossRef]
  11. Hertel, T.; Steinbuks, J.; Baldos, U. Competition for land in the global bioeconomy. Agric. Econ. 2012, 44, 129–138. [Google Scholar] [CrossRef]
  12. Howells, M.; Hermann, S.; Welsch, M.; Bazilian, M.; Segerström, R.; Alfstad, T.; Gielen, D.; Rogner, H.; Fischer, G.; van Velthuizen, H.; et al. Integrated analysis of climate change, land-use, energy and water strategies. Nat. Clim. Change 2013, 3, 621–626. [Google Scholar] [CrossRef]
  13. Jeswani, H.K.; Burkinshaw, R.; Azapagic, A. Environmental sustainability issues in the food-energy-water nexus: Breakfast cereals and snacks. Sustain. Prod. Consum. 2015, 2, 17–28. [Google Scholar] [CrossRef]
  14. Wu, L.; Elshorbagy, A.; Pande, S.; Zhuo, L. Trade-offs and synergies in the water-energy-food nexus: The case of Saskatchewan, Canada. Resour. Conserv. Recycl. 2021, 164, 105192. [Google Scholar] [CrossRef]
  15. Núñez-López, J.M.; Rubio-Castro, E.; Ponce-Ortega, J.M. Involving resilience in optimizing the water-energy-food nexus at macroscopic level. Process Saf. Environ. Prot. 2021, 147, 259–273. [Google Scholar] [CrossRef]
  16. Chen, J.; Chen, L.; Liu, L.; Zhi, Y. Safety evaluation of regional Mater-Energy-Food system based on Pressure-State-Response model. In Proceedings of the Chinese Soft Science Anthology of China Soft Science Research Association in 2019, Beijing, China, 23–24 November 2020; pp. 127–137. [Google Scholar] [CrossRef]
  17. Zhang, H. Comprehensive Evaluation and Coupling Coordination Analysis of Water, Energy and Food Systems in China. Master’s Thesis, Lanzhou University, Lanzhou, China, 2019. [Google Scholar]
  18. Gómez-Limón, J.A.; Gutiérrez-Martín, C.; Montilla-López, N.M. Agricultural Water Allocation under Cyclical Scarcity: The Role of Priority Water Rights. Water 2020, 12, 1835. [Google Scholar] [CrossRef]
  19. Zahra, G.; Saeid, S. Multi-objective optimization of quantitative-qualitative operation of water resources systems with approach of supplying environmental demands of Shadegan Wetland. J. Environ. Manag. 2021, 292, 112769. [Google Scholar] [CrossRef]
  20. Peng, S.; Zheng, X.; Wang, Y.; Jiang, G. Coordinated optimization of water resources, energy and grain in the Yellow River Basin. Adv. Water Sci. 2017, 28, 681–690. [Google Scholar] [CrossRef]
  21. Zheng, H.; Wang, Z.; Zhao, J. Distribution, Management and Trade of Water Rights—Theory, Technology and Practice; China Water & Power Press: Beijing, China, 2019. [Google Scholar]
  22. Haken, H.; Wunderlin, A.; Yigitbasi, S. An introduction to Synergetics; Kluwer Academic Publishers: Dordrecht, The Netherlands, 1995. [Google Scholar]
  23. Odum, H.T.; Odum, E.C.; Blisseltt, M. Ecology and economy: Emergy analysis and public policy in Texas. In Results of Policy Research Project; LBI School of Public Affairs, State Department of Agriculture: Austin, TX, USA, 1987. [Google Scholar]
  24. Odum, H.T. Environmental Accounting: Emergy and Decision Making; Wiley: New York, NY, USA, 1996. [Google Scholar]
  25. Lv, C.; He, Y.; Zhang, W.; Gu, C.; Li, Y.; Yan, D. Quantitative Analysis of Eco-economic Benefits of Urban Reclaimed Water Greening Based on Emergy Theory. Water Resour. Manag. 2021, 35, 5029–5047. [Google Scholar] [CrossRef]
  26. Lv, C.; Zhang, W.; Ling, M.; Li, H.; Zhang, G. Quantitative analysis of eco-economic benefits of reclaimed water for controlling urban dust. Environ. Geochem. Health 2020, 42, 2963–2973. [Google Scholar] [CrossRef]
  27. Liu, X.; Cao, Y. Evaluation of regional coordinated development from the perspective of two oriented Society—An Empirical Analysis Based on Changsha Zhuzhou Xiangtan Urban Agglomeration. Sci. Technol. Prog. Policy 2011, 28, 108–113. [Google Scholar] [CrossRef]
  28. Li, M.; Liu, L. A comprehensive evaluation study on the level of urban-rural coordinated development—An Empirical Study Based on the data of Hubei Province. Financ. Account. Mon. 2021, 22, 144–150. [Google Scholar] [CrossRef]
  29. Yinchuan Water Conservancy Bureau. The Water Resources Bulletin of Yinchuan City (2013–2019); Yinchuan Water Conservancy Bureau Publications: Yinchuan, China, 2013. [Google Scholar]
  30. Yinchuan Water Conservancy Bureau. The Water Resources Bulletin of Yinchuan City (2013–2019); Yinchuan Water Conservancy Bureau Publications: Yinchuan, China, 2014. [Google Scholar]
  31. Yinchuan Water Conservancy Bureau. The Water Resources Bulletin of Yinchuan City (2013–2019); Yinchuan Water Conservancy Bureau Publications: Yinchuan, China, 2015. [Google Scholar]
  32. Yinchuan Water Conservancy Bureau. The Water Resources Bulletin of Yinchuan City (2013–2019); Yinchuan Water Conservancy Bureau Publications: Yinchuan, China, 2016. [Google Scholar]
  33. Yinchuan Water Conservancy Bureau. The Water Resources Bulletin of Yinchuan City (2013–2019); Yinchuan Water Conservancy Bureau Publications: Yinchuan, China, 2017. [Google Scholar]
  34. Yinchuan Water Conservancy Bureau. The Water Resources Bulletin of Yinchuan City (2013–2019); Yinchuan Water Conservancy Bureau Publications: Yinchuan, China, 2018. [Google Scholar]
  35. Yinchuan Water Conservancy Bureau. The Water Resources Bulletin of Yinchuan City (2013–2019); Yinchuan Water Conservancy Bureau Publications: Yinchuan, China, 2019. [Google Scholar]
  36. Yinchuan Bureau of Statistics. The Statistical Yearbook of Yinchuan (2014); China Statistics Press: Beijing, China, 2014. [Google Scholar]
  37. Yinchuan Bureau of Statistics. The Statistical Yearbook of Yinchuan (2015); China Statistics Press: Beijing, China, 2015. [Google Scholar]
  38. Yinchuan Bureau of Statistics. The Statistical Yearbook of Yinchuan (2016); China Statistics Press: Beijing, China, 2016. [Google Scholar]
  39. Yinchuan Bureau of Statistics. The Statistical Yearbook of Yinchuan (2017); China Statistics Press: Beijing, China, 2017. [Google Scholar]
  40. Yinchuan Bureau of Statistics. The Statistical Yearbook of Yinchuan (2018); China Statistics Press: Beijing, China, 2018. [Google Scholar]
  41. Yinchuan Bureau of Statistics. The Statistical Yearbook of Yinchuan (2019); China Statistics Press: Beijing, China, 2019. [Google Scholar]
  42. Yinchuan Bureau of Statistics. The Statistical Yearbook of Yinchuan (2020); China Statistics Press: Beijing, China, 2020. [Google Scholar]
  43. Li, R.; Guo, P.; Li, J. Regional Water Use Structure Optimization Under Multiple Uncertainties Based on Water Resources Vulnerability Analysis. Water Resour. Manag. 2018, 32, 1827–1847. [Google Scholar] [CrossRef]
  44. Wang, Y.; Peng, S.; Wu, J.; Chang, J.; Zhou, X.; Shang, W. Research on the theory and model of water resources equilibrium regulation in the Yellow River basin. J. Hydraul. Eng. 2020, 51, 44–55. [Google Scholar] [CrossRef]
  45. Xia, C.; Pahl-Wostl, C. The Development of Water Allocation Management in The Yellow River Basin. Water Resour. Manag. 2012, 26, 3395–3414. [Google Scholar] [CrossRef]
Figure 1. Overview map of the location, terrain, and water system in Yinchuan.
Water 14 02140 g001
Figure 2. Comparison chart of water resources value in various industries under different water rights.
Water 14 02140 g002
Figure 3. Trend and comparison of the water–ecology–energy–food coordinated development index in Yinchuan city from 2013 to 2019 under different water rights conditions.
Water 14 02140 g003
Figure 4. Comparison of the percentage of current water rights and allocated water rights in various industries.
Water 14 02140 g004
Table 1. The comprehensive evaluation indicators of water–ecology–energy–food coordinated development.
SystemIndicatorUnitIndicator Attribute
WaterPer capita water resources (a1)m3/pc+
Utilization ratio of water resources (A2)%
Utilization ratio of groundwater resources (A3)%
Utilization ratio of unconventional water (A4)%+
Water consumption of 104 CNY GDP (A5)m3/104 CNY
EcologyAnnual precipitation (b1)mm+
Green space coverage rate (B2)%+
Per capita green area (B3)m2/pc+
EnergyPer capita energy production (c1)tce/pc+
Energy consumption of 104 CNY GDP (C2)tce/104 CNY
Energy self-sufficiency rate (C3)%+
FoodPer capita cultivated area (d1)m2/pc+
Per capita food production (D2)kg/pc+
Proportion of added value in primary industry (D3)%
Food self-sufficiency rate (D4)%+
Water–ecologyProportion of water rights in ecology (ab1)%+
Water–energyWater consumption of per unit energy production (ac1)m3/tce
Proportion of water rights in energy industry (AC2)%
Proportion of water rights in general industry (AC3)%
Water–foodProportion of water rights in food planting (ad1)%
Irrigation water consumption of
Per unit cultivated area (AD2)
m3/hm2
Coefficient of irrigation water effective utilization (AD3) +
Ecology–energyProportion of clean energy generation (bc1)%+
Ecology–foodApplication amount of chemical fertilizer
Per unit cultivated area (bd1)
t/hm2
Energy–foodAgricultural machinery power per unit cultivated area (cd1)kw/hm2
Proportion of energy consumption in primary industry (CD2)%
EconomicPer capita gdp (j1)104 CNY/pc+
GDP growth rate (J2)%+
Proportion of added value in tertiary industry (J3)%+
SocialProportion of water rights in life (h1)%+
Rate of population growth (H2)
Engel Co-efficient (H3)%
Urbanization rate (H4)%+
Population density (H5)pop/km2
EnvironmentSewage treatment rate (z1)%+
Greenhouse gas emission per 104 CNY GDP created (Z2)kg/104 CNY
Table 2. Water rights allocation scheme of the coordinated development of water–ecology–energy–food in Yinchuan.
IndustryWater Rights of Life WLWater Rights of Ecology WEWater Rights of Energy Industry WNWater Rights of Food Planting WFWater Rights of Other Agriculture WOWater Rights of General Industry WITotal
Water rights
(×108 m3)
0.991.771.804.065.200.8814.70
Publisher’s Note: MDPI stays neutral with regard to jurisdictional claims in published maps and institutional affiliations.

