
Projection of Future Water Resources Carrying Capacity in the Huang-Huai-Hai River Basin under the Impacts of Climate Change and Human Activities

 ,
, 

Abstract
:1. Introduction
2. Data and Methods
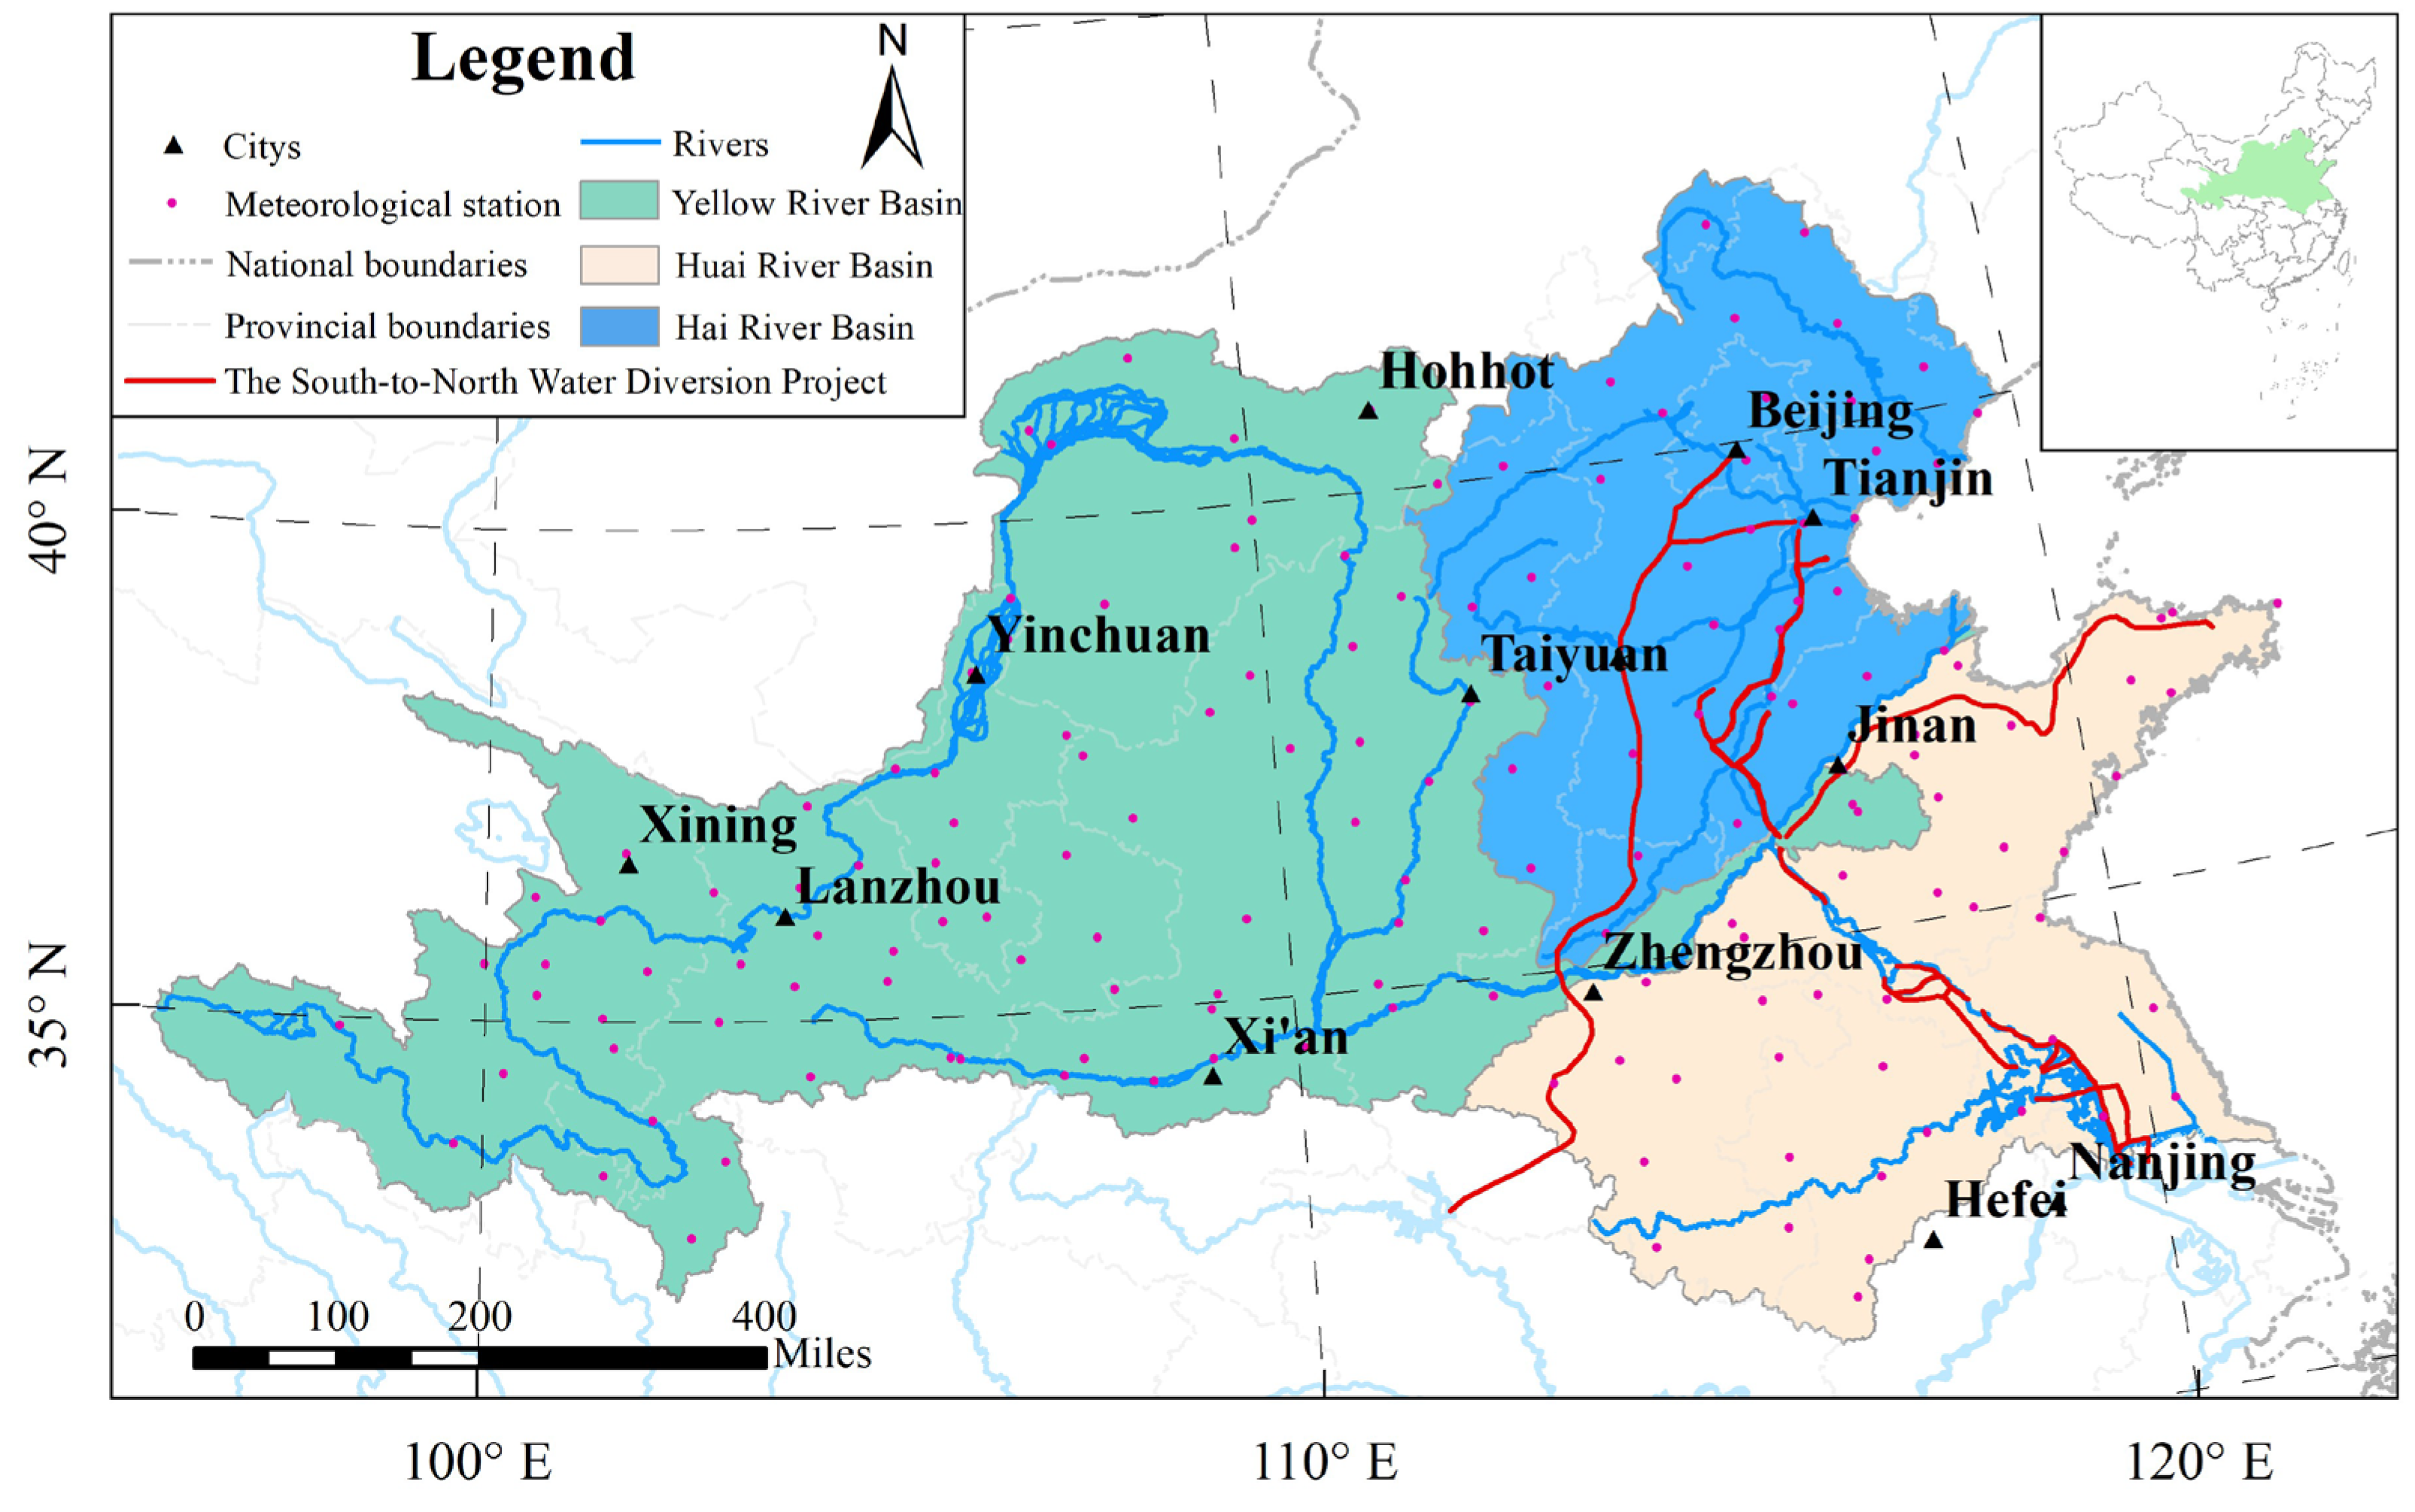
2.1. Study Area
2.2. Data Source
2.3. Methods
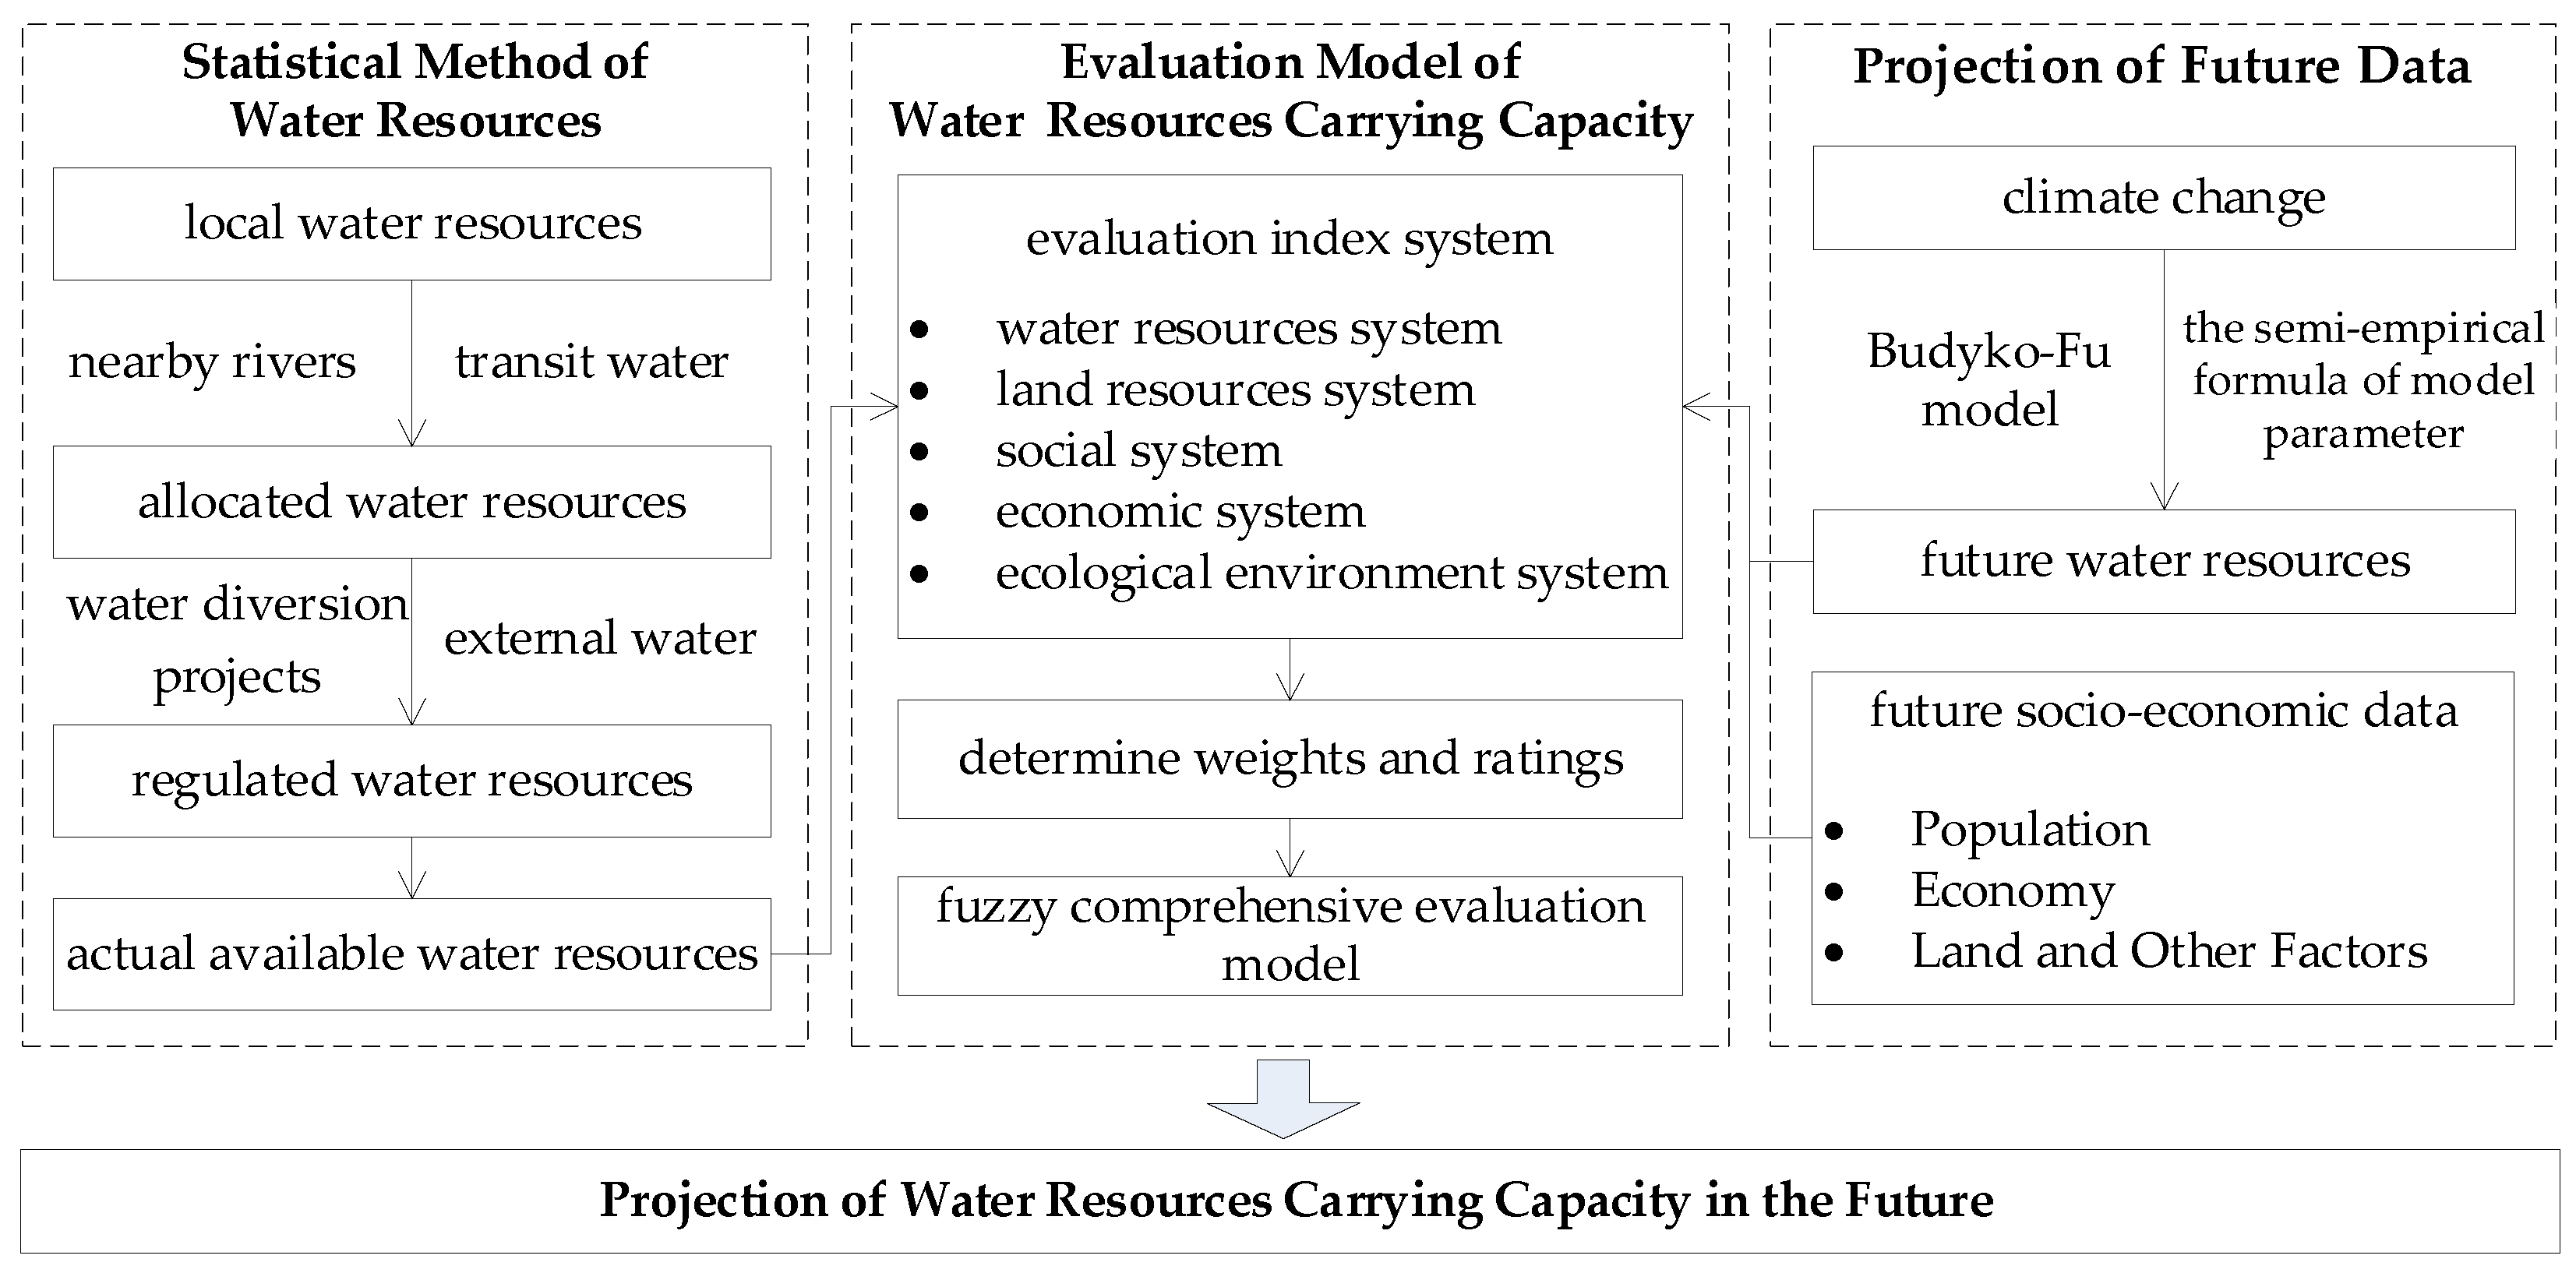
2.3.1. Overview
2.3.2. Evaluation Model of Water Resources Carrying Capacity
2.3.3. Response of Water Resources to Climate Change
3. Results
3.1. Construction of Evaluation Model and Present Situation Evaluation of Water Resources Carrying Capacity in Huang-Huai-Hai River Basin
3.2. Future Water Resources
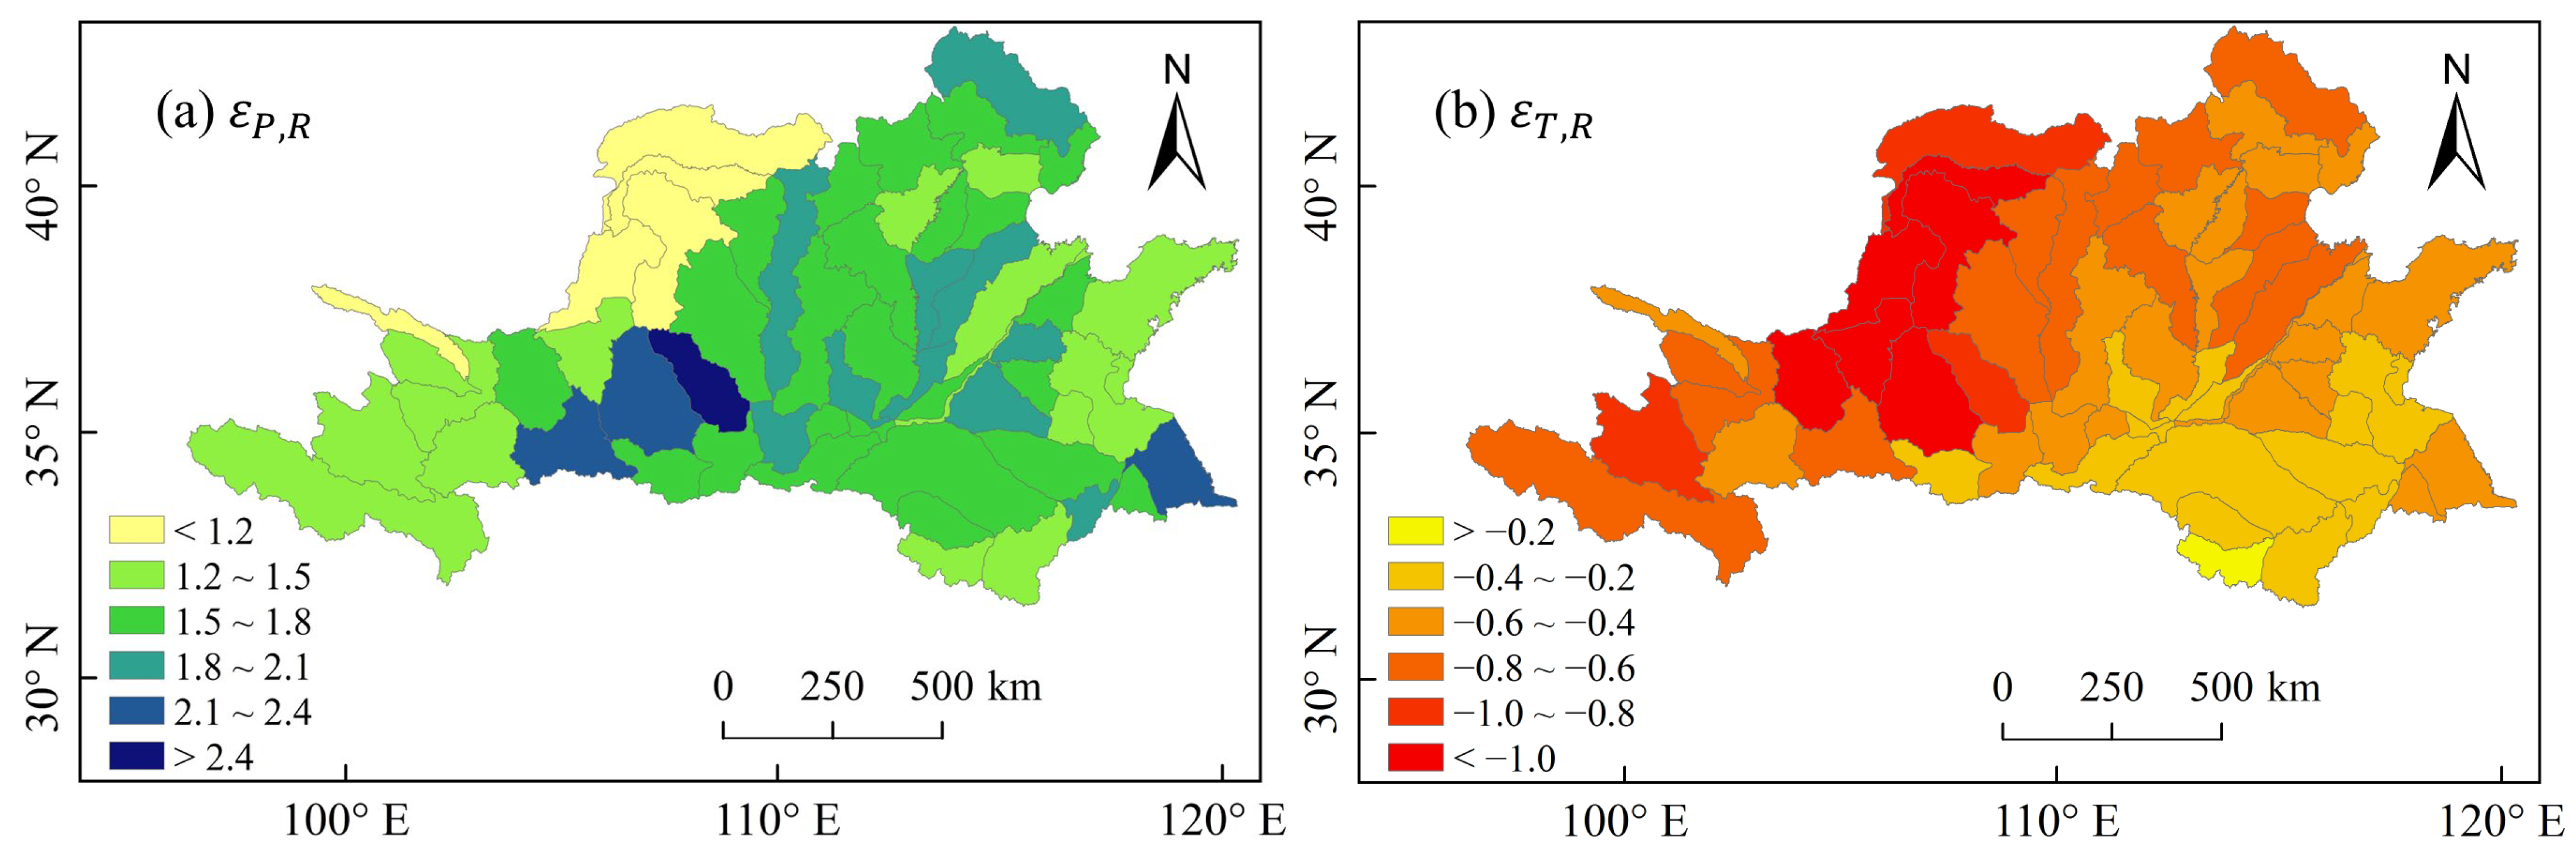
3.2.1. Response of Water Resources to Climate Change
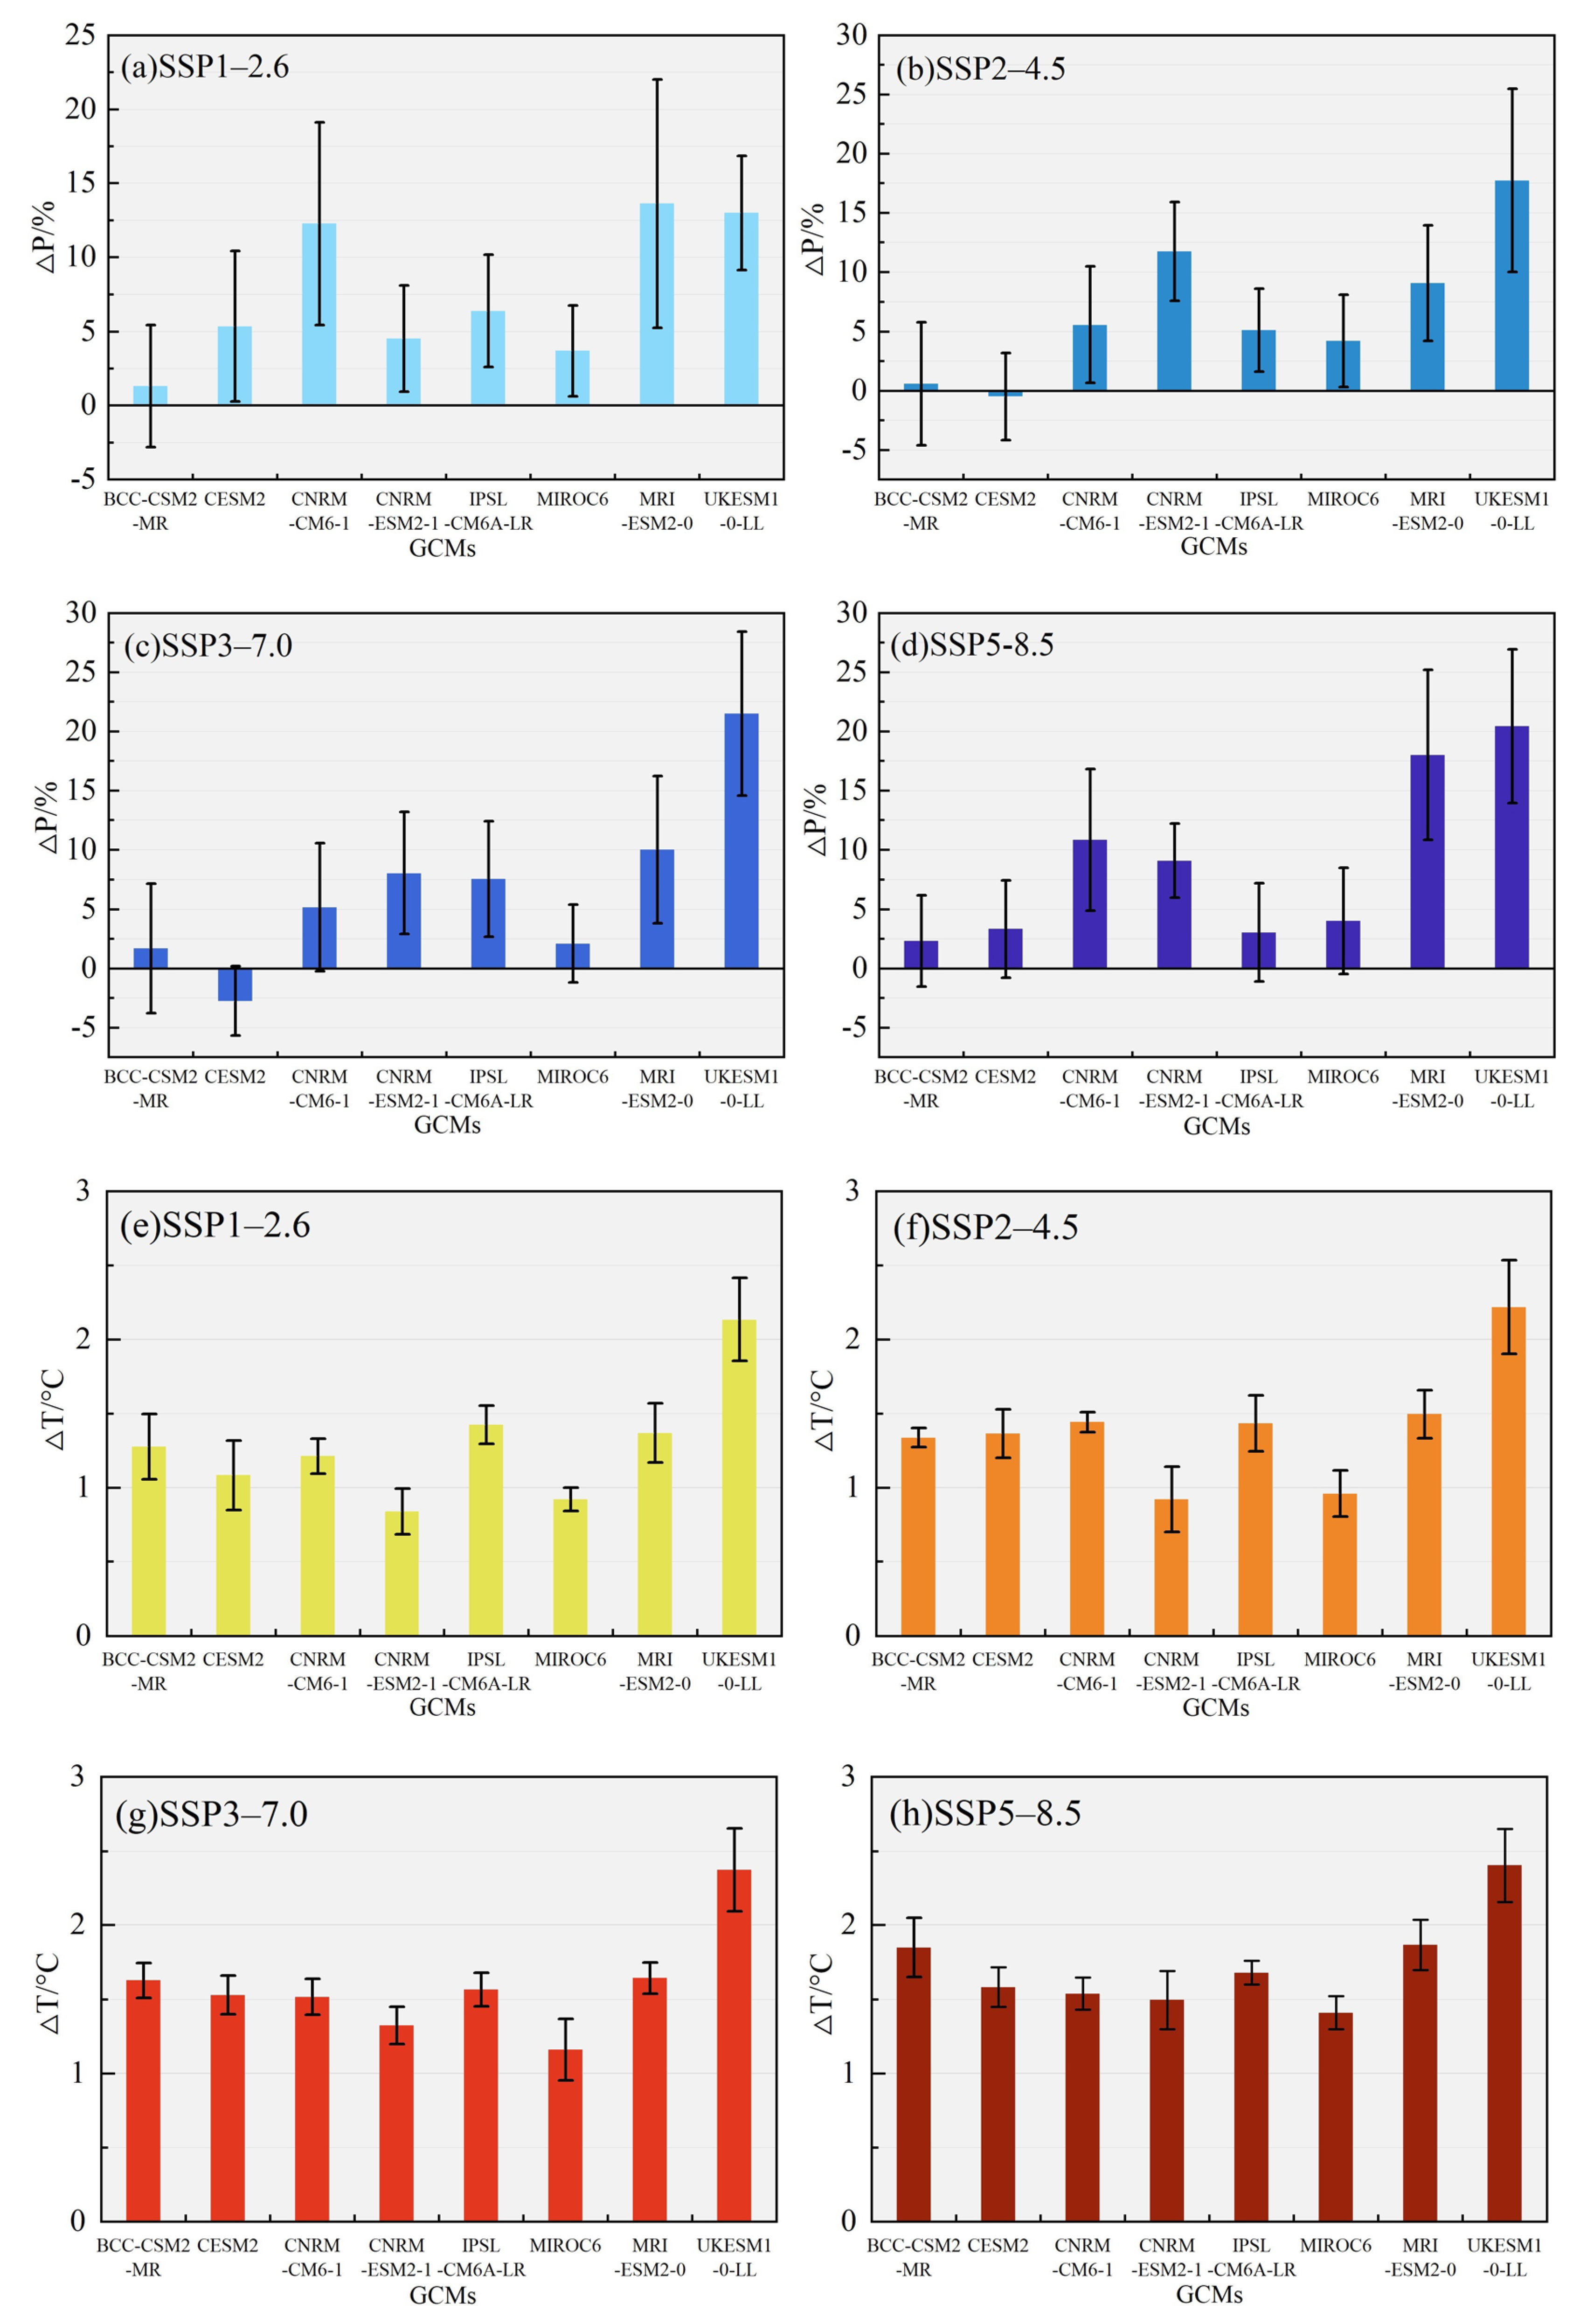
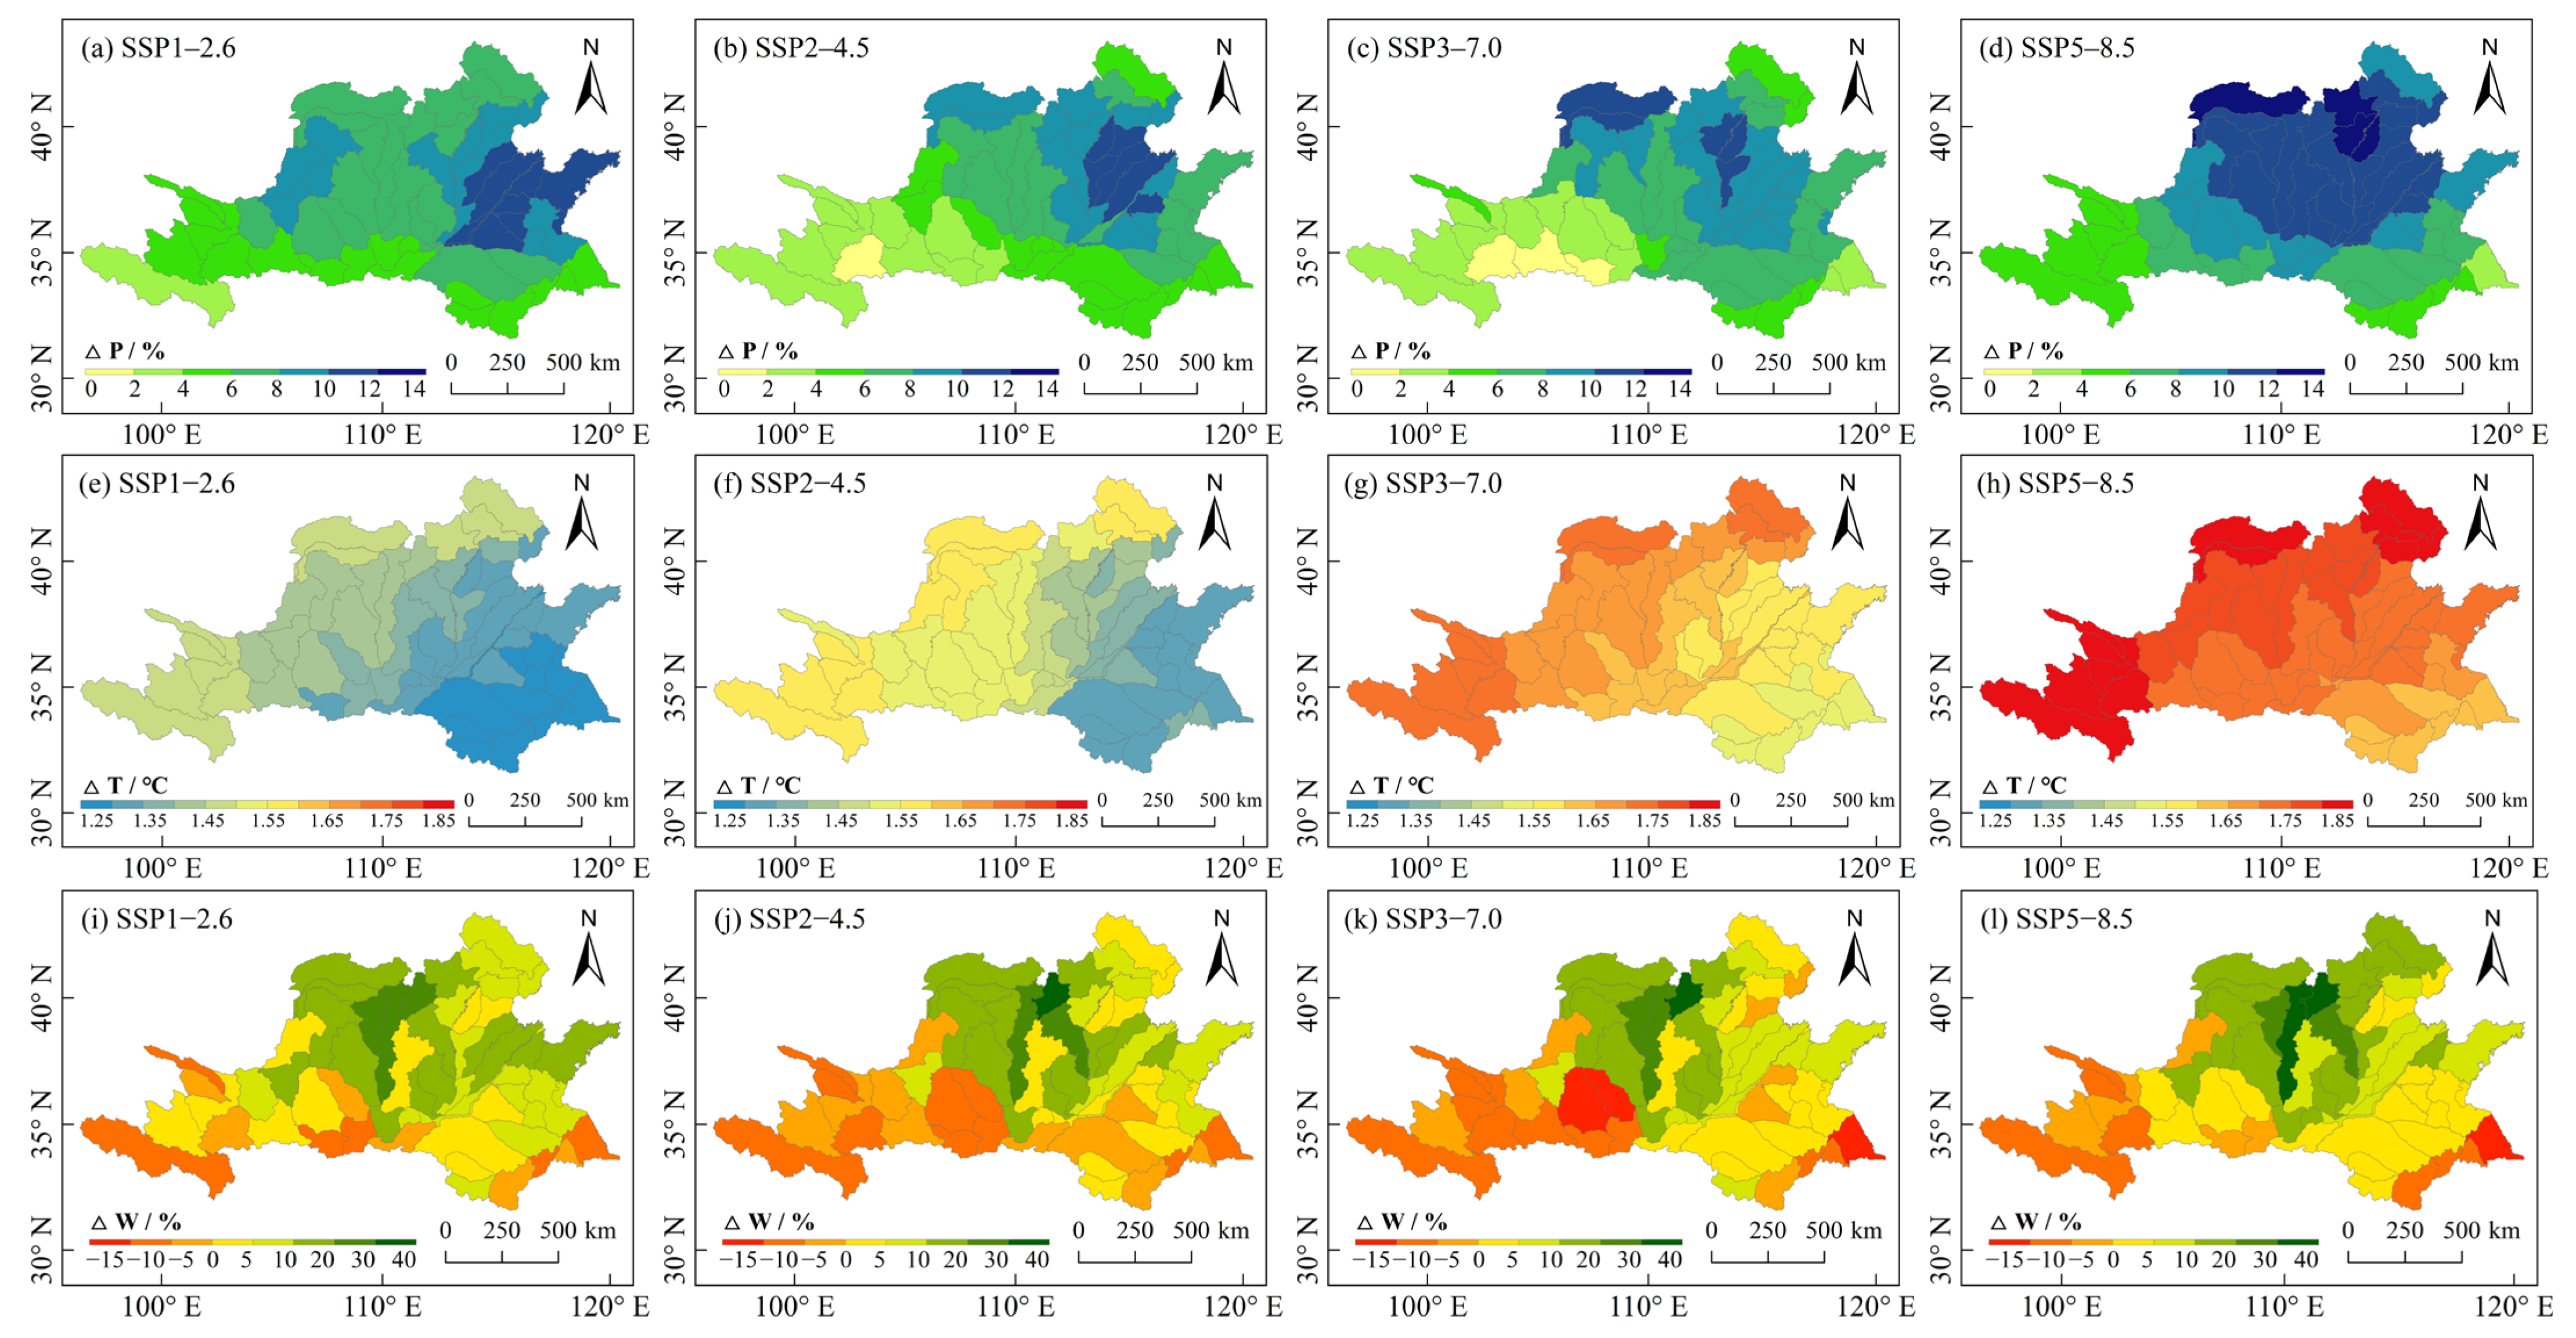
3.2.2. Future Climate Scenarios
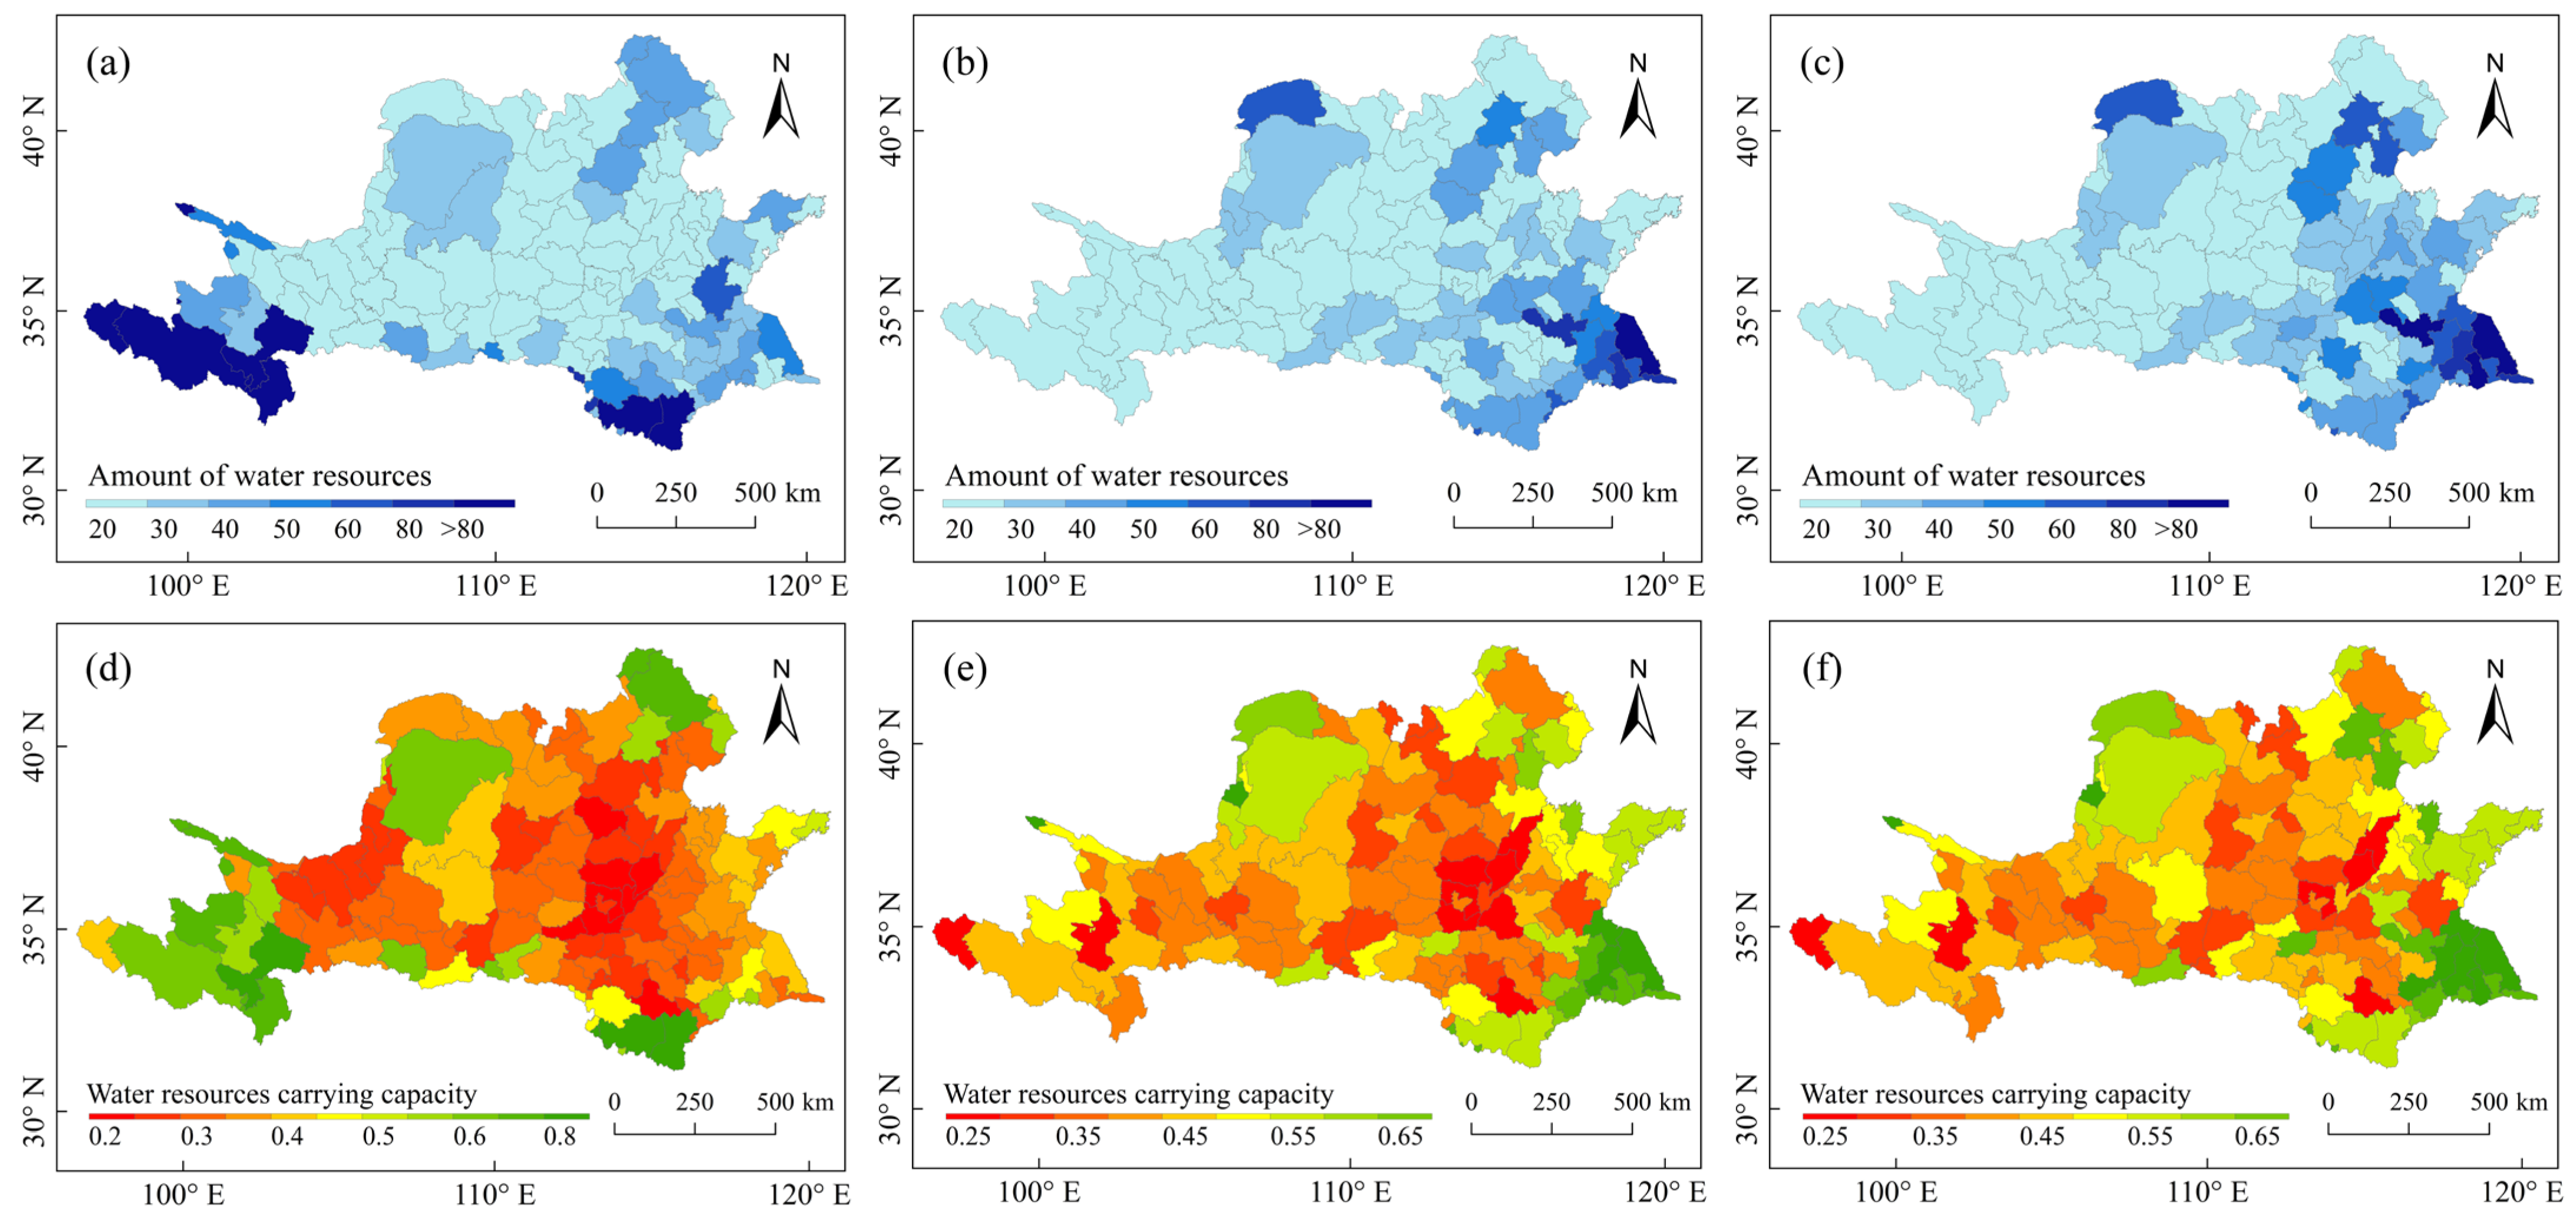
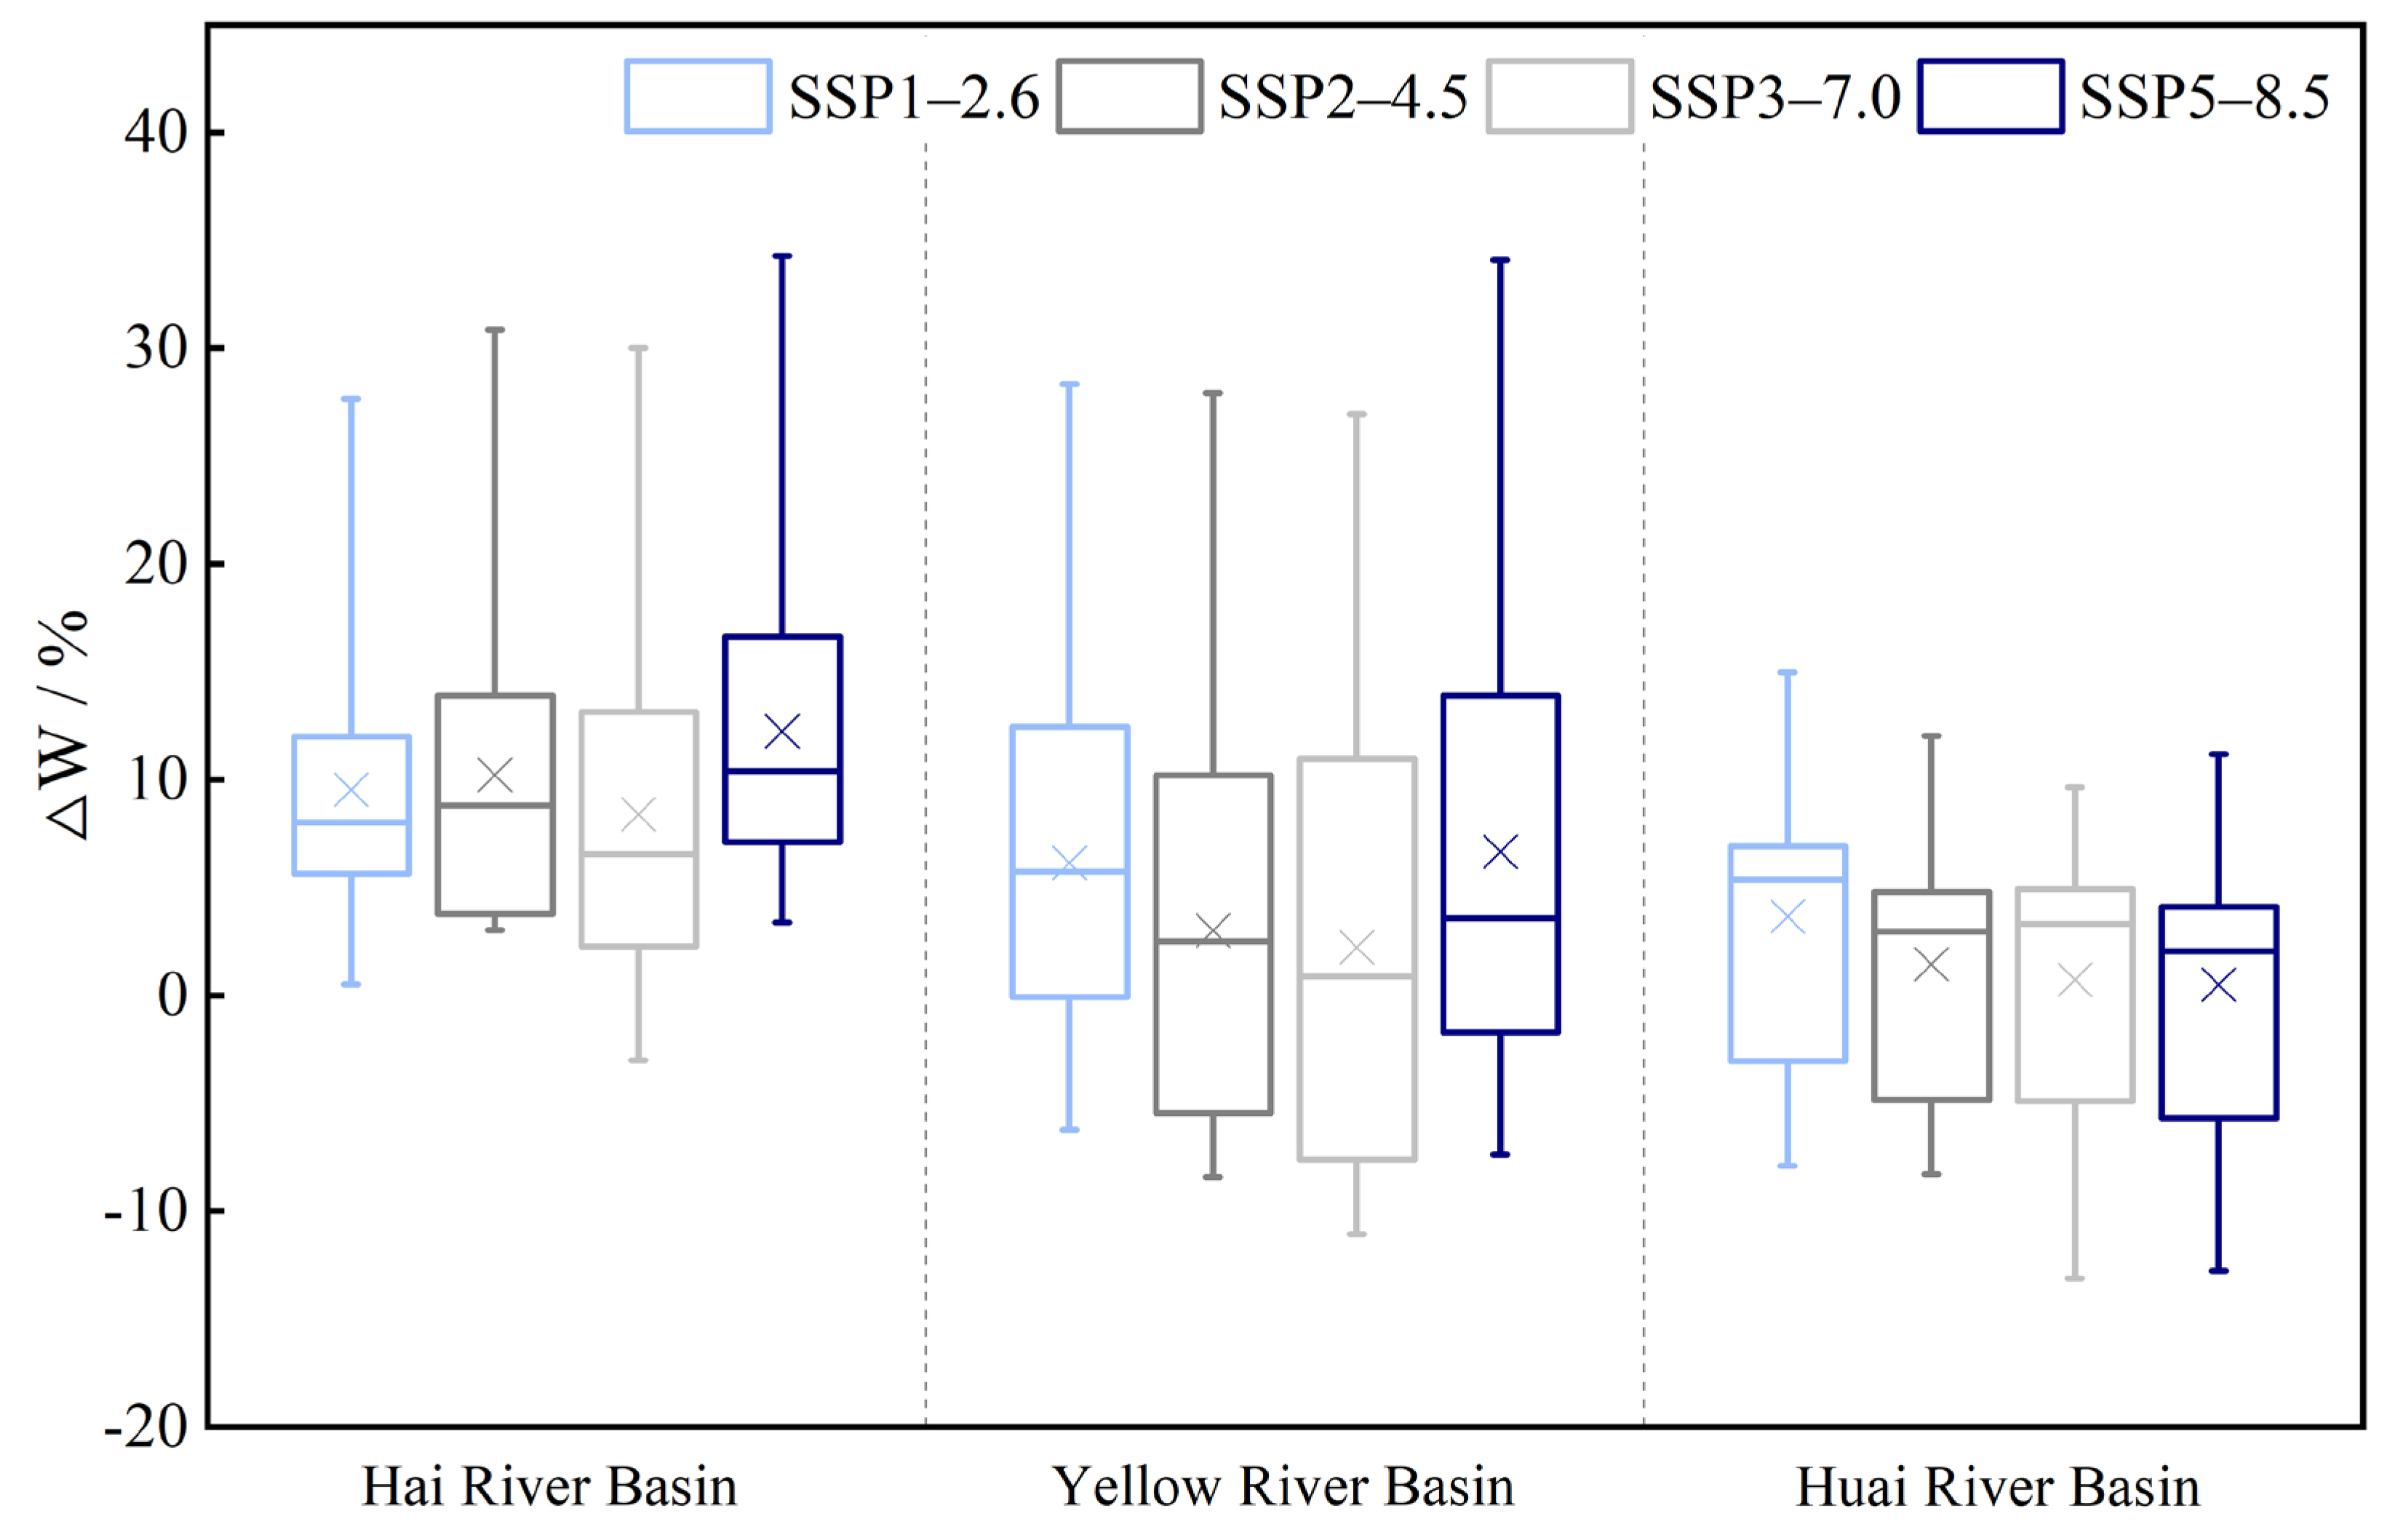
3.2.3. Future Water Resources
3.3. Projection of Water Resources Carrying Capacity under the Background of Future Global Change
3.3.1. Projection of Population, Economy, Land, and Other Factors in the Future
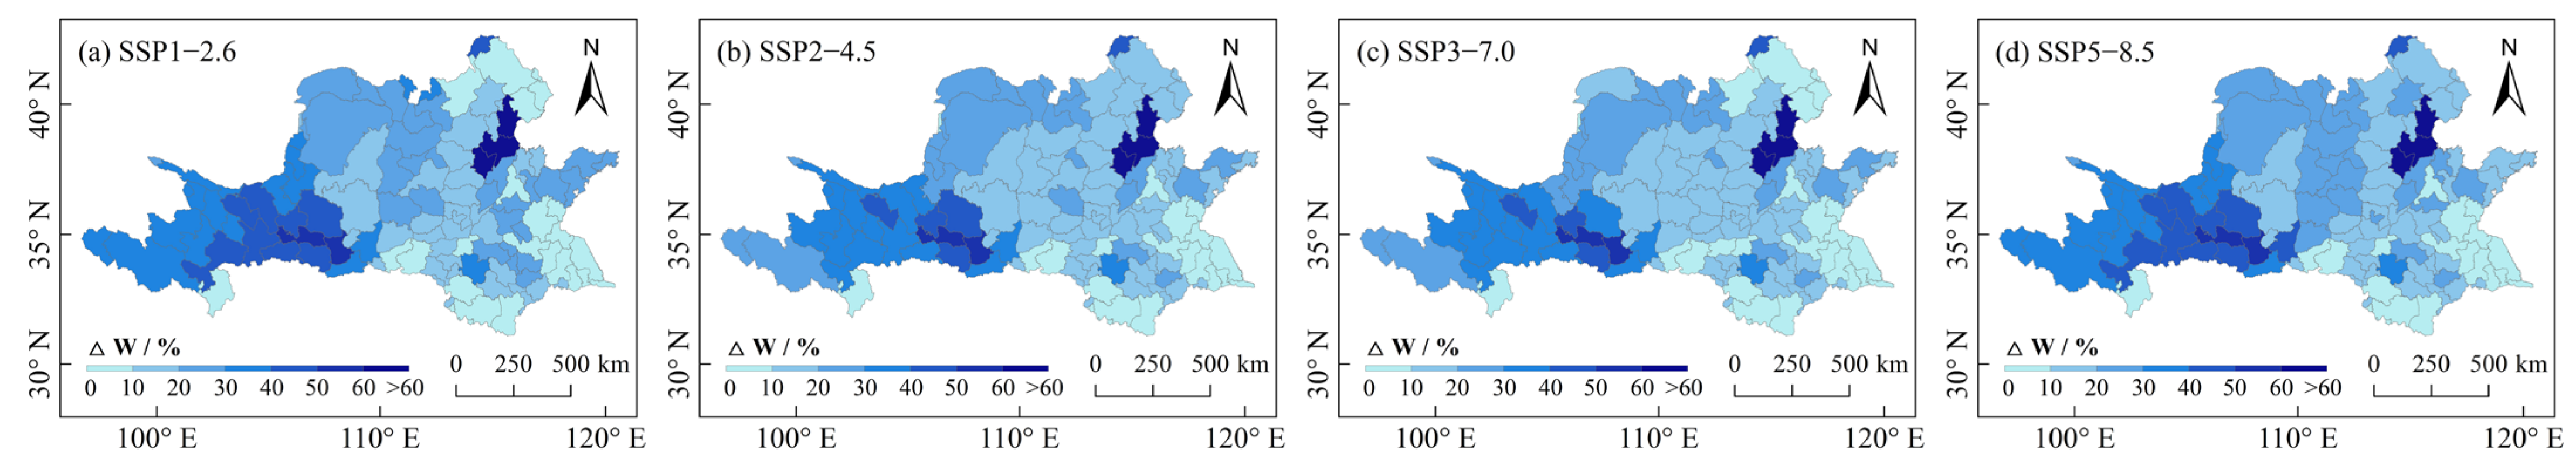
3.3.2. Projection of Regulated Water Resources in the Future
3.3.3. Projection of Water Resources Carrying Capacity in the Future
4. Discussion
4.1. Actual Available Water Resources in the Region
4.2. Contribution of Projected Results
4.3. Application and Limitation of Evaluation Method
5. Conclusions
Author Contributions
Funding
Institutional Review Board Statement
Informed Consent Statement
Data Availability Statement
Conflicts of Interest
References
- Hyandye, C.B.; Worqul, A.; Martz, L.W.; Muzuka, A.N.N. The impact of future climate and land use/cover change on water resources in the Ndembera watershed and their mitigation and adaptation strategies. J. Syst. Res. 2018, 7, 7. [Google Scholar] [CrossRef] [Green Version]
- Kumar, N.; Tischbein, B.; Kusche, J.; Beg, M.K.; Bogardi, J.J. Impact of land-use change on the water resources of the Upper Kharun Catchment, Chhattisgarh, India. Reg. Environ. Chang. 2017, 17, 2373–2385. [Google Scholar] [CrossRef]
- Ait-Aoudia, M.N.; Berezowska-Azzag, E. Water resources carrying capacity assessment: The case of Algeria’s capital city. Habitat Int. 2016, 58, 51–58. [Google Scholar] [CrossRef]
- Daily, G.C.; Ehrlich, P.R. Socioeconomic equity, sustainability, and Earth’s carrying capacity. Ecol. Appl. 1996, 6, 991–1001. [Google Scholar] [CrossRef]
- Wang, G.Q.; Zhang, J.Y.; He, R.M.; Liu, C.S.; Ma, T.; Bao, Z.X.; Liu, Y.L. Runoff sensitivity to climate change for hydro-climatically different catchments in China. Stoch. Environ. Res. Risk Assess. 2017, 31, 1011–1021. [Google Scholar] [CrossRef]
- Mohor, G.S.; Mendiondo, E.M. Economic indicators of hydrologic drought insurance under water demand and climate change scenarios in a Brazilian context. Ecol. Econ. 2017, 140, 66–78. [Google Scholar] [CrossRef]
- Pang, G.J.; Wang, X.J.; Yang, M.X. Using the NDVI to identify variations in, and responses of, vegetation to climate change on the Tibetan Plateau from 1982 to 2012. Quat. Int. 2017, 444, 87–96. [Google Scholar] [CrossRef]
- Lamchin, M.; Lee, W.-K.; Jeon, S.W.; Wang, S.W.; Lim, C.H.; Song, C.; Sung, M. Long-term trend of and correlation between vegetation greenness and climate variables in Asia based on satellite data. MethodsX 2018, 5, 803–807. [Google Scholar] [CrossRef]
- Fu, B.J.; Wang, S.; Liu, Y.; Liu, J.B.; Liang, W.; Miao, C.Y. Hydrogeomorphic Ecosystem Responses to Natural and Anthropogenic Changes in the Loess Plateau of China. Annu. Rev. Earth Planet. Sci. 2017, 45, 223–243. [Google Scholar] [CrossRef]
- Li, P.Y.; Qian, H.; Wu, J.H. Conjunctive use of groundwater and surface water to reduce soil salinization in the Yinchuan Plain, North-West China. Int. J. Water Resour. Dev. 2018, 34, 337–353. [Google Scholar] [CrossRef]
- Chou, L.C.; Dai, J.; Qian, X.Y.; Karimipour, A.; Zheng, X.P. Achieving sustainable soil and water protection: The perspective of agricultural water price regulation on environmental protection. Agric. Water Manag. 2021, 245, 106583. [Google Scholar] [CrossRef]
- Wang, G.Q.; Zhang, J.Y.; Guan, X.X.; Bao, Z.X.; Liu, Y.L.; He, R.M.; Jin, J.L.; Liu, C.S.; Chen, X. Quantifying attribution of runoff change for major rivers in China. Adv. Water Sci. 2020, 31, 313–323. [Google Scholar]
- Zhang, J.Y.; Wang, G.Q.; Jin, J.L.; He, R.M.; Liu, C.S. Evolution and variation characteristics of the recorded runoff for the major rivers in China during 1956—2018. Adv. Water Sci. 2020, 31, 153–161. [Google Scholar]
- Sun, J.; Li, Y.P.; Suo, C.; Liu, Y.R. Impacts of irrigation efficiency on agricultural water-land nexus system management under multiple uncertainties—A case study in Amu Darya River basin, Central Asia. Agric. Water Manag. 2019, 216, 76–88. [Google Scholar] [CrossRef]
- Hassanzadeh, E. Trade-Offs between Human and Environment: Challenges for Regional Water Management under Changing Conditions. Water 2019, 11, 1773. [Google Scholar] [CrossRef] [Green Version]
- Li, Y.Y.; Chang, J.X.; Luo, L.F.; Wang, Y.M.; Guo, A.J.; Ma, F.; Fan, J.J. Spatiotemporal impacts of land use land cover changes on hydrology from the mechanism perspective using SWAT model with time-varying parameters. Hydrol. Res. 2019, 50, 244–261. [Google Scholar] [CrossRef]
- Bryan, B.A.; Gao, L.; Ye, Y.Q.; Sun, X.F.; Connor, J.D.; Crossman, N.D.; Stafford-Smith, M.; Wu, J.G.; He, C.Y.; Yu, D.Y.; et al. China’s response to a national land-system sustainability emergency. Nature 2018, 559, 193–204. [Google Scholar] [CrossRef]
- Zhuang, W. Eco-environmental impact of inter-basin water transfer projects: A review. Environ. Sci. Pollut. Res. 2016, 23, 12867–12879. [Google Scholar] [CrossRef]
- Lang, Y.Q.; Song, W.; Zhang, Y. Responses of the water-yield ecosystem service to climate and land use change in Sancha River Basin, China. Phys. Chem. Earth 2017, 101, 102–111. [Google Scholar] [CrossRef]
- Kanakoudis, V.; Tsitsifli, S.; Papadopoulou, A.; Curk, B.C.; Karleusa, B. Water resources vulnerability assessment in the Adriatic Sea region: The case of Corfu Island. Environ. Sci. Pollut. Res. 2017, 24, 20173–20186. [Google Scholar] [CrossRef]
- Schilling, J.; Hertig, E.; Tramblay, Y.; Scheffran, J. Climate change vulnerability, water resources and social implications in North Africa. Reg. Environ. Chang. 2020, 20, 15. [Google Scholar] [CrossRef] [Green Version]
- Li, Z.; Zhou, H.; Zhang, L.; Mao, D. Water Resources Evolution in Dongting Lake Basin Based on Different Emission Scenarios. J. China Hydrol. 2018, 38, 29–36. [Google Scholar]
- Sun, Y.H.; Liu, N.N.; Shang, J.X.; Zhang, J.Y. Sustainable utilization of water resources in China: A system dynamics model. J. Clean. Prod. 2017, 142, 613–625. [Google Scholar] [CrossRef]
- Yang, J.F.; Lei, K.; Khu, S.; Meng, W. Assessment of Water Resources Carrying Capacity for Sustainable Development Based on a System Dynamics Model: A Case Study of Tieling City, China. Water Resour. Manag. 2015, 29, 885–899. [Google Scholar] [CrossRef]
- Wang, H.; Huang, J.J.; Zhou, H.; Deng, C.B.; Fang, C.L. Analysis of sustainable utilization of water resources based on the improved water resources ecological footprint model: A case study of Hubei Province, China. J. Environ. Manag. 2020, 262, 110331. [Google Scholar] [CrossRef]
- Wang, Y.M.; Zhou, X.D.; Engel, B. Water environment carrying capacity in Bosten Lake basin. J. Clean. Prod. 2018, 199, 574–583. [Google Scholar] [CrossRef]
- Zhang, J.; Zhang, C.L.; Shi, W.L.; Fu, Y.C. Quantitative evaluation and optimized utilization of water resources-water environment carrying capacity based on nature-based solutions. J. Hydrol. 2019, 568, 96–107. [Google Scholar] [CrossRef]
- Song, F.; Yang, X.H.; Wu, F.F. Catastrophe progression method based on M-K test and correlation analysis for assessing water resources carrying capacity in Hubei province. J. Water Clim. Change 2020, 11, 556–567. [Google Scholar] [CrossRef] [Green Version]
- Ren, C.F.; Guo, P.; Li, M.; Li, R.H. An innovative method for water resources carrying capacity research—Metabolic theory of regional water resources. J. Environ. Manag. 2016, 167, 139–146. [Google Scholar] [CrossRef]
- Yang, Z.Y.; Song, J.X.; Cheng, D.D.; Xia, J.; Li, Q.; Ahamad, M.I. Comprehensive evaluation and scenario simulation for the water resources carrying capacity in Xi’an city, China. J. Environ. Manag. 2019, 230, 221–233. [Google Scholar] [CrossRef]
- Shi, K.; Diao, C.; Sun, X. Evaluation of soil-water resources carrying capacity based on entropy weight extension decision model in the Three Gorges Reservoir Region of Chongqing. Acta Sci. Circumstantiae 2013, 33, 609–616. [Google Scholar]
- He, L.; Du, Y.; Wu, S.; Zhang, Z.L. Evaluation of the agricultural water resource carrying capacity and optimization of a planting-raising structure. Agric. Water Manag. 2021, 243, 106456. [Google Scholar] [CrossRef]
- Wang, D.L.; Shi, Y.H.; Wan, K.D. Integrated evaluation of the carrying capacities of mineral resource-based cities considering synergy between subsystems. Ecol. Indic. 2020, 108, 105701. [Google Scholar] [CrossRef]
- Zhang, Q.F. The South-to-North Water Transfer Project of China: Environmental Implications and Monitoring Strategy. J. Am. Water Resour. Assoc. 2009, 45, 1238–1247. [Google Scholar] [CrossRef]
- Liu, Q.; Yan, C.R.; Ju, H.; Garre, S. Impact of climate change on potential evapotranspiration under a historical and future climate scenario in the Huang-Huai-Hai Plain, China. Theor. Appl. Climatol. 2018, 132, 387–401. [Google Scholar] [CrossRef]
- Yan, D.H.; Xu, T.; Girma, A.; Yuan, Z.; Weng, B.S.; Qin, T.L.; Do, P.; Yuan, Y. Regional Correlation between Precipitation and Vegetation in the Huang-Huai-Hai River Basin, China. Water 2017, 9, 557. [Google Scholar] [CrossRef] [Green Version]
- Guan, X.X.; Zhang, J.Y.; Yang, Q.L.; Wang, G.Q. Changing characteristics and attribution analysis of potential evapotranspiration in the Huang-Huai-Hai River Basin, China. Meteorol. Atmos. Phys. 2021, 133, 97–108. [Google Scholar] [CrossRef]
- Miralles, D.G.; Holmes, T.; De, J.; Gash, J.H.; Meesters, A.; Dolman, A.J.J.H.; Discussions, E.S.S. Global land-surface evaporation estimated from satellite-based observations. Hydrol. Earth Syst. Sci. 2010, 7, 453–469. [Google Scholar] [CrossRef] [Green Version]
- Martens, B.; Miralles, D.G.; Lievens, H.; van der Schalie, R.; de Jeu, R.A.M.; Fernandez-Prieto, D.; Beck, H.E.; Dorigo, W.A.; Verhoest, N.E.C. GLEAM v3: Satellite-based land evaporation and root-zone soil moisture. Geosci. Model Dev. 2017, 10, 1903–1925. [Google Scholar] [CrossRef] [Green Version]
- Jiang, D.B.; Hu, D.; Tian, Z.P.; Lang, X.M. Differences between CMIP6 and CMIP5 Models in Simulating Climate over China and the East Asian Monsoon. Adv. Atmos. Sci. 2020, 37, 1102–1118. [Google Scholar] [CrossRef]
- Yang, X.L.; Zhou, B.T.; Xu, Y.; Han, Z.Y. CMIP6 Evaluation and Projection of Temperature and Precipitation over China. Adv. Atmos. Sci. 2021, 38, 817–830. [Google Scholar] [CrossRef]
- Lopez-Moreno, J.I.; Vicente-Serrano, S.M.; Moran-Tejeda, E.; Zabalza, J.; Lorenzo-Lacruz, J.; Garcia-Ruiz, J.M. Impact of climate evolution and land use changes on water yield in the ebro basin. Hydrol. Earth Syst. Sci. 2011, 15, 311–322. [Google Scholar] [CrossRef] [Green Version]
- Liu, H.; Geng, L.H.; Chen, X.Y. Indicators for evaluating sustainable utilization of regional water resources. Adv. Water Sci. 2003, 14, 265–270. [Google Scholar]
- Liu, T.; Yang, X.H.; Geng, L.H.; Sun, B.Y. A Three-Stage Hybrid Model for Space-Time Analysis of Water Resources Carrying Capacity: A Case Study of Jilin Province, China. Water 2020, 12, 426. [Google Scholar] [CrossRef] [Green Version]
- Xi, D.; Xu, X.; Han, D.; Yang, Z. Evaluating water resources-carrying capacity in Beijing-Tianjin-Hebei region. J. Beijing Norm. Univ. Nat. Sci. 2017, 53, 575–581. [Google Scholar]
- Tan, K.; Yan, Z.; Zhao, Z.; Pu, J.; Li, S.; Miao, P.; Zhao, X. Evaluation of Resource and Environmental Carrying Capacity of Wenshan City in Karst Area Based on Fuzzy Model. Res. Soil Water Conserv. 2021, 28, 218–227. [Google Scholar]
- Bao, Z.X.; Zhang, J.Y.; Wang, G.Q.; Chen, Q.W.; Guan, T.S.; Yan, X.L.; Liu, C.S.; Liu, J.; Wang, J. The impact of climate variability and land use/cover change on the water balance in the Middle Yellow River Basin, China. J. Hydrol. 2019, 577, 123942. [Google Scholar] [CrossRef]
- Zhang, J.Y.; Zhang, C.F.; Bao, Z.X.; Li, M.; Wang, G.Q.; Guan, X.X.; Liu, C.S. Analysis of the effects of vegetation changes on runoff in the Huang-Huai-Hai River basin under global change. Adv. Water Sci. 2021, 32, 813–823. [Google Scholar]
- LI, Y.; Zhang, X.Y. Analysis of China’s “14th Five-Year Plan” Period and Mid- and Long-Term Population Development Trend. Popul. Health 2020, 8, 41–47. [Google Scholar]
- Zhao, Y.; Li, H.; Liu, H.; Wang, L.; He, G.; Wang, H. The law of growth: Prediction of peak water consumption in China. J. Hydraul. Eng. 2021, 52, 129–141. [Google Scholar]
- Zhou, Z.; Huang, Y.; Huang, J. Regional Differences and Influencing Factors of Soil-Water Resources Carrying Capacity. Bull. Soil Water Conserv. 2015, 35, 344–349. [Google Scholar]
- Chen, X.; Dai, Q. A study on water-soil capacity in north west arid area with systemic dynamics—A Case of HEXI Corridor, Gansu Province. Arid Land Geogr. 2002, 25, 377–382. [Google Scholar]
- He, Y.H.; Chen, X.H.; Sheng, Z.P.; Lin, K.R.; Gui, F.L. Water allocation under the constraint of total water-use quota: A case from Dongjiang River Basin, South China. Hydrol. Sci. J.-J. Sci. Hydrol. 2018, 63, 154–167. [Google Scholar] [CrossRef]
- Han, Y.; Zhang, S.; Lv, A. Research of effect on water resources carrying capacity in Beijing-Tianjin-Hebei region by water transfer. Resour. Sci. 2018, 40, 2236–2246. [Google Scholar]
- Liu, M.X.; Xu, X.L.; Xu, C.H.; Sun, A.Y.; Wang, K.L.; Scanlon, B.R.; Zhang, L. A new drought index that considers the joint effects of climate and land surface change. Water Resour. Res. 2017, 53, 3262–3278. [Google Scholar] [CrossRef]
- Zhang, D.; Liu, X.M.; Bai, P. Different Influences of Vegetation Greening on Regional Water-Energy Balance under Different Climatic Conditions. Forests 2018, 9, 412. [Google Scholar] [CrossRef] [Green Version]
- Jia, Z.M.; Cai, Y.P.; Chen, Y.; Zeng, W.H. Regionalization of water environmental carrying capacity for supporting the sustainable water resources management and development in China. Resour. Conserv. Recycl. 2018, 134, 282–293. [Google Scholar] [CrossRef]


| Target Layer (A) | Criterion Layer (B) | System Layer (C) | Weight | Index Layer (D) | Weight | V1 | V2 | V3 |
|---|---|---|---|---|---|---|---|---|
| Water resources carrying capacity | Water supply | Water resources System | 0.324 | Precipitation/(mm) | 0.272 | >800 | 400–800 | <400 |
| Water supply modulus/ (104 m3/km2) | 0.224 | <10 | 10–20 | >20 | ||||
| Per capita water resources/ (m3/people) | 0.366 | >1000 | 500–1000 | <500 | ||||
| Per capita water consumption/(m3/people) | 0.139 | <200 | 200–500 | >500 | ||||
| Water demand | Land resources system | 0.311 | Per capita cultivated land area/(mu/person) | 0.336 | >2 | 1–2 | <1 | |
| Irrigation rate of cultivated land/(%) | 0.134 | >70 | 50–70 | <50 | ||||
| Multiple cropping index/(%) | 0.116 | <100 | 100–150 | >150 | ||||
| Matching coefficient of water and land resources/ (ten thousand m3/hm) | 0.414 | >1 | 0.5–1 | <0.5 | ||||
| Social system | 0.106 | Natural population growth rate/ (‰) | 0.433 | <2 | 2–4 | >4 | ||
| Urbanization rate/(%) | 0.281 | >70 | 50–70 | <50 | ||||
| Resident population density/ (person/km2) | 0.287 | <200 | 200–400 | >400 | ||||
| Economic system | 0.11 | Per capita GDP/ (yuan/person) | 0.511 | >70,000 | 40,000–70,000 | <40,000 | ||
| Water consumption of per CNY 10,000 GDP /(m3/CNY 10,000) | 0.262 | <30 | 30–80 | >80 | ||||
| Primary industry proportion/(%) | 0.226 | <5 | 5–15 | >15 | ||||
| Ecological environment system | 0.149 | Rehydration rate of ecological environment/(%) | 0.221 | >10 | 3–10 | <3 | ||
| Vegetation coverage rate/ (%) | 0.458 | >40 | 20–40 | <20 | ||||
| Wet land rate/(%) | 0.32 | >10 | 5–10 | <5 |
Publisher’s Note: MDPI stays neutral with regard to jurisdictional claims in published maps and institutional affiliations. |
© 2022 by the authors. Licensee MDPI, Basel, Switzerland. This article is an open access article distributed under the terms and conditions of the Creative Commons Attribution (CC BY) license (https://creativecommons.org/licenses/by/4.0/).
Share and Cite
Xie, M.; Zhang, C.; Zhang, J.; Wang, G.; Jin, J.; Liu, C.; He, R.; Bao, Z. Projection of Future Water Resources Carrying Capacity in the Huang-Huai-Hai River Basin under the Impacts of Climate Change and Human Activities. Water 2022, 14, 2006. https://doi.org/10.3390/w14132006
Xie M, Zhang C, Zhang J, Wang G, Jin J, Liu C, He R, Bao Z. Projection of Future Water Resources Carrying Capacity in the Huang-Huai-Hai River Basin under the Impacts of Climate Change and Human Activities. Water. 2022; 14(13):2006. https://doi.org/10.3390/w14132006
Chicago/Turabian StyleXie, Mingming, Chengfeng Zhang, Jianyun Zhang, Guoqing Wang, Junliang Jin, Cuishan Liu, Ruimin He, and Zhenxin Bao. 2022. "Projection of Future Water Resources Carrying Capacity in the Huang-Huai-Hai River Basin under the Impacts of Climate Change and Human Activities" Water 14, no. 13: 2006. https://doi.org/10.3390/w14132006
APA StyleXie, M., Zhang, C., Zhang, J., Wang, G., Jin, J., Liu, C., He, R., & Bao, Z. (2022). Projection of Future Water Resources Carrying Capacity in the Huang-Huai-Hai River Basin under the Impacts of Climate Change and Human Activities. Water, 14(13), 2006. https://doi.org/10.3390/w14132006