Performance Evaluation of Artificial Recharge–Water Intake System Using 3D Numerical Modeling
Abstract
1. Introduction
2. Materials and Methods
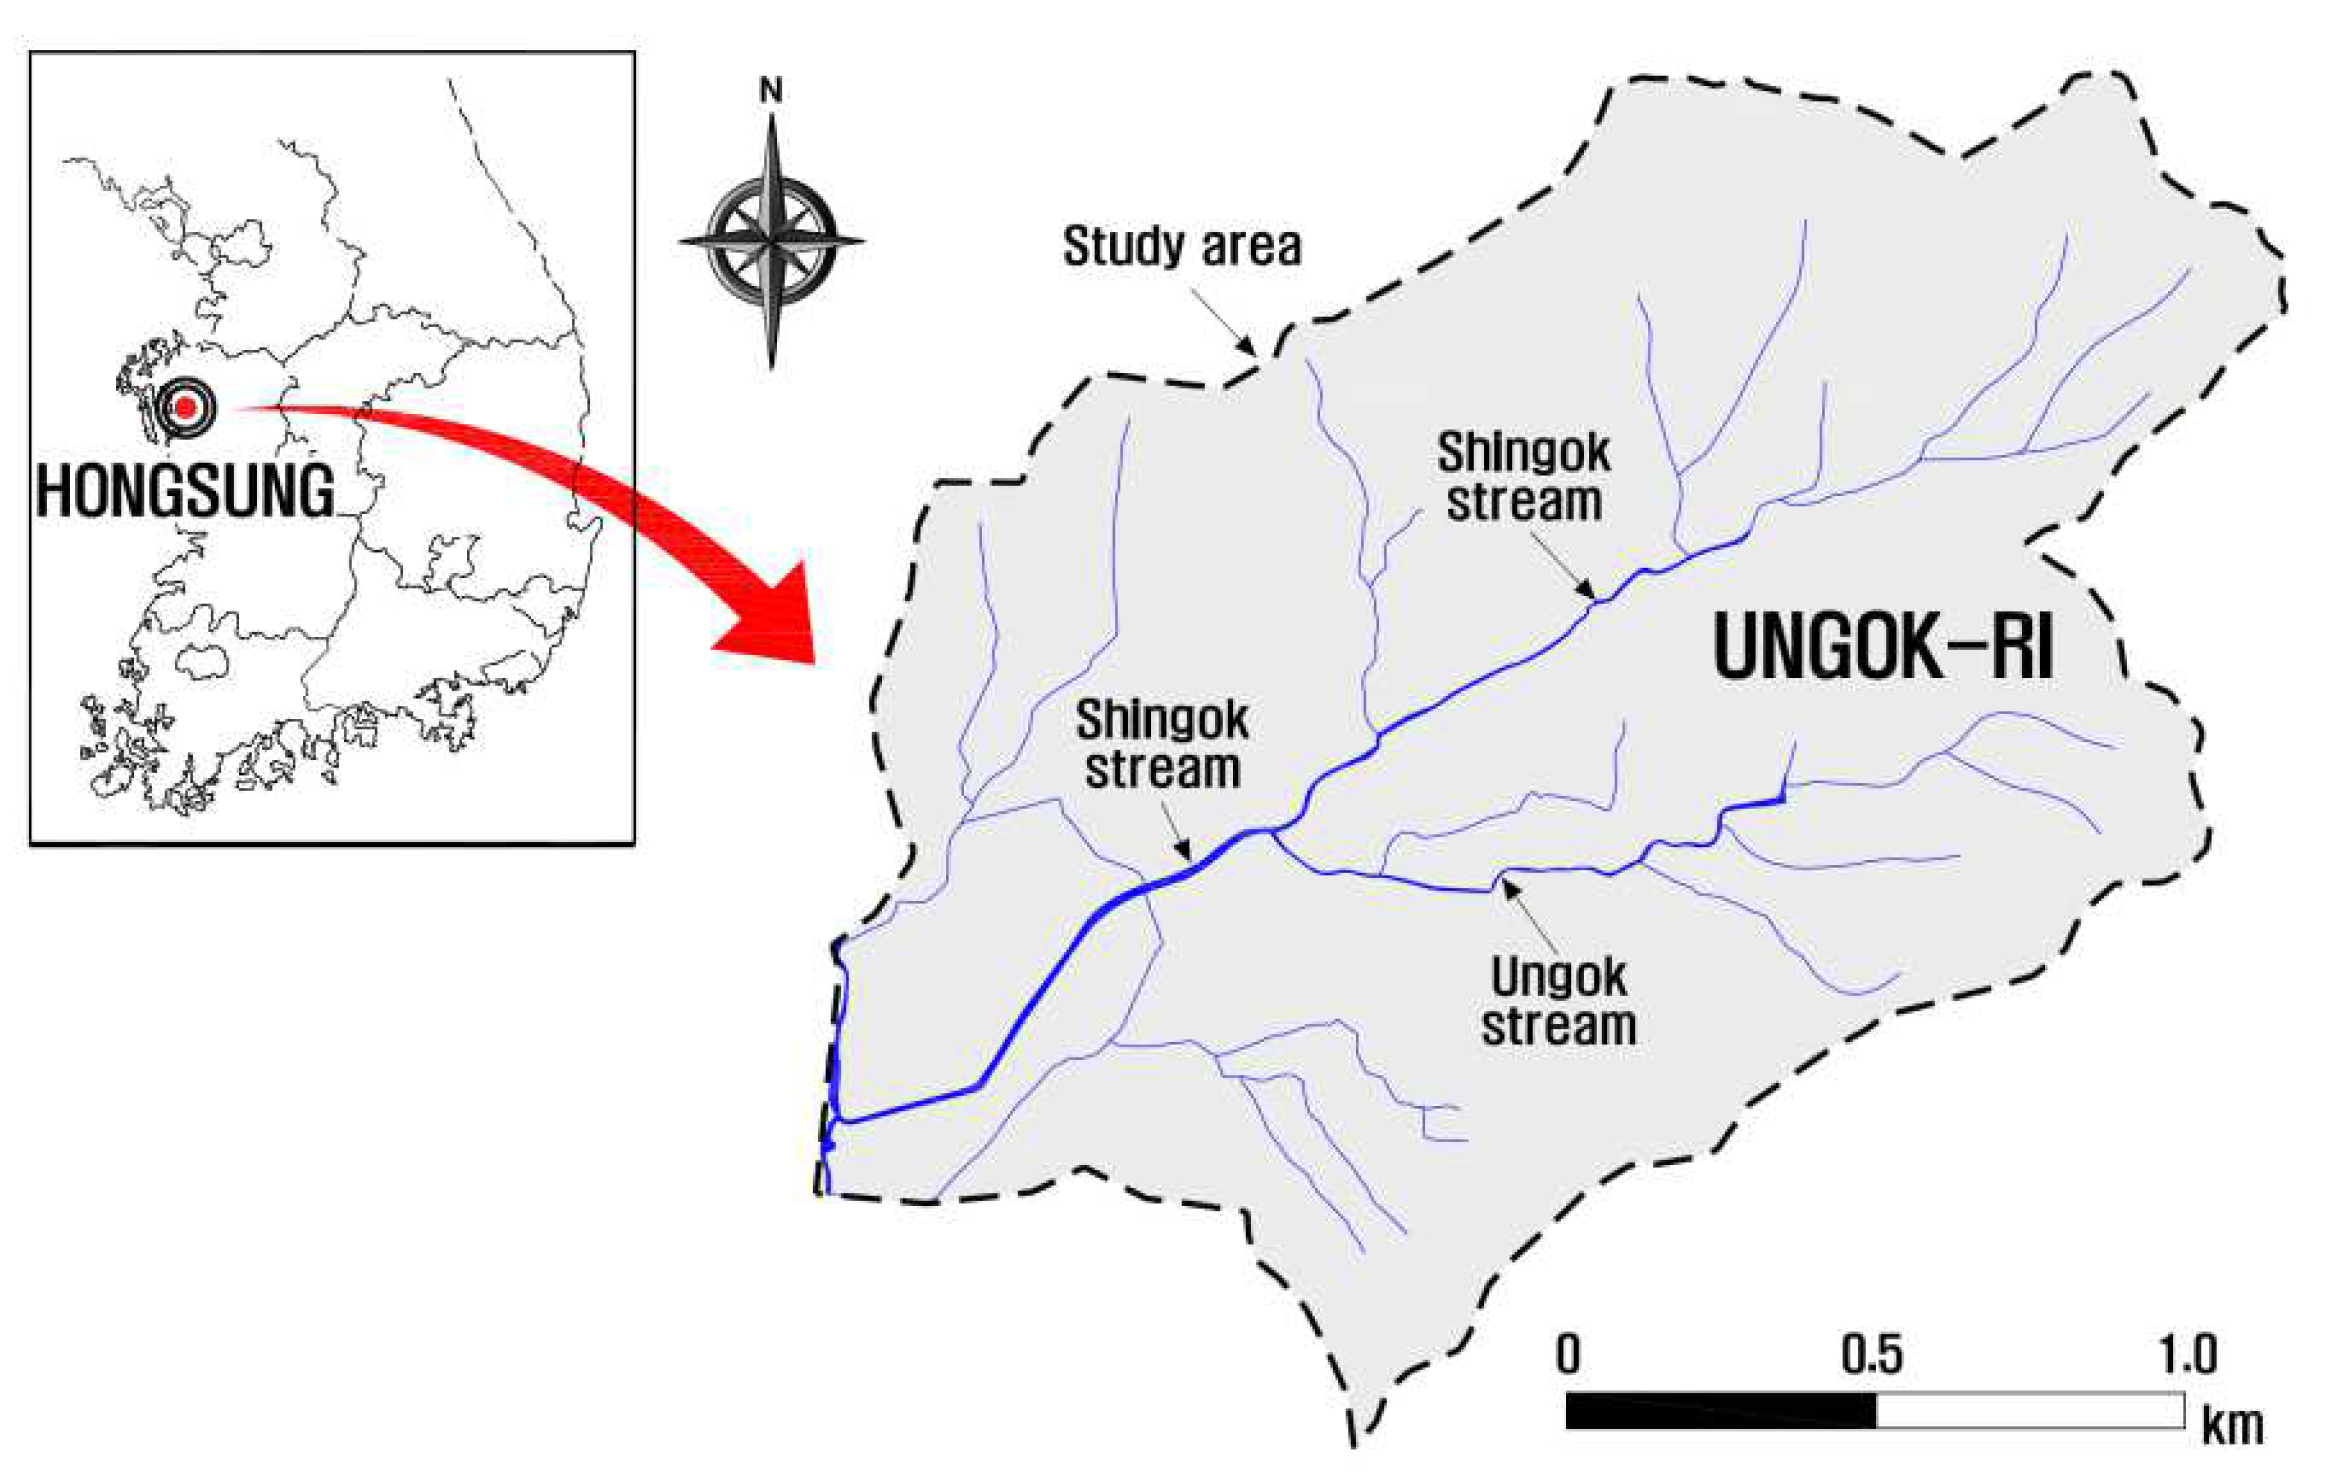
2.1. Study Area
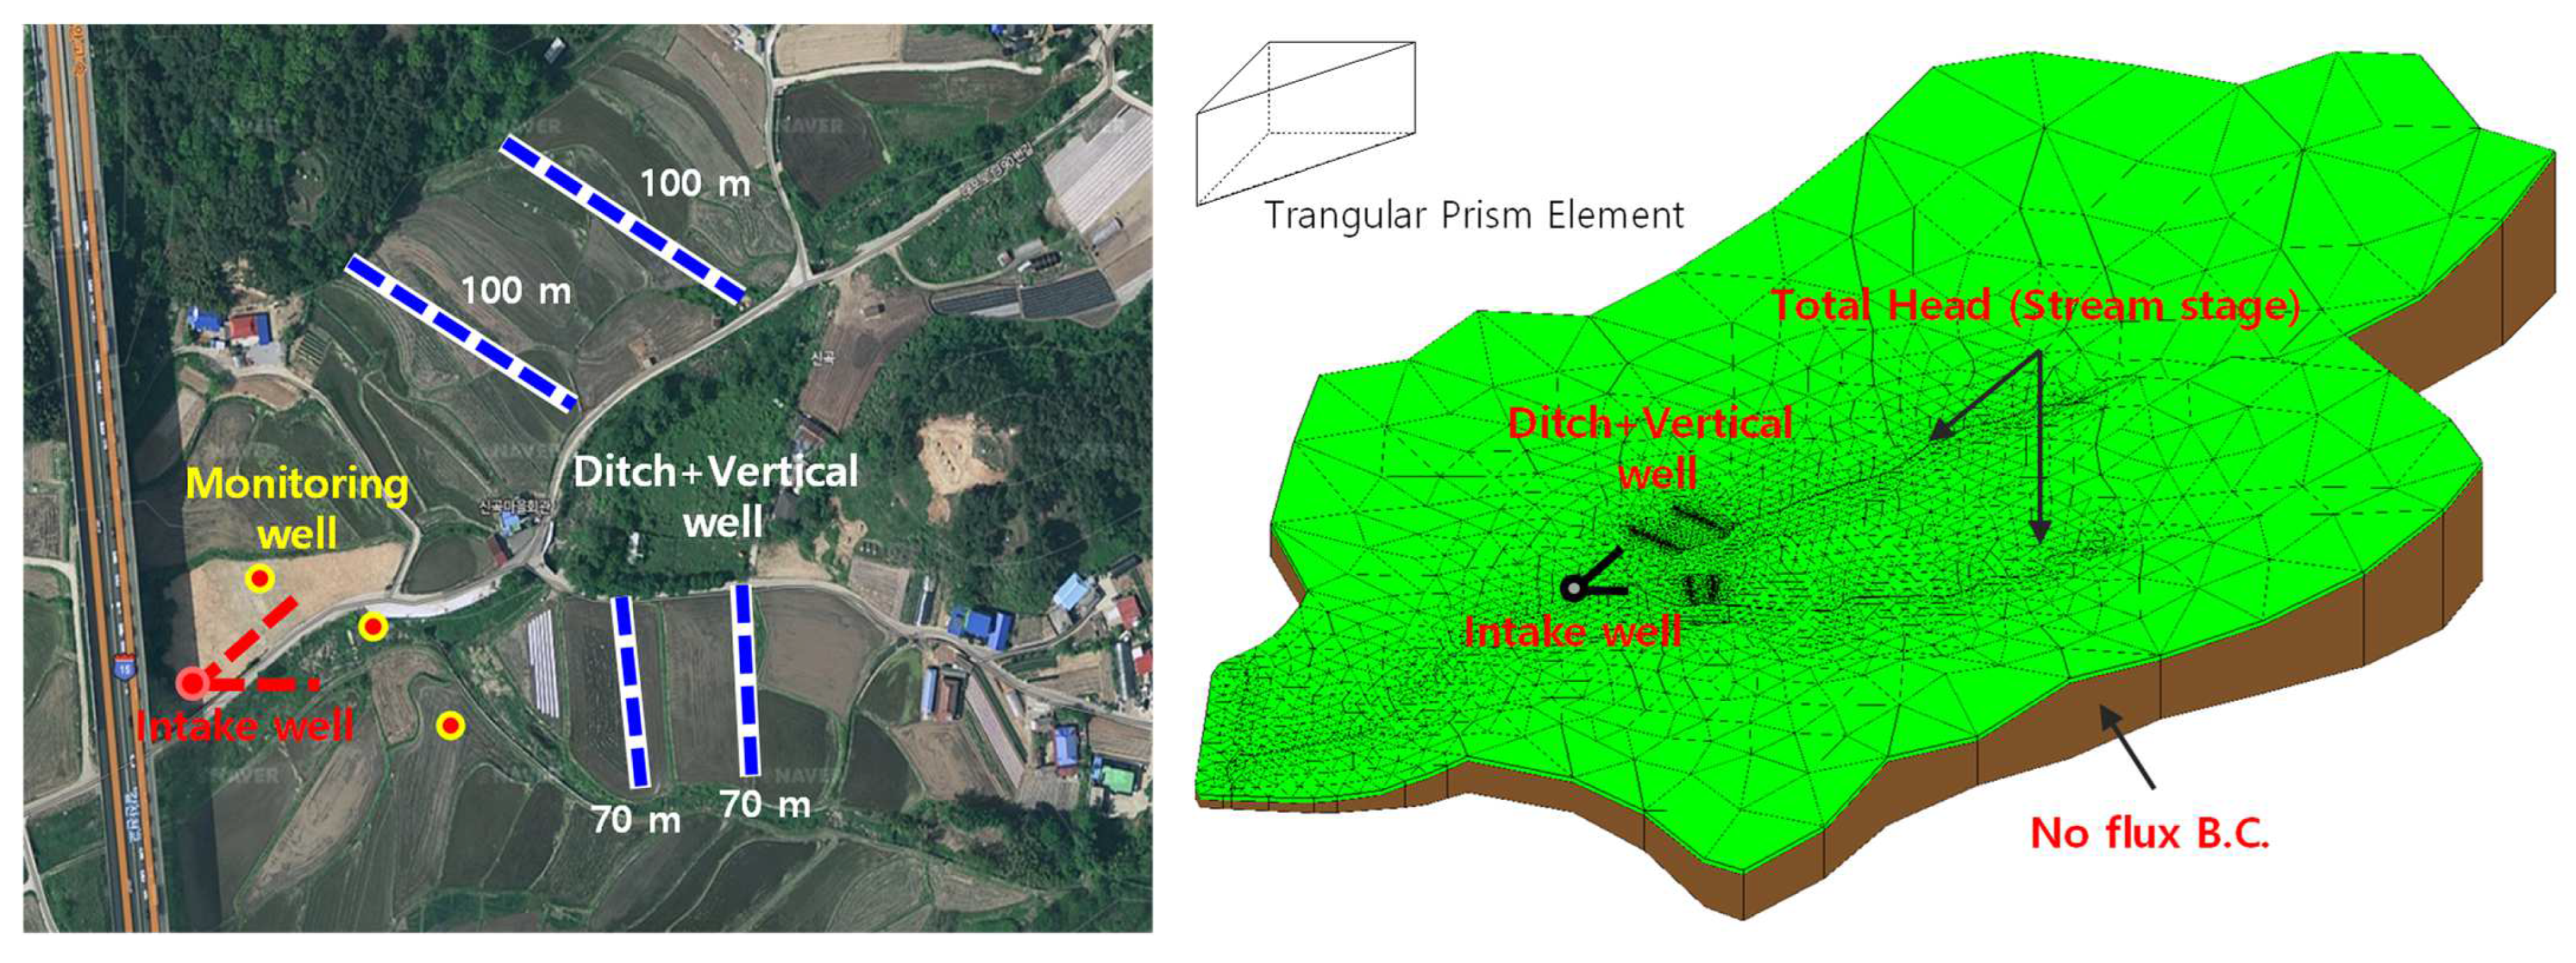
2.2. Methods
- Optimal size of media in the ditch of the artificial recharge facilities from various media sizes (10/30/50/70/90 mm)
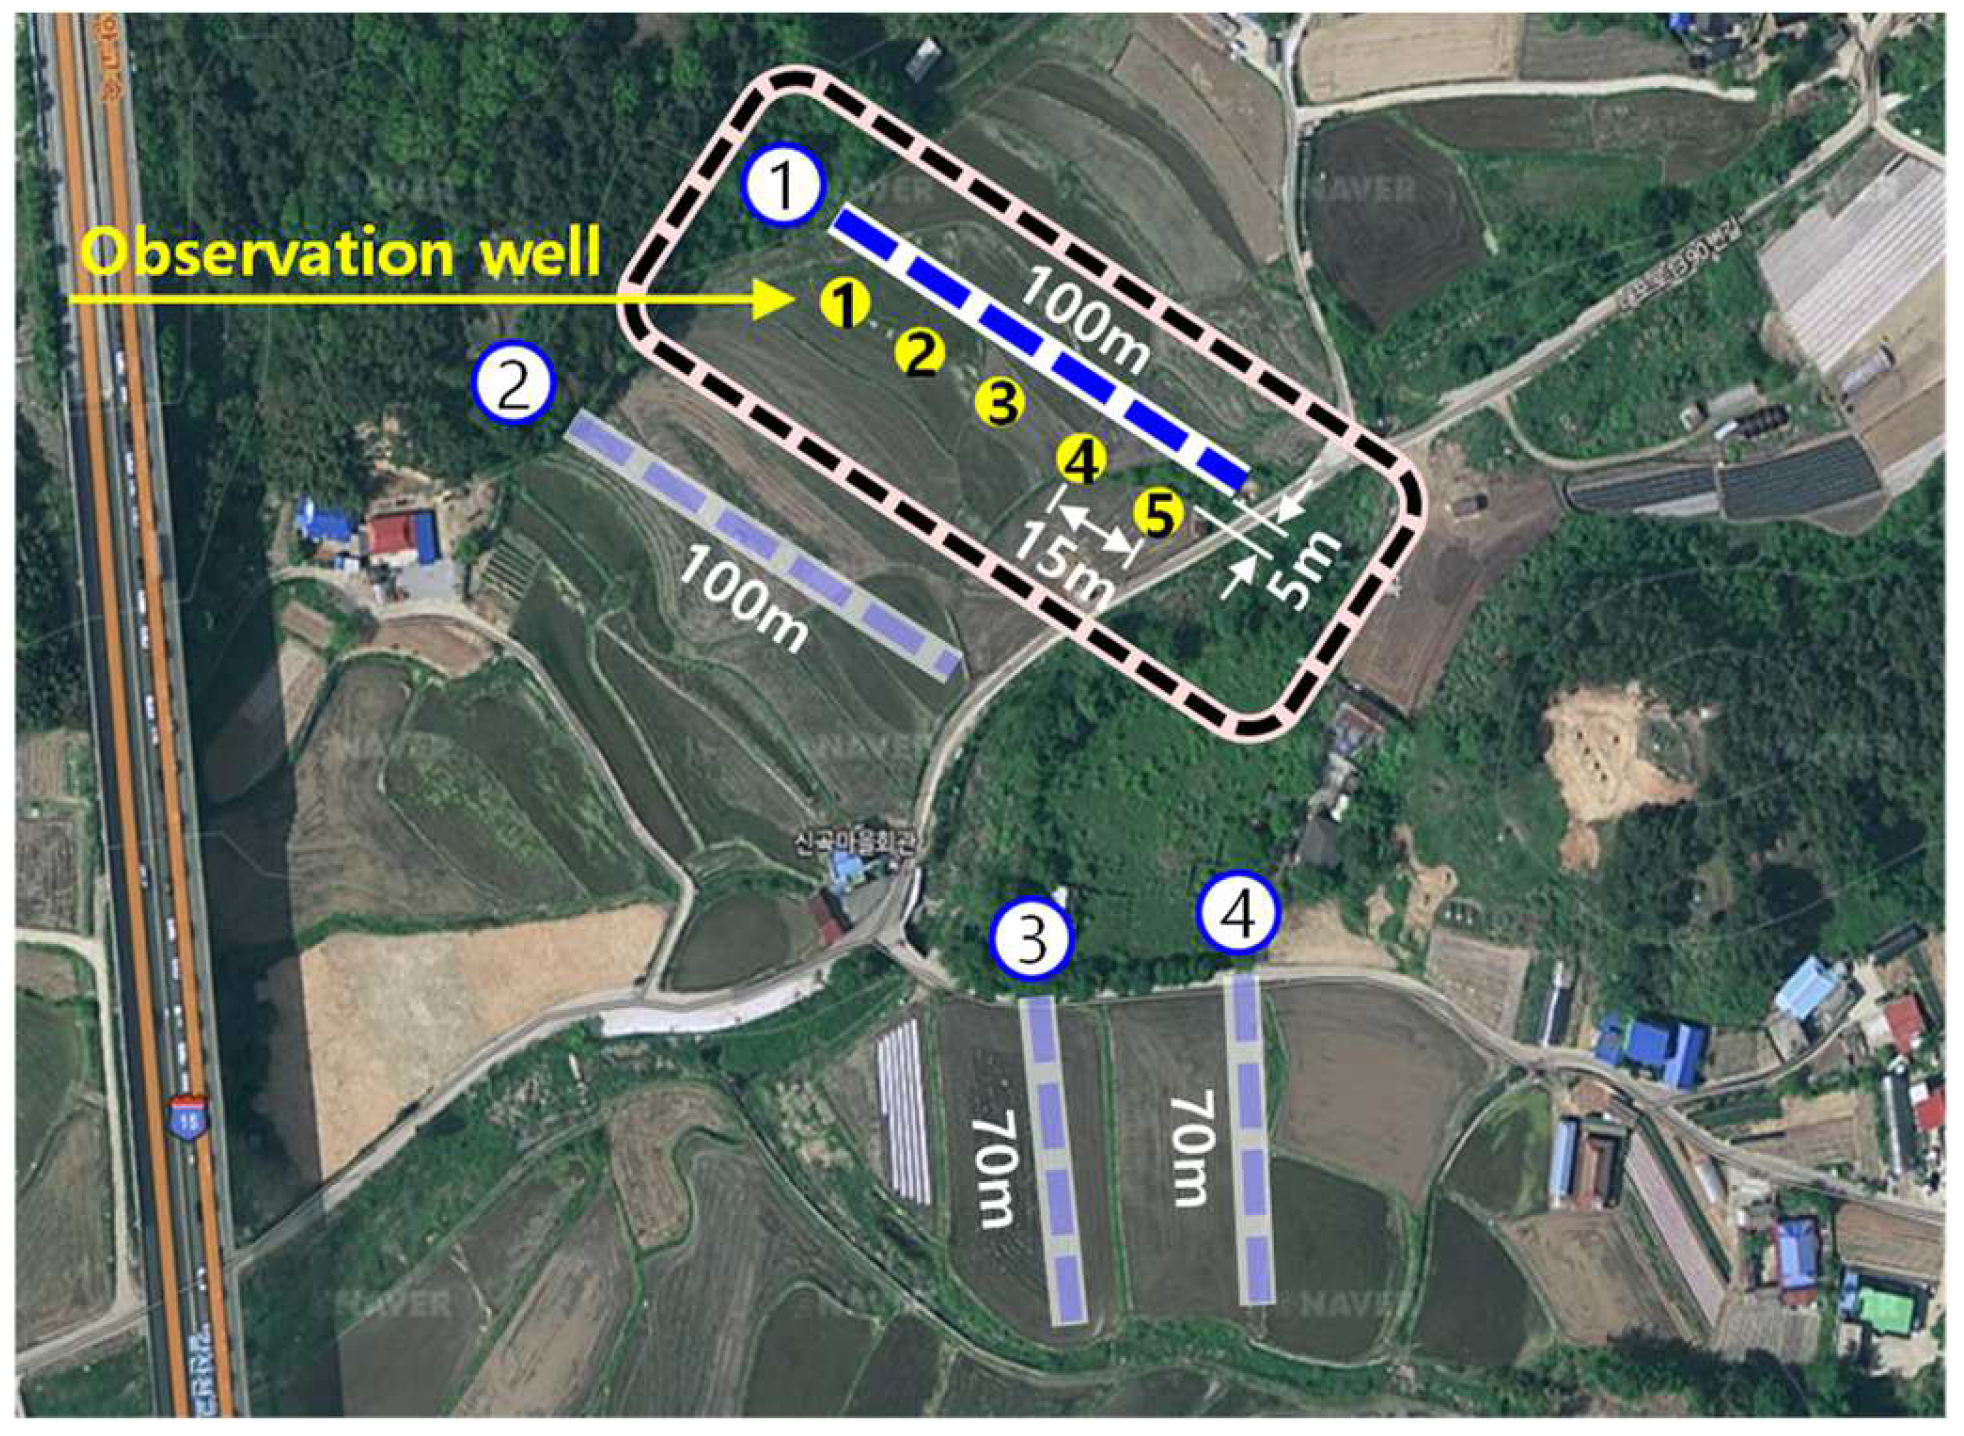
- Optimal spacing of vertical wells for artificial recharge facilities from various vertical well intervals (5/10/15 m)
- Optimal screen opening ratio of horizontal wells for water intake facilities from various opening ratios (10/20/30%)
3. Results
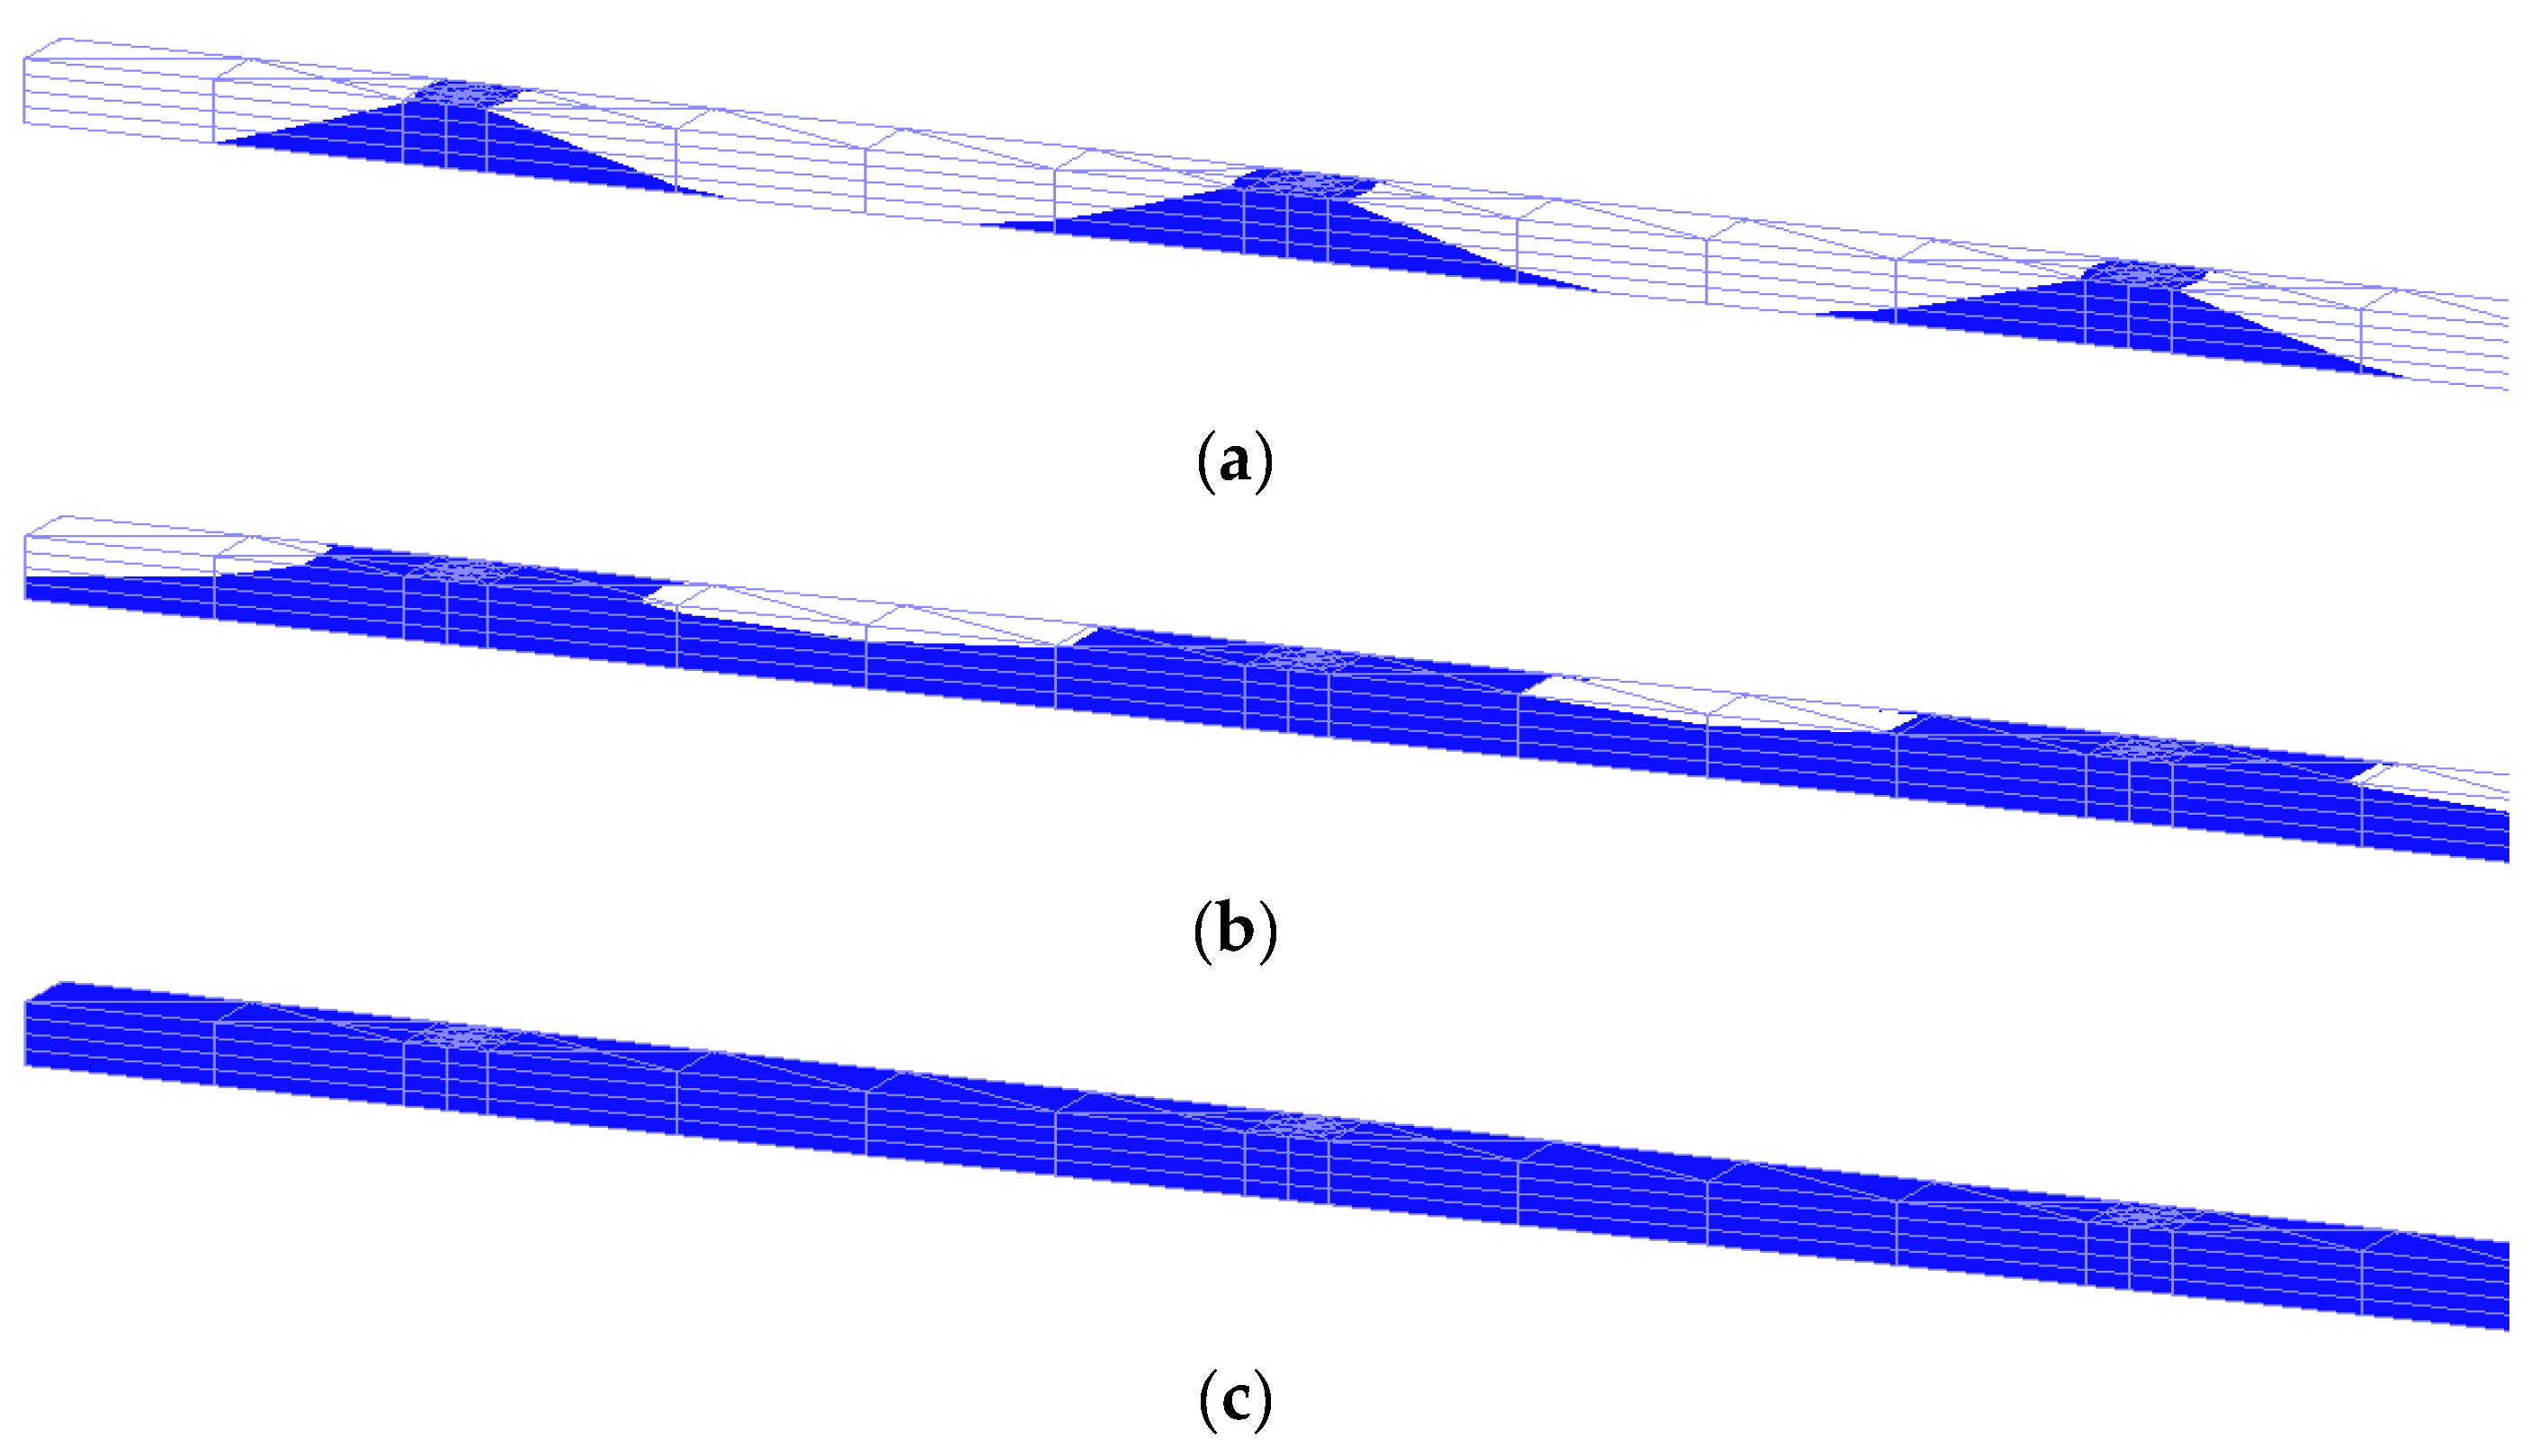
3.1. Evaluation of Optimal Size of Media in the Ditch
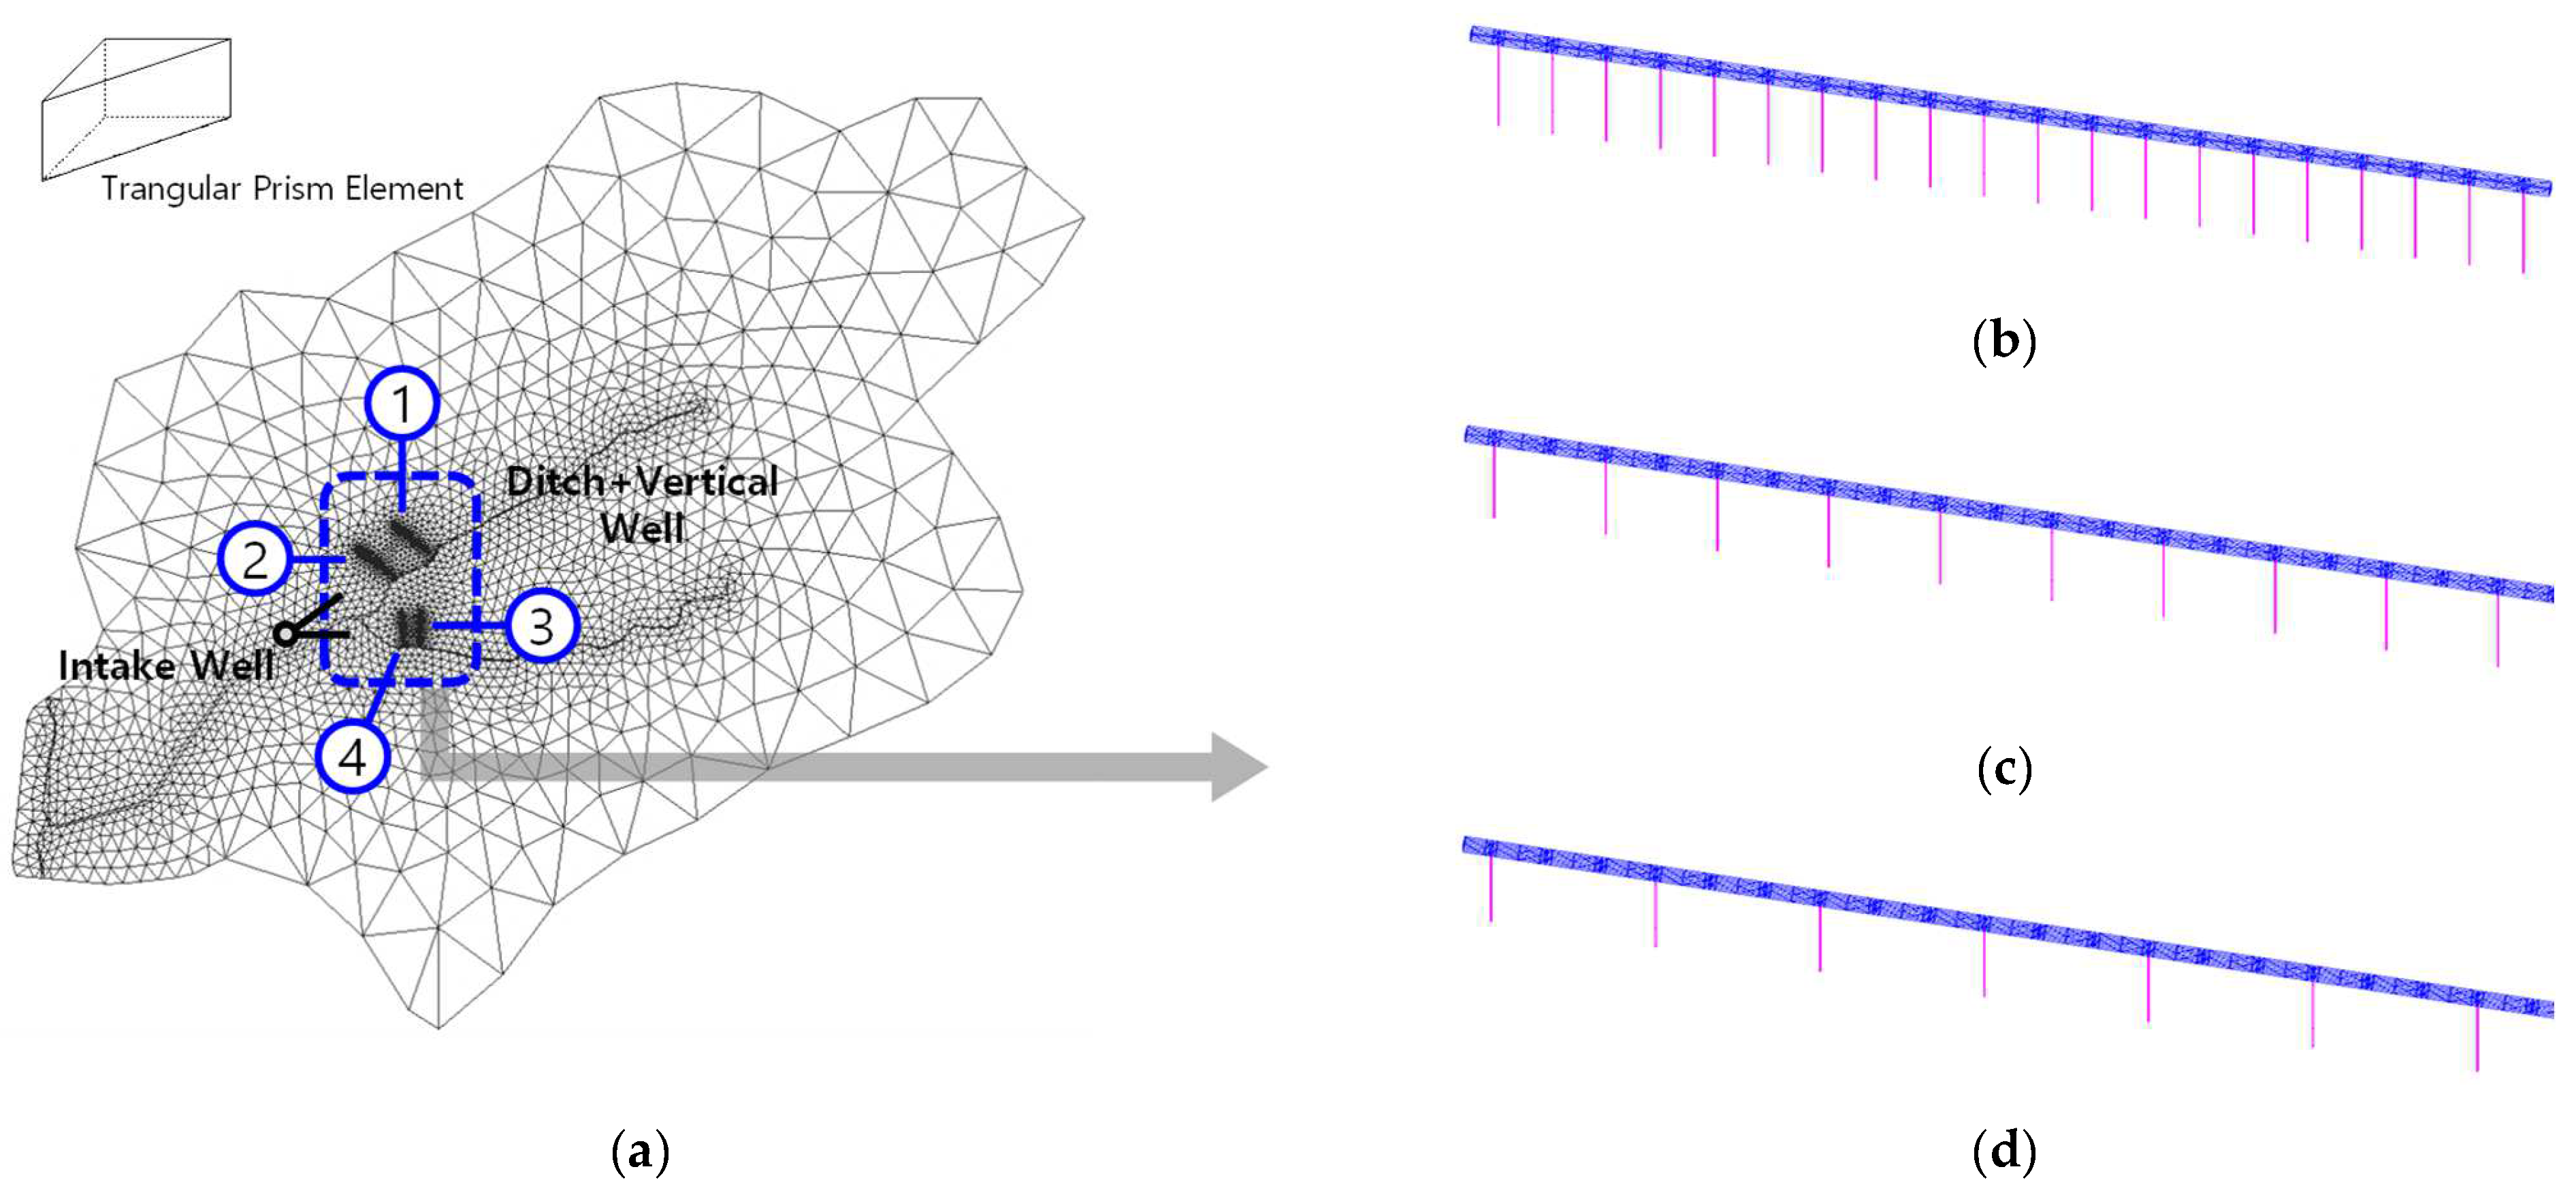
3.2. Evaluation of Proper Spacing of Vertical Wells in the Ditch
3.3. Evaluation of Optimal Opening Ratio of Horizontal Well
3.4. Model Calibration
3.5. Performnance Evaluation of Artifical Recharge–Water Intake System
3.6. Optimal Operation Scenario for the Artificial Recharge–Water Intake System
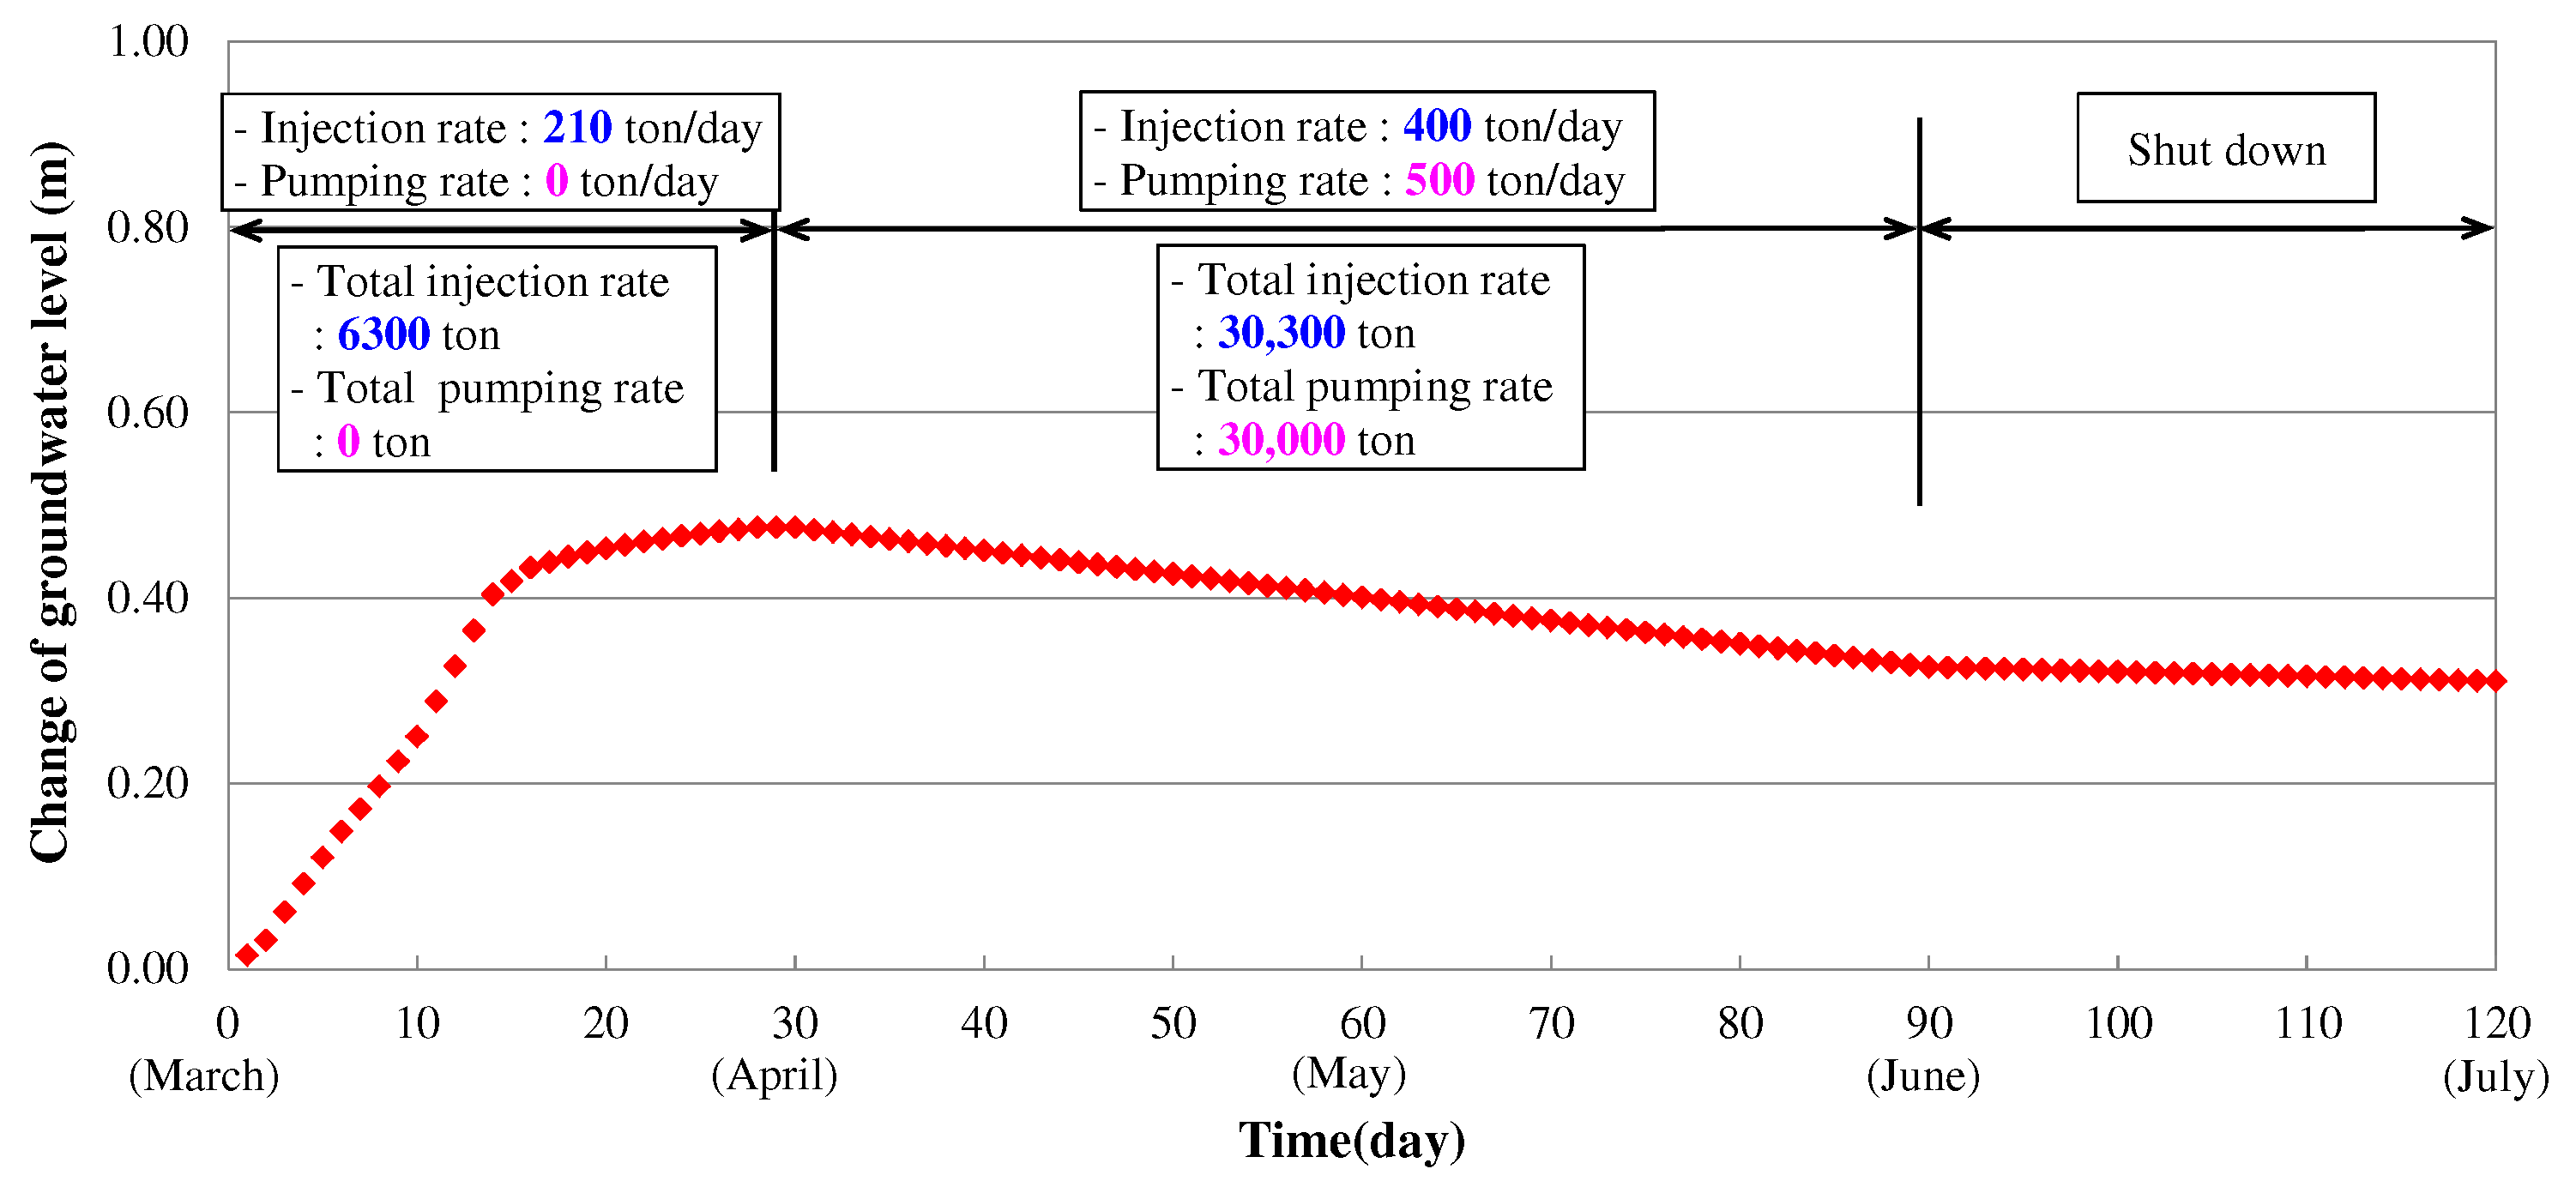
- Stage 1: Injection rate of 210 ton/day for 30 days (1 March~31 March)
- Stage 2: Injection rate of 400 ton/day for 60 days and withdrawal rate of 500 ton/day for 60 days (1 April~31 May)
- Stage 3: Shut down of recharge and water intake operation (1 June~)
4. Conclusions
- (1)
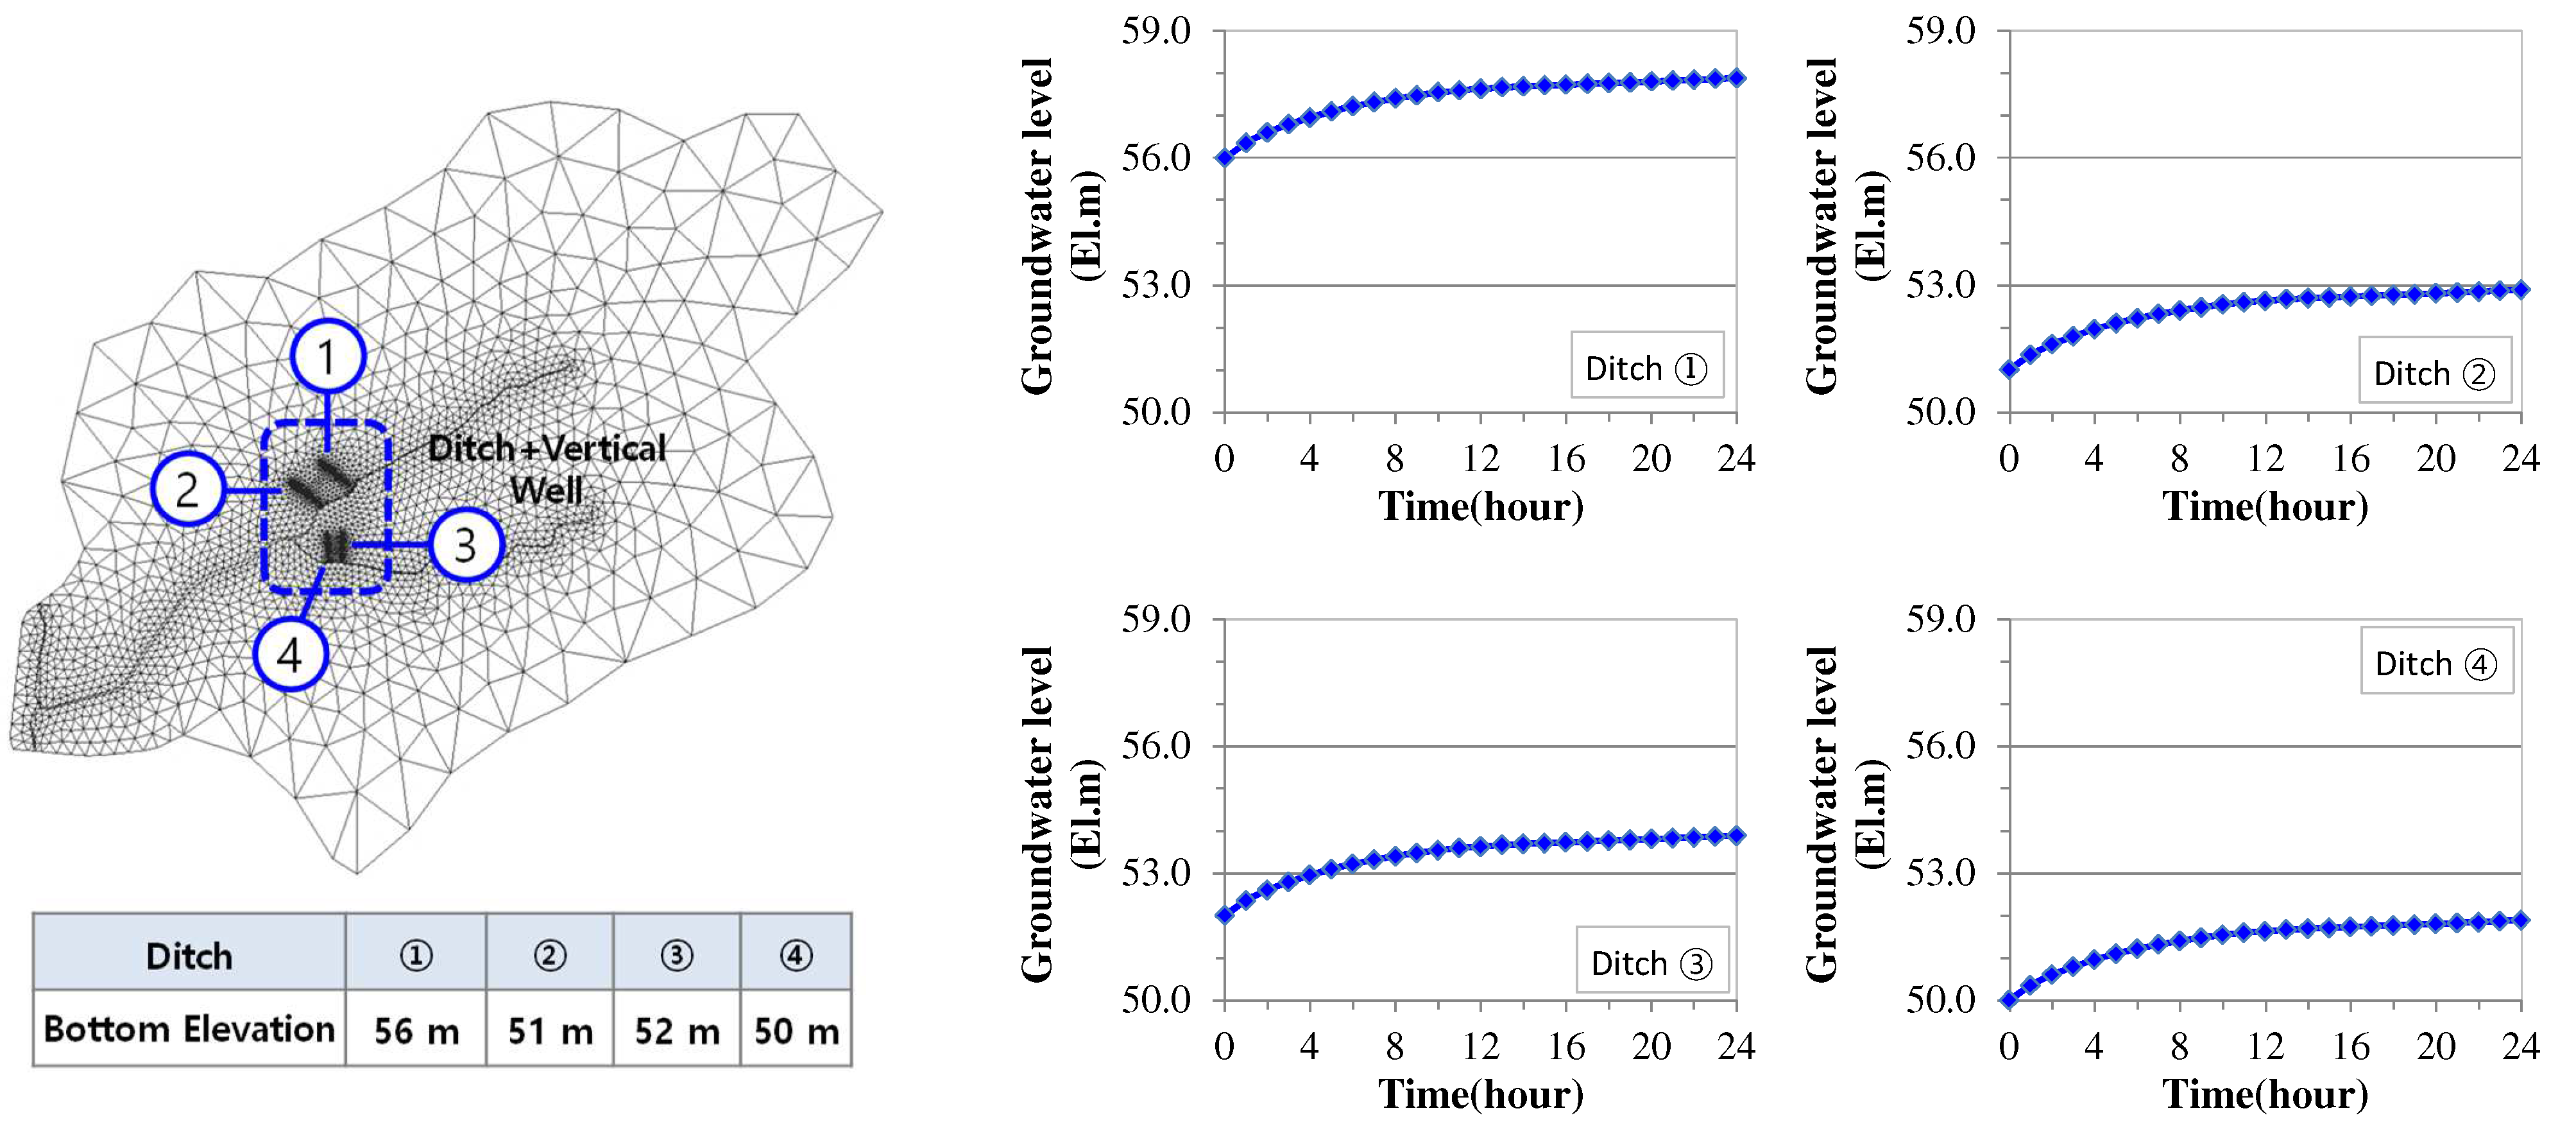
- In order to derive the optimal media size within the ditch of the artificial recharge facility, the media size was divided into 10, 30, 50, 70, and 90 mm. As a result of modeling by setting the fill time of the groundwater level in the ditch, 50 mm was determined as the optimal media size in consideration of economic feasibility because the fill time and infiltration rate were similar at more than 50 mm.
- (2)
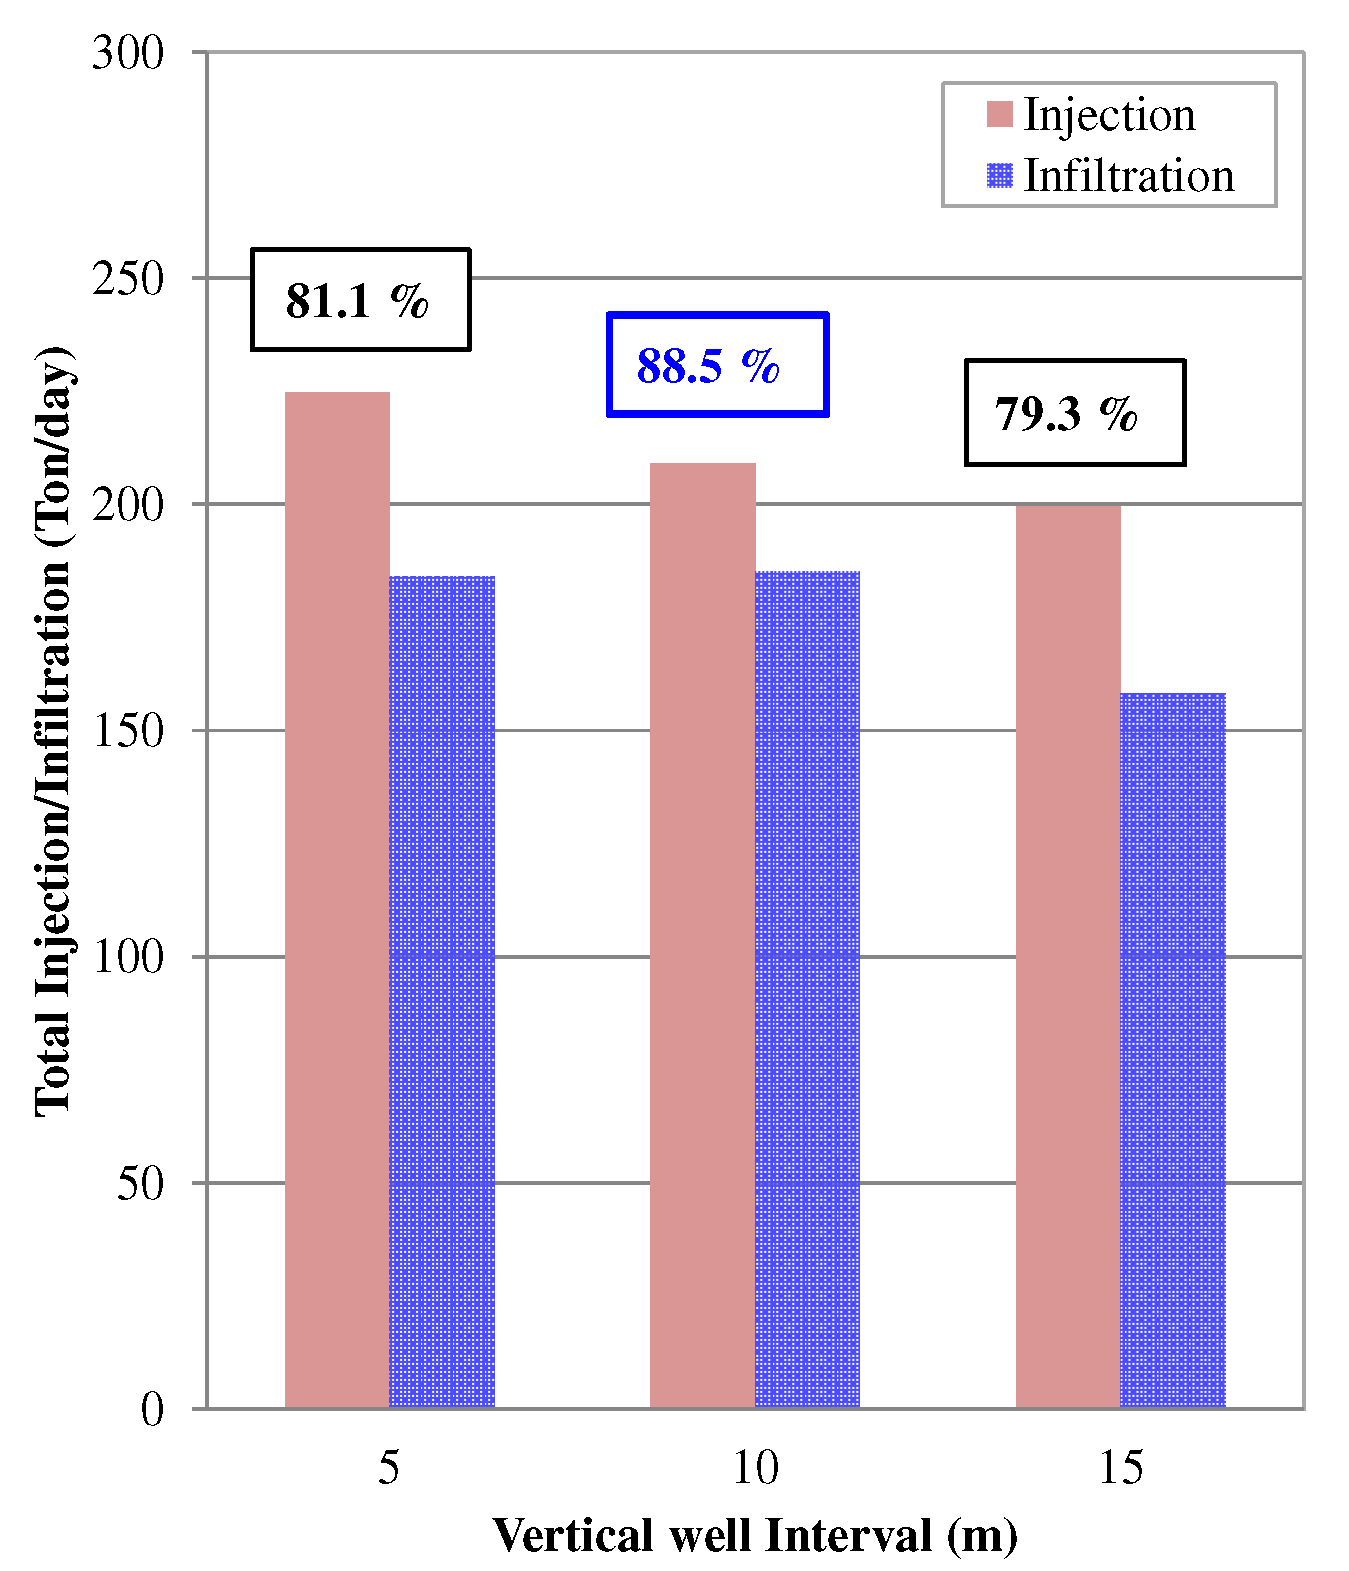
- The vertical well intervals were divided into 5, 10, and 15 m to derive the appropriate vertical well interval for the artificial recharge facility, and the efficiency for each interval was estimated after setting the target groundwater level rise at less than 0.1 m below the ground surface in consideration of the depth of crop growth. As a result, efficiency was 81.9, 88.5, and 79.3% at intervals of 5, 10, and 15 m, respectively, which showed that the highest efficiency and the proper spacing of the vertical wells was determined to be 10 m in consideration of economic feasibility and maintenance according to the actual vertical well construction.
- (3)
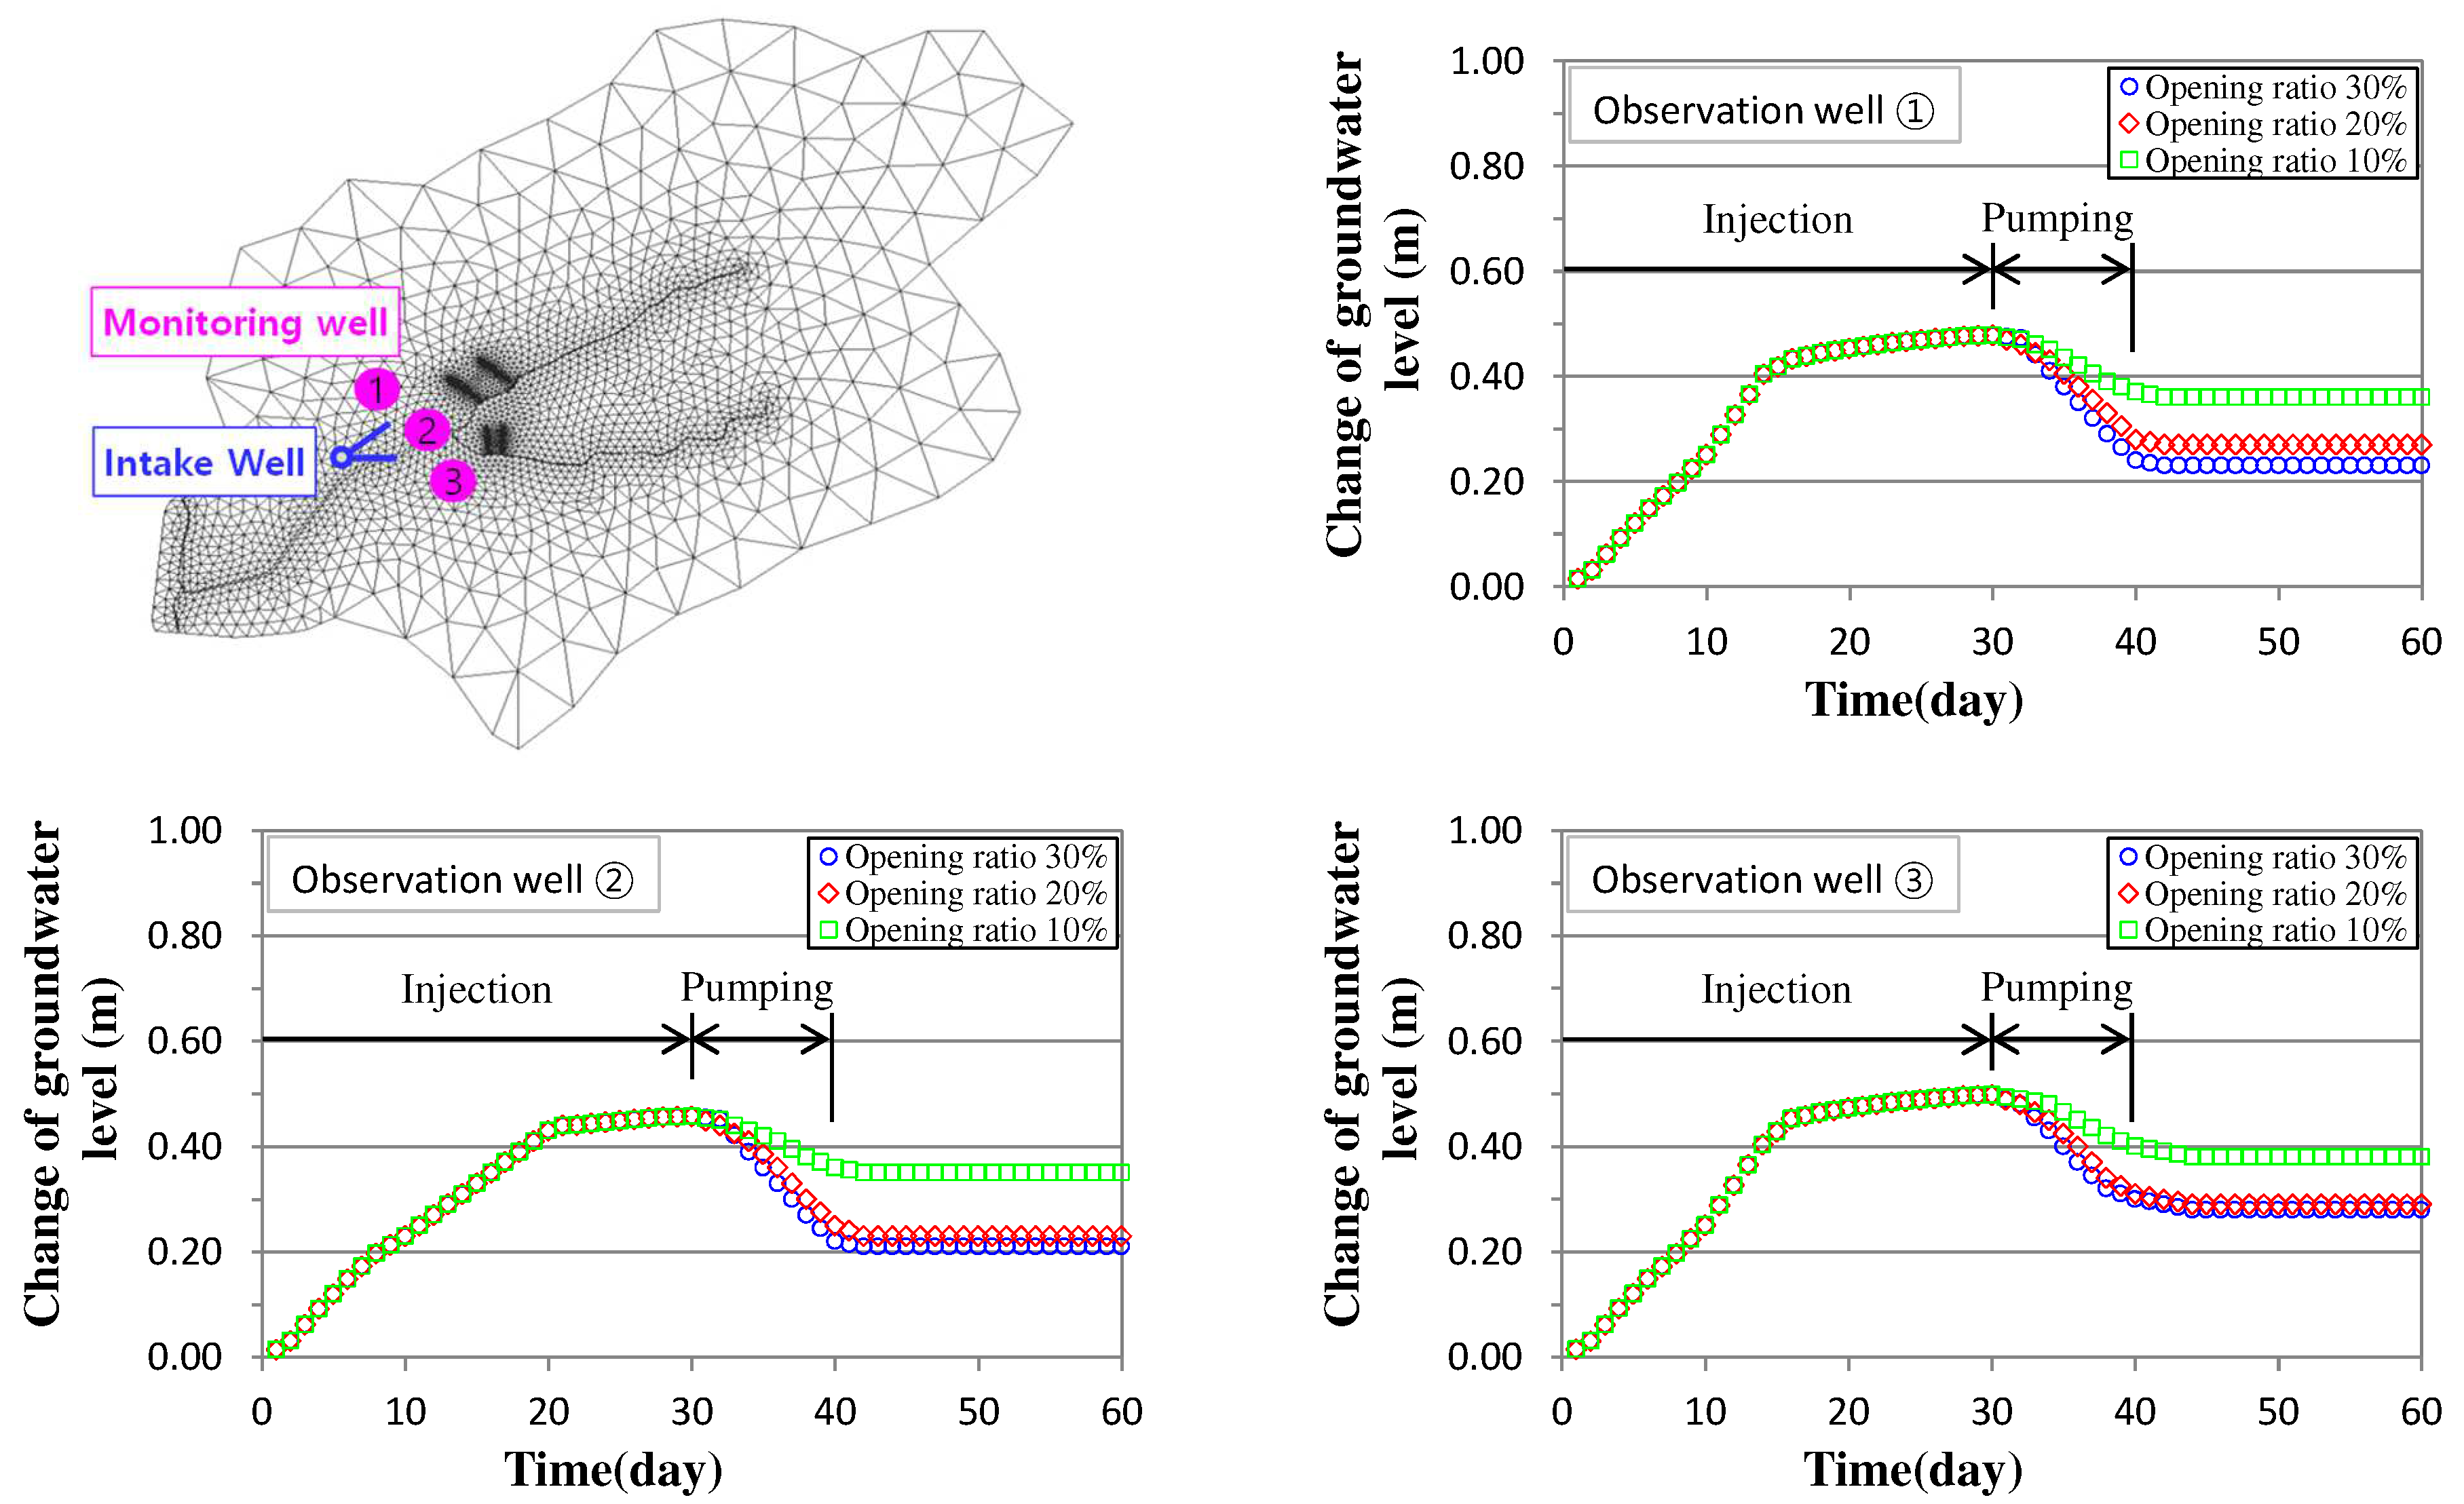
- In order to derive the proper opening ratio of the horizontal well, which is the main design factor of the water intake facility, the opening ratio was divided into 10, 20, and 30%, and comparative evaluation was performed based on the average value of groundwater level fluctuations at three observation wells. As a results, the groundwater level dropped 0.10, 0.19, and 0.20 m at 10, 20, and 30% of the opening ratio, respectively. At an opening ratio of more than 20%, the fluctuation of the groundwater level was small, and it was predicted that there would be no significant change in the water intake capacity, and the appropriate opening ratio of the horizontal well was determined to be 20%.
- (4)
- A conceptual model was constructed by reflecting the optimal design factor values derived for the performance evaluation of the artificial recharge–water intake system, and the groundwater level fluctuations were predicted according to the injection conditions. After dividing the artificial injection conditions into 100, 150, and 210 ton/day, comparative evaluation was performed through the average value of groundwater level fluctuations at three observation wells. As a result, it was simulated that the groundwater level rose by 0.29, 0.40, and 0.48 m, respectively, and the increase in groundwater level was similar in the case of artificial injection of more than 210 ton/day. Therefore, it was estimated that it was most appropriate to inject 210 ton/day for 1 month for the artificial recharge performance of this study area. In addition, in order to evaluate the water intake capacity of the water intake system after the artificial injection is completed, the water intake conditions were divided into 300, 400, and 500 ton/day, and the average value of the change in groundwater level at the three observation wells was used for comparative evaluation. As a result, it was simulated that the groundwater level dropped by 0.16, 0.18, and 0.24 m, respectively, and the drop in the groundwater level at 500 ton/day water intake does not affect the groundwater storage capacity and the initial groundwater level in this study area. Moreover, because the water supply efficiency within a short period was the highest, it was estimated that water intake at 500 ton/day was the most appropriate.
- (5)
- Based on the optimal design factor values and performance evaluation results of the artificial recharge–water intake facility, the operation scenario of the artificial recharge–water intake system for sustainable water supply was configured by referring to the agricultural water demand analysis data and water budget analysis results in this study area. As a result of simulation, a stabilized groundwater level was confirmed through numerical modeling.
Author Contributions
Funding
Institutional Review Board Statement
Informed Consent Statement
Data Availability Statement
Conflicts of Interest
References
- Kim, Y.C.; Kim, Y.J. A review on the state of the art in the management of aquifer recharge. J. Geol. Soc. Kor. 2010, 46, 521–533. [Google Scholar]
- Kim, Y.C.; Seo, J.A.; Ko, K.S. Trend and Barrier in the Patents of Artificial Recharge for Securing Goundwater. J. Soil Groundw. Env. 2012, 17, 59–75. [Google Scholar] [CrossRef]
- Moon, S.H.; Ha, K.C.; Kim, Y.C.; Koh, D.C.; Yoon, H.S. Examination for Efficiency of Groundwater Artificial Recharge in Alluvial Aquifer Near Nakdong River of Changweon Area, Korea. J. Econ. Env. Geol. 2014, 47, 611–623. [Google Scholar] [CrossRef]
- Bouwer, H. Artificial Recharge of Groundwater: Hydrogeology and Engineering. Hydrogeol. J. 2002, 10, 121–142. [Google Scholar] [CrossRef]
- Lee, Y.D.; Shin, D.M.; Kim, B.J.; Kim, G.B. Selecting Aquifer Artificial Recharge Methods based on Characteristics of the Target Aquifer. J. Eng. Geol. 2019, 29, 483–494. [Google Scholar]
- Oh, S.H.; Kim, Y.C.; Koo, M.H. Modeling Artificial Groundwater Recharge In The Hancheon Drainage Area, Jeju island, Korea. J. Soil Groundw. Env. 2011, 16, 34–45. [Google Scholar] [CrossRef][Green Version]
- Lee, H.J.; Koo, M.H.; Kim, Y.C. Determining Optimal Location of an Artificial Recharge Well using an Optimization-coupled Groundwater Flow Model. J. Soil Groundw. Env. 2014, 19, 66–81. [Google Scholar] [CrossRef]
- Wazir, A. Numerical Simulations of Transient Groundwater Flow to Ditch Drains in Homogeneous Anisotropic Soil Using MODFLOW. J. Sci. Eng. Res. 2015, 6, 161–168. [Google Scholar]
- Hao, Q.; Shao, J.; Cui, Y.; Xie, Z. Applicability of Artificial Recharge of Groundwater in the Yongding River Alluvial Fan in Beijing through Numerical Simulation. J. Earth Sci. 2014, 25, 575–586. [Google Scholar] [CrossRef]
- Lin, D.G.; Chang, K.C.; Ku, C.Y.; Chou, J.C. Three-Dimensional Numerical Investigation on the Efficiency of Subsurface Drainage for Large-Scale Landslides. Appl. Sci. 2020, 10, 3346. [Google Scholar] [CrossRef]
- Cha, J.H.; Lee, J.Y.; Kim, W.S. Development of 3-D Flow Model for Porous Media with Scenario-based Ground Excavation. J. Kor. Soc. Dis. Sec. 2017, 10, 19–27. [Google Scholar]
- Todd, D.K.; Mays, L.W. Groundwater Hydrology, 3rd ed.; Wiley: New Jersey, NJ, USA, 2005; pp. 38–41. [Google Scholar]
- Choi, M.R.; Kim, G.B. Optimum interval of artificial groundwater recharge wells, considering injection rate and economic feasibility. Geo. J. 2022, in press. [Google Scholar]
- Delleur, J.W. The Handbook of Groundwater Engineering, 2nd ed.; CRC Press: Boca Raton, FL, USA, 2007; pp. 11–18. [Google Scholar]
- Kim, G.B.; Hwang, C.I.; Choi, M.R. Assessment of the need and potential for groundwater artificial recharge based on the water supply, water demand, and aquifer properties in a water shortage region of South Korea. Env. Earth Sci. 2021, 80, 115. [Google Scholar] [CrossRef]


| Media | Layer | Depth (GL.–m) | Hydraulic Conductivity (cm/s) | ||
|---|---|---|---|---|---|
| Range | Average | Range | Average | ||
| Alluvium | 1 | 1.5~5.8 | 3.1 | 4.05 × 10⁻⁵~1.14 × 10⁻³ | 4.11 × 10⁻⁴ |
| Weathered soil | 2 | 1.5~6.5 | 3.7 | 5.82 × 10⁻⁵~4.10 × 10⁻³ | 7.00 × 10⁻⁴ |
| Bedrock | 3 | 5.8~12.3 | 8.7 | 1.40 × 10⁻⁶~2.13 × 10⁻⁴ | 7.20 × 10⁻⁵ |
| Vertical Well Interval (m) | Vertical Well Number | Vertical Well Injection Rate (ton/day) | Ditch Injection Rate (ton/day) | Total Injection Rate (ton/day) | |||||||||
|---|---|---|---|---|---|---|---|---|---|---|---|---|---|
| 100m Ditch (①,②) | 70m Ditch (③,④) | Ditch ① | Ditch ② | Ditch ③ | Ditch ④ | Sum | Ditch ① | Ditch ② | Ditch ③ | Ditch ④ | Sum | ||
| 5 | 20 | 14 | 1.29 | 87.67 | 42.7 | 36.1 | 35.9 | 22.5 | 137.2 | 224.8 | |||
| 10 | 10 | 7 | 2.06 | 70.14 | 42.7 | 36.9 | 37.1 | 22.5 | 139.1 | 209.2 | |||
| 15 | 7 | 5 | 2.51 | 60.29 | 42.7 | 36.9 | 37.1 | 22.5 | 139.1 | 199.6 | |||
| Division | Injection (ton/day) | Infiltration (ton/day) | |||||
|---|---|---|---|---|---|---|---|
| Vertical Well Interval | Vertical Well Interval | ||||||
| 5 m | 10 m | 15 m | 5 m | 10 m | 15 m | ||
| Ditch | ① | 42.7 | 42.7 | 42.7 | 34.2 | 34.9 | 35.1 |
| ② | 36.1 | 36.9 | 36.9 | 32.2 | 33.2 | 33.2 | |
| ③ | 35.9 | 37.1 | 37.1 | 32.4 | 33.4 | 33.5 | |
| ④ | 22.5 | 22.5 | 22.5 | 20.1 | 21.2 | 21.2 | |
| subtotal | 137.2 | 139.2 | 139.2 | 118.8 | 122.7 | 123.0 | |
| Vertical Well | ① | 25.8 | 20.6 | 17.6 | 20.1 | 19.0 | 10.6 |
| ② | 25.8 | 20.6 | 17.6 | 18.8 | 18.1 | 10.0 | |
| ③ | 18.0 | 14.4 | 12.6 | 13.1 | 12.5 | 7.3 | |
| ④ | 18.0 | 14.4 | 12.6 | 13.1 | 13.0 | 7.4 | |
| subtotal | 87.6 | 70.0 | 60.4 | 65.2 | 62.6 | 35.3 | |
| Total | 224.8 | 209.2 | 199.6 | 184.0 | 185.2 | 158.3 | |
| Observation Number | 1 | 2 | 3 | 4 | 5 | Average | |
|---|---|---|---|---|---|---|---|
| Groundwater Elevation (cm) | |||||||
| Measurement | 49.0 | 42.5 | 38.9 | 40.3 | 44.6 | 43.1 | |
| Modeling | 45.8 | 45.2 | 44.0 | 44.3 | 42.2 | 44.3 | |
| Step | Injection Period | Injection Rate (m3/day) | Total Injection Rate (ton) | Pumping Rate (m3/day) | Total Pumping Rate (ton) |
|---|---|---|---|---|---|
| ① | 1 March~31 March | 210 | 6300 | 0 | 0 |
| ② | 1 April~31 May | 400 | 30,300 | 500 | 30,000 |
| ③ | 1 June~ | Shut down | |||
Publisher’s Note: MDPI stays neutral with regard to jurisdictional claims in published maps and institutional affiliations. |
© 2022 by the authors. Licensee MDPI, Basel, Switzerland. This article is an open access article distributed under the terms and conditions of the Creative Commons Attribution (CC BY) license (https://creativecommons.org/licenses/by/4.0/).
Share and Cite
Lee, J.-Y.; Woo, T.-Y. Performance Evaluation of Artificial Recharge–Water Intake System Using 3D Numerical Modeling. Water 2022, 14, 1974. https://doi.org/10.3390/w14121974
Lee J-Y, Woo T-Y. Performance Evaluation of Artificial Recharge–Water Intake System Using 3D Numerical Modeling. Water. 2022; 14(12):1974. https://doi.org/10.3390/w14121974
Chicago/Turabian StyleLee, Jae-Young, and Tae-Young Woo. 2022. "Performance Evaluation of Artificial Recharge–Water Intake System Using 3D Numerical Modeling" Water 14, no. 12: 1974. https://doi.org/10.3390/w14121974
APA StyleLee, J.-Y., & Woo, T.-Y. (2022). Performance Evaluation of Artificial Recharge–Water Intake System Using 3D Numerical Modeling. Water, 14(12), 1974. https://doi.org/10.3390/w14121974


