1. Introduction
Estuaries are ununiformed waters influenced by interactions between seawater and freshwater masses, which makes the ecological and hydrodynamic systems relatively complex. This complex ecosystem provides abundant fishery resources and promotes social and economic development; the complicated hydrodynamic system makes the estuary region rich in landforms [
1,
2,
3]. However, influenced by tropical depressions and cyclones and natural hydrodynamic processes, landforms and coastlines of estuaries change dynamically, affecting the ecological environment, social economy, ship transportation, and flood defenses. Therefore, a proper understanding of the water movement behavior of estuaries will be beneficial for flood control and disaster reduction, coastal erosion protection, and the preservation of coastal structures [
4,
5,
6].
An estuary’s flow field is mainly controlled by physical parameters, such as river runoff, waves, tidal current, estuary topography, and salinity. When river sediment is transported to an estuary, it is affected by the transport effects of tidal or coastal currents, and longshore drift is formed. If river sediment supply is greater than the sediment transport capacity of waves and tidal currents, then features such as deltas, sandspits, and other accumulative landforms can develop. If the sediment supply is less than the sediment transport capacity of waves and tidal currents, the beach line will retreat, forming an eroded coast [
7,
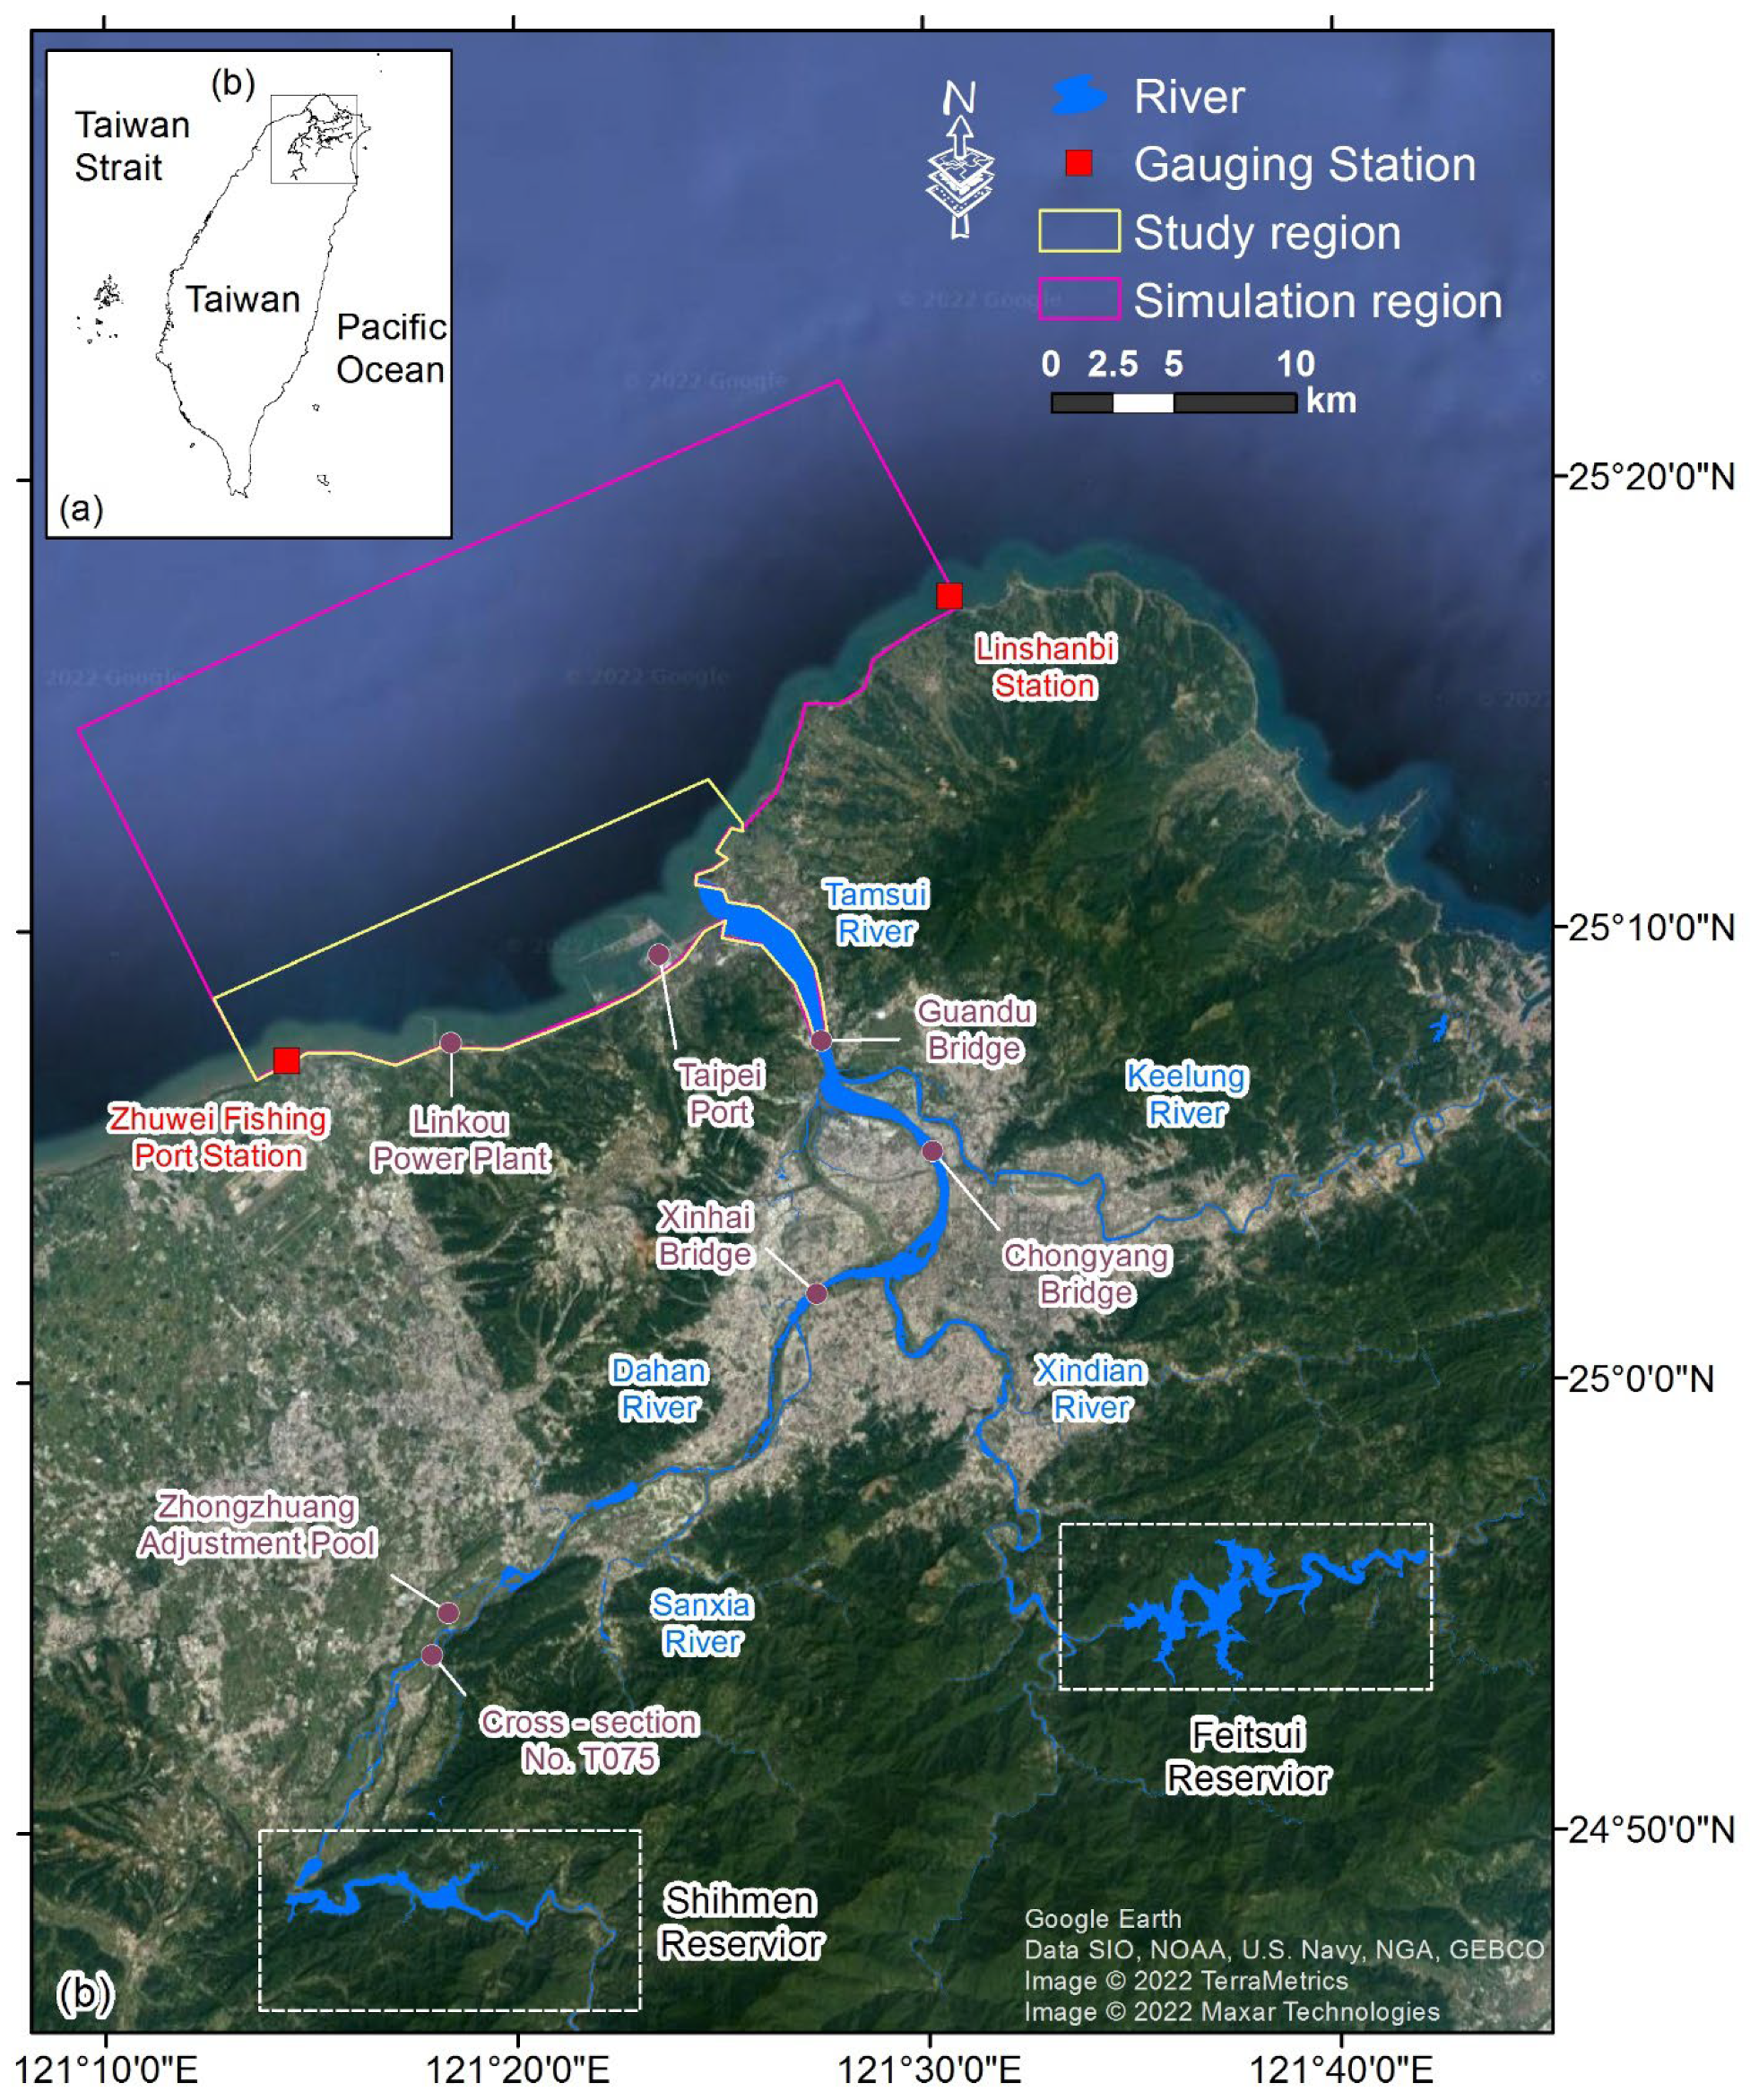
8]. The Tamsui River is the largest river in northern Taiwan, and its erosion-deposition balance is closely related to hydrology and sediment transport behaviors in the adjacent sea area. The lower river’s main sediment contributions come from longshore drift and sediment transport from upstream sources (
Figure 1). However, since the completion of the Shihmen reservoir in 1964, the reservoir intercepted part of the sediment, and sand mining became prevalent in the river channel. Consequently, total sediment transport of the Tamsui River decreased, some reaches experienced downcutting of deep grooves, and the estuary and coast retreated. After completing Taipei Port in 1998, the longshore drift behavior between the estuary and the adjacent coast changed further, impacting the topography and landscape of the adjacent coast. The topography of the Tamsui River estuary to the North breakwater at Taipei port changed from erosion to siltation because the North breakwater blocked part of alongshore sediment transport [
9]. Studies report that the total siltation of the Shihmen reservoir will reach 1.05 million m
3 by 2020, accounting for 34% of the designed storage capacity of the reservoir [
10]. To meet the demand for water resources in northern Taiwan and prolong the life of the reservoir, the Water Resources Agency of the Ministry of Economic Affairs put forward three strategies, including (1) construction of the Zhongzhuang Adjustment Pool of Dahan River to increase the amount of reserve water for 6.2 days, so that the reservoir’s sediment discharge time of the reservoir can be more concentrated and continuous; (2) construction of Amuping tunnel in the reservoir area for hydraulic scouring and silting and land transportation; (3) construction of the Dawanping Tunnel to remove the density current fine silt [
11,
12]. The Zhongzhuang adjustment pool was completed and put into use at the end of 2017, while the completion and use of the Amuping anti-silt tunnel are expected by the end of 2022, which will change the sediment supply of the Tamsui River and indirectly affect the balance of the supply and demand of silt between rivers and seas.
To effectively manage the sediment in the estuary area, the use of appropriate numerical tools is necessary to clarify changes in riverbed erosion and deposition in the estuary and adjacent coast. The models used to describe the dynamic changes in silt in coastal areas can be divided into sediment transport and morphodynamic models. Morphological models can be divided into process or behavior-based models. The first method is based on the sediment transport process, while the second method is based on geology, which describes the large-scale morphological system through simple parameters, and is continuously corrected by long-term observation data [
13]. To simulate morphological changes in the Tamsui estuary, a process-based model is employed to drive sedimentation under the combined influence of longshore drift and downstream transport.
Longshore and cross-shore drift is a phenomenon of nearshore sediment movement caused by waves and currents. The high shear velocity of the boundary layer at the bottom of waves produces strong turbulence and shear stress that further affects the current and increases resistance at the bottom of the mixed flow, affecting the transport and spread of sediment [
14]. Therefore, some scholars analyzed wave propagation under smooth and rough beds through experiments and numerical methods [
15,
16]. Moreover, the incident angle of waves and interactions between waves and currents also affect sediment movement behavior in offshore areas. Therefore, some researchers developed numerical models to explore sediment movement processes in river channels under the action of waves and currents, the influences of tides on sandpits, and the effect of beach nourishment by sediment sources in offshore areas [
17,
18,
19].
To reproduce the morphological change behavior caused by river runoff, waves, tidal currents, and topography using a numerical model, a hydrodynamic model is usually taken as the core framework, and then wave, turbulence, and morphological change models are added. This can be called an integrated coastal model to simulate dynamic changes in coastal types, including shoreline changes, erosion, barrier breaching, and dam breaks [
20,
21,
22,
23]. Presently, common commercial models include Delft3D [
24], ROMS [
25], POLCOMS [
26], the MIKE suite of models [
27], TELEMAC [
28], FVCOM [
29], and CCHE2D-Coast [
30].
Among them, CCHE2D-Coast is an integrated river/coastal/estuarine/ocean process modeling system [
30]. It is applicable for simulating multi-scale hydrodynamic and morphodynamic processes of free-surface water flows, such as river flows, tidal currents, waves, and storm surges, induced by tropical cyclones, longshore and cross-shore sediment transport, and morphological changes. This model has been successfully applied to simulate processes in the Touchien [
31,
32] and Tamsui River estuaries [
33]. The validated CCHE2D-Coast has been used for further simulations and predictions of the morphological changes and impact of reservoir sediment flushing in this study.
The rest of the paper is organized as follows:
Section 2 provides a brief introduction of the integrated coastal and estuarine processes model, CCHE2D-Coast.
Section 3 gives more information on the study area and the settings of relevant model parameters.
Section 4 provides simulation results and discussions on the tidal levels and monsoon and typhoon seasons on the morphological changes in the estuary area. Finally,
Section 5 concludes the paper and provides some preliminary suggestions on the management of flood and sediment in the estuary.
2. Brief Description of Integrated Coastal and Estuarine Model
CCHE2D-Coast is an integrated model that takes river, estuary, and coastal processes into account. It can be used to simulate hydrodynamic and morphological changes under hydrological conditions, such as waves, tides, storm surges, and river floods. Therefore, relevant units can make protection planning and engineering layout of estuaries and coasts according to numerical simulation results. The numerical model was developed by the National Center for Computational Hydroscience and Engineering at the University of Mississippi, USA, and has been verified by several studies [
30,
31,
32,
33,
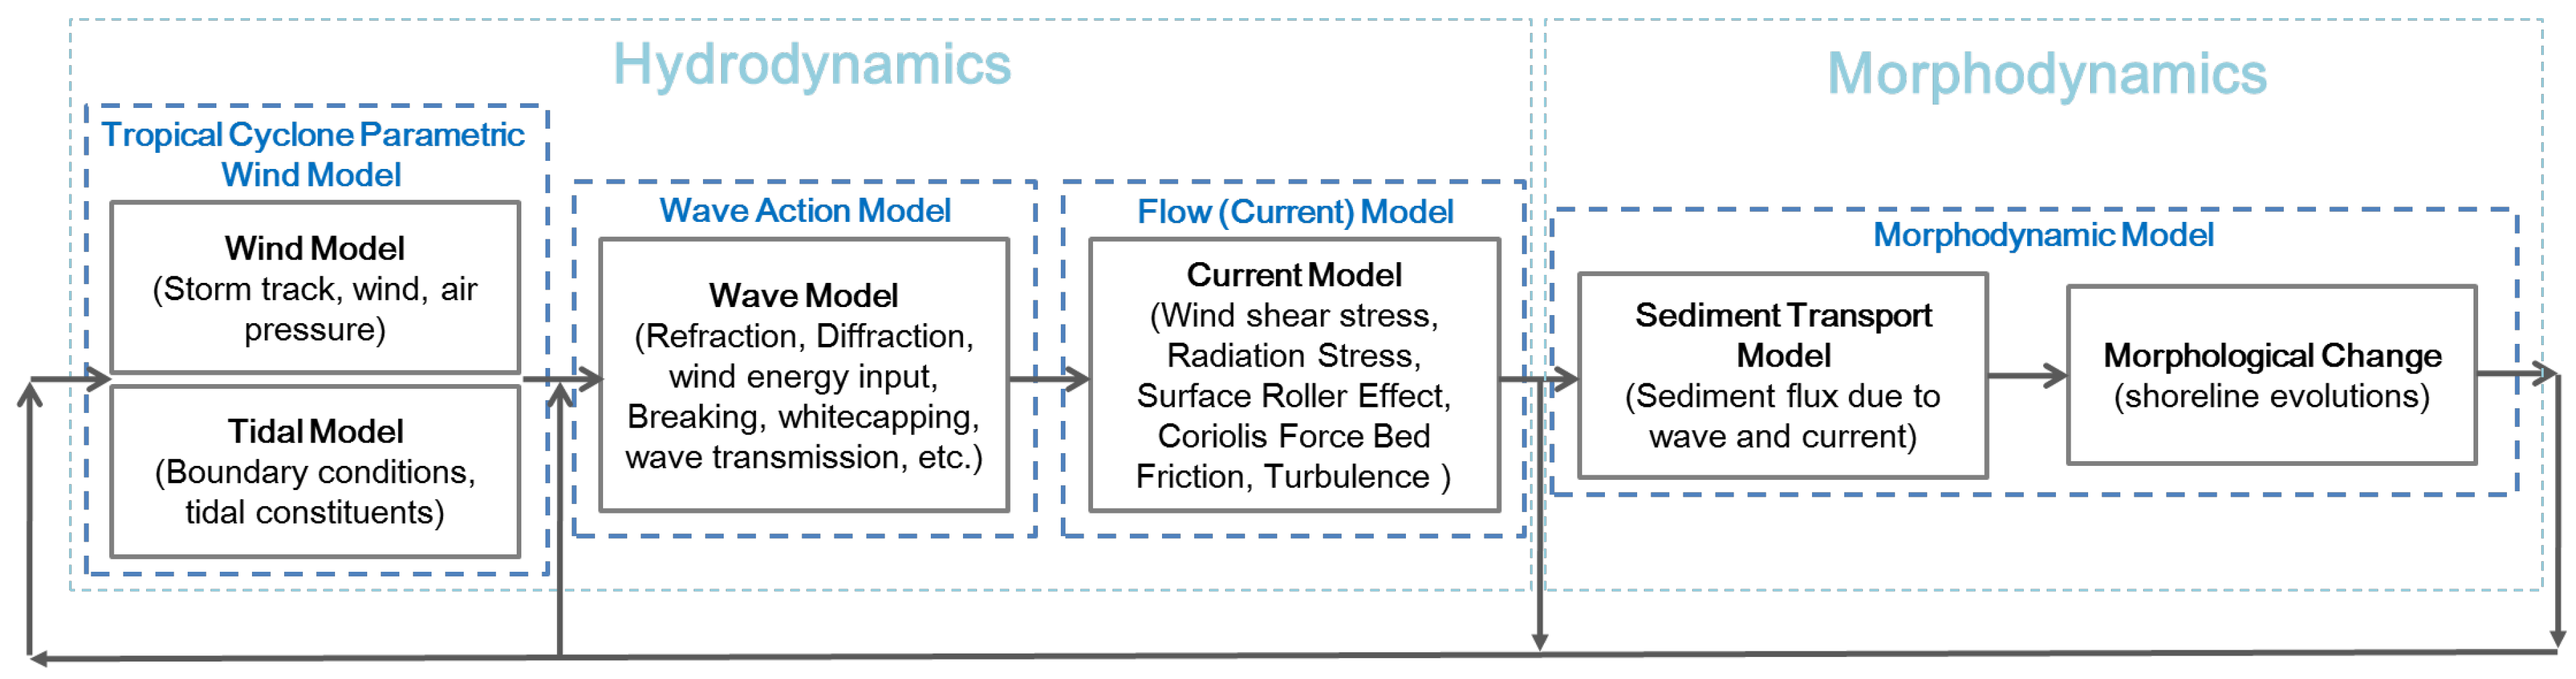
34]. CCHE2D-Coast consists of four main sub-modules, namely (1) the wave action model; which calculates the multi-directional and irregular deformation transformation process of waves from deep oceans to shallow water areas, (2) the tropical cyclone parametric wind model; which simulates the atmospheric pressure and wind field along the landing line of tropical cyclones and storms, (3) the flow (current) model; which simulates the hydrodynamic process, including astronomical tide, storm surge, waves, river runoff, coastal current, and Coriolis force, and (4) the morphodynamic model; which simulates the sediment transport rate and morphological changes in estuaries and coastal areas. The interconnections between the models are shown in
Figure 2.
In the wave action model, the multi-directional wave spectrum transmission equation was adopted, which calculates the statistical characteristics of irregular waves, such as significant wave height, average period, and average wave direction. Based on the characteristics of the wave energy balance equation, various wave deformation states were further described, including refraction, diffraction, shallowing, and wave breaking. Additionally, the model can faithfully reflect effects, such as run-up, overtopping, and energy dissipation, when waves pass through permeable and impermeable structures.
The tropical cyclone parametric wind model adopts the tropical cyclone parametric cyclonic hurricane wind model proposed by Holland [
35]. The model assumes that a typhoon is an ideal circular storm and estimates the atmospheric pressure and wind field along the line by setting parameters, such as atmospheric pressure, maximum wind speed, and maximum wind speed radius, at the center of the typhoon.
The current module is governed by the two-dimensional (2-D) depth, and shortwave˗averaged shallow water equations with wave forcing represented by the radiation stress to simulate currents, tides, storm surges, river inflows, the Coriolis force, and turbulence in coastal zones, tidal estuaries, and ocean waters. The wave model provides two options to calculate the wave radiation stresses for driving the flow module: one is the traditional wave stress formulations using the linear small-amplitude wave theory; another is the improved radiation stresses formulae derived from the non-sinusoidal wave assumption, which allows consideration for some dispersion effects of vertical-current structures (e.g., surface rollers or undertow currents) in the surf zone.
In the sediment transport submodel, empirical sediment transport models were used to calculate the sediment transport rates of bed materials and the suspended sediment under the conditions of combined waves and currents. For morphodynamic process modeling in an estuary with a strong impact from the river and coastal waves, such as the Tamsui River estuary, a unified sediment transport model was developed to estimate sediment fluxes from upstream rivers to estuaries and coasts to consider the sediment transport from the non-wave environment at a river to the wave-current coexisting area at an estuary and a wave-dominant coastal zone. Morphological changes are computed on the basis of the mass conservation of sediments, and the flows are simulated by iteratively updating the computed bed changes. Moreover, wetting and drying processes were modeled to simulate the inundation and retreat of tidal flows together with bed changes in an inter-tidal zone.
4. Situation Case Simulation Results and Discussion
In this study, the CCHE2D-Coast model is applied to investigate the influence of tides and waves on morphological changes in the Tamsui River estuary during flood and flushing-discharge operations of the reservoir. Numerical simulations of flows and sediment transport were performed to quantify the differences in morphological changes between monsoon and typhoon seasons. This model has been validated by comparing the simulated tidal levels and significant wave heights with those measured in the Tamsui River estuary during periods of the Fung-Wong, Sinlaku, and Jangmi typhoons in 2008. For a detailed discussion of the validation of the CCHE2D-Coast model and the related analysis of statistical errors, the readers can refer to our previous work [
33].
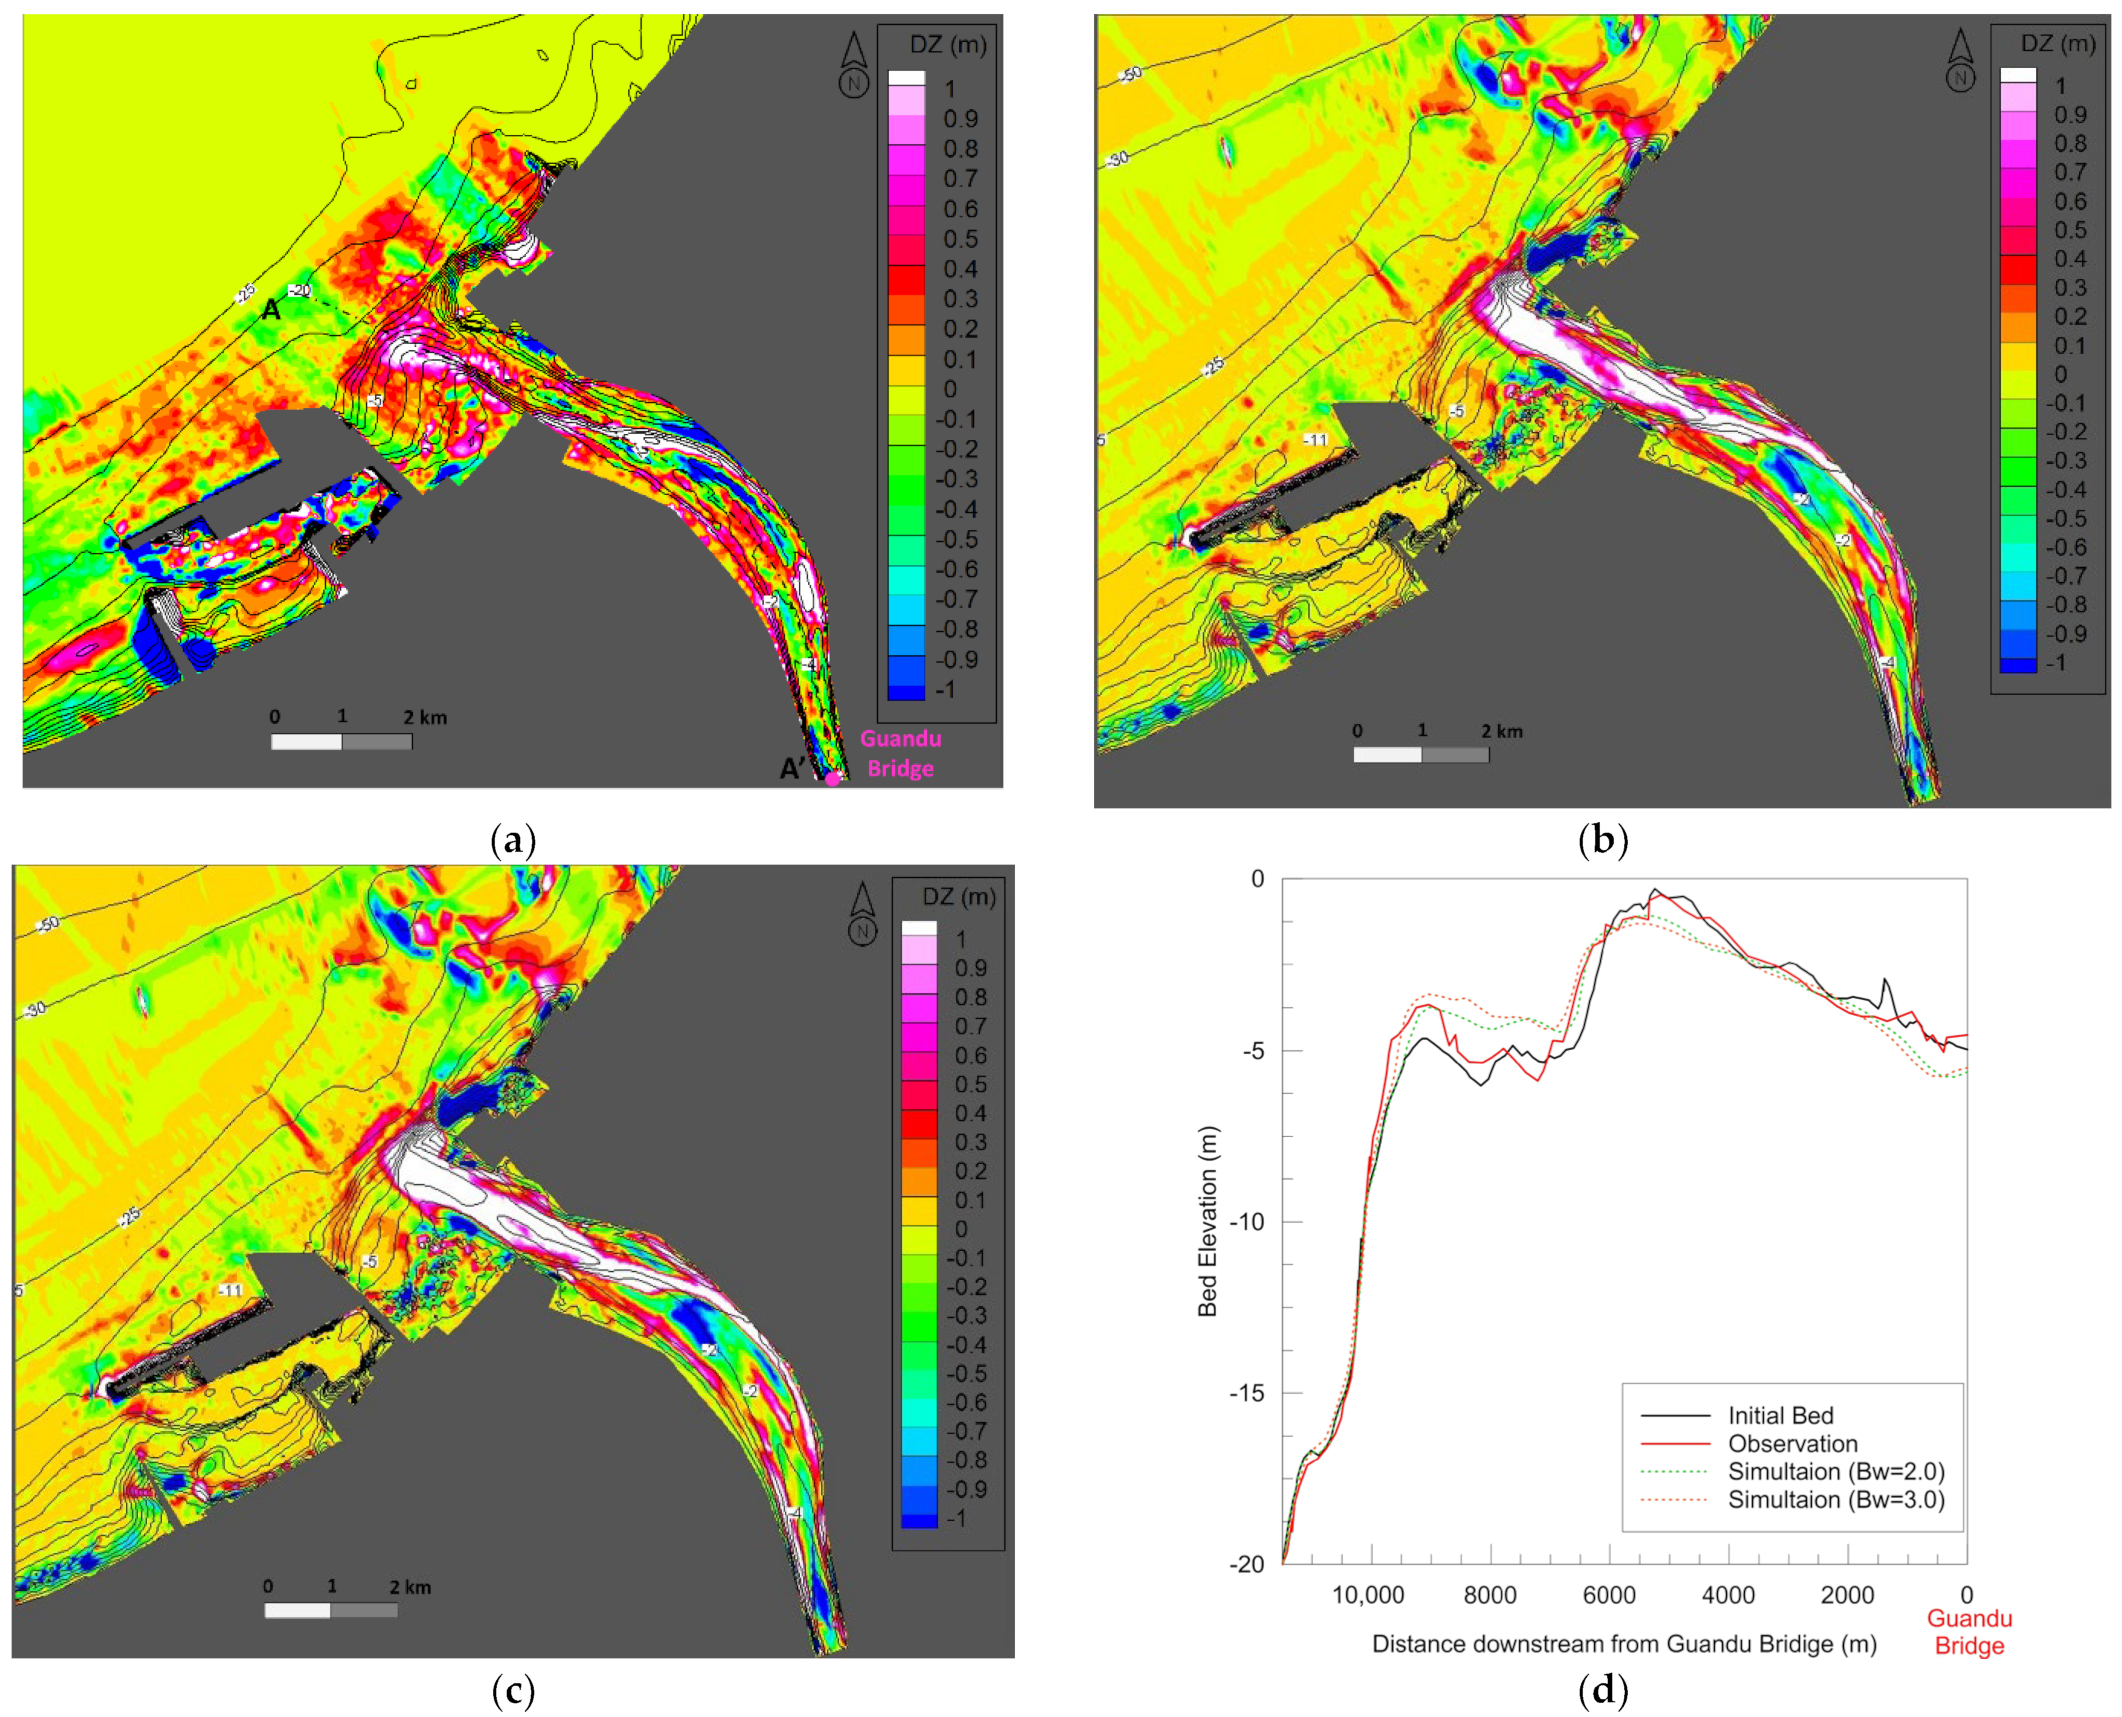
Furthermore, in order to better predict the morphological changes, this study refined the empirical coefficient of the Watanabe sediment transport model in CCHE2D-Coast [
38]. The coefficient BW, a non-dimensional coefficient of the wave-induced sediment transport rate formula by Watanabe (1986), is an empirical scaling parameter of sediment transport flux, which needs to be calibrated at the study site.
Figure 4a presents the measured topographic changes in the study area from May to November 2008; moreover,
Figure 4b,c show that the simulation results of BW was 2 and 3, respectively. It suggests that the numerical simulation results are similar to the measured topographic changes. There were significant siltation occurrences in the main deep channel between the Guandu Bridge and the estuary, as well as the isobaths from the estuary to −10 m, and the same scouring phenomenon also occurred at the center of the river.
Figure 4d depicts the longitudinal profiles of bed elevations along the transect through the middle of the river, from the Guandu Bridge to 1500 m of the outer sea of the estuary (dotted line A–A’ in
Figure 4a). It confirms that the simulation results with BW = 2 are closer to the measured topographic changes, so the situation simulation with BW = 2 will be carried out later. Additionally, the measured topography outside the North breakwater was eroded, and the simulation result was silting, possibly caused by artificial dredging. The right bank of the river mouth showed significant erosion in the simulation result, which was mainly due to coastal currents caused by tides and waves. However, due to the lack of relevant measured data, this study still assumed that the coast at this point was erosive. To conclude, CCHE2D-Coast can reproduce the morphological change behaviors at the Tamsui River estuary.
4.1. Influences of Downstream Tidal Level on Scouring and Silting of Estuary Bed
The rivers in Taiwan have the characteristics of short flow paths, steep slopes, high flow rates, and large differences in flow rates of wet and dry seasons. During a typhoon flood period, the mountain flank is washed by heavy rain, and the river bed is washed by high speed flow. The sediment supply capacity of the river increases sharply, and the estuary area is influenced by the interactions of ocean forces and high river flow. Consequently, the topography of the estuary and its adjacent coast change substantially in a short time. During a non-typhoon flood period, the river flow and sediment supply decrease considerably, and the sediment transport behavior derived from waves and tides induces the morphological changes in the estuary and adjacent coast. However, the tidal reach of the Tamsui River basin is very long, reaching as far as the Xinhai Bridge of the Dahan River (
Figure 1), and the downstream tidal level state during the typhoon flood period is bound to affect changes, such as bed erosion and deposition in the estuary. Therefore, this study takes Typhoon Aere of 2004 as a situational case and discusses the influences of the peak and trough of tidal levels on changes to bed erosion and deposition when the peak discharge reaches the estuary [
12].
Typhoon Aere of 2004 is the largest recorded typhoon flood event in the study area; it hit the study area at 2:00 on 23 August 2004. To maintain the safety of the Shihmen Reservoir, the management unit carried out flood and sediment discharge operations. At 5:00 on 25 August 2004, the maximum flood discharge of the Shihmen Reservoir was 8366 m
3/s, which was the flow between 50 and 100-year return periods. Notice the 50 and 100-year return flows at cross-section No. T075 were 7800 and 8400 m
3/s, respectively, and the cross-section No. T075 is located about 10.6 km downstream of the Shihmen Reservoir (
Figure 1). The total flood and sediment discharges of Typhoon Aere were 890.23 million m
3 and 7.01 million tons, respectively. Therefore, in this study, the scenario from 00:00 on 9 August 2004 to 00:00 on 23 August 2004 was considered here to serve as a starting scenario; the time steps of the flow field and wave field calculations were 30 and 7200 s, respectively. From 01:00 on 24 August to 00:00 on 27 August 2004, for the situational case (case 1), the time steps of the flow field and wave field calculations were 30 and 7200 s, respectively, and the time step of bottom bed calculation was 100 s. The model topographic data were measured in May 2013.
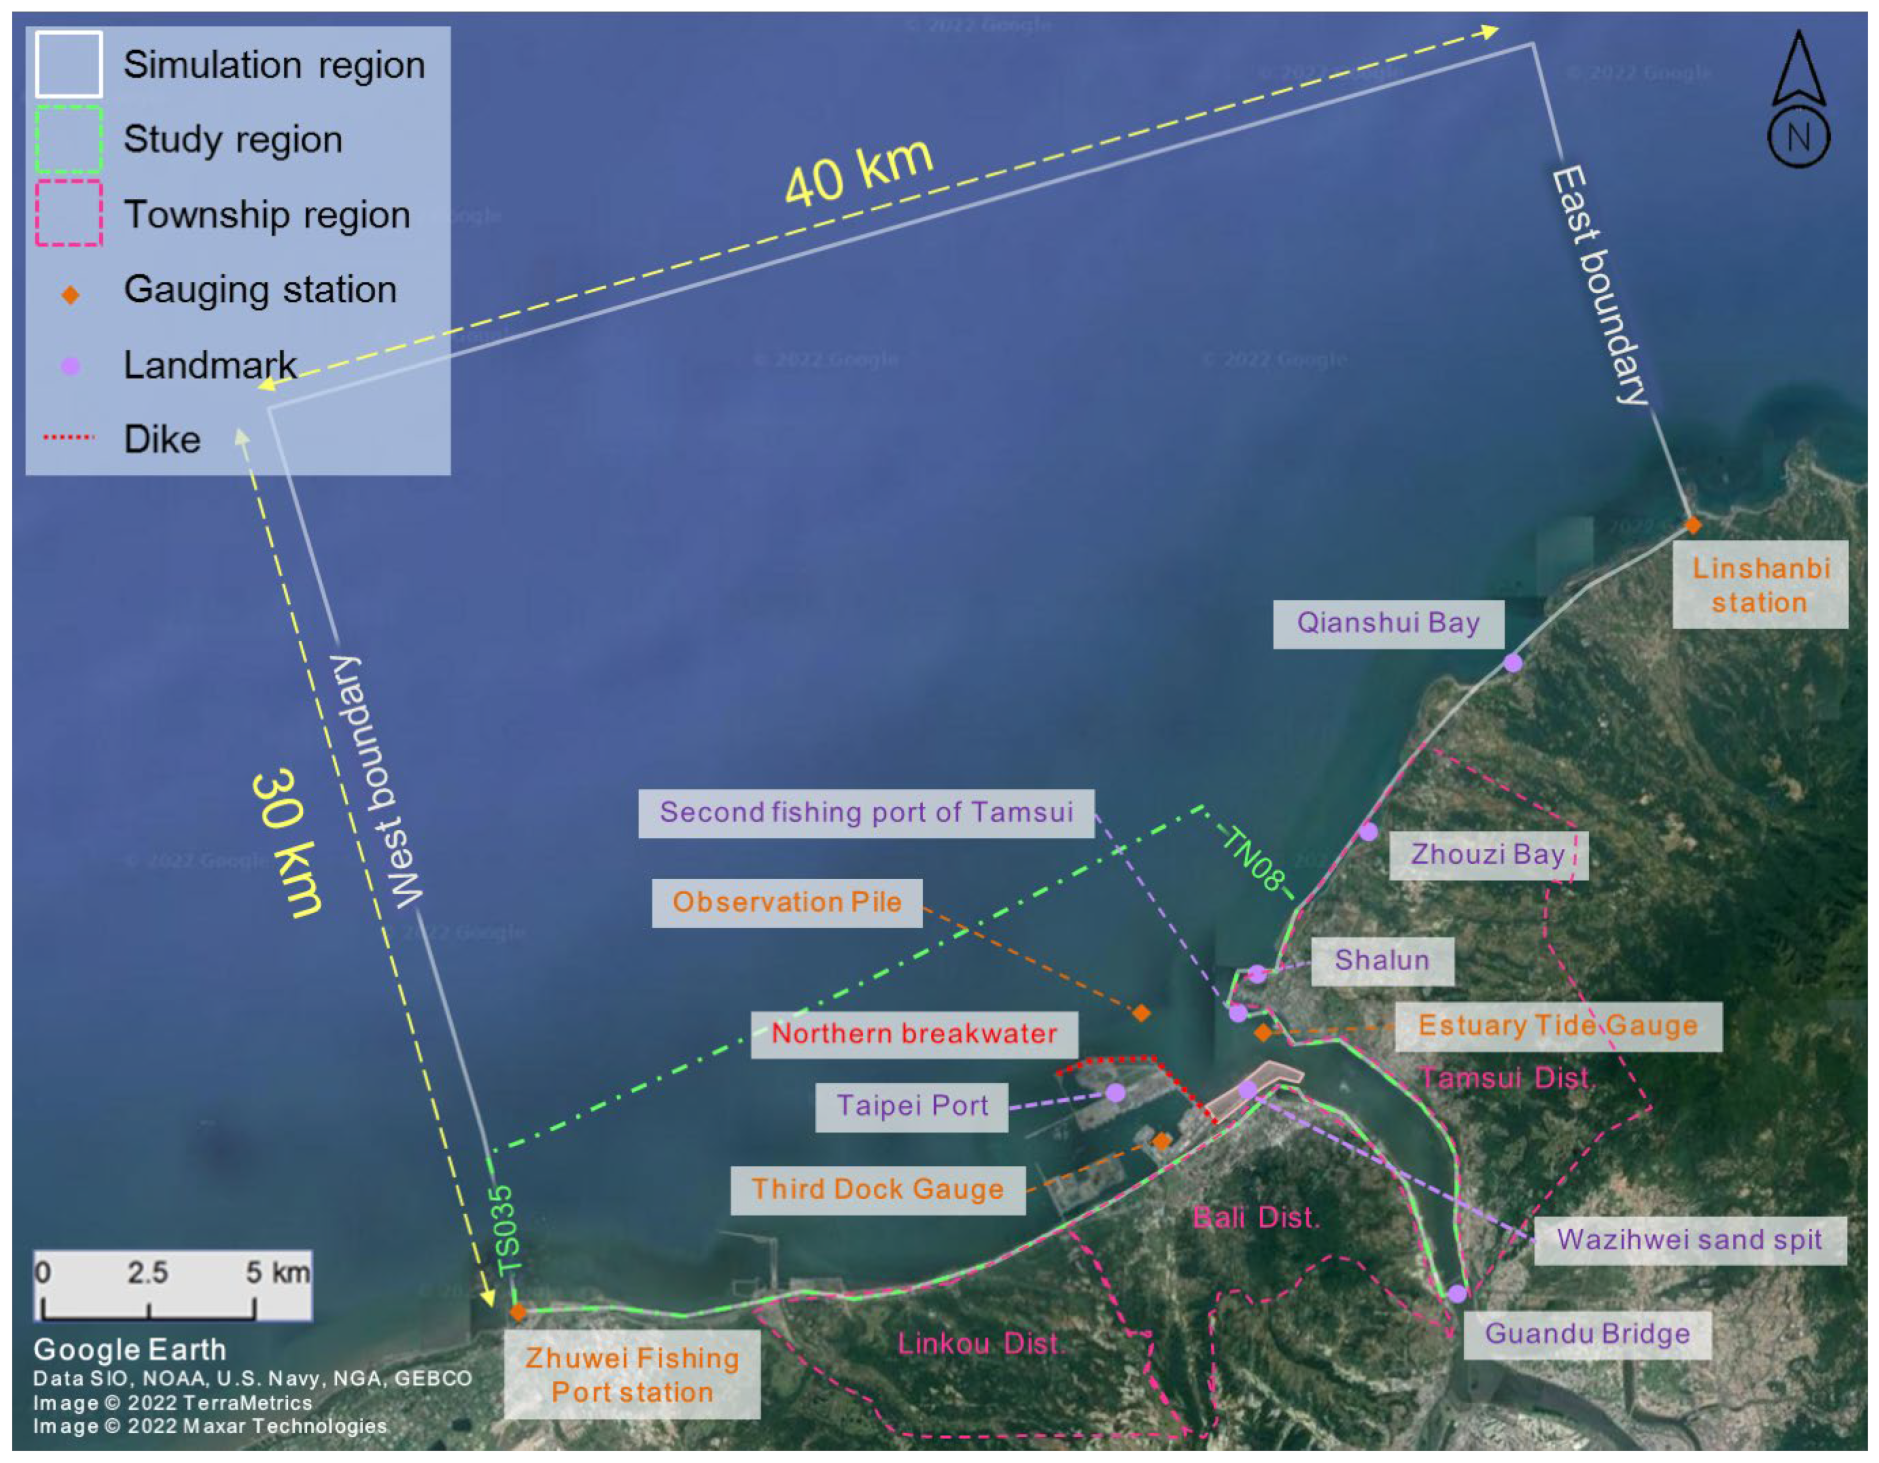
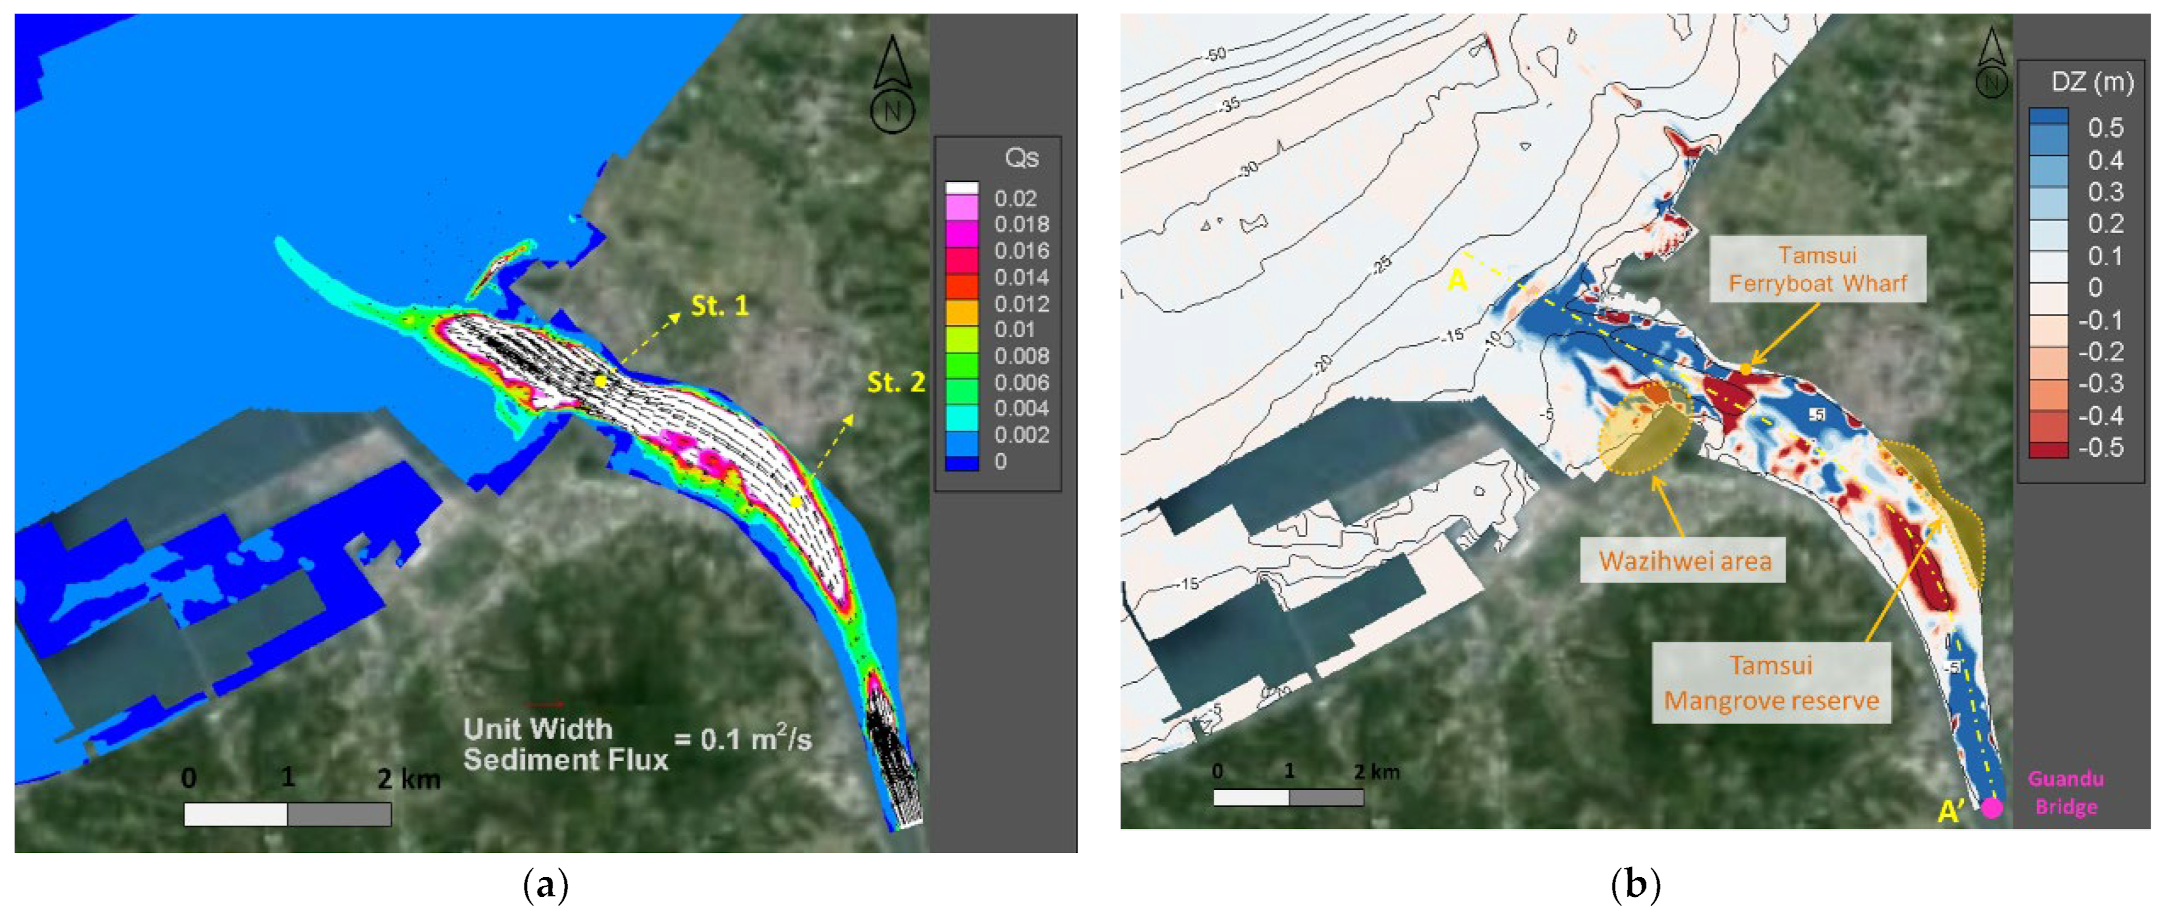
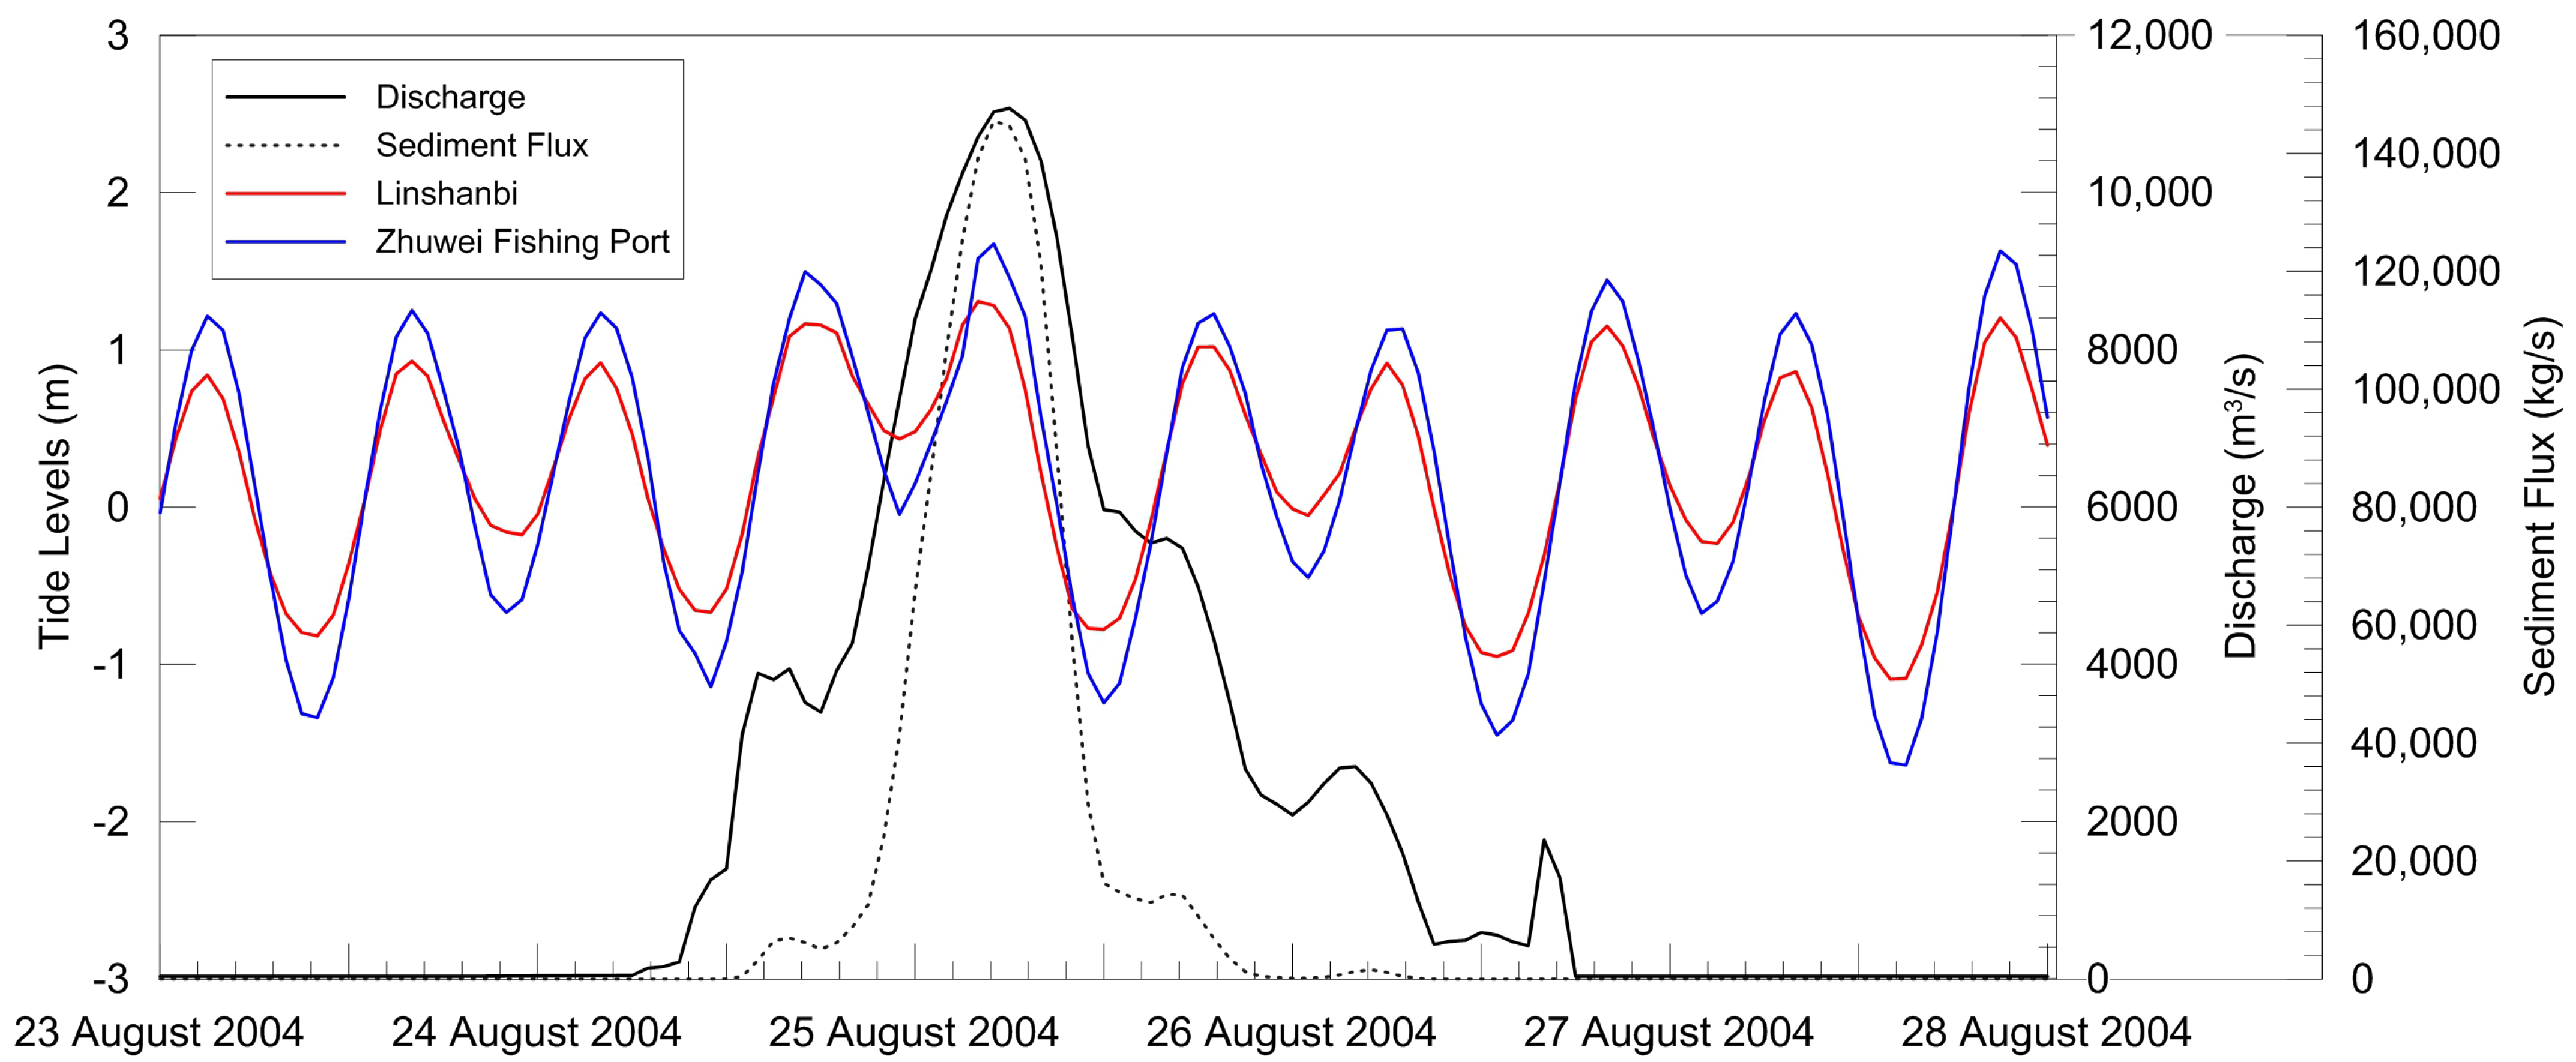
Figure 5 shows the time series of flow and sediment flux at the Guandu Bridge from 23 August to 29 August 2004, including tidal levels at Linshanbi and Zhuwei Fishing Port, which were used as boundary conditions at the river upstream and the tidal conditions on the two cross-shore boundaries. Influenced by flood and sediment discharges of the Shihmen Reservoir, the Guandu Bridge had a maximum flood discharge of 11,069 m
3/s at 12:00 on 25 August, when the sediment flux could reach 144,656 kg/s. Moreover, the peak discharge reached the downstream estuary; the downstream tidal level was the low tide level exactly. The sediment was carried to the estuary by the upstream flood, which could reach a water depth of −25 m. Sediment fluxes at the estuary and river channel could reach 0.11 and 0.05 m
3/s/m, respectively, as shown in
Figure 6a St. 1 and St. 2.
Figure 6b is the change chart of bed erosion and deposition after Typhoon Aere (case 1). The changes in river erosion and deposition were mostly influenced by the flood discharge of the Shihmen Reservoir and its flow path characteristics, and it was silted between the Guandu Bridge and 2500 downstream, with an average height of 2.6 m. The 2500–4000 m downstream of the Guandu Bridge (adjacent to the Tamsui mangrove reserve) was the main erosion section, and the river channel had been scoured down by an average of 1 m. From the Tamsui Ferryboat Wharf to 1500 m upstream and affected by the widening of the river width, the flow velocity gradually decreased, and the average aggradation height was approximately 1.0 m. The Tamsui Ferryboat Wharf was affected by the narrowing of the river and deep channels, and the average brushing depth in this area could reach −2.0 m. The average aggradation height was 1.3 m from the Tamsui River estuary to 2500 m out to sea.
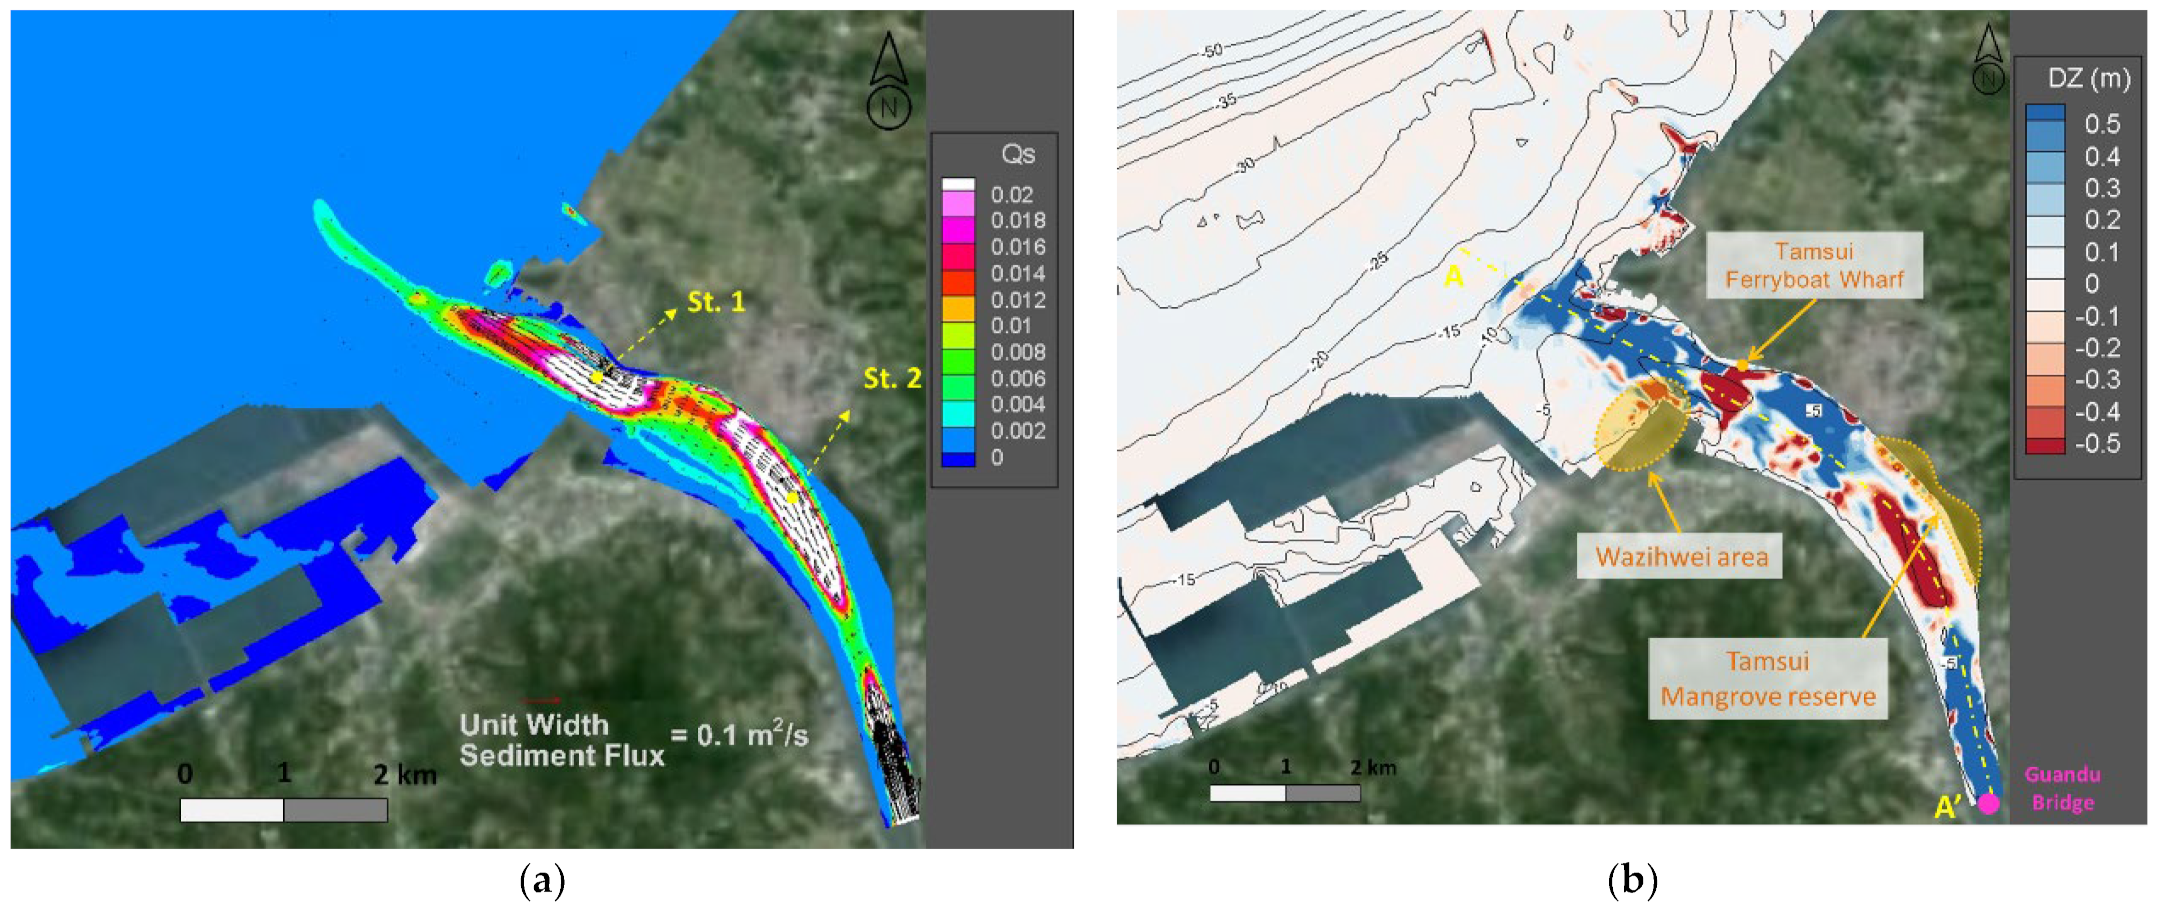
To further clarify the influences of downstream tidal levels on bed scouring and silting, this study adjusted the time points of flood discharge and discharges of the Shihmen Reservoir. Consequently, when the peak discharge reached the downstream estuary, the downstream tidal level was just the high tide level (06:00 on 25 August), and it was defined as case 2 (
Figure 7).
Figure 8a shows the distribution map of sediment flux at the flood peak. Influenced by the downstream tidal level, sediment flux at the estuary (St. 1) decreased to 0.04 m
3/s/m, while sediment flux at the river channel (St. 2) increased to 0.06 m
3/s/m. However, silt can still be transported to a water depth of −25 m due to the heavy flood of the river.
Figure 8b is the change chart of bed erosion and deposition after Typhoon Aere (case 2). It was confirmed that the area of sediment deposition slightly expanded from Tamsui Wharf to 1500 m upstream, and the average deposition height increased to 1.2 m. The sediment silting area was slightly reduced from the Tamsui River estuary to 2500 m out to sea, while the average aggradation height was reduced to 1.1 m.
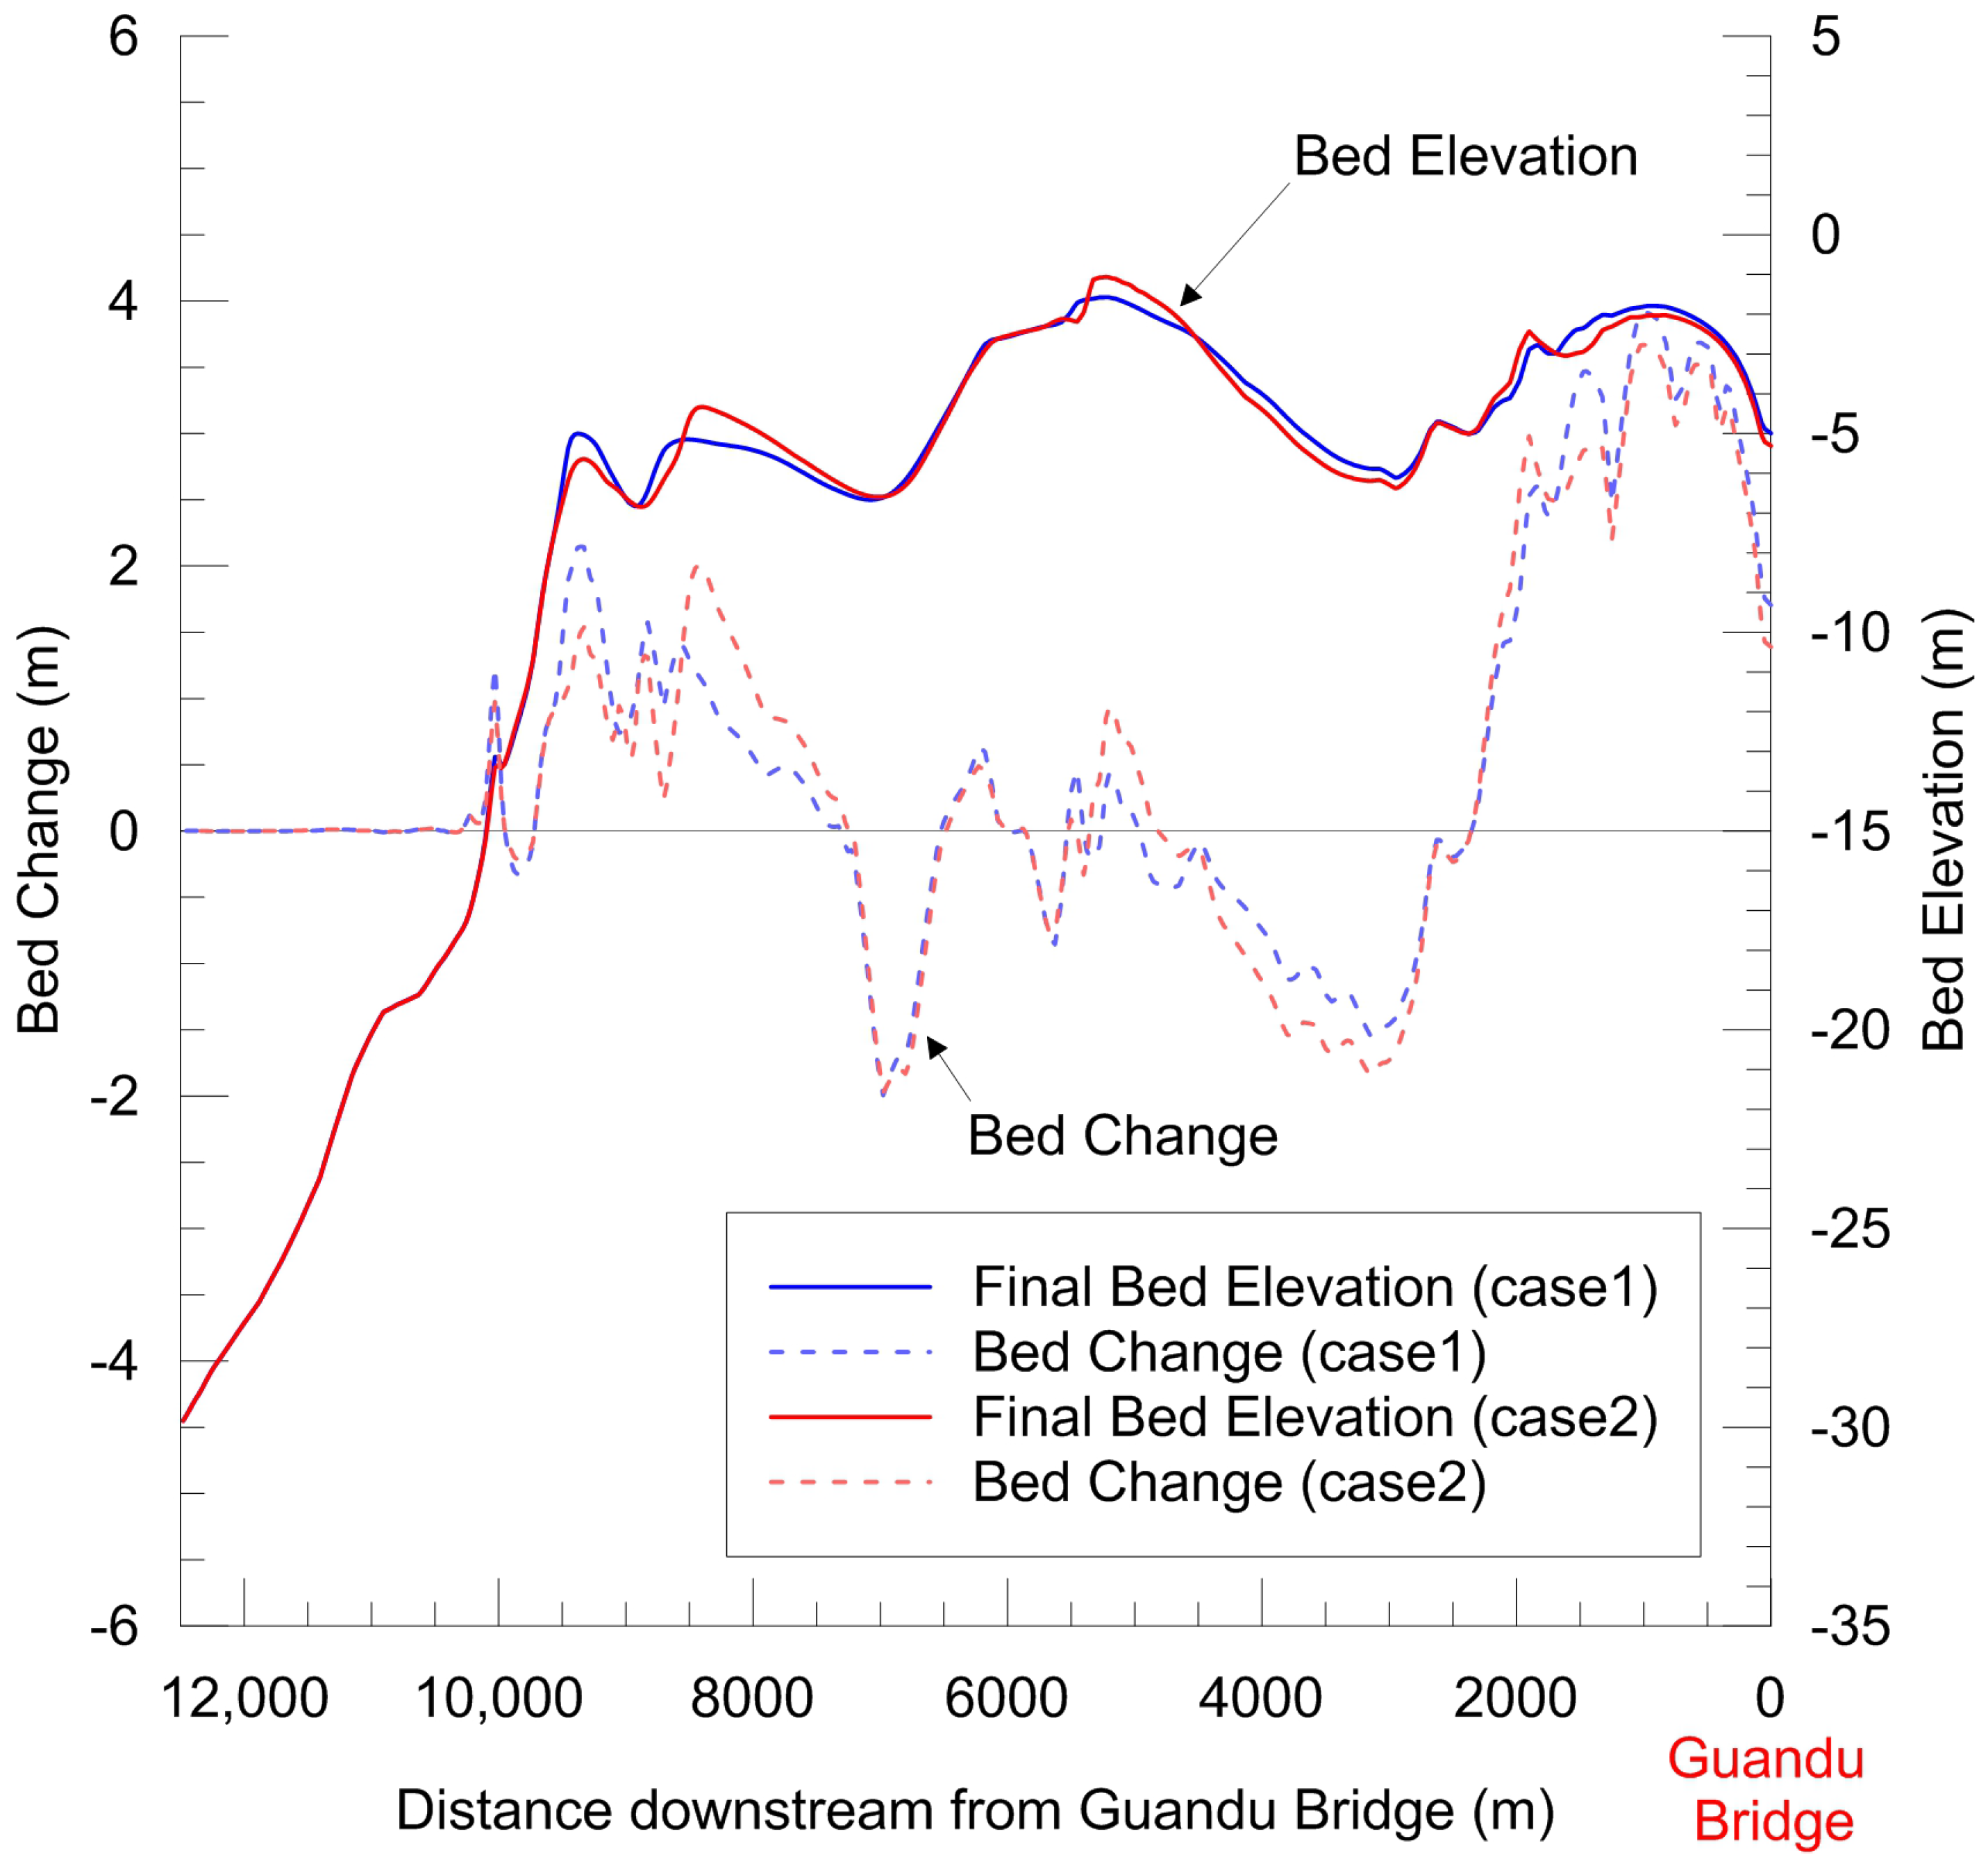
Figure 9 depicts the longitudinal profiles of accumulative bed changes and bed elevations along the transect through the middle of the river, from the Guandu Bridge to 2500 m out to sea from the estuary (dotted line A–A’ in
Figure 6b). It is confirmed that the downstream tidal level had a great influence on the scouring and silting of the bottom bed at 700–1700, 2800–5400, and 7200–9600 m downstream of the Guandu Bridge, and there was no significant difference in other locations.
4.2. Influences of Typhoon Flood Period and Monsoon Season on Scouring and Silting of the Estuary Bed
An estuary is the intersection of river, coast, and ocean, and its flow field is mainly controlled by physical processes, such as river runoff, waves, tidal current, estuary topography, and salinity. When river sediment is transported to the estuary, it is affected by the transport effect of tidal or coastal currents, and longshore drift is formed. If the river sediment supply is greater than the sediment transport capacity of waves and tidal currents, it is easy to form morphological elements on the estuary, such as a riparian delta, sandspit, and accumulative coast. If the sediment supply is less than the sediment transport capacity of waves and tidal currents, the shorelines will retreat, forming an eroded coast.
Marine sediment drift and morphological changes at the Tamsui River estuary are affected by northeast monsoons in winter, southwest monsoons in summer, and 2–3 annual typhoon flood events.To further investigate the influences of long-term monsoon seasons and typhoon flood bed scouring and silting, this study used the long-term monitoring data for wave, wind, and tides to simulate. We assumed that a typical one-year morphological change on the Tamsui River estuary is composed of the three-month monsoon season and three typhoon flood events.
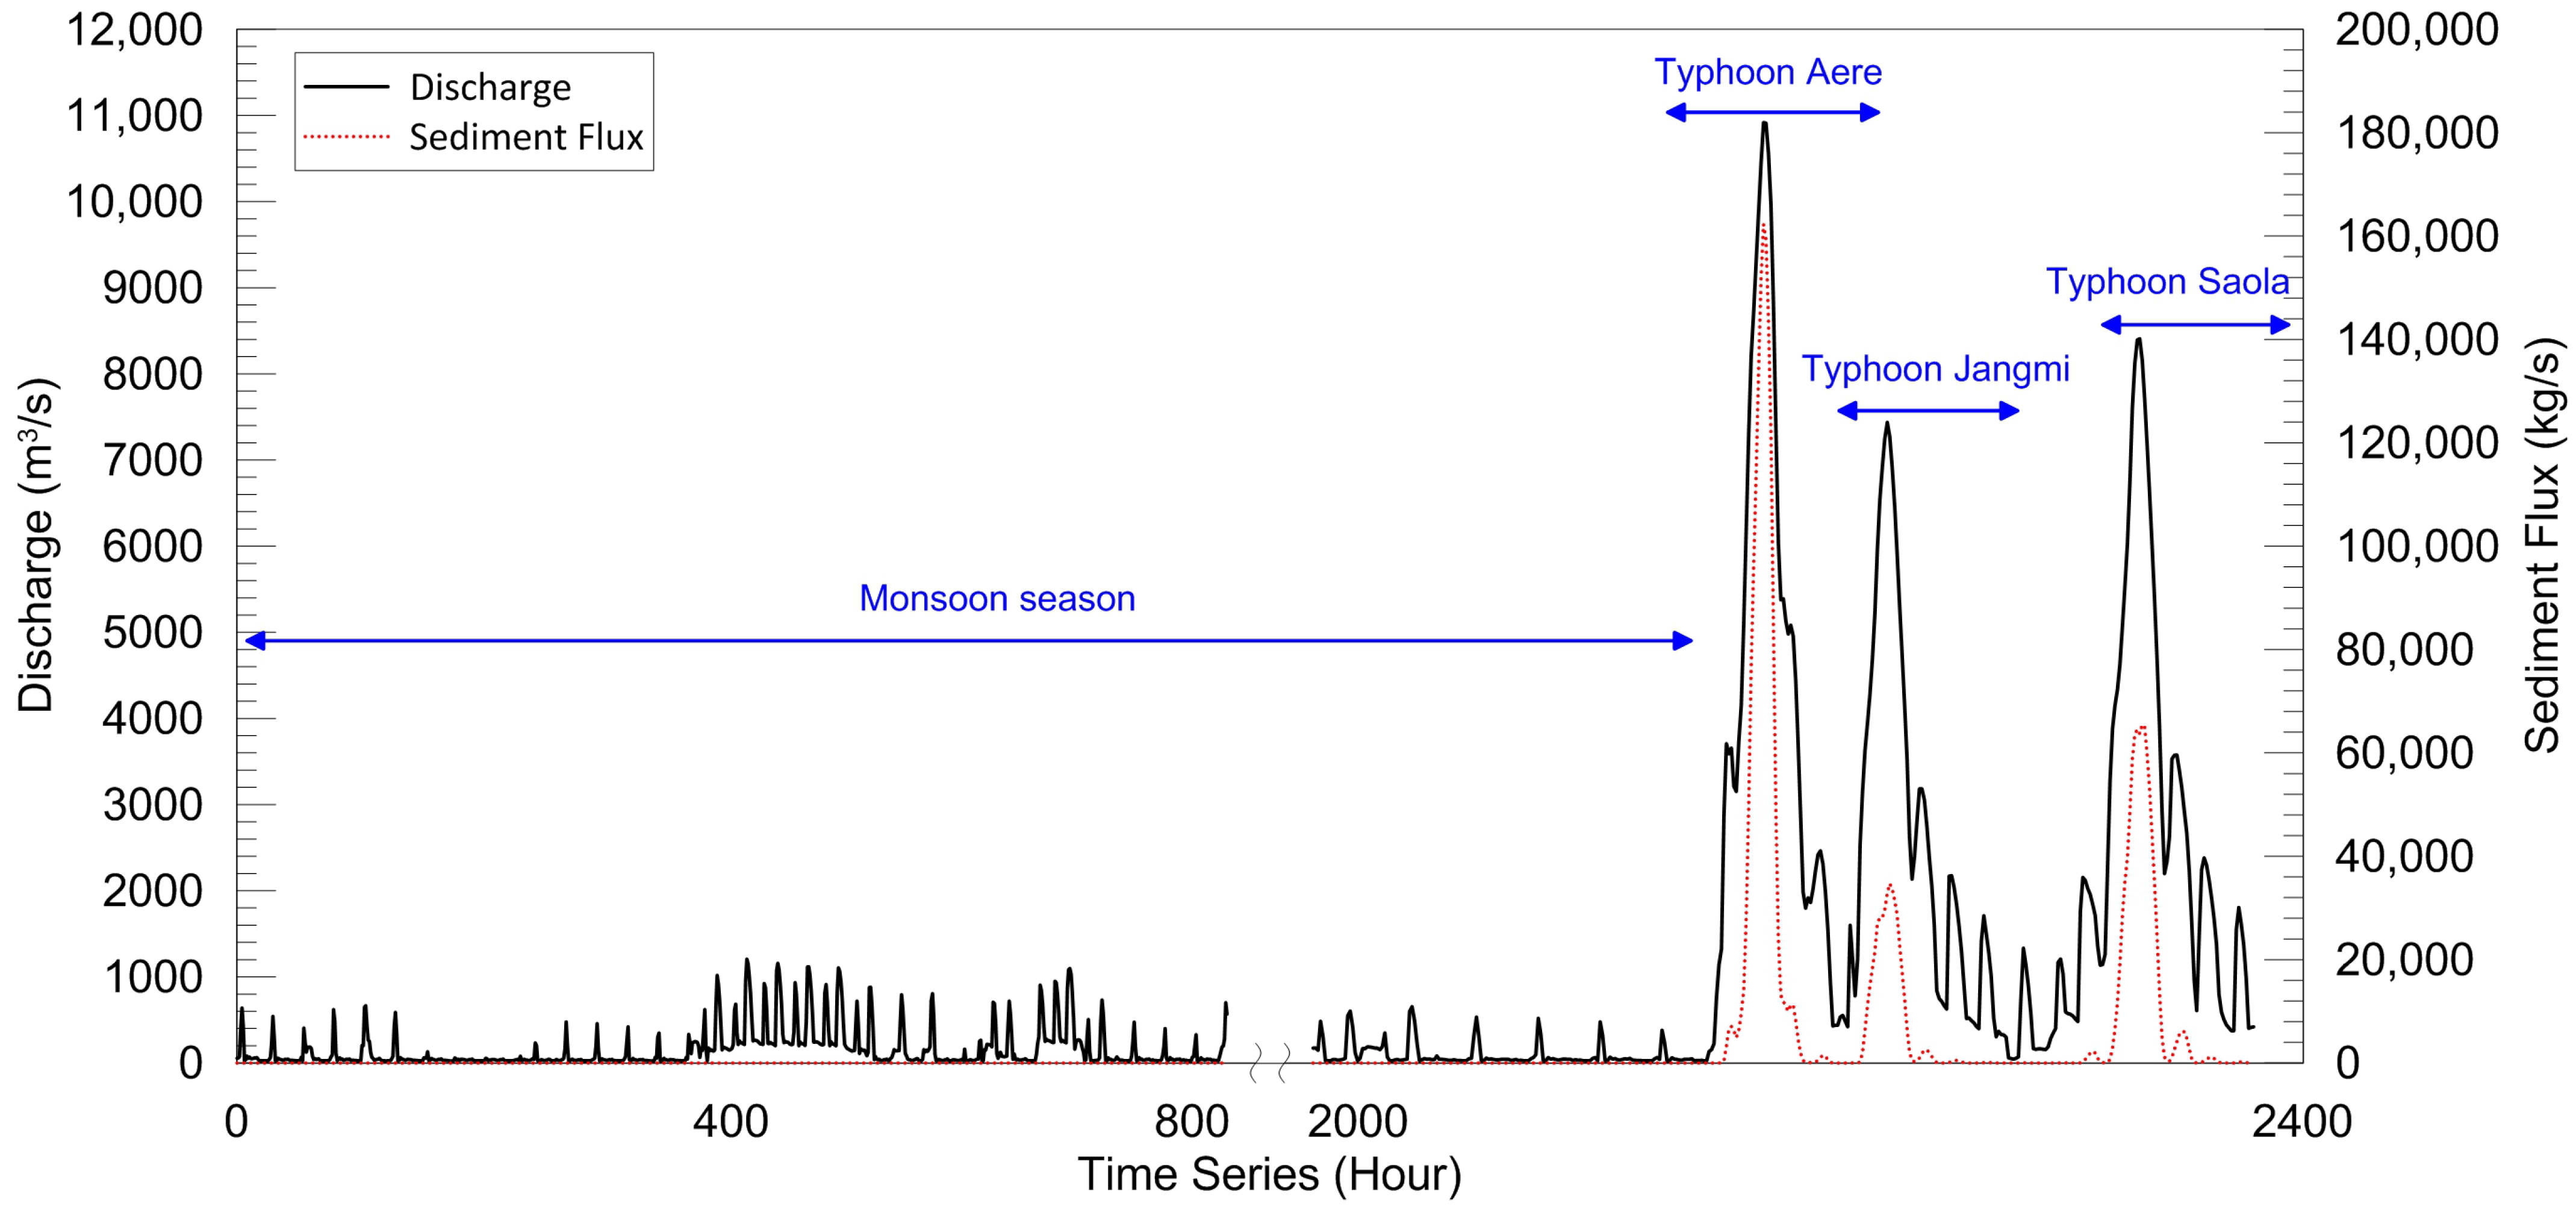
Figure 10 shows the synthetic time series (hydrographs) of flow and sediment flux at the Guandu Bridge as a combination of monsoon and typhoons.
Table 1 shows the start and end time of each event. The simulation time of the monsoon season was from 1 December 2009 to 28 February 2010. The typhoon flood events were Typhoon Aere in 2004, Typhoon Jangmi in 2008, and Typhoon Saola in 2012. The peak discharge of each typhoon event was 11,069, 7438 and 8407 m
3/s, respectively. Moreover, we simulation was repeated four times to explore the change in behavior of bed erosion and deposition in the Tamsui River estuary area over four years. The calculation time step of flow field was 40 s, the calculation time steps of wave field in monsoon and typhoon seasons were 10,800 and 7200 s, respectively, and the calculation time step of the bottom bed was 100 s.
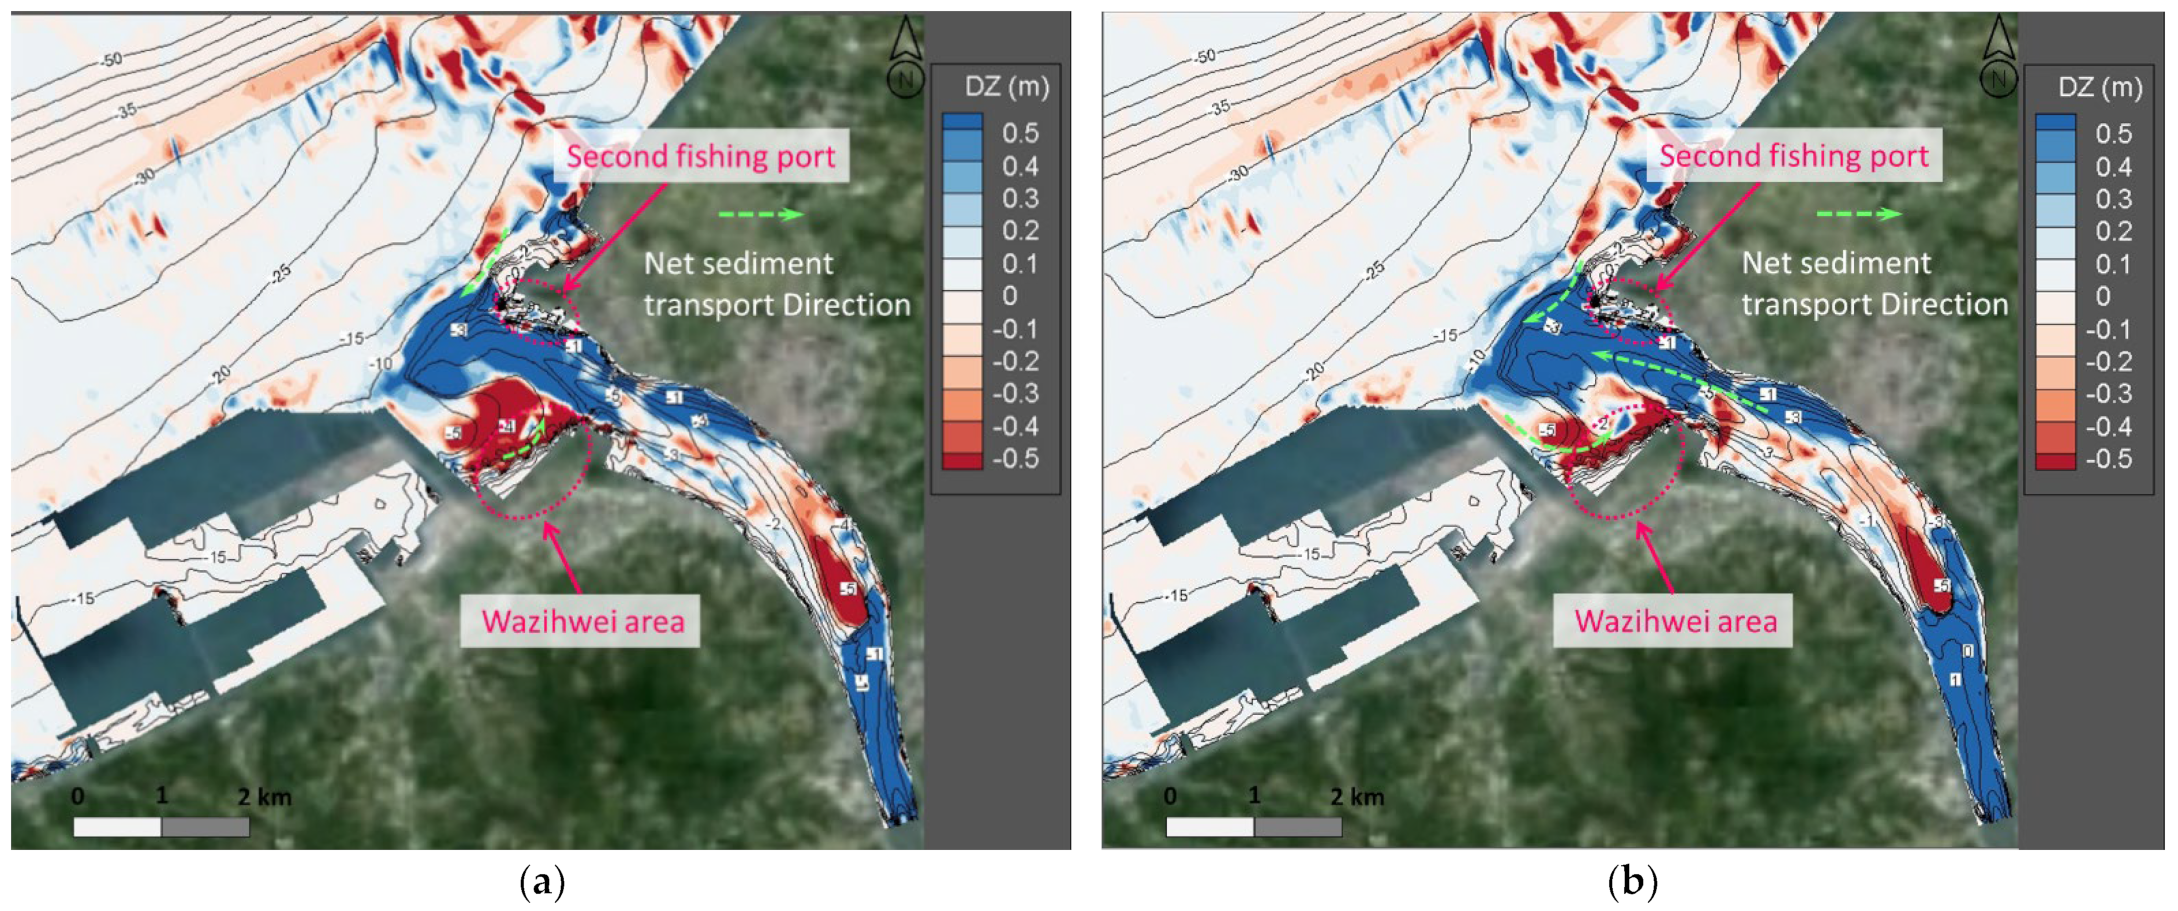
Figure 11a shows the simulation results of bed changes from the initial time (
t = 0 h) to the end of the first year’s monsoon season (
t = 2160 h), which are induced only by the monsoon of the first year. Because of the small runoff and weak sediment supply capacity of rivers during the monsoon season (
Figure 10), the morphological changes at the estuary are dominated by nearshore drift sediments. Influenced by the northeast monsoon, the marine drift sediment will form a northeast-southwest belt of silt outside the second fishing port, and influenced by the tide; the silt will gradually move into the second fishing port. Moreover, when the current flows through the North breakwater of Taipei port, it will be blocked by the dike, and a backflow will be generated, which will carry the sediment at the Wazihwei spit mouth of the excavator to the left bank of the estuary.
Figure 11b shows the simulation bed changes after the simulations went through the entire first-year hydrographs, as shown in
Figure 10, including the first year’s monsoon season and three typhoon events. Influenced by flood and sediment discharges of the Shihmen Reservoir during Typhoons Aere, Jangmi, and Saola, large amounts of floods washed away the river sediment, and the 2500–4000 m downstream of the Guandu Bridge was a concave bank with fast velocity, which was the main erosion area. At 6000–7000 m, it was influenced by the morphology of the bottom bed and was also eroded. However, the Guandu Bridge to 2500 m downstream and the estuary to 2500 m out to sea (7500–10,000 m downstream of the Guandu Bridge) were the main silting areas. The sediment in the outer sea was affected by sea currents, and part of the sediment was carried by the coastal current and diffused to the Wazihwei sandy ground.
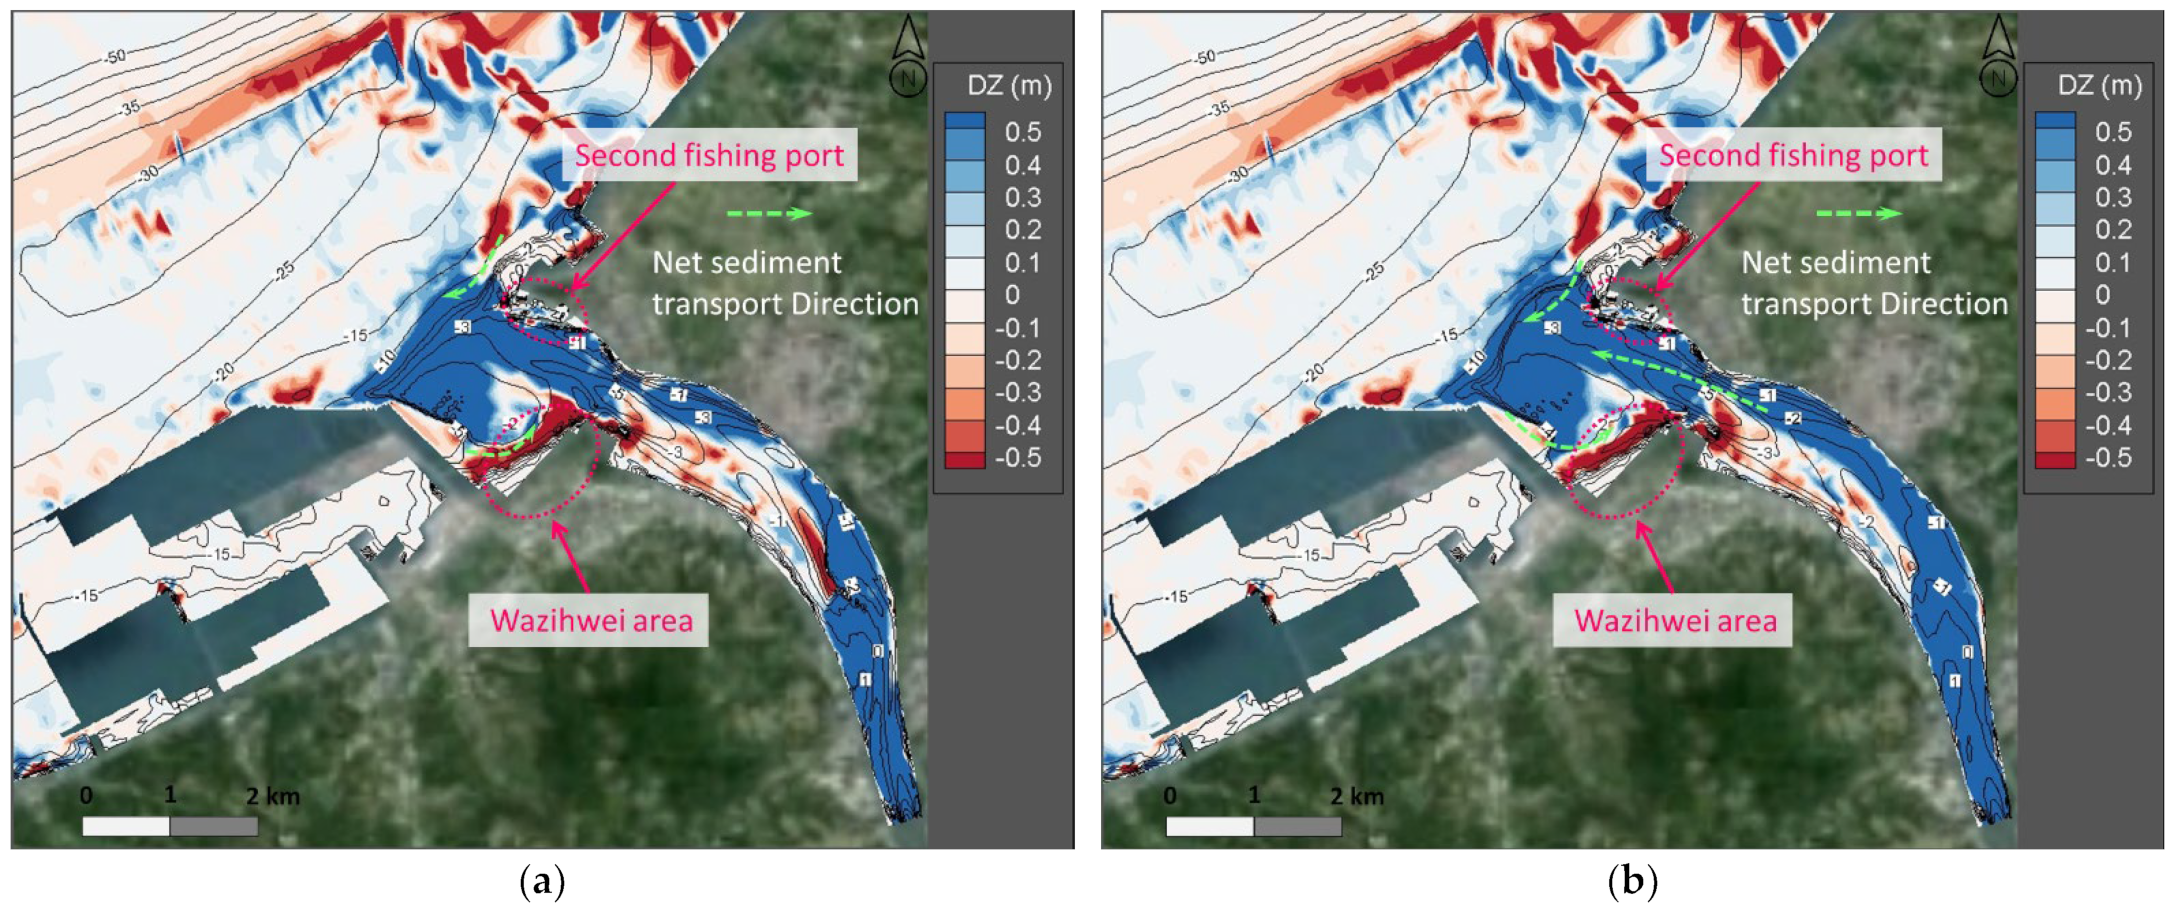
Figure 12a shows the simulation results of bed changes at the end of the second year’s monsoon season. It can be found that tides and coastal currents were still the main forces influencing the morphological changes in the estuary, and the sediment transport along the coast was southwest. However, the backflow at the estuary continuously carried the sediment at the Wazihwei spit to the left bank of the estuary. When the monsoon season and typhoon flood period in the second year were over, it was confirmed that the amount of sediment brought by the typhoon flood event was largely deposited in the estuary area, while the Wazihwei spit was recharged by the sediment from the river channel, with slight back siltation, but its overall change trend remains erosion (
Figure 12b). Eventually, at the end of the fourth monsoon season (
Figure 13a), the siltation height at the second fishing port of the Tamsui River possibly reached approximately 1.0 m. The silted sediments were all over the estuary area, and only places near the North breakwater and Wazihwei spit remained eroded. At the end of the fourth year’s monsoon and typhoons (
Figure 13b), it was confirmed that the main erosion areas were the Wazihwei spit, the left bank of the outlet of the Tamsui River, and the outer side of the North breakwater. The siltation phenomenon began to appear at a corner of the North breakwater after the fourth year of monsoons.
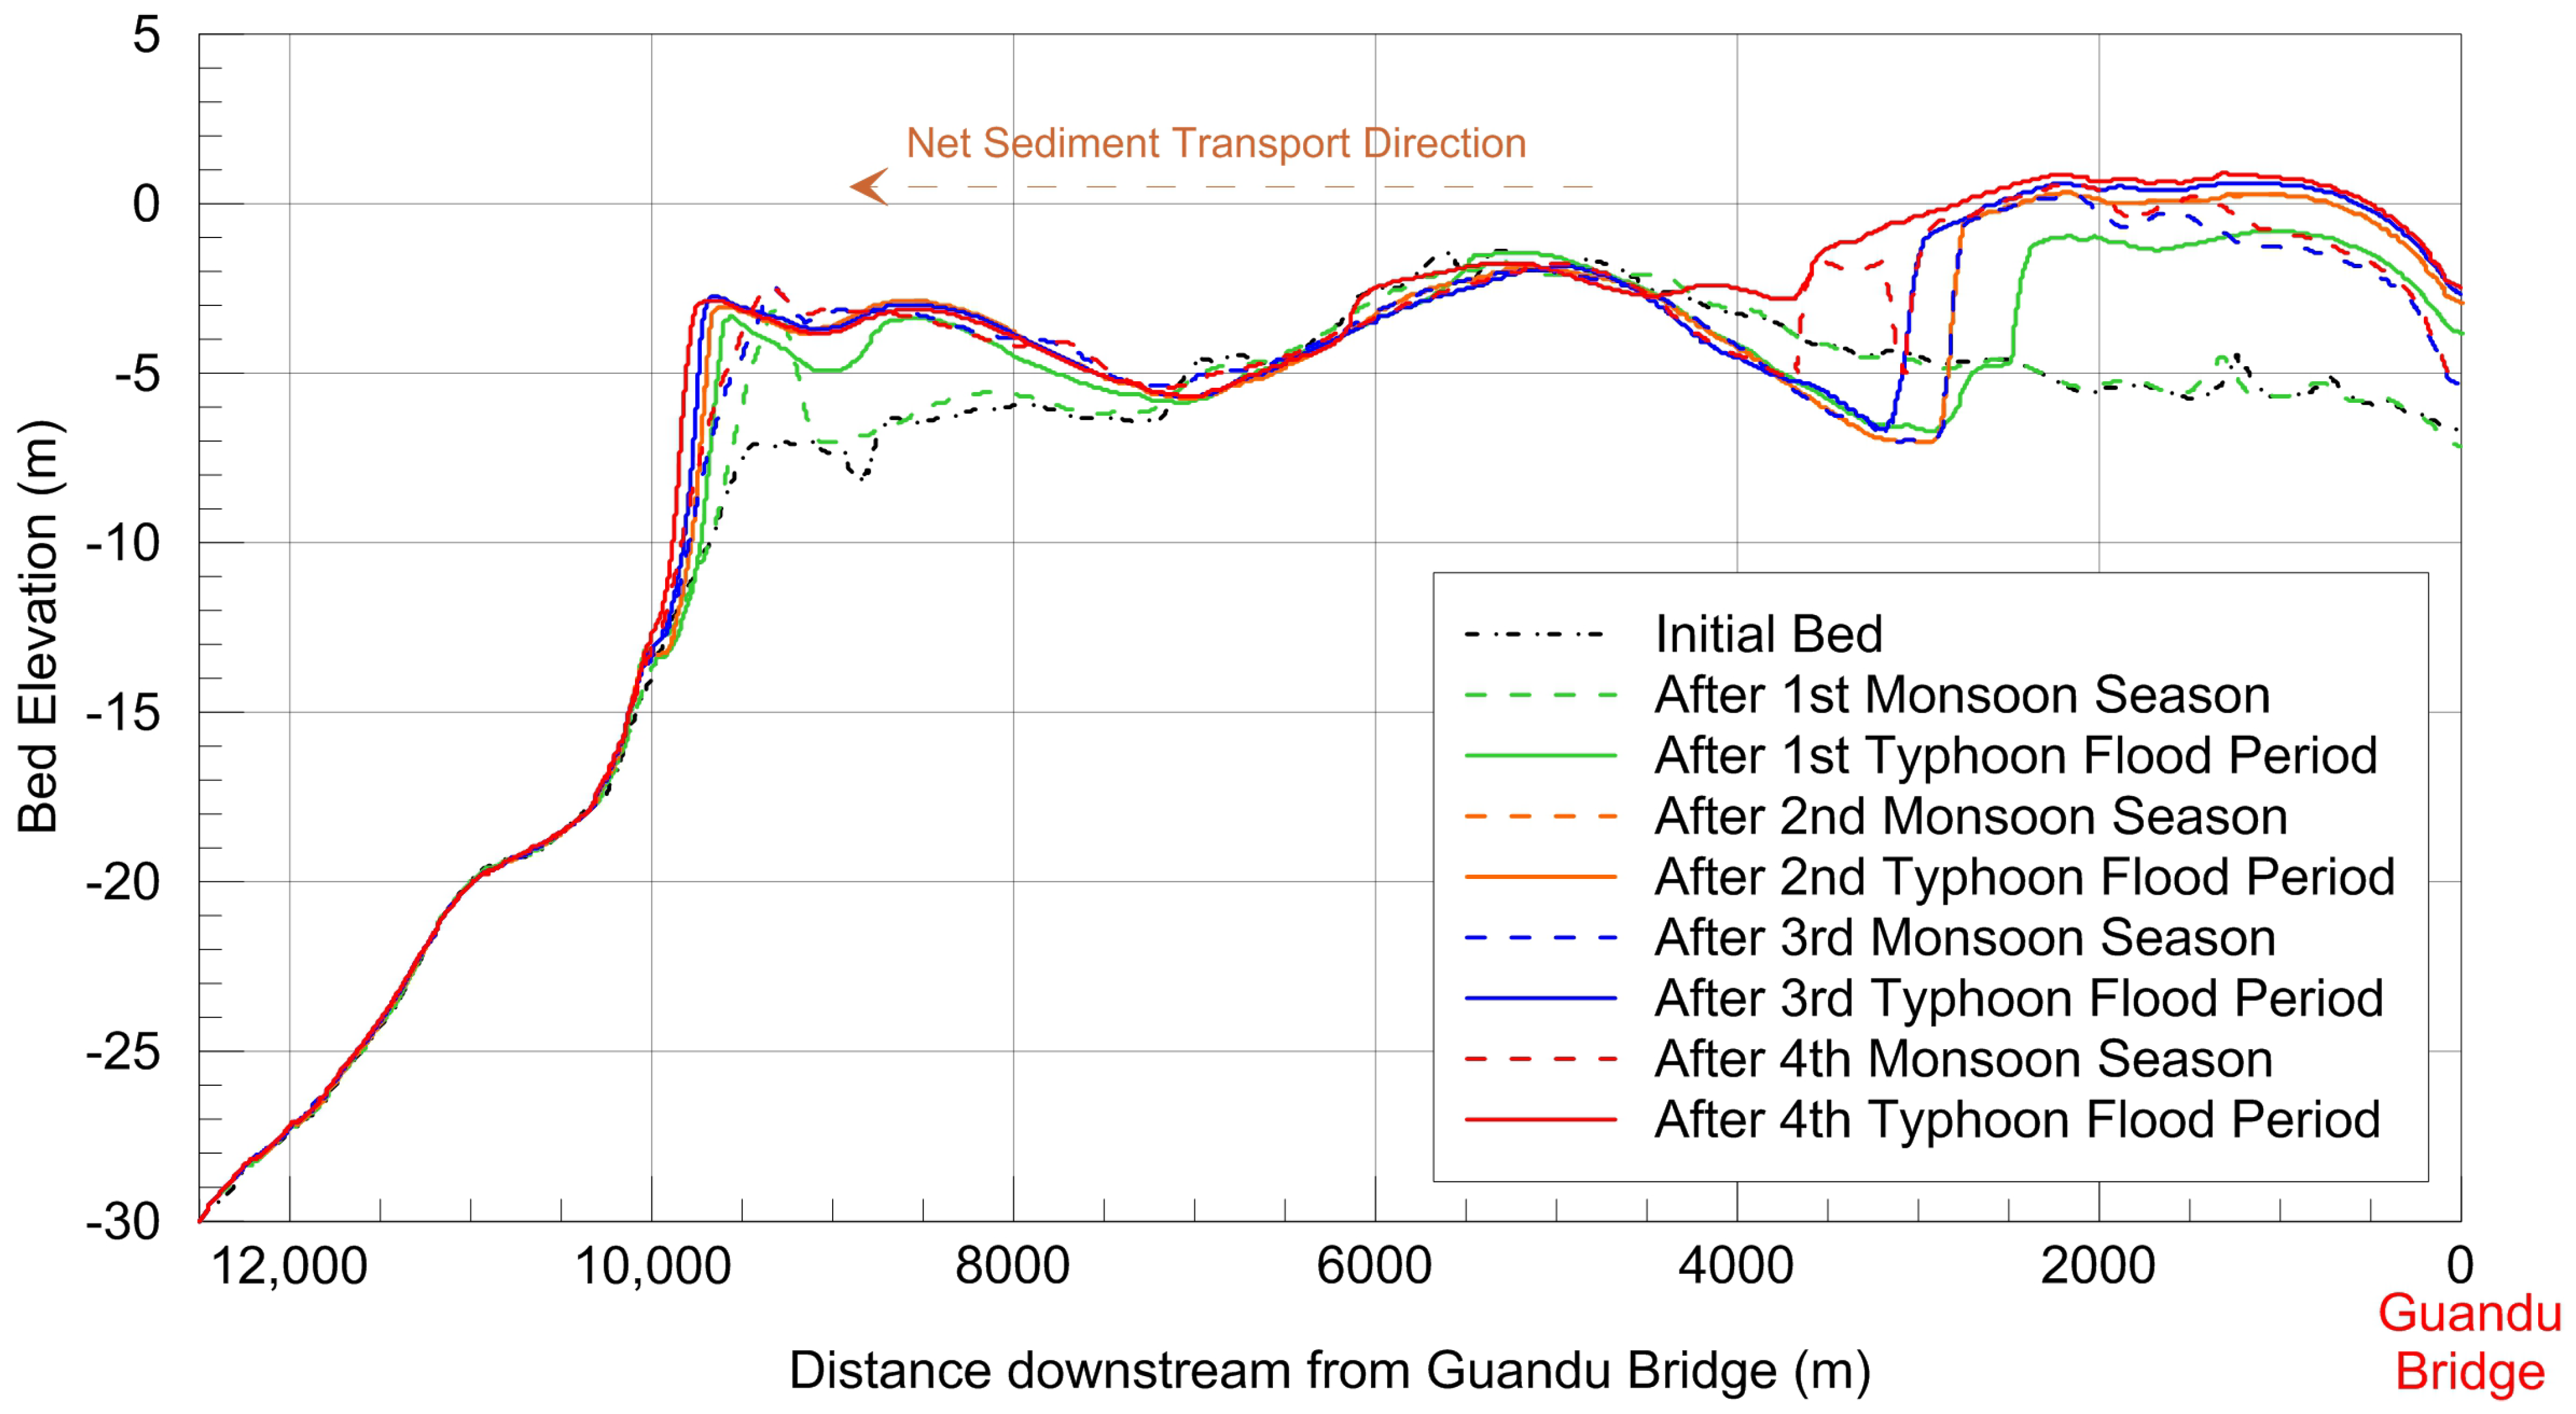
Figure 14 depicts the longitudinal profiles of bed elevations along the transect through the middle of the river, from the Guandu Bridge to 2500 m out to sea from the estuary (dotted line A–A’ in
Figure 11a). It was confirmed that the main influence range was located at 8500–9500 m downstream of the Guandu Bridge during the monsoon season, while the silted sediment in this area was disturbed by the river flood and moved out to sea (approximately 9500–10,000 m downstream of the Guandu Bridge). During the typhoon flood period, the river flood would erode the riverbed at 2500–7000 m downstream of the Guandu Bridge, among which there was a relatively substantial erosion occurrence at 2500–4500 m, and the range of sediment deposition was located at 2100 m and 7000–10,000 m downstream of the Guandu Bridge.
5. Conclusions and Suggestions
To investigate the influences of hydrodynamic forcing, such as tides, waves, and river discharge, on sediment flushing and morphological changes in the Tamsui River estuary, the study employed a validated CCHE2D-Coast model [
33]. This model has been validated by simulating flow and sediment transport in the Tamsui River estuary during the periods of multiple typhoons, such as Fung-Wong, Sinlaku, and Jangmi in 2008. This site-specifically validated coastal and estuarine processes model can reproduce the complex flow fields and sediment migration behaviors of the Tamsui River estuary, such as the erosion and siltation processes of estuaries, rivers and shoals, and the overflow phenomenon along the coast.
Using this model, this study simulated the sediment transport and morphological changes in the estuary due to sediment flushing at the upstream reservoir. The synthetic hydrodynamic conditions for the simulations include historical events such as a three-month-long monsoon from December 2009 to February 2010 and three typhoons (Aere in 2004, Jangmi in 2008, and Saola in 2012). Meanwhile, Typhoon Aere (2004) represents the strongest storm event in the region.
Analyses of the simulation results reveal that when the peak discharge of the river flood flow reaches the estuary section at ebb tides; more sediment can be transported to the open sea than that at flood tides. The location of the maximum deposition height is predicted to be 9400 m downstream of the Guandu Bridge. However, when the peak discharge reaches the estuary section at high tidal levels, owing to flood tide currents against river flow, the amount of silt transported to the open sea will decrease. For this case, the maximum deposition height occurs at 8400 m downstream of the Guandu Bridge. The amount of siltation increases significantly at 7200–8500 and 4800–5300 m downstream of the Guandu Bridge. Additionally, owing to the influences of the northeast monsoon, there would be significant zonal siltation at the exit of the second fishing port of the Tamsui River (8500–9500 m downstream of the Guandu Bridge). At the beginning of the typhoon flood season, a large flood amount caused by heavy rain moves the silted sediment to the outer sea (approximately 9500–10,000 m downstream of the Guandu Bridge). The Wazihwei spit would be influenced by backflow during the monsoon season; the sediments are taken to the freshwater channel, the shoal gradually retreats, and it will be recharged by sediment from the channel during the typhoon flood season, with slight back siltation.
The Shihmen Reservoir in the upper reaches of the Tamsui River is affected by the reservoir sediment, and its storage capacity will be gradually decreasing. In recent years, relevant sediment discharge facilities have been completed, and the sediment supply of the Tamsui River will experience more changes in the future. Because the tidal level of the Tamsui River estuary belongs to the semi-diurnal tide, adjusting the operation timing of flood and sediment discharges of the Shihmen Reservoir can further reduce the amount of sediment deposition outside the river channel and the second fishing port of Tamsui, under the influence of flood control safety. In addition, as the Wazihwei spit is a nature reserve, it is also possible to continuously manage sediment using numerical models in the future to maintain the shoal area.
By using the site-specifically validated coastal model CCHE2D-Coast, this study quantifies the dynamic behavior of morphology in seasons of monsoon and typhoons in the Tamsui River estuary. The validated model and simulated results are conducive to managing the sediment transport and reservoir flushing driven by waves, tides and river runoffs and stabilizing the Tamsui River Estuary and the adjacent coasts.


