Article

Climatic and Hydrological Factors Affecting the Assessment of Flood Hazards and Resilience Using Modified UNDRR Indicators: Ayutthaya, Thailand

by
Phichet Munpa
1,
Suthirat Kittipongvises
2,*,
Athit Phetrak
3,
Wandee Sirichokchatchawan
4,
Nutta Taneepanichskul
4,
Jenyuk Lohwacharin
5,6 and
Chongrak Polprasert
7
1
Environment Development and Sustainability (EDS) Program, Graduate School, Chulalongkorn University, Bangkok 10330, Thailand
2
Environmental Research Institute, Chulalongkorn University, Bangkok 10330, Thailand
3
Department of Social and Environmental Medicine, Faculty of Tropical Medicine, Mahidol University, Bangkok 10400, Thailand
4
College of Public Health Sciences, Chulalongkorn University (CPHS), Bangkok 10330, Thailand
5
Department of Environmental Engineering, Faculty of Engineering, Chulalongkorn University, Pathumwan, Bangkok 10330, Thailand
6
Professor Aroon Sorathesn Center of Excellence in Environmental Engineering, Department of Environmental Engineering, Faculty of Engineering, Chulalongkorn University, Bangkok 10330, Thailand
7
Department of Civil Engineering, Thammasat School of Engineering, Thammasat University, Pathumthani 12121, Thailand
*
Author to whom correspondence should be addressed.
Water 2022, 14(10), 1603; https://doi.org/10.3390/w14101603
Submission received: 15 April 2022 / Revised: 11 May 2022 / Accepted: 13 May 2022 / Published: 17 May 2022
(This article belongs to the Special Issue Flood Risk Management and Resilience)

Abstract

:
This research aims to investigate the effect of climatic and hydrological factors on flood hazards and assess flood resilience in Ayutthaya, Thailand, using the 10 essentials for making cities resilient modified by the United Nations Office for Disaster Risk Reduction (UNDRR). Flood resilience assessment was performed based on a multi-criteria decision-making approach or the analytical hierarchy process (AHP) of pairwise comparison. The results indicate that runoff is considered the most influential factor in flood hazards, followed by land use, rainfall, and historical flood events, sequentially. Regarding the flood incident management concept, a questionnaire survey (n = 552) was conducted to understand the impacts of flood on local communities. The findings reveal that 50% of respondents had never received any flood information or participated in training sessions on flood preparedness. Most reported their concerns about the inadequate supply of drinking water during a flood. Spearman’s correlation coefficient shows positive correlations between flood disaster relief payments, preparedness training, access to flood hazard mapping, emergency health services, and their flood preparation actions. According to the modified UNDRR indicators, the top three highest AHP values in building community resilience to flood hazards in Ayutthaya are flood risk scenario identification, the effectiveness of emergency flood disaster response, integrated urban planning, and disaster risk reduction. The policy implications of this research include the need for national authorities to better understand the role cities can play a vital role in supporting both national and international climate resilience frameworks, especially Thailand’s National Disaster Management Plan, the Sendai Framework for Disaster Risk Reduction (SFDRR), and the global Sustainable Development Goals (SDGs).

1. Introduction

Globally, climate change and disasters are considered urgent challenges with long-term implications for the environmental and socio-economic sustainability of many countries. Many of the changes in the climate system are described as unprecedented in the observational record. Projected percentage changes in extreme climate events, such as the intensity and frequency of concurrent heatwaves, drought, and precipitation, are reported. The proportion of the population at risk from flooding has increased globally [1]. Extreme precipitation and associated flooding are predicted to become more frequent in most regions of Asia and Africa. The monsoon rainfall is forecast to increase in the long term at the global level, especially in South and Southeast Asia. It should be noticed that developing countries are facing substantial constraints to obtain land use, topographic, and hydrometeorological data that could lead to large uncertainties in flood risk management studies [2]. In Thailand, approximately 50% of disasters are caused by floods. Thailand faces high exposure to disaster hazard risks and was ranked 81st out of 191 counties by the 2019 INFORM Risk Index for Risk Management [3]. Among the ASEAN, Thailand is ranked fifth in terms of multi-hazard exposure and vulnerability [4] and ranked thirteenth globally in terms of multi-hazard risk [5]. According to the World Bank and the Asian Development Bank, Thailand is one of the 10 most flood-prone countries in the world [6]. The World Atlas of Natural Disaster Risk [5] also reported that Thailand has been ranked among the top 10% of countries with the highest economic loss risk of flood in the world.
The number of people harmed by an extreme river flood is expected to increase by over 2 million by 2035–2044, with coastal flooding affecting approximately 2.4 million people by 2100. In terms of economic impact, the average annual loss from flood events in Thailand is about USD 2.6 billion, representing almost 100% of the total economic loss from natural disasters [7]. The 2011 flood in Thailand provides an example of how natural disasters could adversely affect local residents, especially lower-income groups. The 2011 flood covered a wide area downstream of the Chao Phraya River with a gentle slope and an elevation of 15 m above sea level. Consequently, this topography contributes to the lack of downstream discharge capacity, leading to the inundation of floodplain areas, especially in the lower watershed of the Chao Phraya River (i.e., Ayutthaya, Pathum Thani, Bangkok provinces, etc.) [8]. These floods reduced Thailand’s Gross Domestic Product (GDP) by THB 328,154 million and contributed to a 3.7% fall in economic growth [9].
Theoretically, flood resilience is applied to urban development and flood disaster risk management-related policies but is still fragmented and largely conceptual. However, despite numerous attempts to make it operational, limited research and quantitative case studies exist on its practical relevance in flood risk reduction and management. Regarding the Hyogo Framework for Action [10], resilience is defined as the capacity of a system, community, or society potentially exposed to hazards to adapt by resisting and/or changing to maintain an acceptable functional and structural framework. Flood-resilient buildings generally aim to reduce the risks associated with floods through a combination of prevention, protection, and preparedness, covering a wide range of probabilities. Flooding of urban areas is a major problem and considered as one of the most disastrous events. It should be realized that more than 80% of global GDP is generated in cities; however, annual direct loss from disasters in cities was estimated at approximately USD 314 billion [11,12]. Cities are thus required to move along the resilience pathway toward achieving both disaster risk reduction (DRR) and the effective implementation of risk-informed decision making. This includes multi-sectoral and multi-stakeholder engagement (i.e., vulnerable populations, local communities, etc.) and effective climate risk management through proactive and appropriate actions. To strengthen the resilience of communities and individuals while ensuring disaster risk-informed development, the United Nations Office for Disaster Risk Reduction (UNDRR) focuses on risk reduction. Importantly, for DRR practices to be efficient and effective, they need to be multi-sectoral based, inclusive, and accessible. Consequently, the UNDRR proposed the following strategies under the Making Cities Resilient 2030 initiative to promote sustainability [13]: (i) improving the city’s understanding of risk and commitment to DRR; (ii) increasing the city’s capacity to plan for DRR and implement resilience actions; and (iii) strengthening both vertical and horizontal links with national and local authorities. Thus, cities must accelerate their progress toward resilience and realize their full potential to contribute to the global agenda (i.e., the New Urban Agenda, the Paris Agreement, the Sendai Framework for Disaster Risk Reduction, and the Sustainable Development Goals).

2. Literature Review and Research Objectives

2.1. Factors Affecting Flood Hazard Assessment

Based on the literature, flood hazard assessment basically requires the comprehensive consideration of several factors. Duang et al. [14] reported that factors influencing flood hazards can be divided into the following seven groups: hydrological and orographic, meteorological, geomorphologic, cover characteristics, soil properties, infrastructure, and socio-economic. In practice, it is unclear how these factors affect each other and directly impact on flood risk. The existing research on the influential factors leading to floods can be categorized into two approaches, namely, qualitative and quantitative [14,15]. Qualitative evaluation approaches to flood risk mapping mainly rely on expert opinions, including constant sum scale (CSS) [16], entropy theory [17], and optimized additive weighting methodology [18]. On the one hand, quantitative evaluation is mainly based on numerical expressions that can quantify the degree of relationship between all related factors and flood risk. Classic examples of quantitative methods are hydrological and hydrodynamic models (i.e., semi-supervised machine learning, multi-layered coarse grid modeling in 2D urban flood simulations, and GIS-based urban storm-inundation simulation) [19,20,21], flood simulation models (i.e., Genetic Algorithm for Rule-Set Production, Quick Unbiased Efficient Statistical Tree (QUEST) [22], metaheuristic approaches [23], and meteorological research and prediction) [24]. Despite the benefits of quantitative research, the foregoing flood model approaches have limited use, especially at the local level. A recent study conducted by Huang et al. [25] highlighted that the quantitative methodology for flood risk analysis mainly relies on a huge amount of high precision data, which is very difficult to gather, limiting their application in urban and local areas to some degree. Due to data scarcity and the uncertainties of quantitative flood forecasting, a semi-quantitative approach (i.e., qualitative and quantitative risk assessment) represents a better alternative based on the available information. A classic example is multi-criteria decision-making (MCDM) (i.e., an analytic hierarchy process (AHP) based on multi-critical indices) [15,26]. Basically, the AHP-pairwise comparison method is employed to determine the weight of the main criteria and sub-criteria. This method helps all decision-makers to explore their opinions and rank the complex criteria [27]. According to a review conducted by De Brito & Evers [28], the number of published papers relating to MCDM applications in flood risk assessment significantly increased from 1995 to 2015 (over 82% since 2009), with the AHP being the most popular. For instance, Kittipongvises et al. [29], Sawangnate et al. [30], Li et al. [31], Danumah et al. [32], and Radwan et al. [33] applied the AHP method for flood risk assessment and zonation in designated areas (i.e., Thailand, China, and India). Hämmerling et al. [34] also applied the AHP method to assess the technical conditions of hydrotechnical construction.

2.2. Flood Resilience Assessment

Resilience plays a significant role in flood risk reduction and management. Several methods can be applied to assess flood resilience. For instance, in the United States, a study by Oladokun and Montz [35] proposed a conceptual framework to measure the resilience of flood-prone communities by considering the following three dimensions: hazard absorption capacity, resource availability, and community processes and resource utilization. According to their large-scale analysis, Campbell et al. [36] developed a flood resilience measurement tool piloted in nine countries by considering the following five capital dimensions: human, social, physical, natural, and financial capital. In Iran, Moghadas et al. [37] applied a multi-criteria approach (the AHP-TOPSIS tool) to assess urban flood resilience under six dimensions: social, economic, environmental, infrastructural, institutional, and local. Despite their relevance, there is a shortage of research exploring the link between UNDRR indicators and flood disaster risk management. Therefore, this study assesses flood resilience by applying the proposed modified UNDRR indicators.
Although Thailand is recognized as being highly vulnerable to climate variability, an updated hazard map (i.e., mapping and floodplain management) is still lacking. Comprehensive flood risk management and disaster preparedness remain extremely challenging. Furthermore, there is a dearth of research on how local authorities consider the introduction of flood resilience and protection measures from the perspective of their local flood risk management policies. There is also a clear need to strengthen and build resilience on DRR in Thailand to effectively tackle both natural disasters and the impacts of climate change.

2.3. Research Objectives

The overall objective of this research is to investigate the impact of factors affecting flood hazard identification and assess flood resilience using Ayutthaya Province in Thailand (located within the floodplain area) as a case study. Specific objectives were to assess: (a) the impact of climatic and hydrological factors on flood hazard identification using the analytical hierarchy process (AHP) and (b) the city’s flood resilience in Ayutthaya, Thailand, through the modified UNDRR indicators. The following research questions were addressed in this study: (i) How do climatic and hydrological factors affect flood-mapping-based hazard identification? (ii) What are the main barriers and motivators for enhancing flood resilience according to the modified UNDRR indicators? Ultimately, the results of this study are expected to provide the necessary knowledge and supportive information for policymakers and related stakeholders to actively promote and foster action to improve flood resilience at the local scale, especially in the identified floodplain areas. Moreover, flood resilience analysis through the modified UNDRR indicators provides the required baseline data for consideration prior to formulating strategies for management and a reduction in flood risk.

3. Materials and Methods

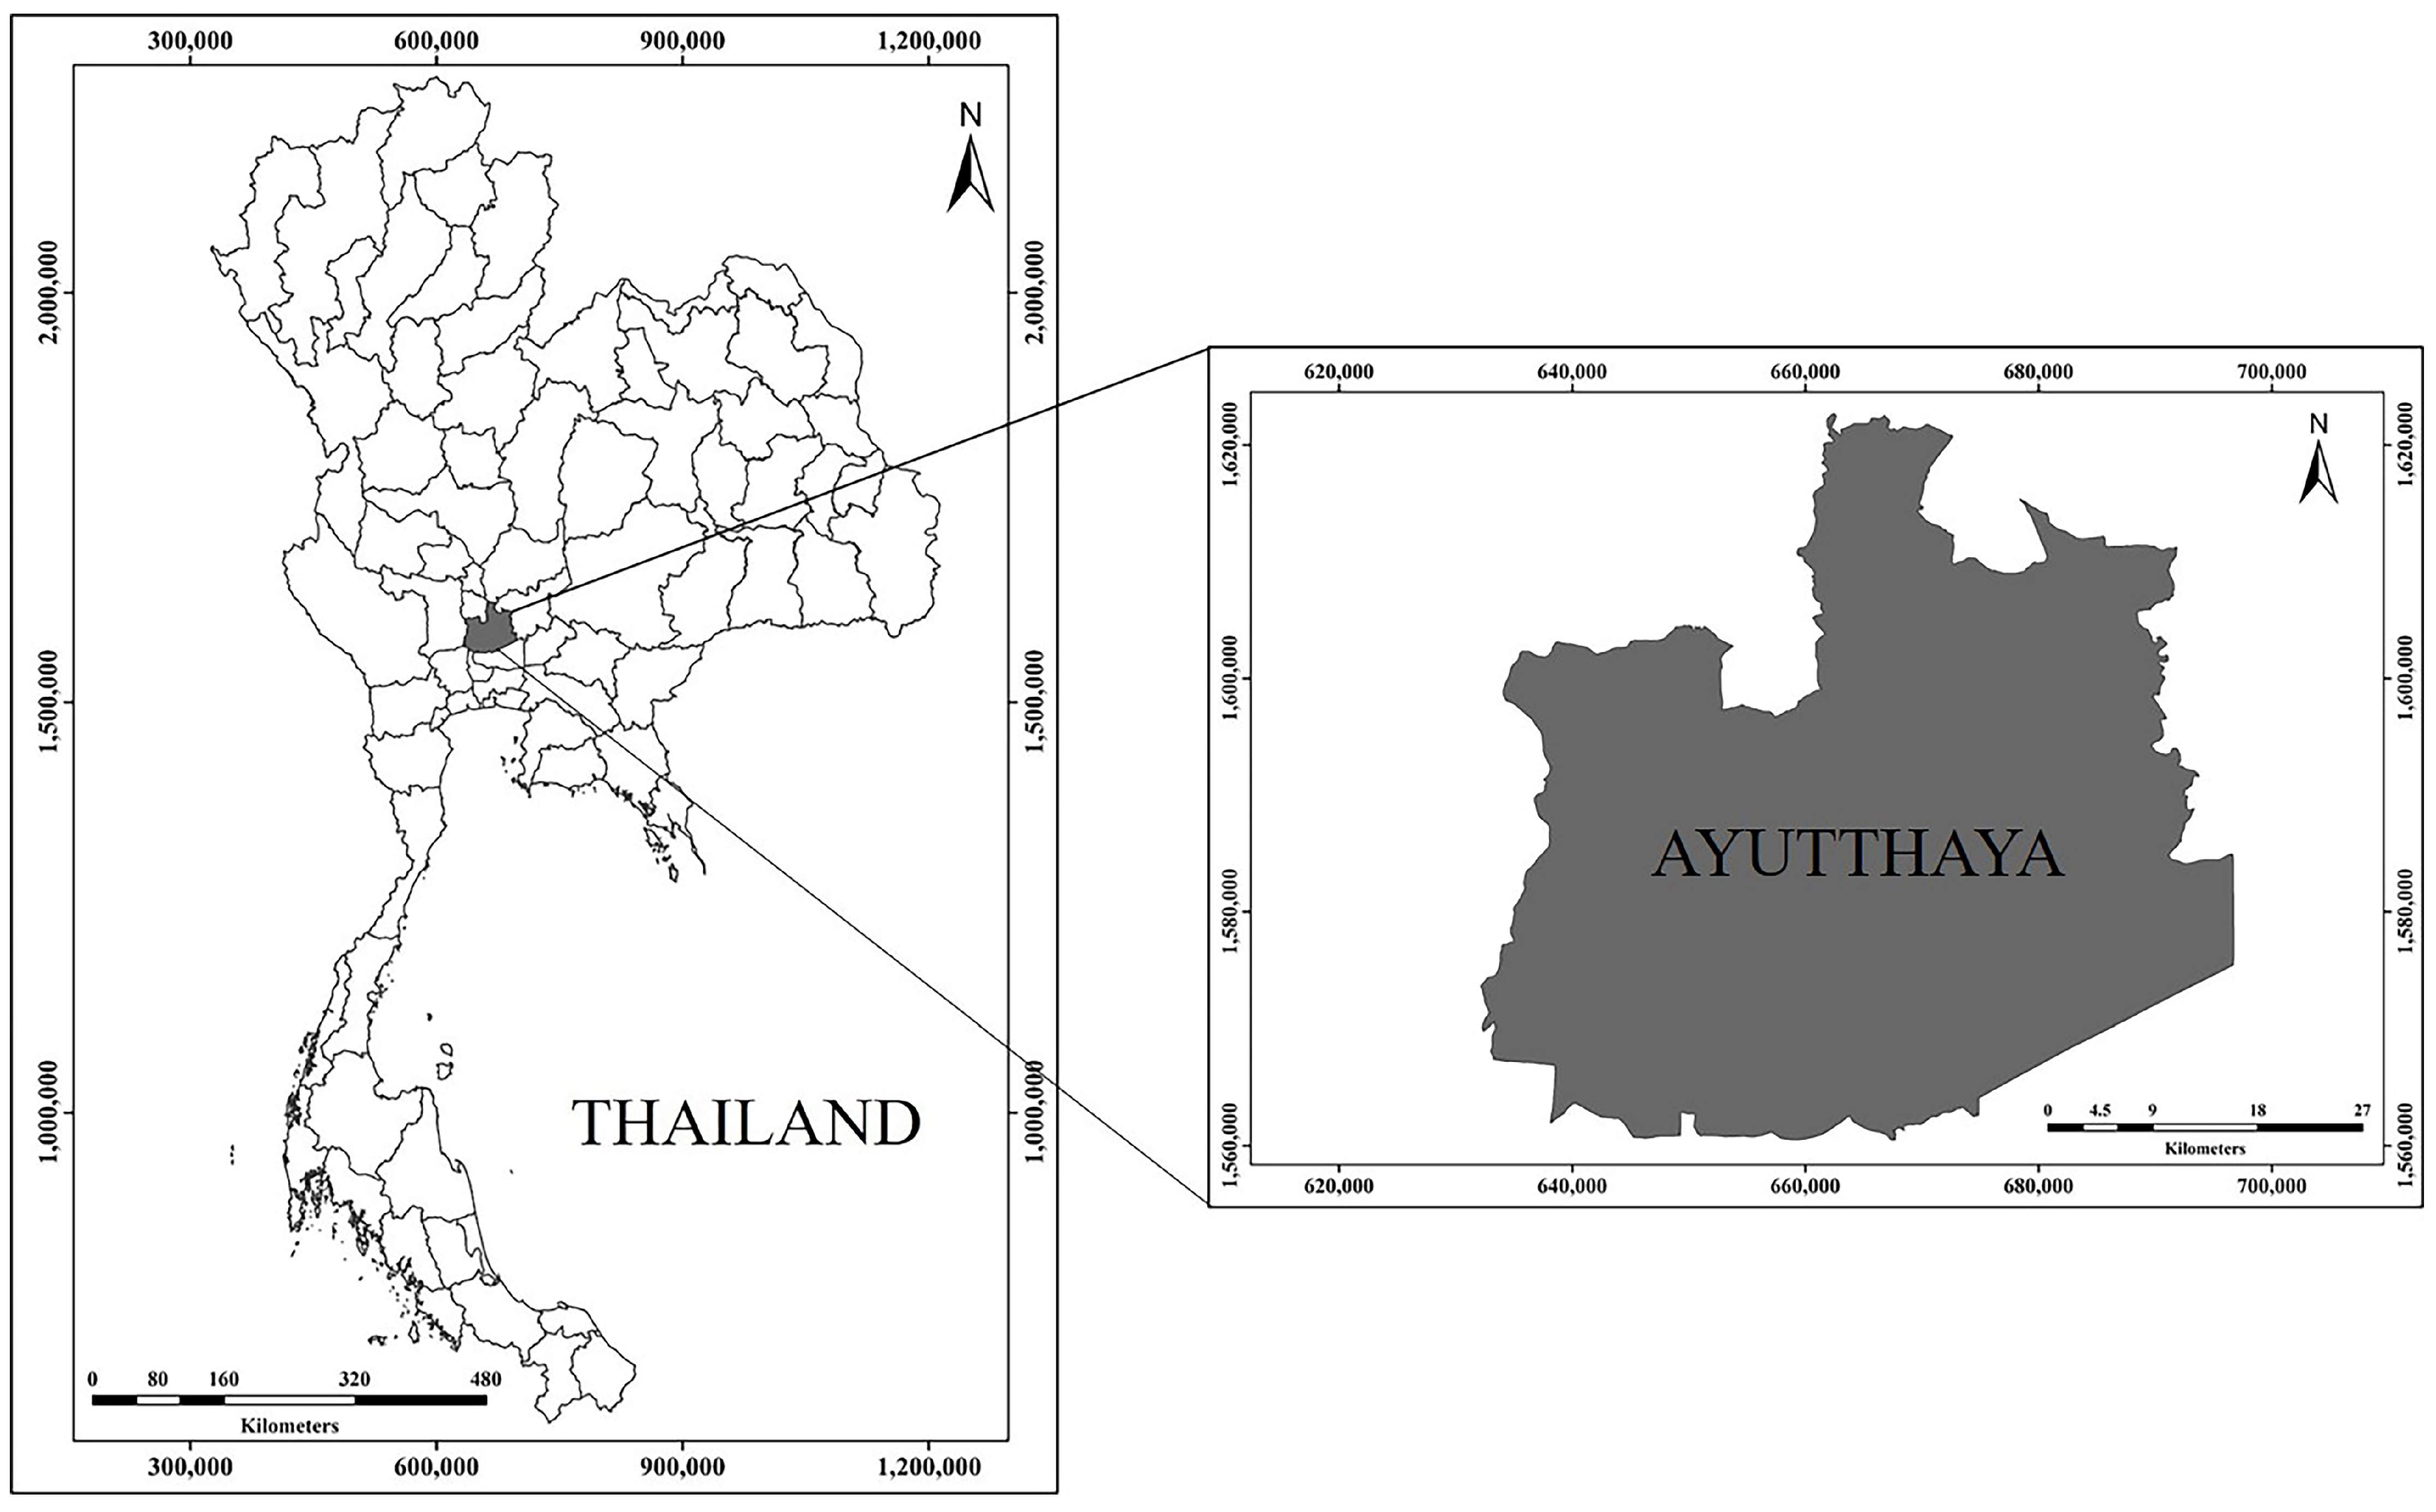
3.1. Case Study Selection

As home to a UNESCO World Heritage site, Ayutthaya Province, located about 70 km north of Bangkok, was selected as a case study in this research (Figure 1). Ayutthaya is ranked fifth nationwide and first in the central region in terms of Gross Provincial Production (GPP) growth rate. Ayutthaya is situated at the junction of the Chao Phraya, Pa Sak, and Lopburi rivers, recognized as a large flood plain in Thailand. Geographically, at the downstream of the lower Chao Phraya River Basin, run-offs from excessive and continuous extreme rainfall in the upper northern provinces usually cause overflows and flash floods in Ayutthaya. The rising trend in water availability during the wet season contributes to the elevated frequency and intensity of floods [38]. During the worst flooding in 2011, six major industrial estates in Ayutthaya and Pathum Thani provinces were inundated with water, accounting for about 70% of the total damage caused to Thailand’s manufacturing sector [39].

3.2. Assessment of Flood Hazard Mapping and Resilience

To assess the effects of climate and hydrological factors on flood hazards in Ayutthaya, the following six thematic-layer factors were deployed to generate a flood risk map using ArcGIS 9.3: maximum daily rainfall (mm/d), runoff (m3/s), slope of the area (%), past flood events (yr), land use, and road density (km/km2). The important weights of the following factors were determined by expert pairwise comparison. By applying the AHP technique, all experts (i.e., representatives from the Office of the Ayutthaya Municipality, Ayutthaya Provincial Office for Natural Resources and Environment, Disaster Prevention and Mitigation Office in Ayutthaya, Royal Irrigation Department, and Ayutthaya Provincial Public health office, Thailand; n = 5) were asked to complete a pairwise comparison of each factor using a nine-point scale ranging from 1 to 9 (i.e., less important variables were valued from 1 to 9) (Equation (1)). Both the consistency index (CI) and consistency ratio (CR) were computed to avoid any incidental judgment in the pairwise comparison (Equations (2) and (3)) [40]. The comparison is acceptable with an estimated CR value of less than 0.1:
A = [ a i j ] = { 1 a i j a 1 n 1 / a i j 1 a 2 n 1 / a 1 n 1 / a 2 n 1 }
where A is a representation of the pairwise comparison matrix of experts’ opinions on each factor associated with flood hazards over an alternative aij and all comparisons i,j = 1, 2, …, n:
C I = λ max n n 1
where λmax is the largest eigenvalue of the pairwise comparison matrix and n is the number of factors associated with flood hazards:
C R = C I R I
where CI is the consistency index and RI is the random consistency index (e.g., the RI for 6 factors is 1.24).
Flood disaster resilience was also assessed based mainly on AHP and experts’ opinions (n = 3), including representatives from the Office of the Ayutthaya Municipality, Ayutthaya Provincial Office for Natural Resources and Environment, and Disaster Prevention and Mitigation Office in Ayutthaya. The 10 essentials for making cities resilient proposed by UNDRR (Figure S1) were modified into 15 factors for the AHP-pairwise comparison. Applying Equation (1), each individual factor in a paired comparison was considered an expression of the expert’s preference for one alternative. For instance, when an expert decided that alternative i (i.e., factor i of modified UNDRR flood resilience) was equally important as alternative j (i.e., factor j of modified UNDRR flood resilience), a comparison represented by aij = aji = 1 or factor i = factor j was observed [41]. Through the AHP method, the highest-ranked factor was considered crucial in determining community flood resilience. In contrast, the lowest-ranked factor was considered the least important by the panel of experts.

3.3. Survey and Data Analysis: Flood Management Strategies and Preparation

A questionnaire survey was conducted in Ayutthaya, Thailand. The target group of this study was the people who are residing in the flood hazard areas defined by the AHP-GIS flood risk mapping (Section 3.2). The content of the questionnaire was designed mainly on the basis of previous literature on the flood incident management (FIM) concept [42] and the city water resilience approach adopted by Arup Global Water Leaders [43]. As presented in Table 1, the following survey questions were designed to better understand the flood management preparedness and related strategies of communities, namely: pre-flood preparedness measures, forecasting and warning, flood lesson plans, provision of essential services, and actions for flood preparedness. Spearman’s correlation coefficient was applied to analyze the relationship among variables (i.e., actions for flood preparedness, flood hazard mapping, flood warning information, flood relief payments, flood training, and access to emergency health services during floods).

4. Results

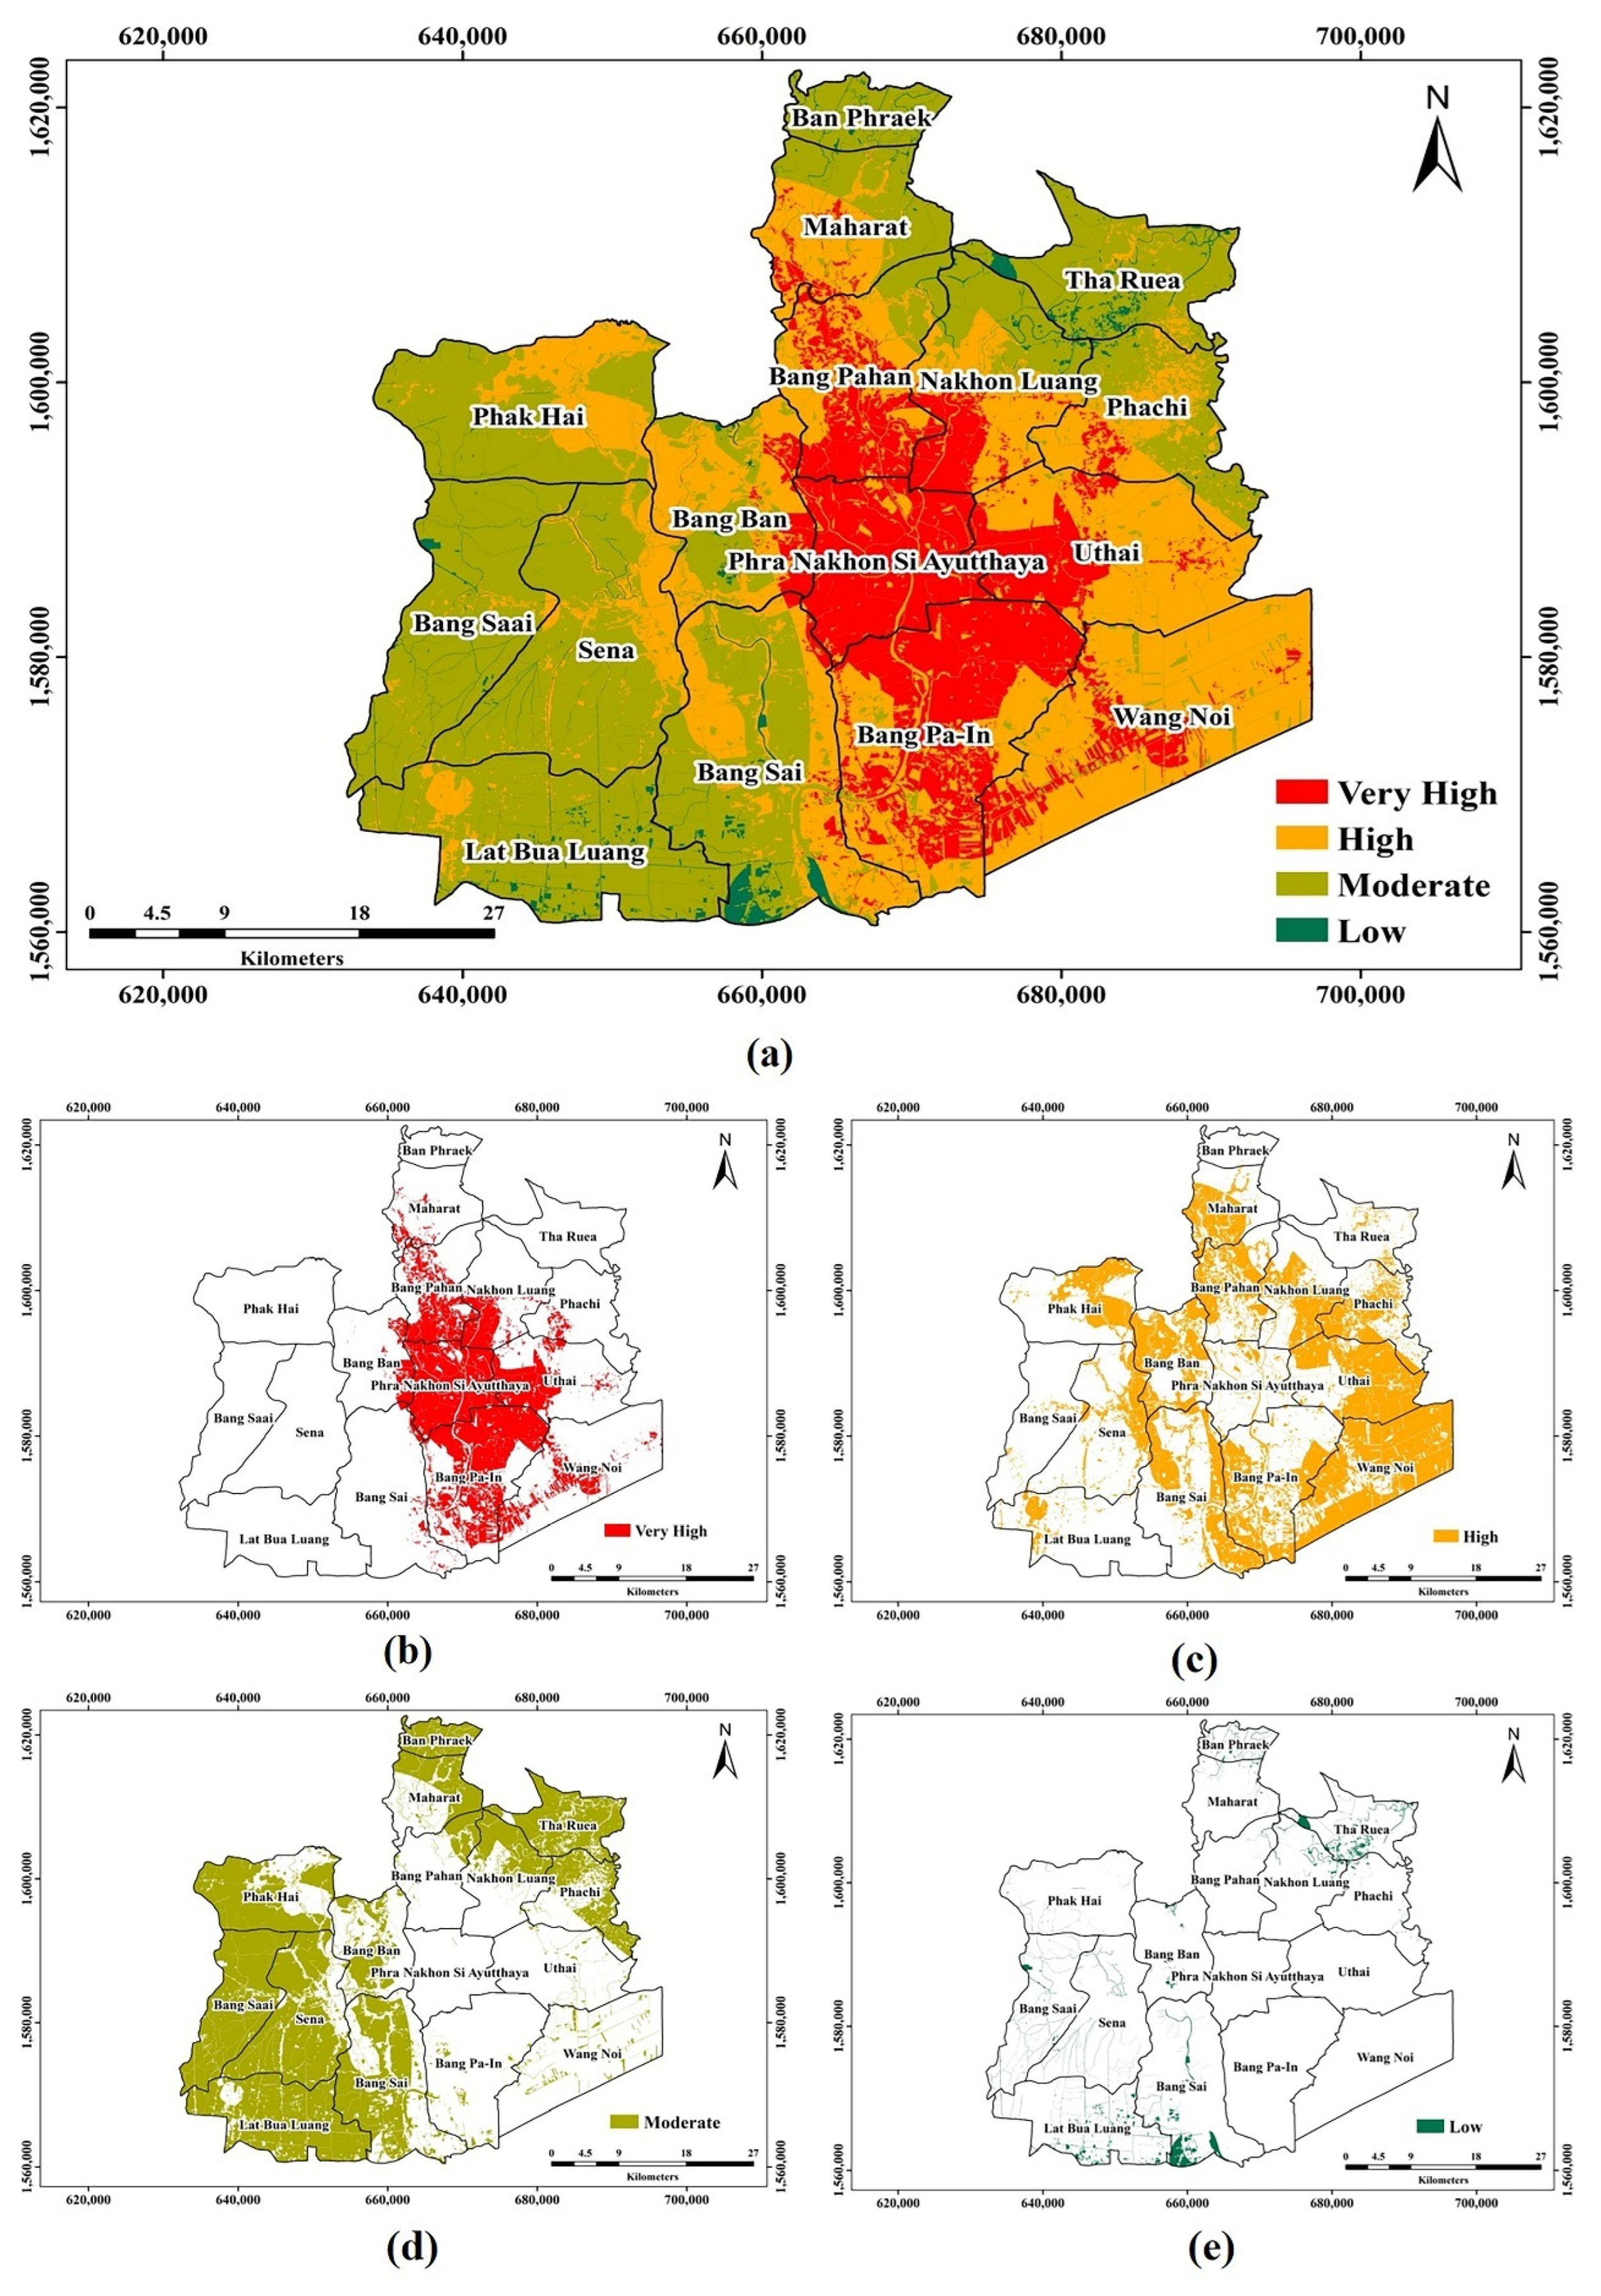
4.1. AHP-GIS Flood Risk Mapping

To address the first research question, the relative weights of six hydrometeorological factors associated with flood risk were estimated. The calculated CR value in this evaluation was approximately 0.0930 (<0.1, which is acceptable). According to the results in Table 2, runoff, land use, and maximum daily rainfall have the highest weight scores, indicating that these are the most common causes of floods in Ayutthaya Province. Slope exhibits the lowest AHP weight. All six hydrometeorological factors (Figure 2) and the proposed weights of each were used to generate a flood risk map by applying the overlay technique. As depicted in Figure 3a–e, the analysis reveals that approximately 2489.26 km2 of Ayutthaya Province is at risk of flooding, of which approximately 17, 36, and 44% of areas can be categorized as very high (Figure 3b), high (Figure 3c), moderate (Figure 3d), and low-risk areas (Figure 3e), respectively. Geographically, Phranakhon Si Ayutthaya (PNSA), Uthai, Bang Pa-in, and Wang Noi exhibit the highest flood risk when considering both high- and very high-risk areas. Interestingly, almost the entire PNSA region (99%), where most of the population resides, is considered to be at a high risk of flooding. The results of the current analysis are somewhat consistent with the report on the flood situation by the Ayutthaya Disaster Prevention and Mitigation Office (2019) [44], with PNSA, Bang Pa-in, Sena, and Bang Ban being identified as flood hazard areas in Ayutthaya Province. In this study, Sena presents the highest proportion of areas under moderate flood risk (78%), whereas Bang Ban demonstrates a combination of risk flood areas, with 12% being very high, 55% high, 32% moderate, and 1% low risk.

4.2. Community Flood Management Strategies and Actions for Preparation

Questionnaire surveys were conducted in the flood hazard areas. Since it is the most densely populated district and around 98% of its total area is categorized as being under high flood risk, PNSA was selected as representative of a high-risk area, whereas Sena and Bang Ban districts were considered to be representative of moderate risk and combined risk areas in the community surveys. According to the sampling distribution of the population proportion, 552 households in PNSA (n = 236), Sena (n = 162), and Bang Ban (n = 154) were randomly selected as target respondents. The respondents, comprising of females (72%) and males (28%), were ranged in ages from 18 to 103 years (mean age: 48). The survey results found that about half (43%) of the total respondents experienced more than 10 instances of flooding in their communities during the past 10 years. However, interestingly, the surveys reveal that approximately half the respondents did not receive information effectively, instructions regarding flooding (44%), or support from the local government in terms of community flood training (55%). In respect to financial support, it should be noted that close to 67% of respondents received no flood disaster relief payments from their local authorities. More worryingly, as depicted in Figure 4a,b, almost half the respondents (43%) were unable to access emergency health services during a flood disaster, while about 55% also reported inadequate drinking water provision during a flood event. Significantly, this present study reaffirms that half of the respondents (51%) reported that they had never taken proactive action to support flood risk responses. The results of Spearman’s correlation coefficient demonstrate a significant positive relationship between flood forecasting and warning information and action preparation for floods (r = 0.394; p < 0.01). In addition, positive correlations exist between access to community flood hazard maps, flood disaster relief payments, flood preparedness training, access to emergency health services during floods, and actions for the flood preparation of local respondents. A strong positive correlation exists between access to flood hazard mapping and related flood training activities (r = 0.428; p < 0.01) (Table 3).

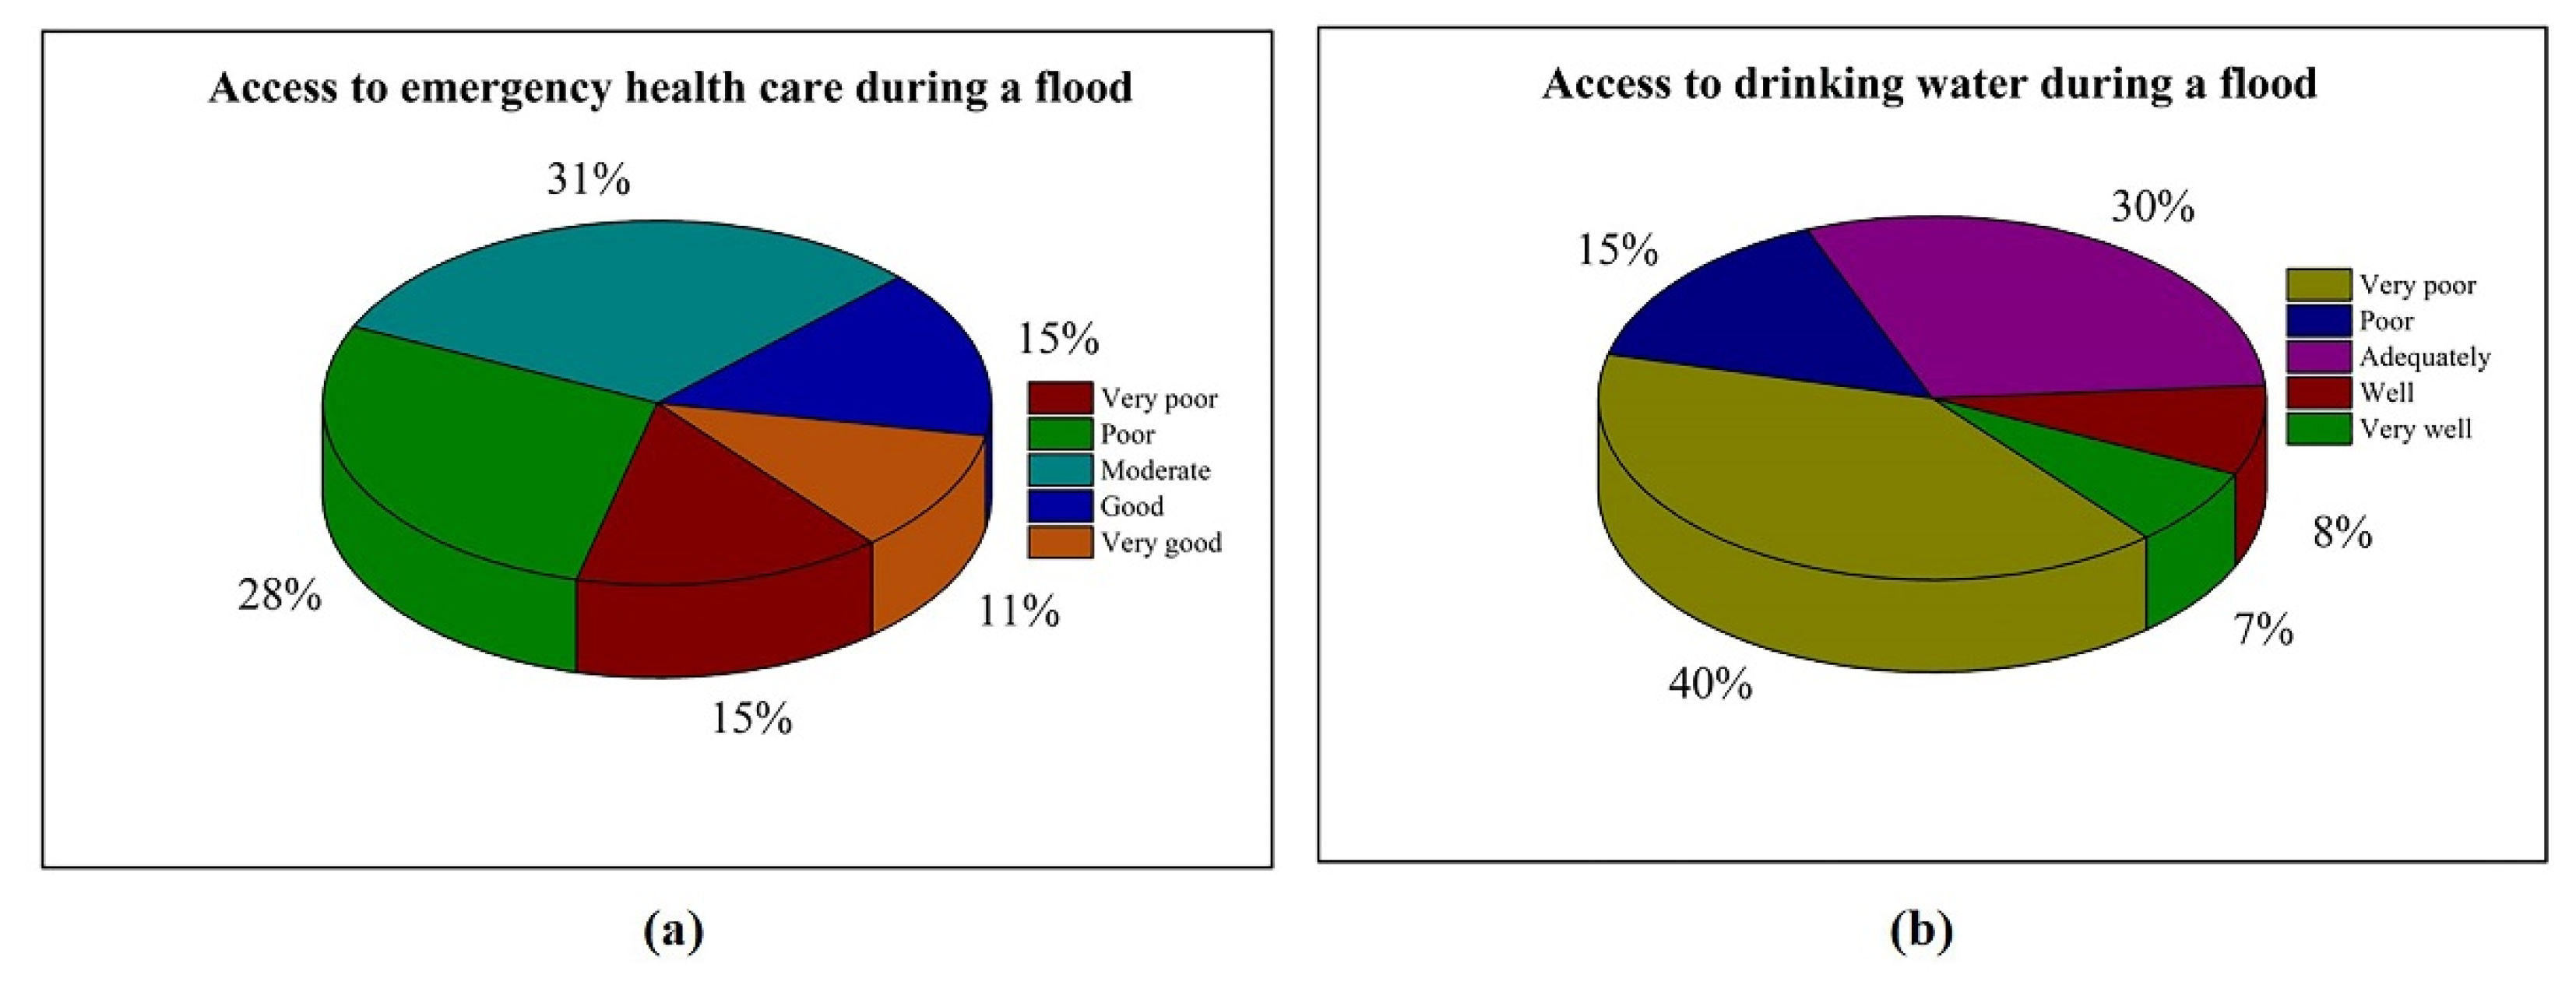
4.3. Access to and Availability of Basic Urban Services

The lack of access to basic and safely managed drinking water services and effective sanitation systems is considered a flood-related challenge, resulting in avoidable deaths in high-risk areas. The findings from this study confirm that respondents had concerns about the inadequate supply of drinking water during a flood. For instance, during the flood in 2011, some respondents reported receiving pure drinking water only from the shelter center. During a flood crisis, some local households used the surrounding floodwater with or without any purification for their water needs. This is similar to the reports by Shimi et al. [45] in that approximately 25% of all households in Goalanda, Bangladesh, used floodwater without any treatment for daily life, becoming contaminated by various fecal pathogens and water-borne diseases. They also reveal that water supply, health, and sanitation issues are considered highly crucial during a flood disaster. The study by See et al. [46] argues that access to clean and safe water supplies is an extremely difficult goal to achieve, especially in the absence of a systematic plan to ensure that safe water is continuously managed in flood evacuation centers. Furthermore, flood disasters may potentially damage existing road operations and transportation networks, meaning that flood victims cannot access potable water services [47]. Lack of access to affordable drinking water also forced local residents to consume water of unknown sanitary status, which in turn contributed to social vulnerability to floods, especially in relation to the number of patients needing urgent treatment for water-borne illnesses during floods. The results of this survey confirm that almost half the respondents were unable to access emergency healthcare services during flood periods. To address these concerns, both hygiene emergency preparedness and potential sanitation solutions are urgently required.

4.4. Flood Resilience Assessment Based on the Modified UNDRR Indicators

To answer the second research question, flood resilience analysis was performed by using the modified UNDRR indicators (Table 4). Based on the experts’ viewpoints, ensuring an effective flood disaster emergency response (0.189), identifying flood risk scenarios (0.151), and strengthening societal capacity for flood disaster resilience (0.150) had the highest AHP values. This means that creating a flood emergency response plan, determining high flood probability areas, and building institutional capacity for enhancing community resilience to flood disasters are key factors in disaster management. Meanwhile, building resilience in urban design and development (0.062), strengthening institutional capacities for flood risk reduction (0.052), and establishing natural buffers to enhance flood resiliency in their communities (0.040) have the lowest AHP values among the factors of flood resilience assessment defined by the UNDRR. Considering the significance of each resilience indicator, the existence of flood hazard assessment data and flood emergency response plans for Provincial Disaster Prevention and Mitigation as well as province-wide disaster management plans have the highest scores in the AHP-pairwise comparison of 0.126, 0.125, and 0.107, respectively. The experts also agree that financial planning (0.097), effective support from the community network in coping with a flood disaster, and post-disaster recovery plans (0.080) were important factors in strengthening a city’s resilience to floods. These viewpoints are in alignment with those of Buckle et al. [48], who highlighted that the empowerment of local communities to actively engage in planning and decision making by combining top-down and bottom-up approaches for disaster risk management can enhance community resilience and the ability to deal with disasters. Moreover, the inclusiveness of all multi-stakeholder bodies in disaster planning processes also creates public trust, which is vital for organizing cohesive action to manage the consequences of natural disasters.
Engaging vulnerable groups in flood preparedness and mitigation, the existence of early flood warning mechanisms, availability of databases on land use zoning, and, in particular, the percentage of the population and agricultural land at flood risk had exhibited relatively low AHP scores and were ranked seventh, eighth, and ninth, respectively. The factors with lower scores were the availability of key skills, the experience and knowledge of local authorities on city flood resilience (i.e., environmental, sanitation, water, and structural engineering), road accessibility during floods, and ecosystem services, all major components of flood risk prevention. Similarly, in Pakistan, Shah et al. [49] investigated the role of institutions and human resources as an indicator in assessing disaster preparedness and risk reduction. To achieve a substantial reduction in disaster risk, the aforementioned study suggests that the government develop deeper linkages among all institutions actively engaged in disaster risk reduction, especially at the local level. In this study, regarding building a flood-resilient city, the experts assigned the lowest priorities to the existence of databases on scenarios, setting out city-wide flood exposure and vulnerability (0.025), designated critical asset service days (i.e., service to hospitals) at risk of loss due to failure in the city’s water and sanitation services (0.020), and loss of water or sanitation services in the case of severe floods (0.009). The results imply that the lack of a proper database on flood vulnerability and access to safe water and sanitation services are crucial barriers to building long-term disaster resilience in the study area. Therefore, barriers to effective disaster preparedness and management should be resolved through the relevant policy mechanism in consultation with policymakers and related stakeholders [49].

5. Discussion

5.1. Flood Hazard Mapping and Climatic and Hydrological Factors

The results of the flood hazard mapping in this study are also in line with those of Kittipongvises et al. [29], who revealed that runoff is the most significant factor affecting flood risk in communities near the World Heritage Site in Phranakhon Si Ayutthaya District, Ayutthaya, Thailand. In Slovakia, Vojtek and Vojteková [50] report that surface runoff is an influential factor in the occurrence and distribution of hydrological hazards, especially flooding and soil erosion. In a study by Dung et al. [14], the AHP method is also applied for flood zoning, with runoff and flow accumulation considered as important factors in identifying areas susceptible to flood hazards. It should be noted that these factors vary between locations (i.e., different geographical areas) and times. In fact, the interplay among runoff, rainfall, and land surface is very complex. Runoff, land use, and rainfall are repeatedly the most important factors affecting flood hazards. These findings are in agreement with previous studies and supported by Asare-Kyei et al. [51], who integrated GIS and remote sensing at the sub-district level by considering the complex interactions among runoff, rainfall, land use, soil, and slope by using a hydrological model to estimate the runoff of the catchments based mainly on rainfall intensity, land use, and land cover. It seems evident that the size of the sub-catchment and watershed largely affects the runoff volume (i.e., the larger the catchment size, the greater the potential amount of precipitation that can be captured and discharged to the catchment outlet). Some studies also apply the Rational Model to calculate the peak surface runoff rate by considering rainfall intensity in the catchment [52,53]. The hydrological response of the catchment depends on the interaction of precipitation associated with topological variables, land use patterns, soil properties, and slope. As such, the probability of flood occurrence increases with a steeper slope since it has a higher runoff coefficient than a gradual slope. Regarding the relationship between land use change and runoff, the consequences of anthropogenic land use change are directly reflected in surface runoff pathways, accelerated soil erosion, and variations in the hydrologic regimes of a floodplain [51,54]. Despite the importance of the hydrological and hydraulic model, a study by Dung et al. [14] highlights that these methods are recommended only for small areas. In contrast, the AHP-GIS method can be built up for a large river basin, which is more appropriate for estimating flood hazards.

5.2. Flood Resilience Assessment

In practical terms, it should be noted that the results obtained by employing the modified UNDRR flood resilience assessment are consistent with the findings of Orencio and Fujii [41], who reveal that disaster risk reduction planning regimes (i.e., local disaster planning on disaster hazards) and social protection (i.e., community access to basic social services) are considered to be the most important criteria, with high scores in AHP analysis for building a disaster-resilient community. In terms of social resilience, Ghasemzadeh et al. [55] include social solidarity (i.e., readiness of local citizens toward disaster evacuation, retaining citizenship relations before and after a flood disaster, strengthening public morale, public trust, face-to-face interactions, and quality of family interaction) in urban flood resilience assessment. In Thailand, a recent study by Khunwishit et al. [56] in 2018 reveals that since the 2011 flood, local authorities in Thailand have made moderate progress in flood risk management and flood resilience building. The progress made in flood resilience building, tasks of applying and enforcing a realistic risk of flooding, risk-compliant building regulations, and land use planning principles exhibit the lowest scores, whereas investing in and maintaining flood infrastructure (i.e., flood drainage, levees, and floodwalls) has the highest score for flood resilience building. Interestingly, the findings of this study reveal a positive correlation between the disaster resilience leadership and the flood resilience index. In other words, local authorities whose leaders possess a higher level of disaster resilience leadership tend to make more progress in disaster risk reduction and resilience building for their cities. The ability of the local government to effectively communicate, engage all stakeholders, and provide disaster risk reduction education and training programs in schools and local communities is essential for driving the core strategies of disaster resilience and risk reduction at the city scale.
Moreover, from an environmental and natural resource management perspective, practices that minimize disaster risks and promote the understanding of ecosystem functions are essential to disaster-resilient communities. Interestingly, several previous studies highlight that emergency response and medical care capacity (i.e., hygienic infrastructures, hygiene-related resources, rehabilitation services, and physical and mental health of local citizens) make a significant contribution to community disaster resilience [55,57,58]. In contrast, these results indicate that designated critical asset service days (i.e., services to emergency medical services and hospitals) at risk of loss of water and sanitation during periods of flood appear to receive the least priority in the implementation of disaster management and risk reduction strategies at the local level. The impacts of flooding on water supply systems and quality of water sources need to be more critically considered in the formulation of flood management policies: disruption of access to safe and clean water, overloading of and damage to water pumping stations, destruction of water river intake due to changes in water flow during a flood, sediment deposition and erosion, and severe water contamination [46,59]. These findings are similar to the survey results in this study and emphasize that water and sanitation service provision should be urgently addressed.

5.3. Implications and Recommendations

Overall, the findings of this research have a number of important policy and practical implications for future practice, as follows:
The global implications of disaster resilience and risk reduction: The findings of this research provide useful insight for building local institutional capacity for flood disaster management. The modified UNDRR indicators could become a valuable tool for integrating flood resilience into city planning process, and a better flood risk reduction and sustainable development (i.e., SDGs 1, 11, 13) within local and national planning. Globally, a study of Amaratunga et al. [60] evaluated the overall progress of local governments (214 cities around the world) in disaster resilience and risk reduction by using 47 indicators of the 10 essentials for making cities resilient on a of 0 to 3. The results revealed that resilient urban development is considered as the area of highest progress (1.55), followed by risk identification (1.52), protective functions and ecosystem services (1.50), and disaster risk governance (1.46), respectively, whereas financial capacity for resilience is considered as the area that needs the most improvement in disaster resilience and risk reduction. Interestingly, by considering the sub-indicators of the 10 essentials for making cities resilient, Sub-Saharan African and American cities performed well in data sharing, Asian cities prepared well in citizen engagement, and Arab cities performed well in hazard assessment [60].
Analyzing the causal links between all factors and flood risk mapping: It is important to analyze the significant correlation between floods and all causative factors. The study by Dung et al. [14] highlights that all related factors leading to the occurrence of floods (i.e., hydrological and orographic, meteorological geomorphological, characteristics related to land use, land cover, and vegetation cover, as well as soil-related, socio-economic, and infrastructure) should be fully considered when implementing the AHP-GIS technique [14]. For instance, the following hydrological and orographic indicators should be further explored in flood hazard zoning: channel capacity and area [61], capacity of the existing drainage [62], drainage density [63], distance from the drainage network [64], distance from the river and riverbank [65,66], distance from open channels and totally covered streams [67], distance from water surfaces [68], distance from the main river and tributary [69], distance from river confluence [66], flow accumulation and flow length [62,70], and size of the watershed [71]. In terms of geomorphological factors, numerous studies indicate that elevation, slope, hydro-lithological formations, and landform categories are crucial indicators of flood occurrence. Moreover, soil-related factors (i.e., depth to groundwater, water table, and topographic wetness index) are also associated with the ability of the soil to absorb water and prevent areas from flooding [14]. In addition, it is perhaps more important to integrate all the factors relating to infrastructure and socio-economic characteristics (i.e., road quality, road density, and population density) in flood hazard zoning. Per unit GDP is also considered as an indicator of flood resilience, reflecting the economic situation in the area [25]. However, in practice, the causal factors of flood mainly depend on data availability and the physical characteristics of the study area.
Integrating methods for flood hazard and run-off assessment: Both National and Provincial Irrigation Offices should assist in the routine monitoring of flood extent and runoff storage while also forecasting rainfall and runoff risk in communities. The relationship between surface water runoff and flood risk vulnerability in different land use patterns should be expanded in further studies based on integrated rainfall runoff analysis and hydrometeorological and hydraulic modeling, focusing on high-risk areas. The combined usage of AHP-GIS and remote sensing techniques should be further employed. The spatial variability in the runoff coefficient should be further explored to better understand the complex interactions among the rainfall, land use, soil, and slope of the study area. Index-based methods should be adopted using various parameters based on digital elevation models (DEMs) derived from watershed geomorphological characteristics, land use, infrastructure, urban information, and demographics. A study conducted by Dask and Sar [56] suggests that research should be conducted to measure the runoff coefficient (i.e., the ratio between runoff and rainfall) as the crucial criteria for establishing a more realistic hazard map. However, it should be noted that the application of hydrological models for assessing flood risk in conditions of limited data at the administrative level is a challenging task.
Developing an operational framework for flood risk assessment under the social resilience concept:
There is an urgent need to develop an integrated conceptual framework for flood risk assessment in different phases of the disaster timeline through the social resilience concept [72]. The “5S model”, consisting of social structure, social capital, social mechanisms, social equity and diversity, and the social beliefs/culture, developed by Saja et al. [73] and the “6R resilience properties”, consisting of robustness, redundancy, resourcefulness, rapidity, risk-sensitivity, and regeneration, proposed by Saja et al. [72] could serve as the bases for a holistic approach to disaster risk management while also encouraging disaster-risk-reducing behavior in local citizens. In Thailand, the study by Khunwishit [74] classified disaster resilience factors into the following dimensions: infrastructure, psychological, socio-economic, social capability and social capital, cultural, managerial, and organizational. In this manner, a holistic disaster risk assessment also needs to account for several dimensions of vulnerability (i.e., socio-economic, environmental, cultural, institutional, and the degree of social fragility) [75].
Provision of safe water and sanitation services and ensuring the continued delivery of essential services: All local governments, non-government organizations, and the private sector must allocate capacity and concentrate their efforts on enhancing the efficiency of water supply systems and sanitation services in the event of future floods. Moreover, local governments and provincial disaster prevention and mitigation agencies must pay serious attention to the need for consistent delivery of emergency services, especially medical and healthcare services for vulnerable communities in flood-prone areas. A reliable communication network and rapid emergency response services for minimizing the health risks associated with flooding must be a top priority in all four phases of the disaster risk management plan (i.e., prevention and mitigation, preparedness, response, and recovery).

6. Conclusions

To gain insight into the influential factors of flooding, the judgment of experts on the AHP-pairwise comparison revealed that runoff was recognized as the most important hydrological factor affecting flood hazards, followed by land use and rainfall, sequentially. Past flood events, as climatic factors, were found to be the least important to flood events in Ayutthaya, Thailand. Geographically, Phranakhon Si Ayutthaya, Bang Ban, Phak Hai, Bang Chai, and Bang Pa-In Districts were identified as high-risk flood zones. To better understand the potential consequences of flood impact, a questionnaire survey (n = 522) and flood resilience assessment were performed. The survey findings indicate that about half the local respondents received neither flood-related information nor flood disaster relief payments from their local authorities. In addition, the majority of respondents stated that they had never participated in community flood preparedness training. Access to basic urban services, lack of effective sanitation systems, and drinking water services are considered to be flood-related challenges. The survey results reveal that over half the respondents reported inadequate drinking water provision and were unable to access emergency health services during a flood disaster. Regarding the Spearman’s correlation analysis, positive relationships were found between the flood preparation actions of local respondents and flood forecasting and warning information, access to community flood hazard maps, flood disaster relief payments, flood preparedness training, and access to emergency health services during floods. Finally, the modified UNDRR indicators were employed in this study to assess community flood resilience. According to the AHP-pairwise comparison, the highest-ranked factor was crucial in determining flood resilience by the panel of experts. Interestingly, flood hazards and risk scenario identification, effective flood disaster emergency response, and integrated urban planning and disaster risk management were the top three highest AHP scores, whereas pursuing resilient urban development and design (i.e., land use zoning), strengthening the institutional capacity of flood risk reduction, and establishing natural buffers to enhance flood resiliency exhibited the lowest AHP scores in the flood resilience assessment. Therefore, these three barriers should be further investigated to strengthen community resilience to flood hazards in Ayutthaya, Thailand. Moreover, further studies on the investigation of various factors contributing to flood susceptibility mapping and the evaluation of urban resilience to flood disasters using different methods and indicators are necessary to inform research and policy formulation.

Supplementary Materials

The following supporting information can be downloaded at: https://www.mdpi.com/article/10.3390/w14101603/s1, Figure S1: AHP flood resilience assessment modified from UNDRR.

Author Contributions

Conceptualization, S.K. and J.L.; Data curation, P.M.; Formal analysis, P.M. and S.K.; Investigation, S.K. and J.L. Methodology, P.M., S.K., J.L., A.P., W.S. and N.T.; Project administration, J.L.; Resources, S.K.; Software, S.K.; Supervision, S.K., J.L. and C.P.; Validation, S.K., A.P., W.S., N.T., J.L. and C.P.; Visualization, P.M. and S.K.; Writing—original draft, P.M.; Writing—review & editing, S.K., A.P., W.S., N.T., J.L. and C.P. All authors have read and agreed to the published version of the manuscript.

Funding

This work was financially supported by the Thailand Science Research and Innovation (TSRI) grant No. SRI6230303.

Institutional Review Board Statement

The study was approved by the Research Ethics Review Committee for Research Involving Human Subjects: The Second Allied Academic Group in Social Sciences, Humanities and Fine and Applied Arts of Chulalongkorn University (protocol code 224/64 and date of approval on 5 November 2021).

Acknowledgments

The authors gratefully acknowledge representatives from the office of the Ayutthaya municipality, Ayutthaya Provincial Office for Natural Resources and Environment, Disaster Prevention and Mitigation Office in Ayutthaya, the Royal Irrigation Department, the Department of Land Development, and Ayutthaya Provincial Public health office for providing research information.

Conflicts of Interest

The authors declare no conflict of interest.

References

  1. Pinos, J.; Quesada-Román, A. Flood risk-related research trends in Latin America and the Caribbean. Water 2022, 14, 10. [Google Scholar] [CrossRef]
  2. Quesada-Román, A. Flood risk index development at the municipal level in Costa Rica: A methodological framework. Environ. Sci. Policy 2022, 133, 98–106. [Google Scholar] [CrossRef]
  3. European Commission. INFORM Index for Risk Management. Thailand Country Profile. 2019. Available online: https://drmkc.jrc.ec.europa.eu/inform-index/INFORM-Risk/Country-Profile/moduleId/1767/id/386/controller/Admin/action/CountryProfile (accessed on 4 January 2022).
  4. AHA Centre. ASEAN Risk Monitor and Disaster Management Review (ARMOR); ASEAN Coordinating Centre for Humanitarian Assistance on Disaster Management (AHA Centre): Jakarta, Indonesia, 2018. [Google Scholar]
  5. Shi, P.; Kasperson, R. World Atlas of Natural Disaster Risk; IHDP/Future Earth-Integrated Risk Governance Project Series; Springer: Berlin/Heidelberg, Germany, 2015. [Google Scholar] [CrossRef]
  6. The World Bank Group and the Asian Development Bank. Climate Risk Country Profile: Thailand. 2021. Available online: https://reliefweb.int/sites/reliefweb.int/files/resources/climate-risk-country-profile-thailand.pdf (accessed on 17 March 2022).
  7. UNISDR. Prevention Web: Basic Country Statistics and Indicators. 2014. Available online: https://www.preventionweb.net/countries (accessed on 4 April 2022).
  8. Komori, D.; Nakamura, S.; Kiguchi, M.; Nishijima, A.; Yamazaki, D.; Suzuki, S.; Kawasaki, A.; Oki, K. Characteristics of the 2011 Chao Phraya River flood in Central Thailand. Hydrol. Res. Lett. 2012, 6, 41–46. [Google Scholar] [CrossRef]
  9. Perwaiz, A. Thailand floods and impact on private sector. In Disaster Management and Private Sectors; Springer: Tokyo, Japan, 2015; pp. 231–245. [Google Scholar]
  10. UNISDR. Hyogo Framework for Action 2005–2015: Building the Resilience of Nations and Communities to Disasters; A/CONF.206/6. UNISD; World Conference on Disaster Reduction: Kobe, Japan, 2005. [Google Scholar]
  11. Quesada-Román, A.; Villalobos-Portilla, E.; Campos-Durán, D. Hydrometeorological disasters in urban areas of Costa Rica, Central America. Environ. Hazards 2020, 20, 264–278. [Google Scholar] [CrossRef]
  12. Sharifi, A. Resilient urban forms: A macro-scale analysis. Cities 2019, 85, 1–14. [Google Scholar] [CrossRef]
  13. UNDRR. Making Cities Resilient 2030. 2021. Available online: https://www.unisdr.org/campaign/resilientcities/home/article/making-cities-resilient-2030-mcr2030-initial-proposal.html (accessed on 20 November 2021).
  14. Dung, N.B.; Long, N.Q.; Goyal, R.; An, D.T.; Minh, D.T. The Role of Factors Affecting Flood Hazard Zoning Using Analytical Hierarchy Process: A Review. Earth Syst. Environ. 2021, 5. [Google Scholar] [CrossRef]
  15. Tang, J.; Li, Y.; Cui, S.; Xu, L.; Hu, Y.; Ding, S.; Nitivattananon, V. Analyzing the spatiotemporal dynamics of flood risk and its driving factors in a coastal watershed of southeastern China. Ecol. Indic. 2021, 121, 107134. [Google Scholar] [CrossRef]
  16. Joo, H.; Choi, C.; Kim, J.; Kim, D.; Kim, S.; Kim, H.S. A Bayesian Network-Based Integrated for Flood Risk Assessment (InFRA). Sustainability 2019, 11, 3733. [Google Scholar] [CrossRef] [Green Version]
  17. Xu, H.; Ma, C.; Lian, J.; Xu, K.; Chaima, E. Urban flooding risk assessment based on an integrated k-means cluster algorithm and improved entropy weight method in the region of Haikou, China. J. Hydrol. 2018, 563, 975–986. [Google Scholar] [CrossRef]
  18. Jato-Espino, D.; Lobo, A.; Ascorbe-Salcedo, A. Urban flood risk mapping using an optimised additive weighting methodology based on open data. J. Flood Risk Manag. 2019, 12, e12533. [Google Scholar] [CrossRef] [Green Version]
  19. Zhao, G.; Pang, B.; Xu, Z.; Peng, D.; Xu, L. Assessment of urban flood susceptibility using semi-supervised machine learning model. Sci. Total Environ. 2018, 659, 940–949. [Google Scholar] [CrossRef] [PubMed]
  20. Chen, A.S.; Evans, B.; Djordjevi, S.; Savi, D.A. Multi-layered coarse grid modelling in 2D urban flood simulations. J. Hydrol. 2012, 470–471, 1–11. [Google Scholar] [CrossRef] [Green Version]
  21. Zhang, S.; Pan, B. An urban storm-inundation simulation method based on GIS. J. Hydrol. 2014, 517, 260–268. [Google Scholar] [CrossRef]
  22. Darabi, H.; Choubin, B.; Rahmati, O.; Torabi Haghighi, A.; Pradhan, B.; Kløve, B. Urban flood risk mapping using the GARP and QUEST models: A comparative study of machine learning techniques. J. Hydrol. 2019, 569, 142–154. [Google Scholar] [CrossRef]
  23. Pourghasemi, H.R.; Razavi-Termeh, S.V.; Kariminejad, N.; Hong, H.; Chen, W. An assessment of metaheuristic approaches for flood assessment. J. Hydrol. 2020, 582, 124536. [Google Scholar] [CrossRef]
  24. Goodarzi, L.; Banihabib, M.E.; Roozbahani, A. A decision-making model for flood warning system based on ensemble forecasts. J. Hydrol. 2019, 573, 207–219. [Google Scholar] [CrossRef]
  25. Huang, S.; Wang, H.; Xu, Y.; She, J.; Huang, J. Key disaster-causing factors chains on urban flood risk based on bayesian network. Land 2021, 10, 210. [Google Scholar] [CrossRef]
  26. Saaty, T.L. Decision making with the analytic hierarchy process. Int. J. Serv. Sci. 2008, 1, 83–98. [Google Scholar] [CrossRef] [Green Version]
  27. Ikram, M.; Zhang, Q.; Sroufe, R. Developing integrated management systems using an AHP-Fuzzy VIKOR approach. Bus. Strategy Environ. 2020, 29, 2265–2283. [Google Scholar] [CrossRef]
  28. De Brito, M.M.; Evers, M. Multi-criteria decision-making for flood risk management: A survey of the current state of the art. Nat. Hazards Earth Syst. Sci. 2016, 16, 1019–1033. [Google Scholar] [CrossRef] [Green Version]
  29. Kittipongvises, S.; Phetrak, A.; Rattanapun, P.; Brundiers, K.; Buizer, J.L.; Melnick, R. AHP-GIS analysis for flood hazard assessment of the communities nearby the world heritage site on Ayutthaya Island, Thailand. Int. J. Disaster Risk Reduct. 2020, 48, 101612. [Google Scholar] [CrossRef]
  30. Sawangnate, C.; Chaisri, B.; Kittipongvises, S. Flood hazard mapping and flood preparedness literacy of the elderly population residing in Bangkok, Thailand. Water 2022, 14, 1268. [Google Scholar] [CrossRef]
  31. Li, J.; Chen, H.; Liu, Z.; Zou, C. Integrated GIS/AHP-based flood disaster risk assessment and zonation: A case study of Henan Province, China. Proc. SPIE 2010, 7824, 428–438. [Google Scholar]
  32. Danumah, J.H.; Odai, S.N.; Saley, B.M.; Szarzynski, J.; Thiel, M.; Kwaku, A.; Kouame, F.K.; Akpa, L.Y. Flood risk assessment and mapping in Abidjan district using multi-criteria analysis (AHP) model and geoinformation techniques, (cote d’ivoire). Geoenviron. Disasters 2016, 3, 10. [Google Scholar] [CrossRef] [Green Version]
  33. Radwan, F.; Alazba, A.A.; Mossad, A. Flood risk assessment and mapping using AHP in arid and semiarid regions. Acta Geophys. 2019, 67, 215–229. [Google Scholar] [CrossRef]
  34. Hämmerling, M.; Kałuza, T.; Zawadzki, P.; Zaborowski, S.; Sojka, M.; Liberacki, D.; Ptak, M. Application of Multi-Criteria Analytic Methods in the Assessment of the Technical Conditions of Small Hydraulic Structures. Buildings 2022, 12, 115. [Google Scholar] [CrossRef]
  35. Oladokun, V.O.; Montz, B.E. Towards measuring resilience of flood-prone communities: A conceptual framework. Nat. Hazards Earth Syst. Sci. 2019, 19, 1151–1165. [Google Scholar] [CrossRef] [Green Version]
  36. Campbell, K.A.; Laurien, F.; Czajkowski, J.; Keating, A.; Hochrainer-Stigler, S.; Montgomery, M. First insights from the Flood Resilience Measurement Tool: A large-scale community flood resilience analysis. Int. J. Disaster Risk Reduct. 2019, 40, 101257. [Google Scholar] [CrossRef] [Green Version]
  37. Moghadas, M.; Asadzadeh, A.; Vafeidis, A.; Fekete, A.; Kötter, T. A multi-criteria approach for assessing urban flood resilience in Tehran. Iran. Int. J. Disaster Risk Reduct. 2019, 35, 101069. [Google Scholar] [CrossRef]
  38. Shrestha, S. Assessment of water availability under climate change scenarios in Thailand. In Climate Change Impacts and Adaptation in Water Resources and Water Use Sectors; Springer: Berlin/Heidelberg, Germany, 2014; pp. 9–23. [Google Scholar]
  39. Ministry of Finance and World Bank. Thailand Flooding 2554: Rapid Assessment for Resilient Recovery and Reconstruction Planning. 2012. Available online: http://www.undp.org/content/dam/thailand/docs/UNDP_RRR_THFloods.pdf (accessed on 17 March 2021).
  40. Saaty, T. The Analytic Hierarchy Process; Mac Gray-Hill: New York, NY, USA, 1980. [Google Scholar]
  41. Orencio, P.M.; Fujii, M.A. Localized disaster-resilience index to assess coastal communities based on an analytic hierarchy process (AHP). Int. J. Disaster Risk Reduct. 2013, 3, 62–75. [Google Scholar] [CrossRef]
  42. Dawson, R.J.; Peppe, R.; Wang, M. An agent-based model for risk-based flood incident management. Nat. Hazards 2011, 59, 167–189. [Google Scholar] [CrossRef]
  43. Arup Global Water Leader. The City Water Resilience Approach. 2019. Available online: https://www.arup.com/-/media/arup/files/publications/c/cwra_city_water_resilience_approach.pdf (accessed on 17 December 2021).
  44. Ayutthaya Disaster Prevention and Mitigation Office. Provincial Disaster Management Plans. 2019. Available online: https://ww2.ayutthaya.go.th/news/detail/6764 (accessed on 11 July 2021).
  45. Shimi, A.C.; Parvin, G.A.; Biswas, C.; Shaw, R. Impact and adaptation to flood: A focus on water supply, sanitation and health problems of rural community in Bangladesh. Disaster Prev. Manag. 2010, 19, 298–313. [Google Scholar] [CrossRef]
  46. See, K.L.; Nayan, N.; Rahaman, Z.A. Flood disaster water supply: A review of issues and challenges in Malaysia. Int. J. Acad. Res. Bus. Soc. Sci. 2017, 7, 525–532. [Google Scholar] [CrossRef] [Green Version]
  47. Hossain, A.; Juani, R.H.M.; Shams, S.; Rokonujjaman, M.; Shafiuddin, K.B.M. The challenges and alternatives of water supply and sanitation in flood prone area: A case study for Bhuapur in Bangladesh. In Proceedings of the 5th Brunei International Conference on Engineering and Technology (BICET 2014), Bandar Seri Begawan, Brunei, 1–3 November 2014. [Google Scholar]
  48. Buckle, P.; Marsh, G.; Smale, S. The Development of Community Capacity as Applying to Disaster Management Capability (Project 14/2002); Emergency Management Australia: Mt Macedon, Australia, 2003.
  49. Shah, A.A.; Shaw, R.; Ye, J.; Abid, M.; Amir, S.M.; Kanak Pervez, A.K.M.; Naz, S. Current capacities, preparedness and needs of local institutions in dealing with disaster risk reduction in Khyber Pakhtunkhwa, Pakistan. Int. J. Disaster Risk Reduct. 2019, 34, 165–172. [Google Scholar] [CrossRef]
  50. Vojtek, M.; Vojteková, J. Flood hazard and flood risk assessment at the local spatial scale: A case study. Geomat. Nat. Hazards Risk. 2016, 7, 1973–1992. [Google Scholar] [CrossRef]
  51. Asare-Kyei, D.; Forkuor, G.; Venus, V. Modeling food hazard zones at the Sub-District level with the rational model integrated with GIS and remote sensing approaches. Water 2015, 7, 3531–3564. [Google Scholar] [CrossRef] [Green Version]
  52. Viessman, W.J.; Lewis, G.L. Introduction to Hydrology; Harper Collins College Publishers: New York, NY, USA, 1996. [Google Scholar]
  53. Díez-Herrero, A.; Huerta, L.L.; Isidro, M.L. A Handbook on Flood Hazard Mapping Methodologies; IGME: Madrid, Spain, 2009. [Google Scholar]
  54. Oláhová, J.; Vojtek, M.; Boltižiar, M. Application of geoinformation technologies for the assessment of landscape structure using landscape-ecological indexes (Case study of the Handlová Landslide). Tájökológiai Lapok 2013, 11, 351–366. [Google Scholar]
  55. Ghasemzadeh, B.; Zarabadi, Z.S.S.; Majedi, H.; Behzadfar, M.; Sharifi, A. A framework for urban flood resilience assessment with emphasis on social, economic and institutional dimensions: A qualitative study. Sustainability 2021, 13, 7852. [Google Scholar] [CrossRef]
  56. Khunwishit, S.; Choosuk, C.; Webb, G. Flood Resilience Building in Thailand: Assessing Progress and the Effect of Leadership. Int. J. Disaster Risk Reduct. 2018, 9, 44–54. [Google Scholar] [CrossRef] [Green Version]
  57. Xu, W.; Xiang, L.; Proverbs, D. Assessing community resilience to urban flooding in multiple types of the transient population in China. Water J. 2020, 12, 2784. [Google Scholar] [CrossRef]
  58. Landeg, O.; Whitman, G.; Walker-Springett, K.; Butler, C.; Bone, A.; Kovats, S. Coastal flooding and frontline health care services: Challenges for flood risk resilience in the English health care system. J. Health Serv. Res. Policy 2019, 24, 219–228. [Google Scholar] [CrossRef] [Green Version]
  59. Speranza, C.I. Flood disaster risk management and humanitarian interventions in the Zambezi River Basin: Implications for adaptation to climate change. Clim. Dev. 2010, 2, 176–190. [Google Scholar] [CrossRef]
  60. Amaratunga, D.; Sridarran, P.; Haigh, P.R. Making Cities Resilient Report 2019: A Snapshot of How Local Governments Progress in Reducing Disaster Risks in Alignment with the Sendai Framework for Disaster Risk Reduction; United Nations Office for Disaster Risk Reduction (UNDRR): Geneva, Switzerland, 2019. [Google Scholar]
  61. Ghorbanzade, M.; Azarakhshi, M.; Mosaedi, A.; Rostami, K.M. Evaluation of the efficiency of analytic hierarchy process (AHP) to specify the areas with urban food risk potential, case study: The central part of Torbat Heydarieh. Phys. Geogr. Res. Q. 2018, 49, 645–656. [Google Scholar]
  62. Dask, P.; Sar, J. Identifcation and validation of potential food hazard area using GIS-based multi-criteria analysis and satellite data-derived water index. J. Flood Risk Manag. 2020, 13, e12620. [Google Scholar]
  63. Dung, N.; Long, N.Q.; An, D.T.; Minh, D.T. Multi-geospatial food hazard modelling for a large and complex river basin with data sparsity: A case study of the Lam River Basin, Vietnam. Earth Syst. Environ. 2021, 1–17. [Google Scholar] [CrossRef]
  64. Sanam, K.A.; Lynn, M.R.; Luke, J.; Laurence, W.C. A geospatial analysis of multi-hazard risk in Dharan, Nepal. Geomat. Nat. Hazards Risk 2020, 11, 88–111. [Google Scholar]
  65. Generino, P.S.; Sony, E.V.; Proceso, L.F. Analytic hierarchy process (AHP) in spatial modeling for foodplain risk assessment. Int. J. Mach. Learn. Comput. 2014, 4, 450–457. [Google Scholar]
  66. Ghosh, A.; Kar, S.K. Application of analytical hierarchy process (AHP) for food risk assessment: A case study in Malda district of West Bengal, India. Nat. Hazards 2018, 94, 349–368. [Google Scholar] [CrossRef]
  67. George, D.B.; Hariklia, D.S.; Efthimios, K.; Evangelos, B. Urban food hazard assessment in the basin of Athens Metropolitan city, Greece. Environ. Earth Sci. 2016, 75, 319. [Google Scholar]
  68. Gigović, L.; Pamučar, D.; Bajić, Z.; Drobnjak, S. Application of GIS-interval rough AHP methodology for food hazard mapping in urban areas. Water 2017, 9, 360. [Google Scholar] [CrossRef] [Green Version]
  69. Purnomo, S.N.; Hardini, P.; Indriyati, E.W. Flood hazard and risk assessment due to land use changes in Purbalingga, Indonesia. Int. J. Innov. Technol. Explor. Eng. 2020, 9, 1315–1318. [Google Scholar] [CrossRef]
  70. Gazi, M.Y.; Islam, M.A.; Hossain, S. Flood-hazard mapping in a regional scale—Way forward to the future hazard atlas in bangladesh. Malays. J. Geosci. 2019, 3, 1–11. [Google Scholar] [CrossRef]
  71. Lawal, D.U.; Matori, A.N.; Hashim, A.M.; Yusof, K.W.; Chandio, I.A. Detecting Food Susceptible Areas Using GIS-Based Analytic Hierarchy Process. In Proceedings of the International Conference on Future Environment and Energy IPCBEE, Singapore, 26–28 February 2012; Volume 28, pp. 1–5. [Google Scholar]
  72. Saja, A.M.A.; Goonetilleke, A.; Teo, M.; Ziyath, A.M. A critical review of social resilience assessment frameworks in disaster management. Int. J. Disaster Risk Reduct. 2019, 35, 101096. [Google Scholar] [CrossRef]
  73. Saja, A.A.; Teo, M.; Goonetilleke, A.; Ziyath, A.M. An inclusive and adaptive framework for measuring social resilience to disasters. Int. J. Disaster Risk Reduct. 2018, 28, 862–873. [Google Scholar] [CrossRef]
  74. Khunwishit, S. Community Resilience in Thailand: A Case Study of Flood Response in Nakhonsawan City Municipality. Ph.D. Thesis, University of North Texas, Denton, TX, USA, 2013. Available online: http://digital.library.unt.edu/ark:/67531/metadc271841/ (accessed on 1 April 2022).
  75. Carreño, M.L.; Cardona, O.D.; Barbat, A.H.; Suarez, D.C.; Perez, M.P.; Narvaez, L. Holistic Disaster Risk Evaluation for the Urban Risk Management Plan of Manizales, Colombia. Int. J. Disaster Risk Sci. 2017, 8, 258–269. [Google Scholar] [CrossRef] [Green Version]
Figure 1. Research case study: Ayutthaya Province, Thailand.
Water 14 01603 g001
Figure 2. Six thematic-layer factors of GIS flood risk maps.
Water 14 01603 g002
Figure 3. Flood risk maps of Ayutthaya based on (a) AHP-GIS and satellite images and areas under (b) very high, (c) high, (d) moderate, and (e) low risk.
Water 14 01603 g003
Figure 4. Access to basic urban services: (a) emergency healthcare and (b) drinking water during floods (n = 522).
Water 14 01603 g004
Table 1. Survey questions associated with flood incident management strategies and action preparedness.
Flood Incident
Management Response Type
Policies/StrategiesReferences
Pre-flood preparedness measures
  • Flood risk mapping to define vulnerable areas
[42]
Forecasting and warning
  • Flood forecasting and warning information
[42]
Flood lesson plan
  • Insurance and financial support
  • Flood training
[42]
Equitable provision of
essential services
  • Provision of safe drinking water
  • Medical preparedness to minimize health impacts
[43]
Flood preparation action
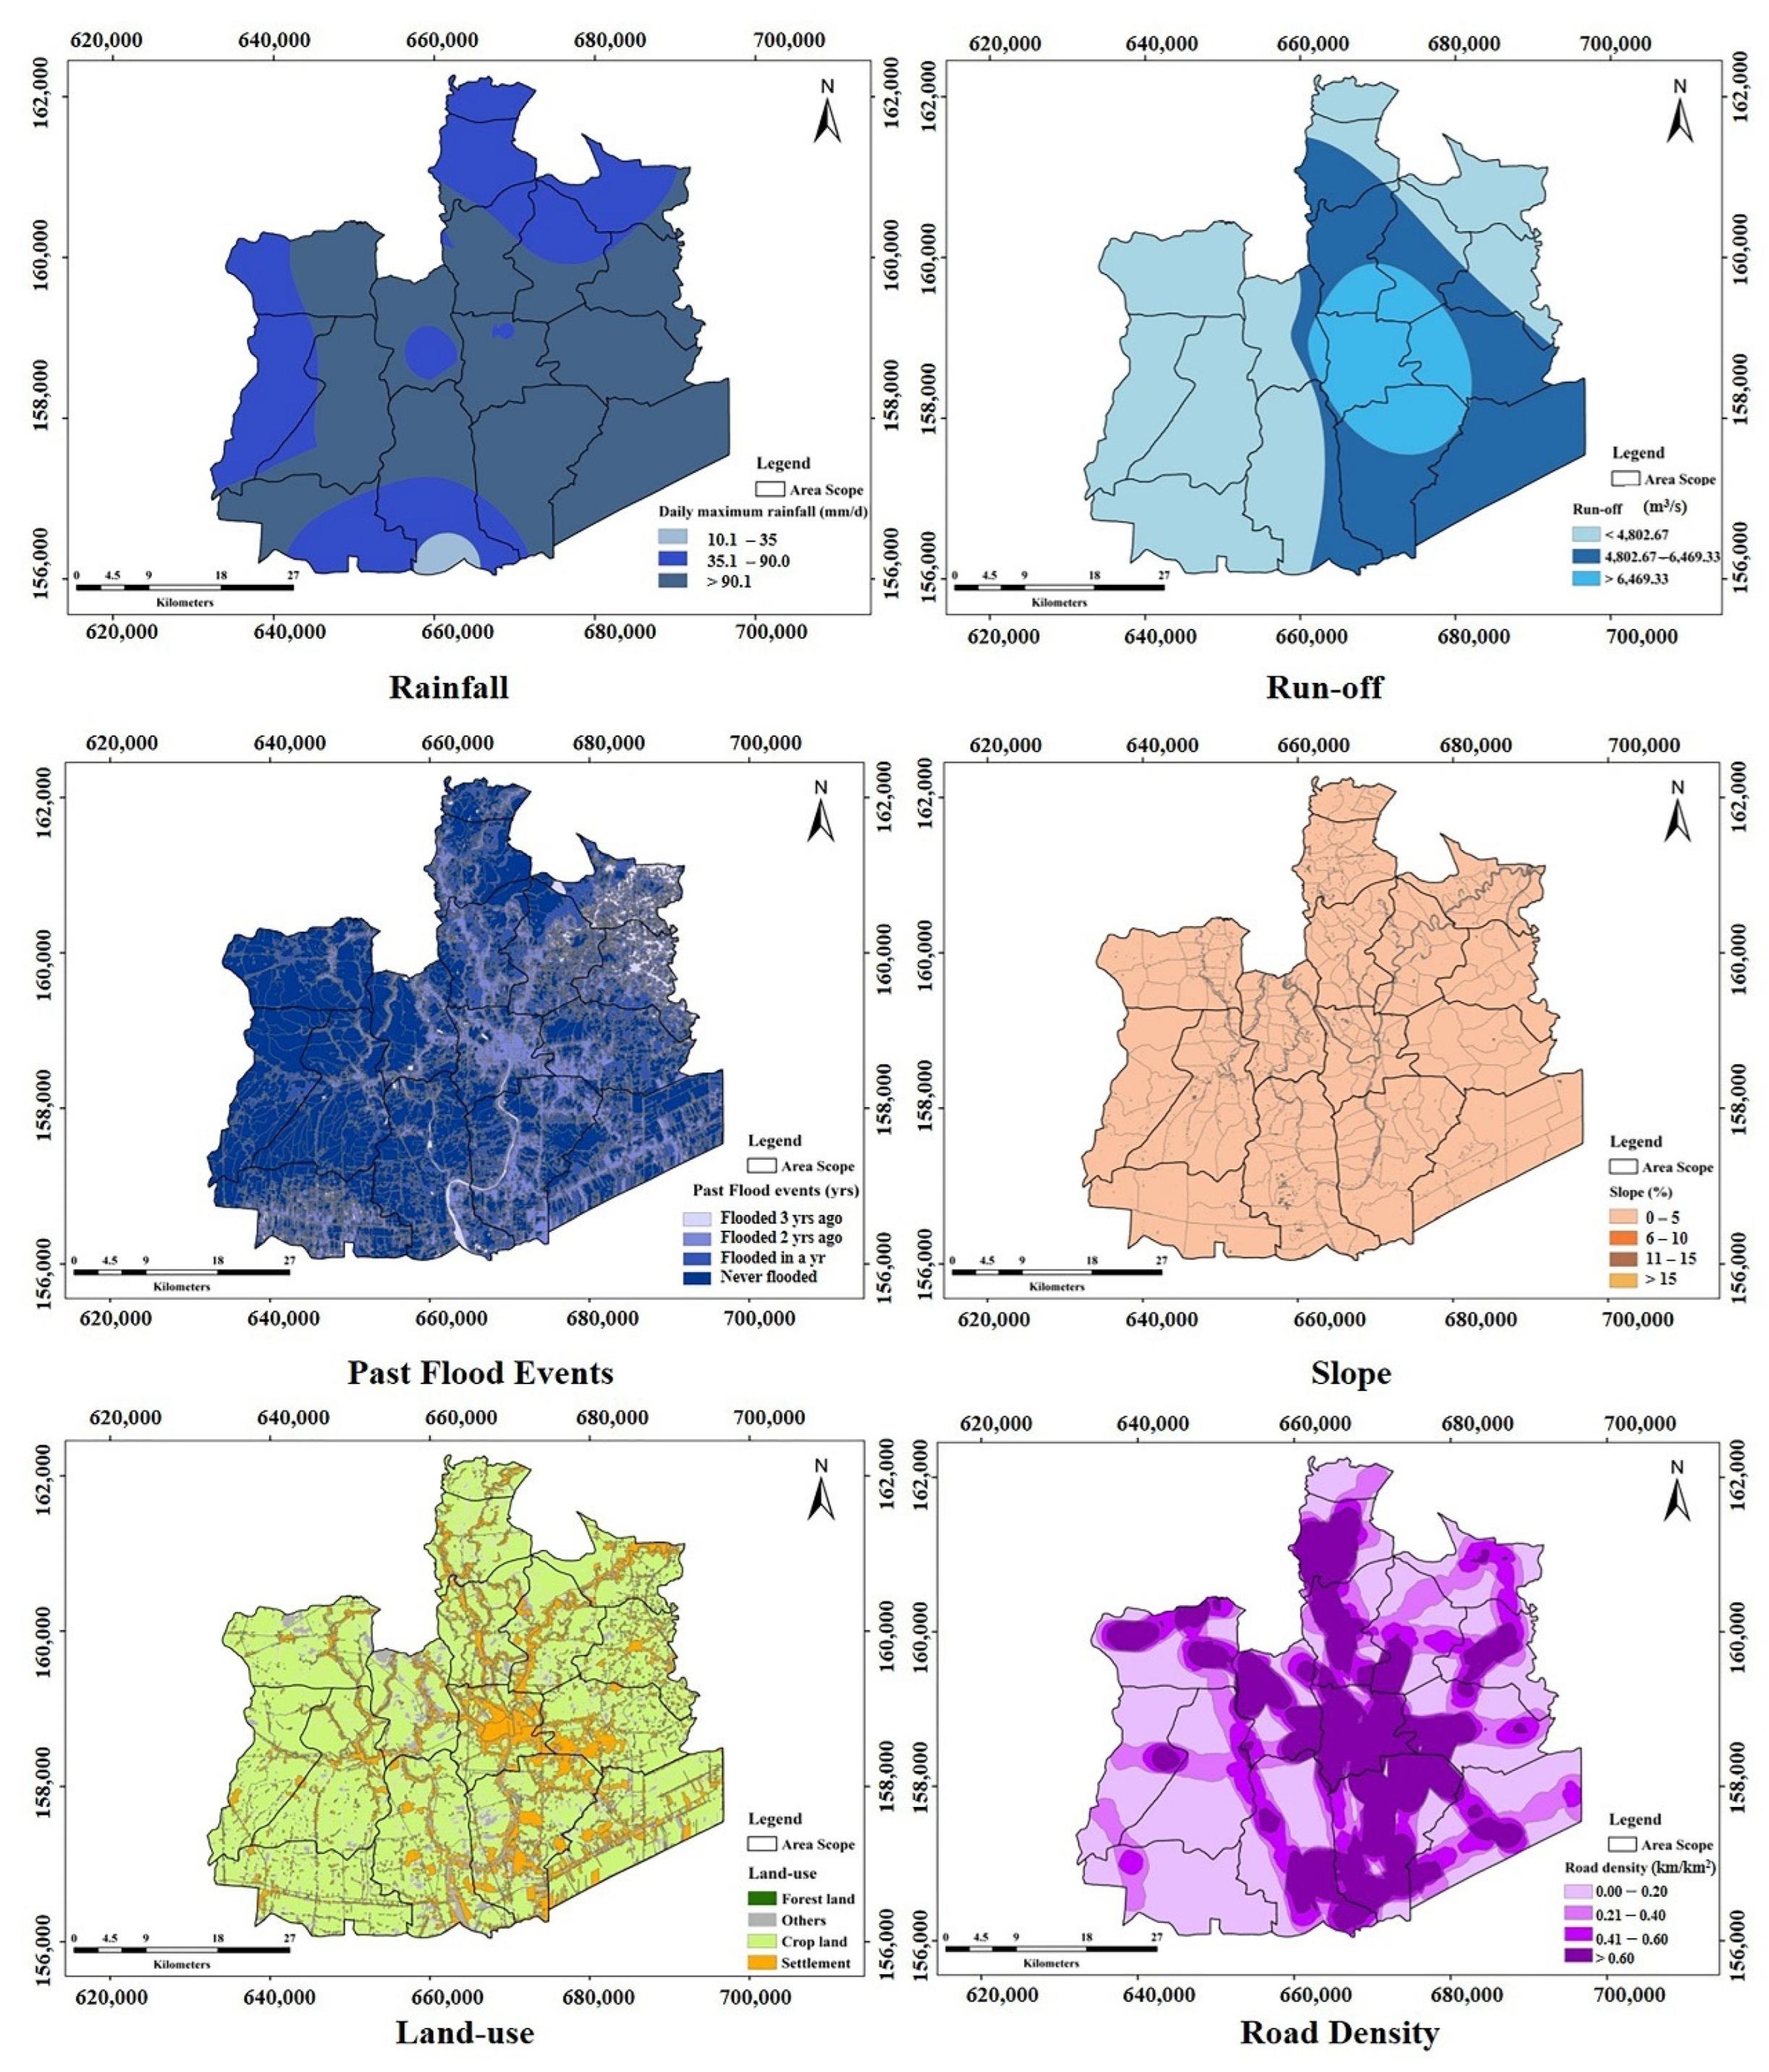
  • Proactive actions to support flood risk responses
Table 2. Spatial data and weighted ranking of all factors influencing flood risk in Ayutthaya Province, Thailand.
FactorsSources of DataWeighting Rank
Run-off (m3/s)Average annual run-off during 1989–2020, Royal Irrigation Department, Thailand0.3051
Land useLand Development Department0.2742
Daily maximum rainfall (mm/d)Annual maximum daily rainfall during 1989–2020, Thai Meteorological Department0.2113
Road density (km/km2)Department of Environmental Quality Promotion, Thailand Institute for Scientific and Technological Research (TISTR)0.1064
Past flood events (years)All previous floods during 2005–2019, Geo-Informatics and Space Technology Development Agency, TISTR0.0745
Slope (%)Topographic maps at the scale 1:50,000 and Royal Thai Survey Department, Office of Natural Resources and Environmental Policy and Planning0.0296
CR = 0.0930.
Table 3. Results of Spearman’s correlation coefficient between flood management strategies and preparedness actions.
Spearman’s Correlation CoefficientFlood Prepardness ActionFlood Hazard MappingFlood Warning InformationFlood Relief PaymentsFlood TrainingAccess to Emergency Health Services
Flood preparedness action1.000.0170.394 **0.0560.0190.035
Flood hazard mapping-1.000.124 **0.241 **0.428 **0.452 **
Flood warning information--1.00−0.140 **−0.089 *−0.029
Flood relief payments---1.000.489 **0.483 **
Flood training----1.000.538 **
Access to emergency health services---- 1.00
* p-value < 0.05, ** p-value < 0.01.
Table 4. Results of the AHP flood resilience assessment based on the modified UNDRR.
Flood Resilience AspectsFlood Resilience IndicatorsIndicative MeasurementAHP WeightsRanking
Organize flood disaster resilience
(0.107)
  • Disaster risk consideration in city planning
  • Local plans, including a range of actions and priorities for directly responding to current and forecasted disaster risks.
0.1073
Identify, understand, and use flood risk scenarios
(0.151)
  • Flood hazard assessment/knowledge of hazard/Hazard maps
  • Existence of recent flood hazards or presence of flood hazard maps.
0.1261
  • Knowledge of exposure and vulnerability
  • Existence of scenarios, setting out city-wide exposure and vulnerability to flood.
0.02513
Strengthen financial capacity for flood disaster resilience
(0.097)
  • Adequacy of financial planning for all actions necessary to achieve disaster resilience
  • Presence of financial plans with a set of priorities based on flood disaster resilience.
0.0974
Pursue resilient urban development and design
(0.062)
  • Land use zoning (i.e., potential population displacement and agricultural land at risk)
  • Database on percentage of population and agricultural land at risk of displacement due to flood.
0.0629
Safeguard natural buffers to enhance the protective functions offered by natural capital
(0.040)
  • Contribution of ecosystem services to the city’s flood disaster resilience
  • Ecosystem services (i.e., coastal wetlands, forestation, and watertables) are identified and managed.
0.04012
Strengthen institutional capacity for flood resilience
(0.052)
  • Availability of skills and experience in disaster resilience—risk identification, mitigation, planning, response, and post-event response
  • Availability of key skills, experience, and knowledge on city flood resilience (i.e., land planning, environmental, sanitation, water, and structural engineering).
0.05210
Understand and strengthen societal capacity for resilience
(0.150)
  • Effectiveness of community network
  • Frequency of organizational meetings at community level.
0.0805
  • Engagement of vulnerable groups in the population
0.0707
Increase infrastructure flood resilience
(0.072)
  • Water Sanitation: Water/sanitation loss factor/customer service days at risk of loss
  • Loss of service from the main water or sanitation (i.e., well or septic tank) systems for the city.
0.00915
  • Designated critical asset service days at risk of loss from water or sanitation failure
  • Critical water or sanitation assets are defined as essential for the operation of the water and sanitation systems in the city. Loss of service is assessed in comparison to the normal state, wherein potable running water is available in every house 24 h/d.
0.02014
  • Road—service from road system at risk of loss
0.04311
Ensure effective flood disaster response
(0.189)
  • Existence and effectiveness of early warning systems
  • Reliability of flood disaster warnings that enable practical actions to be taken.
0.0648
  • Existence of emergency response plans that integrate professional responders and community organizations
  • Existence of emergency flood response plans by all relevant actors.
0.1252
Expedite flood recovery and building back better
(0.080)
  • Planning for post-event recovery and lessons learned
  • Existence of comprehensive post-flood event recovery.
0.0806
Publisher’s Note: MDPI stays neutral with regard to jurisdictional claims in published maps and institutional affiliations.

