Article

Assessing Hydrological Cost-Effectiveness of Stormwater Multi-Level Control Strategies in Mountain Park under the Concept of Sponge City

1
School of Architecture, Southeast University, Nanjing 210096, China
2
School of Civil and Environmental Engineering, Nanyang Technological University, Singapore 639798, Singapore
3
College of Architecture and Urban Planning, Guangzhou University, Guangzhou 510006, China
*
Authors to whom correspondence should be addressed.
Water 2022, 14(10), 1524; https://doi.org/10.3390/w14101524
Submission received: 6 April 2022 / Revised: 6 May 2022 / Accepted: 9 May 2022 / Published: 10 May 2022
(This article belongs to the Section Urban Water Management)

Abstract

:
Within the concept of sponge city in China, green stormwater measures have been widely used in urban mountain parks. This study provides an integrated assessment framework for hydrological cost-effectiveness in the Nanjing Guanyao Mountain Park under various precipitation scenarios. A grey drainage basic strategy and four multi-level control strategies with progressively increasing graded interception or storage facilities at mid-and terminal levels were designed and evaluated. Results show that the multi-level interception and storage strategy (S4) proved to be the most beneficial, followed by the multi-level interception strategy (S2) having slightly lower results than the multi-level storage strategy (S3), while the terminal strategy (S1) showed poor results. However, the hydrological cost-effectiveness exhibits the opposite trend under 2–5-year storms. A high multi-level strategy limited by life-cycle costs may not impart high hydrological cost-effectiveness in response to each return period of storms in this mountain stormwater practice. This study validates the hydrological performance and cost-effectiveness of multi-level distributed strategies in an urban mountain park, bridges the limitations of the previous studies on single scheme design and hydrological performance assessment for sloped sites, and provides a technical reference and design basis for similar studies and practices.

1. Introduction

The combination of climate change and urbanization poses significant challenges to conventional stormwater systems, resulting in frequent waterlogging and heavy flooding in urban areas [1]. In China, due to expanding impervious areas [1,2], irrational land development [3,4], and backward stormwater infrastructure [4,5], hundreds of cities suffer from waterlogging every year, causing enormous property damage and social impact [6]. To mitigate these severe problems, in December 2014, the Chinese government proposed a new concept for integrated urban stormwater management named Sponge City (SC) to build a Low Impact Development (LID) system [6,7]. Under the guidance of The Technical guidelines of the SC-LID System issued by the Ministry of Housing and Rural-Urban Development [8], SC-LID practices gradually extended from the design of LID facilities [9], sponge parks [10], sponge communities [11], and sponge roads [12] to a comprehensive urban stormwater management strategy [13], which was incorporated into city master planning and design [14]. However, the implementation of SC-LID has encountered several challenges and barriers. One of the most challenging factors is the lack of an integrated framework to analyze, plan, model, and assess SC practices [15,16]. Many SC projects paid more attention to current maximum hydrological performance and ignored the long-term maintenance and cost investment after the works [6,7], which may result in significant financial investment in the early stages and higher pressures on the later operation and management [16,17]. From the viewpoint of construction and operation, the SC construction requires a combination of various aspects, including initial input, scheme pre-assessment, and long-term functionality and good landscape in later years.
Landscape architecture planning and design, as one of the professions coordinating the sustainable development of human habitat [18], plays an equally important role in hydrological regulation and sponge landscape design [6]. Urban mountain parks are established based on the original mountain landscape in urban construction areas. As an essential natural resource for the built environment and green space systems, urban mountains have been a critical area for urban flood control and drainage, ecological restoration, and landscape planning [19,20]. However, in China, mountain stormwater management commonly took grey drainage or hydraulic engineering measures to regulate drainage runoff over a long period [21]. These have changed the mountains’ ecological properties and natural hydrological processes and increased the pressure on flood and drainage to built-up areas downstream. With the promotion of the SC-LID concept, ecological methods began to be widely used in mountainous cities sponge system planning [22], urban mountain flood control design [23], mountain park and water landscape design in China [24,25], as well as proposed series of design methodologies, to fit mountain natural hydrological processes. Cheng et al. [24] and Zhang et al. [25] provided a terminal storage scheme integrated into water landscape design based on the analysis of mountain hydrological processes. Liu et al. [20] analyzed different types of mountain parks in Chongqing and provided a series of stormwater control strategies based on catchment hydrological characteristics. The above studies provided various design strategies for hydrological control of mountain parks from the perspectives of hydrology or landscape. However, most of them failed to further research the hydrological performance and its comprehensive benefits. As with most landscape and sponge practices, the combined benefits of different design strategies in mountain parks have not been sufficiently evidenced.
LID approaches have been widely recommended as an alternative to traditional stormwater design and can effectively promote infiltration [26], reduction in runoff [27,28], and pollutant capture of runoff [29,30] depending on their structural facilities. One of the critical research issues is the effect of the configuration and location of LID facilities on hydrological performance [31]. Related studies [32,33,34] have shown that distributed and small-scale LID facilities could effectively reduce and delay peak runoff. Concentrated and large-scale LID facilities play a crucial role in controlling total outflow. Appropriate LID configuration and layout can achieve the goal of water quantity and quality control from sources to terminals [28] to optimize hydrological performance and cost-effectiveness [31]. Similarly, these approaches of source distribution and end concentration apply to urban stormwater management and mountain or slope areas [35,36,37]. Hou et al. [38] proposed a multi-level design strategy based on mountain park practice for upstream, midstream, and downstream hydrological characteristics. Yuan et al. [19] used SWMM to model and compare the stormwater effects of the two LID schemes of segmental detention and terminal detention, showing that the segmental detention scheme has more advantages in hydrological performance. However, it is essential to note that LID facilities do not play a significant role in reducing flooding in mountain areas or low-lying areas [37]. Most practices in urban mountain areas require a combination of LID approaches and municipal engineering measures to ensure storage and drainage safety.
Based on the above considerations, an evaluation framework based on the stormwater modelling and life-cycle cost (LCC) analysis method was applied to undertake integrated assessments of LID practices to support robust decision-making [39]. Wang et al. [40] used LCC methods to assess the hydrological performance and cost-effectiveness of different structures of bioretention facilities under various climate change scenarios. Wang et al. [41] evaluated the impact of varying levels of LID practices on hydrological performance and cost benefits on a site scale. Liu et al. [42] evaluated the hydrological cost-effectiveness of three different intensity LID strategies in mountain parks. The results showed that the low-intensity LID strategy was advantageous, mainly because of the cost limitation and the more extensive range of these strategies. It can be observed from these studies that integrated hydrological cost-benefit assessments are not commonly applied in mountain parks but have been partially progressed in LID practices. Most of them generally focus on the impact of an LID facility structure or different LID levels on integrated benefits. The results indicated that a high-level LID practice might not consistently achieve optimal cost-effectiveness, even though it performs good hydrological performance. It is necessary to consider different strategies and layout of facilities, and the same needs to be further explored in the complex geographical conditions of urban mountain parks.
During the design practice of Guangyao Mountain Park in Nanjing, the authors encountered the same issues mentioned above, including the choice of distributed or concentrated LID methods, measurement of hydrological benefits and cost-effectiveness, and long-term sponge facility operation. Because the hydrologic performance of different strategies and the impact of long-term costs on the combined benefits cannot be clarified before implementation, this study continues this previous research [38] by combining hydrological performance with LCC to build an evaluation framework for a comprehensive assessment of the multi-level control strategies in Guanyao Mountain Park models and assesses the hydrological performance of these strategies and cost-effectiveness under various precipitation scenarios. The pre-assessment results of this study will provide robust evidence for Guangyao Mountain Park design and may provide technical references and design basis for similar slope land LID practices.

2. Materials and Methods
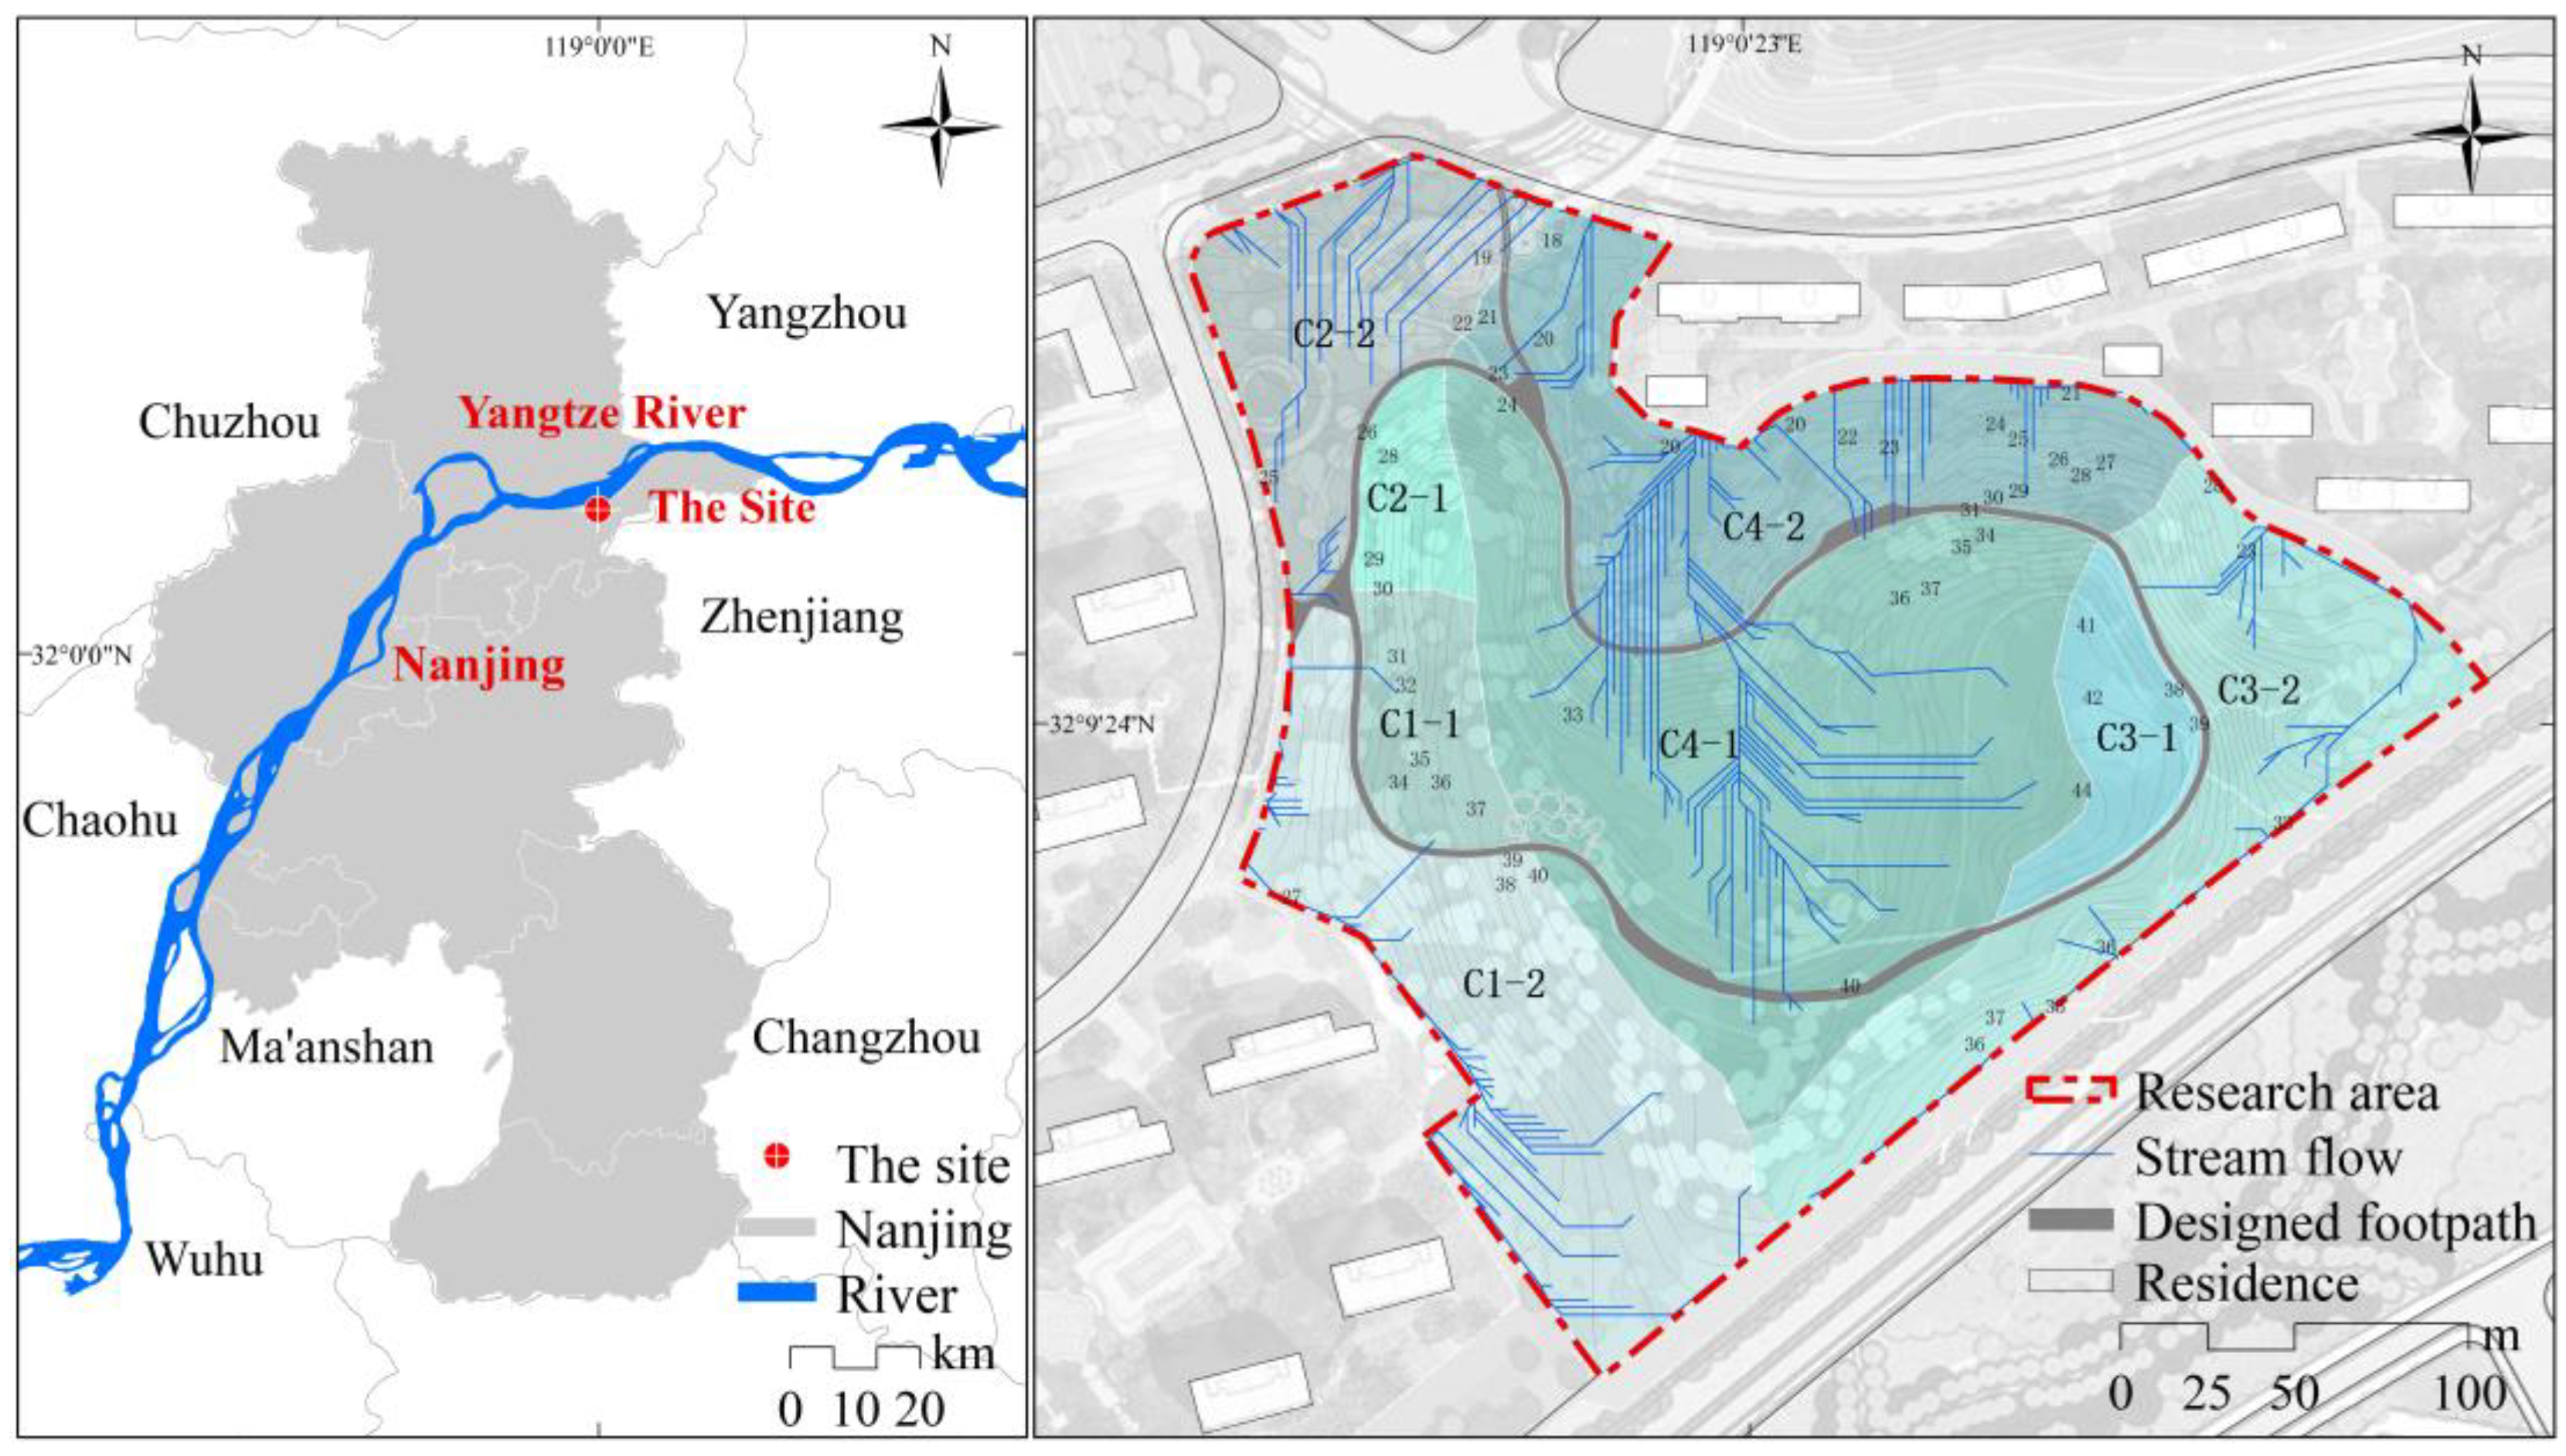
This study provides an integrated assessment framework based on hydrological performance modelling and LCC analysis to evaluate comprehensively hydrological cost-effectiveness. As shown in the technical route of Figure 1, the assessment framework consists of two main parts, one is the scenario design of precipitation events and multi-level strategies, and the other is the evaluation of hydrological performance and cost-effectiveness, as well as their integration to obtain the result of hydrological cost-effectiveness. A basic strategy (BS) and four multi-level control strategies (S1, S2, S3 and S4) for stormwater management in mountain parks were first designed and 24 precipitation scenarios corresponding to 2 h and 6 h rainfall events with 2–100-year return periods were simulated. The hydrological performance and LCC for each strategy under various precipitation scenarios were evaluated through the SWMM [43] and the LCC analysis method [44]. Lastly, the hydrological performance and LCC results were integrated in practical and economic terms to assess the comprehensive hydrological cost-effectiveness.

2.1. Study Area

Nanjing Guanyao Mountain Park locates in Qixia District, Nanjing (32°09′ N, 119°00′ E), the downstream of the Yangtze River in Jiangsu Province, eastern China. It is adjacent to Qixia Mountain in the west and the Yangtze River in the south, with a total area of 74,000.00 m2. Between 2019 to 2021, it was built into a mountain park, integrating eco-protection and recreation according to superior planning. This project started at the time of the prevalence of sponge city construction projects. At that time, researchers found that numerous studies were generally focused on settlements, roads or parks, while fewer studies were conducted on mountains or slope areas. For this reason, Guangyao Mountain Park was selected as a case study to pre-assess the combined hydrological cost-effectiveness of different design schemes.
Based on the natural topography and the overall plan of the mountain park, four sub-catchments were defined by the elevation model, using the hydrological analyses extension in Arcmap10.2. In order to avoid the impact on the consistency of surface hydrological characteristics before and after the landscape and road design [45,46], the four sub-catchments had to be further divided based on the spatial distribution of design elevations, multi-level roads and footpaths, and drainage facilities. As shown in Figure 2, eight sub-catchments (C1-1 to C4-2) were eventually subdivided, and their characteristics are shown in Table 1. Each sub-catchment was mainly covered by woodland and grassland, with an average slope of 20%.

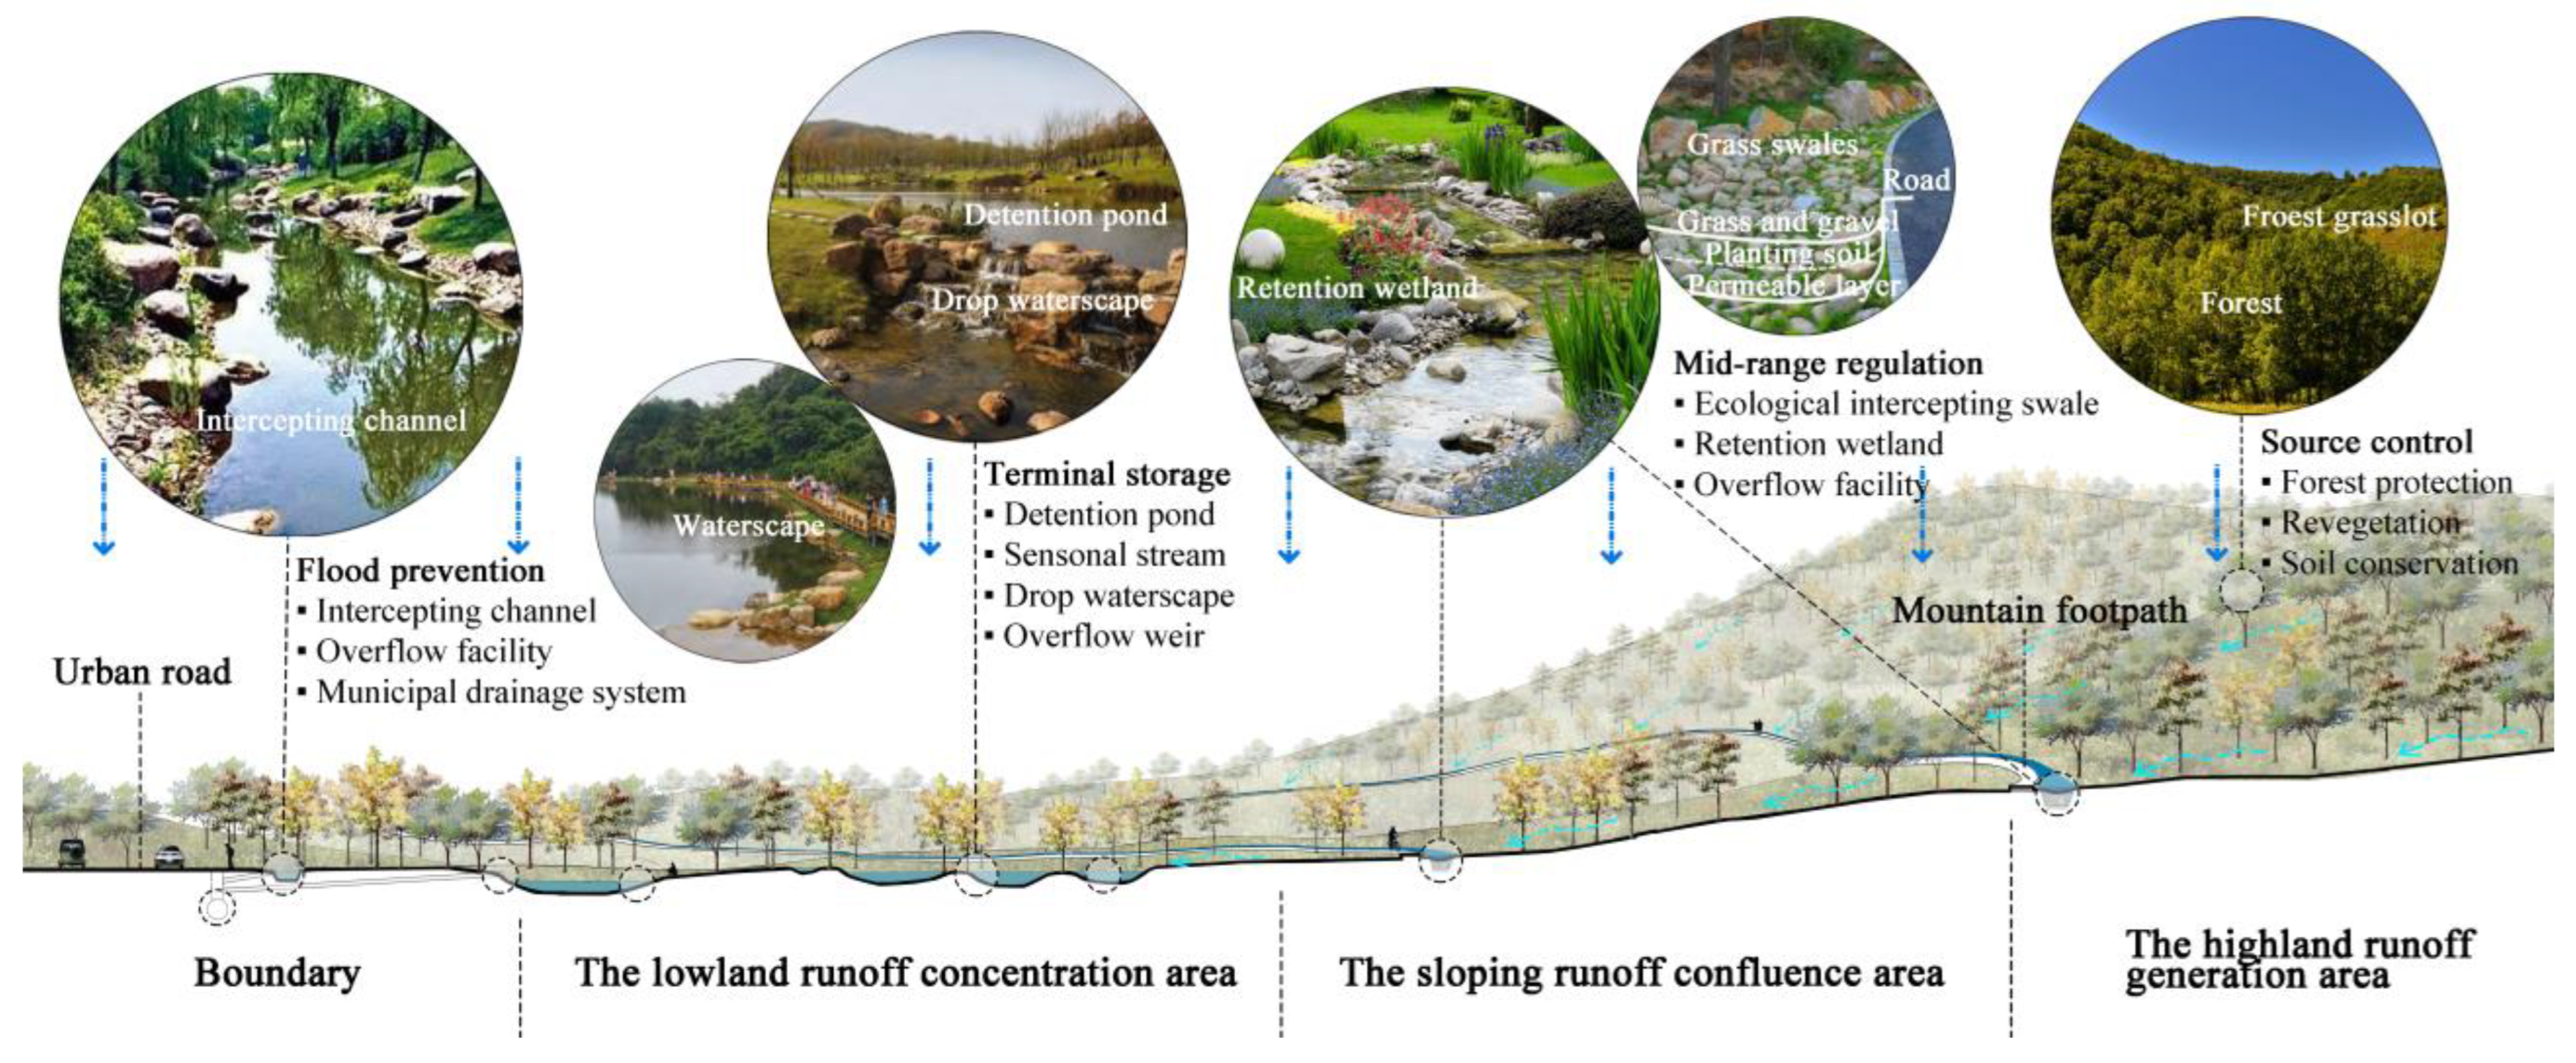
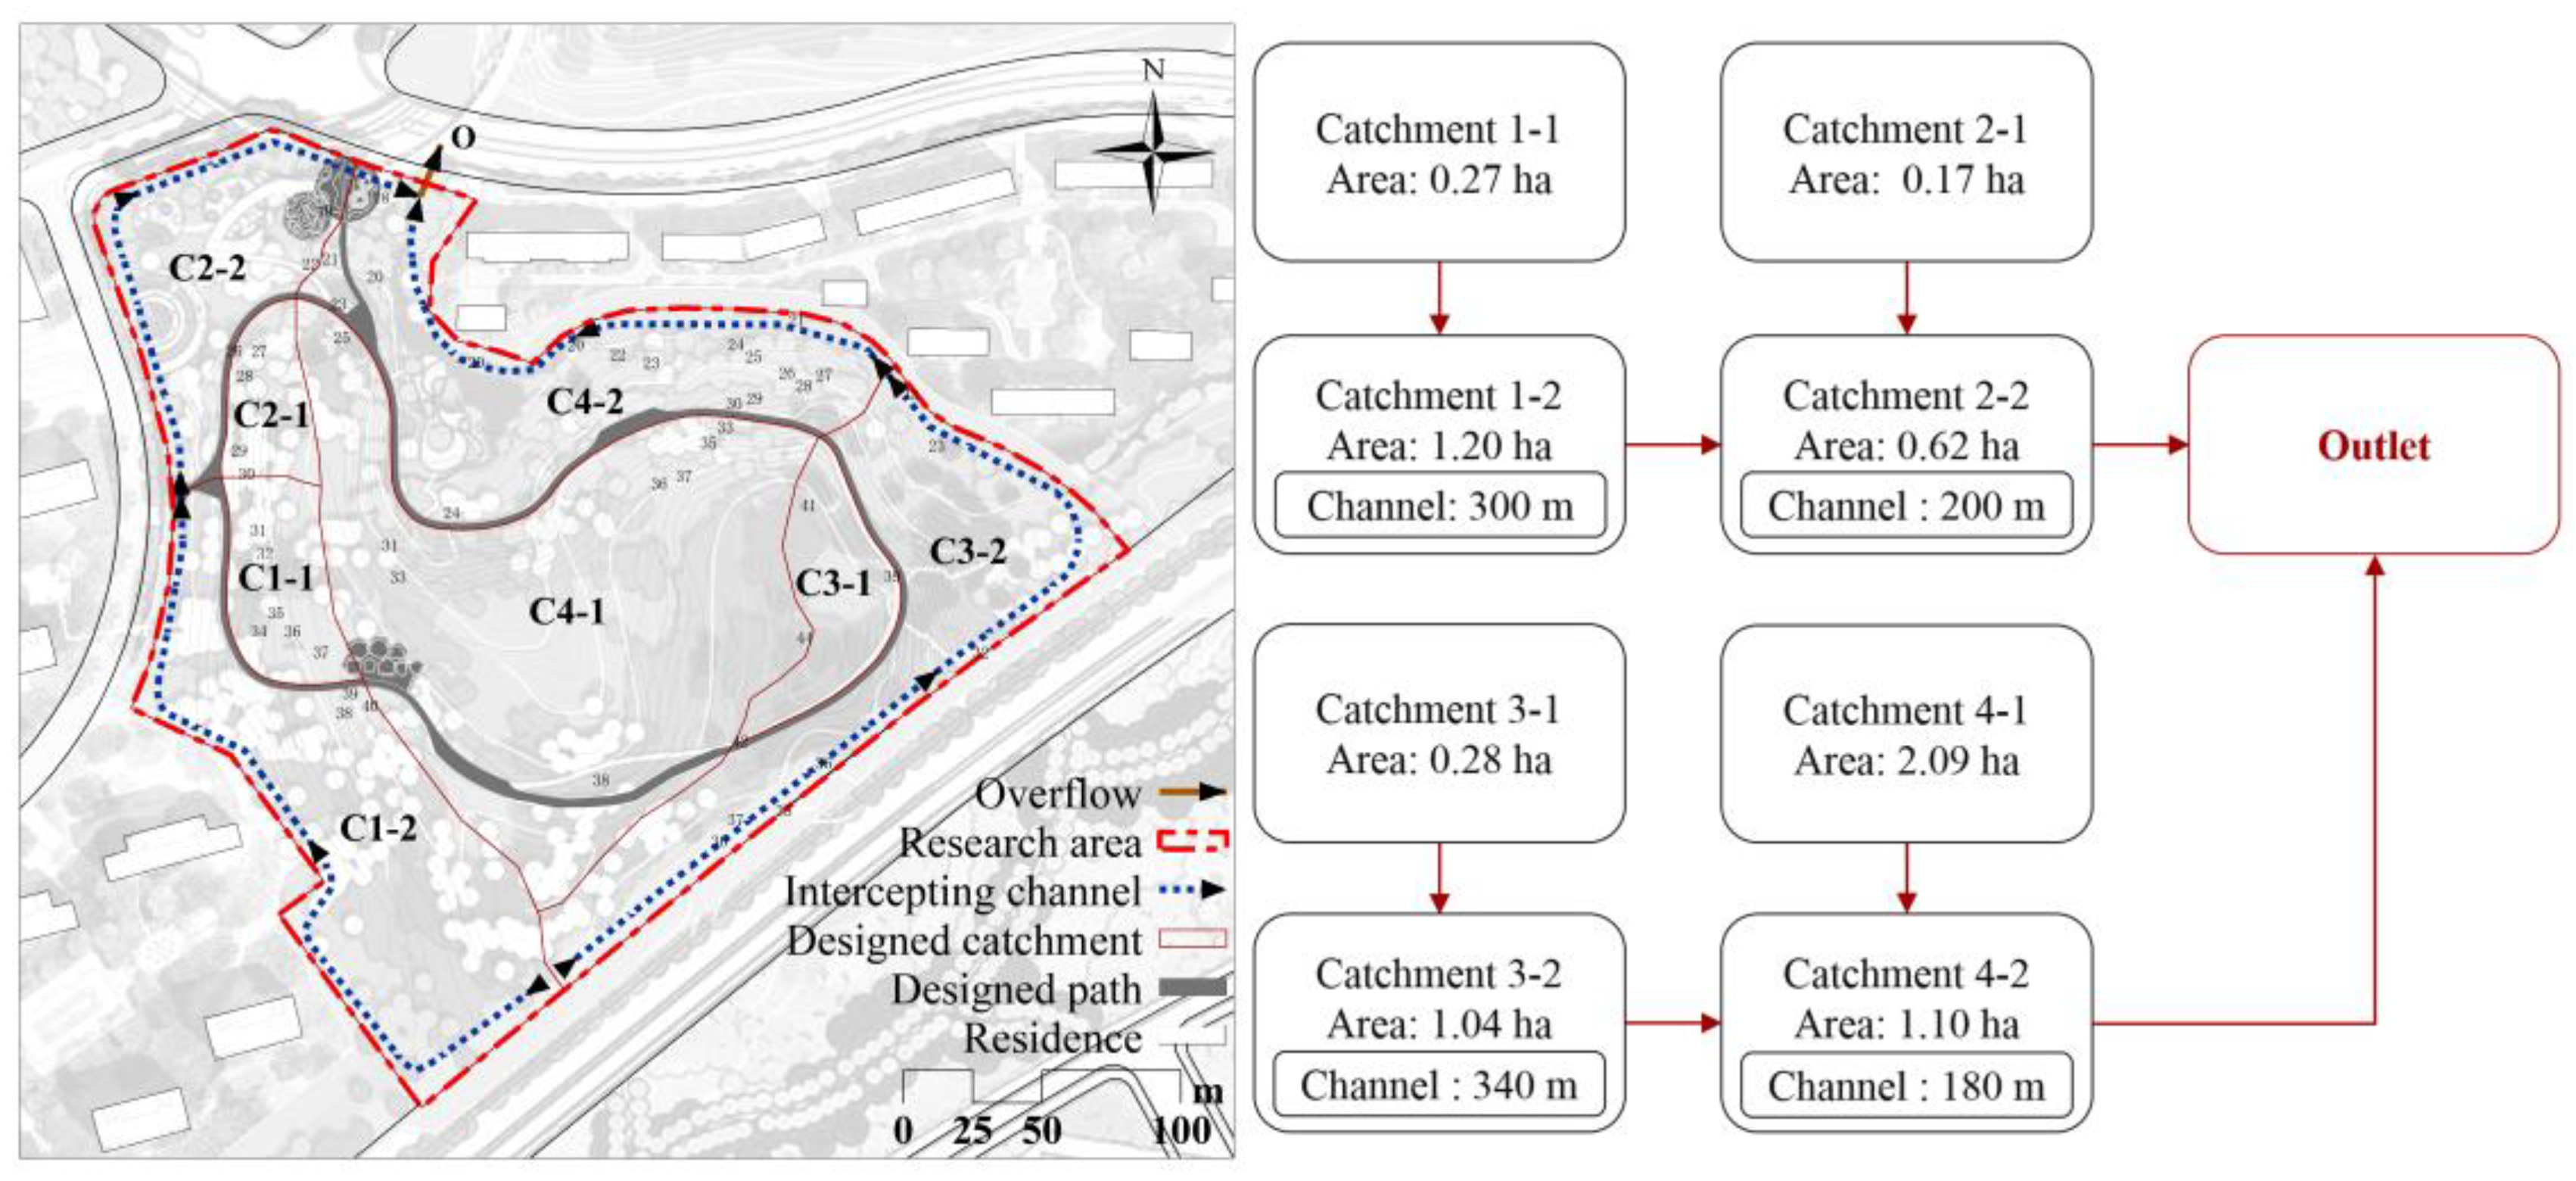
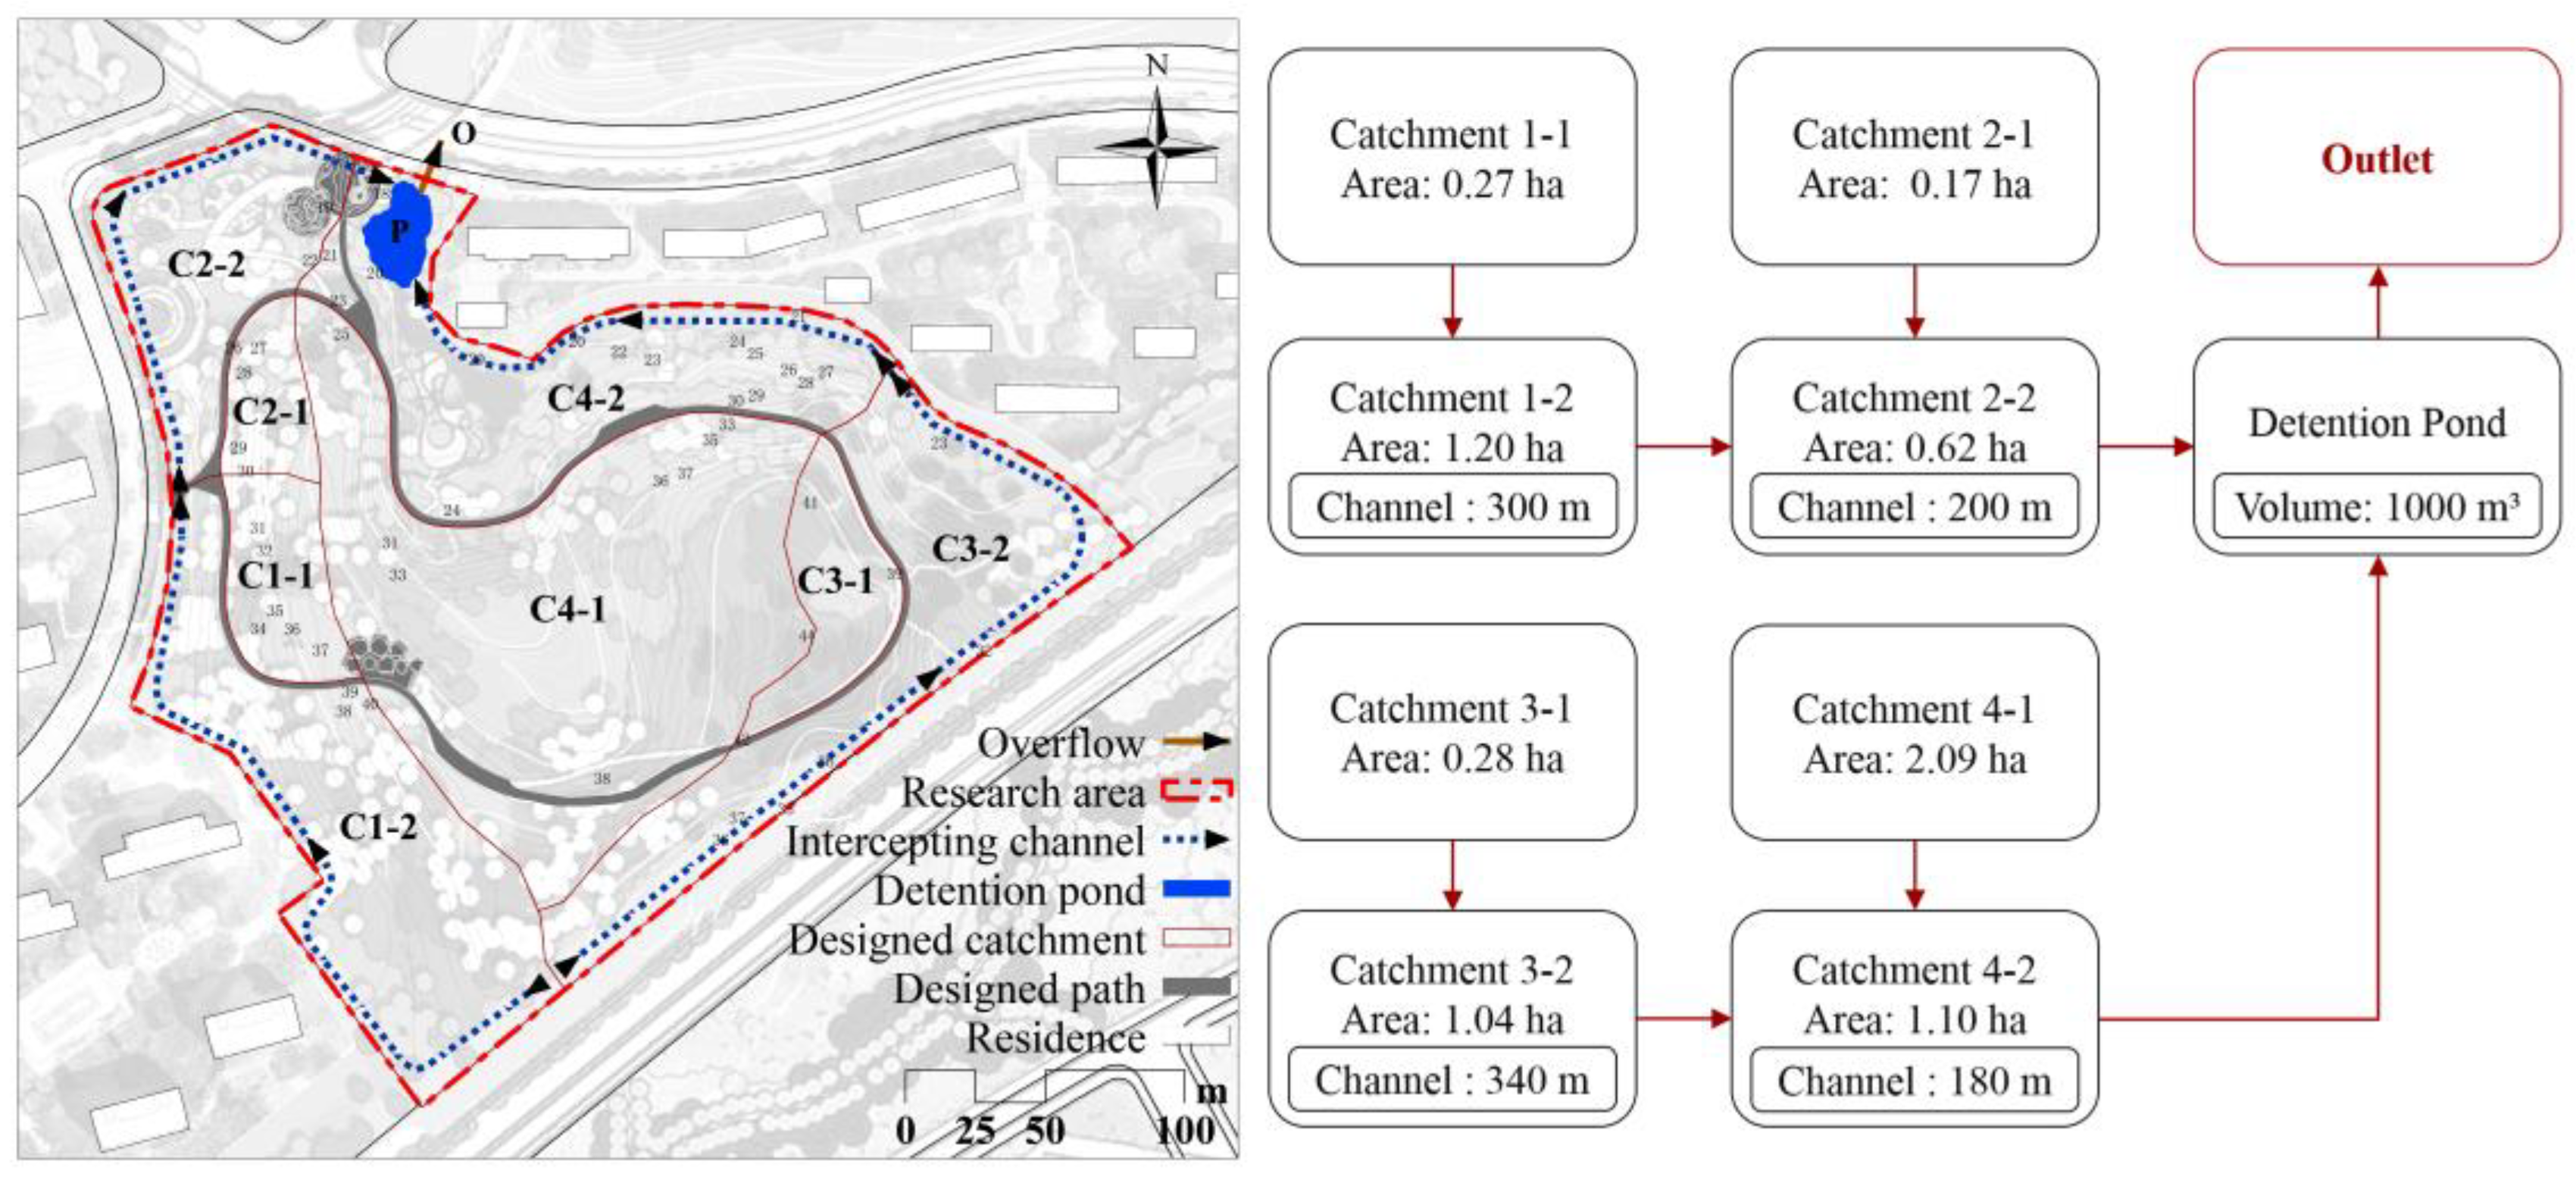
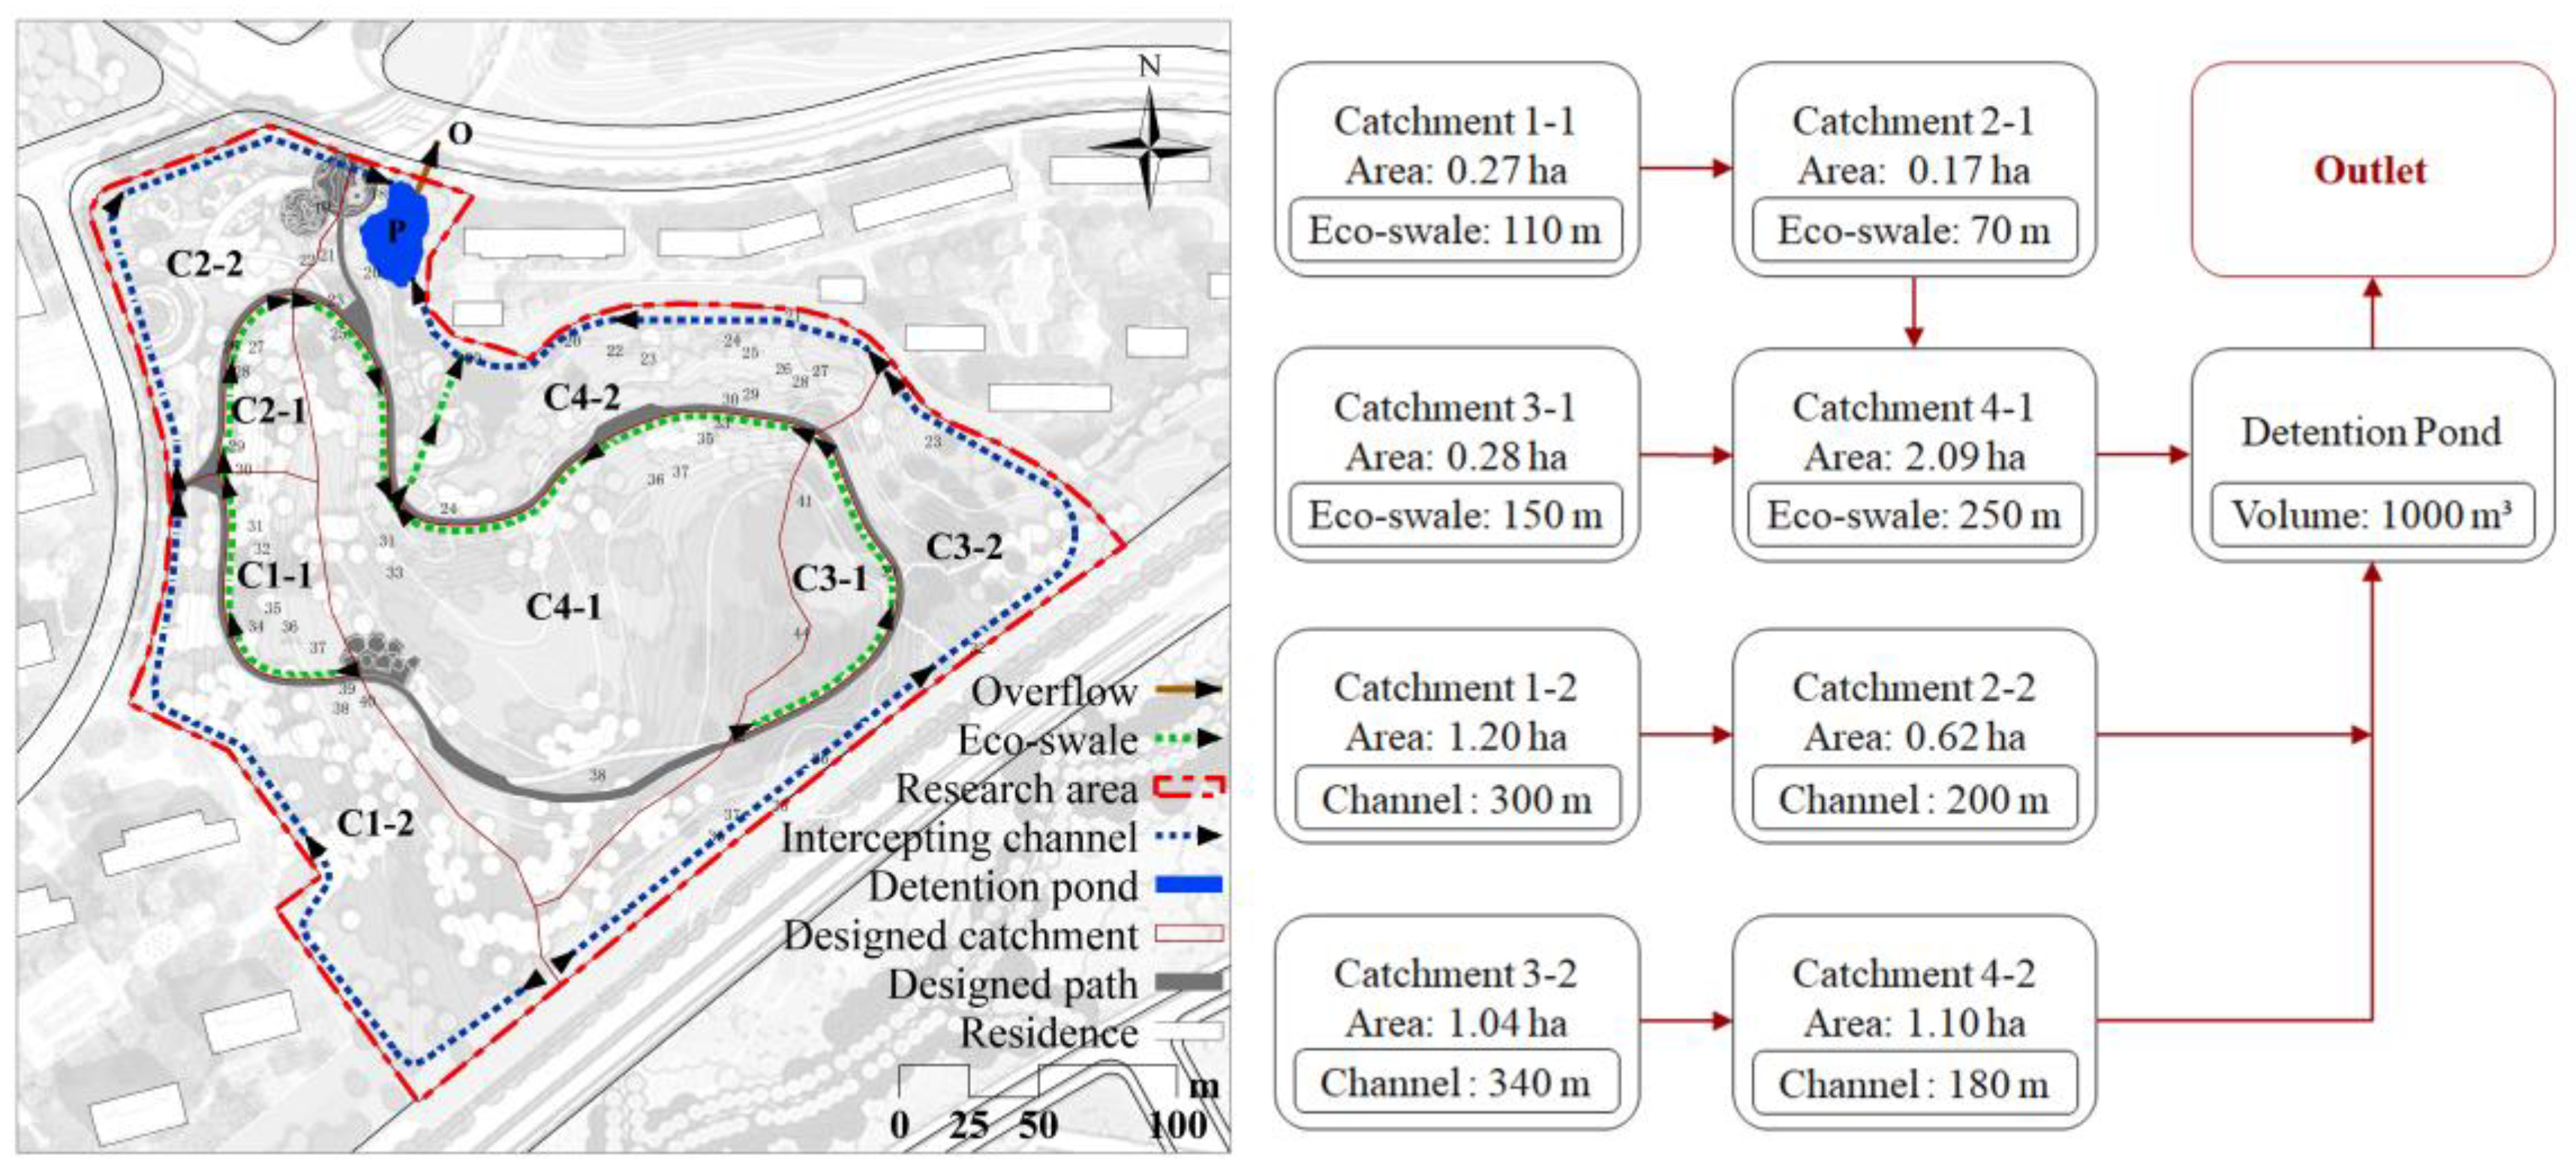
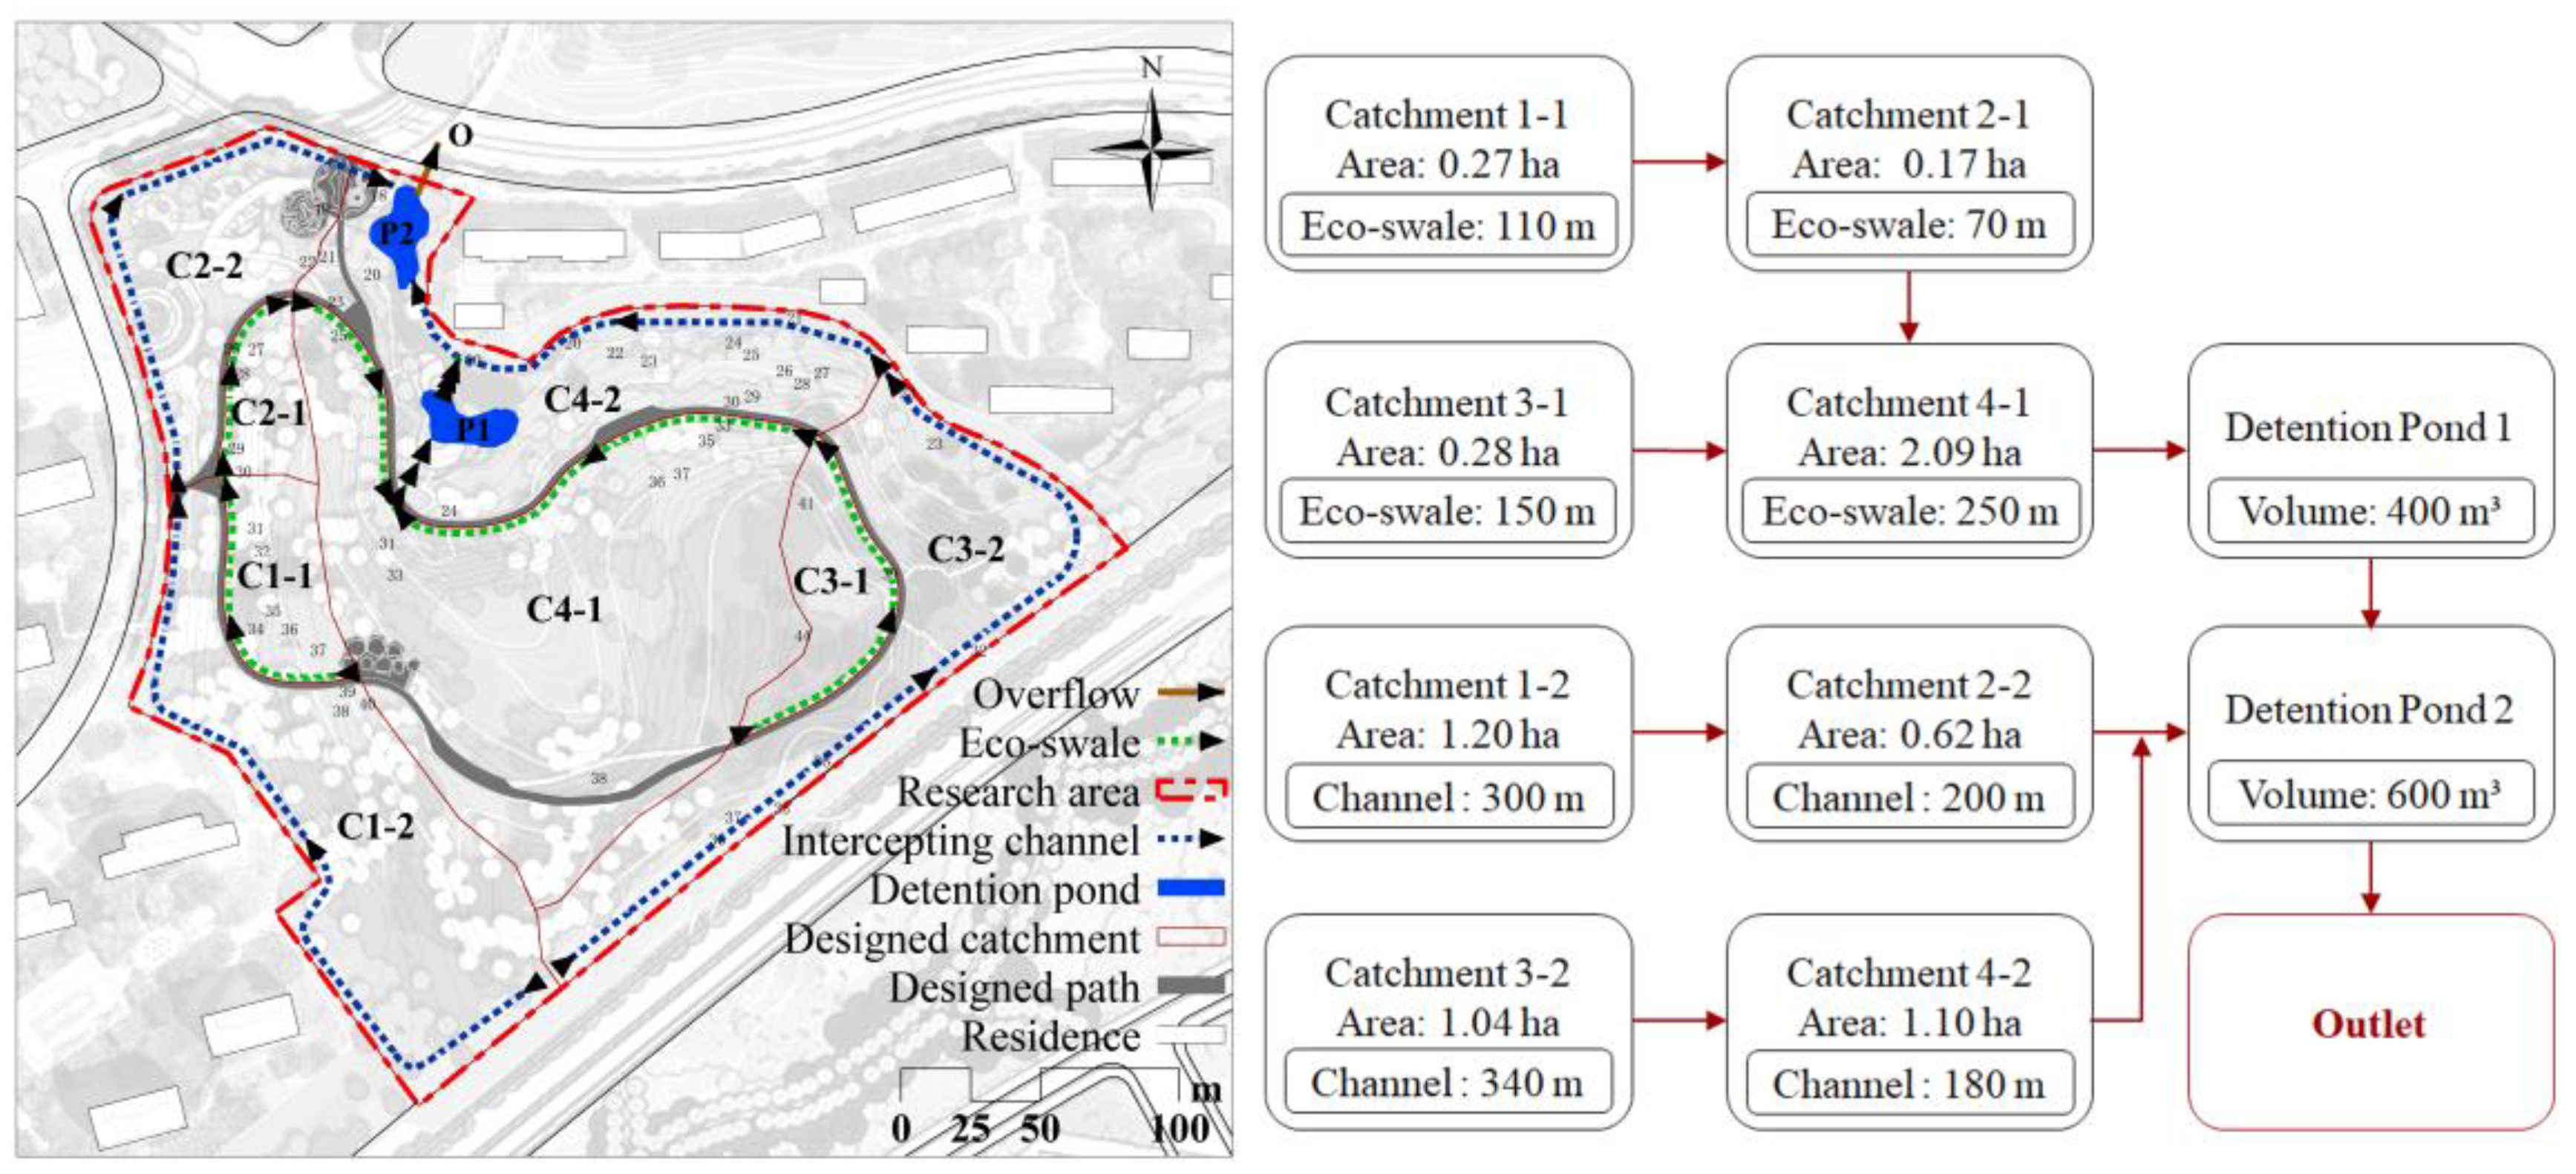
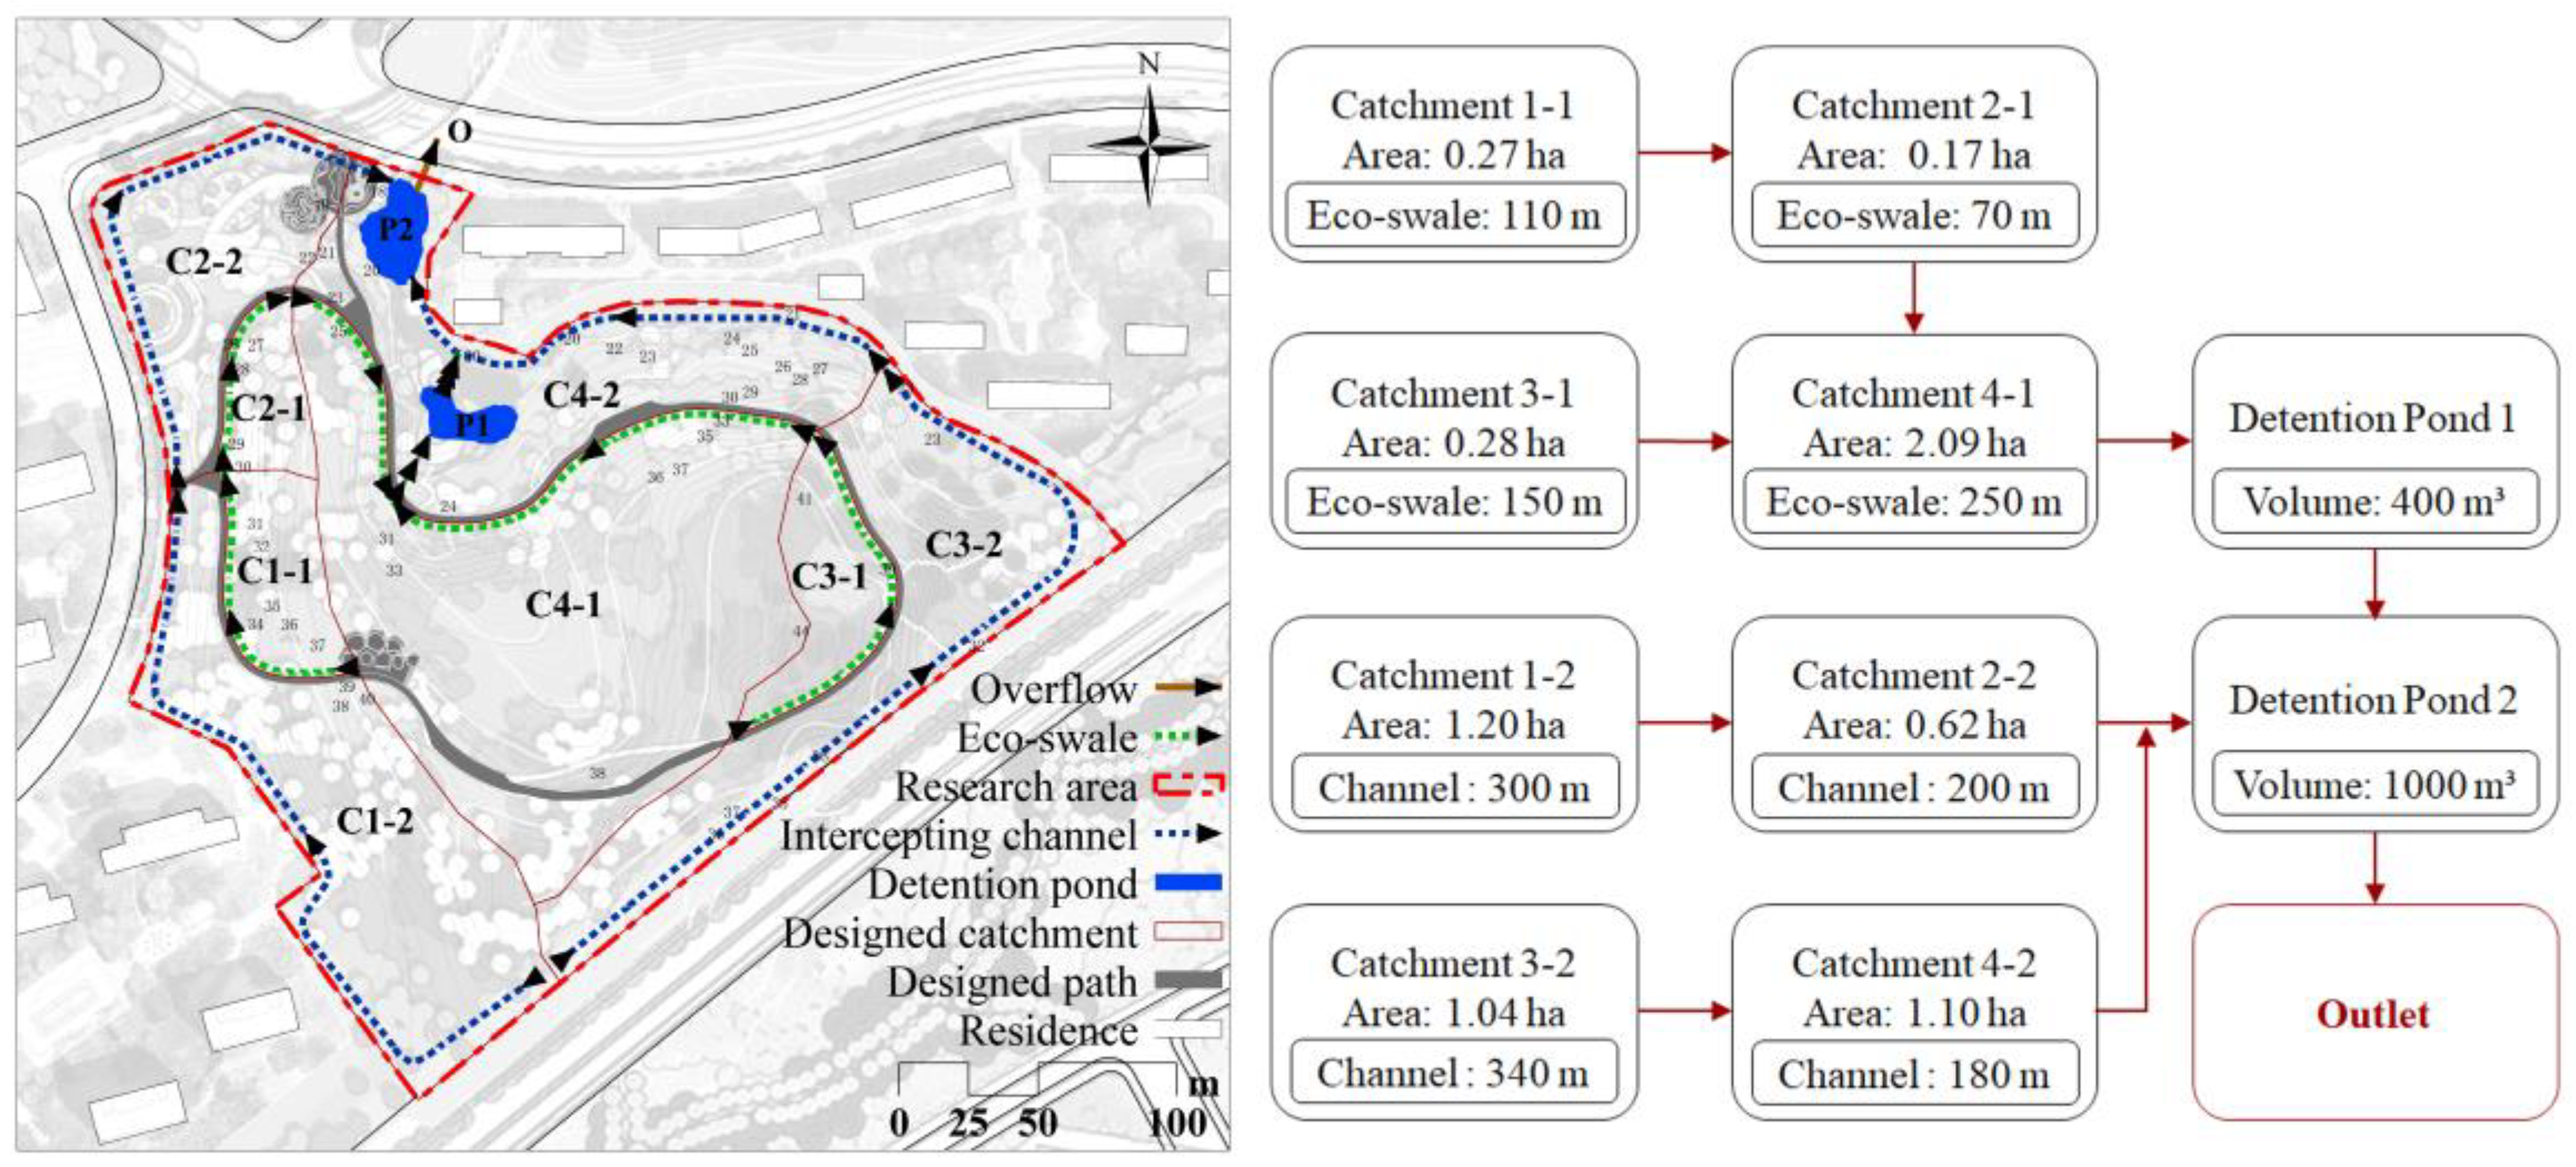
2.2. Multi-Level Control Strategies
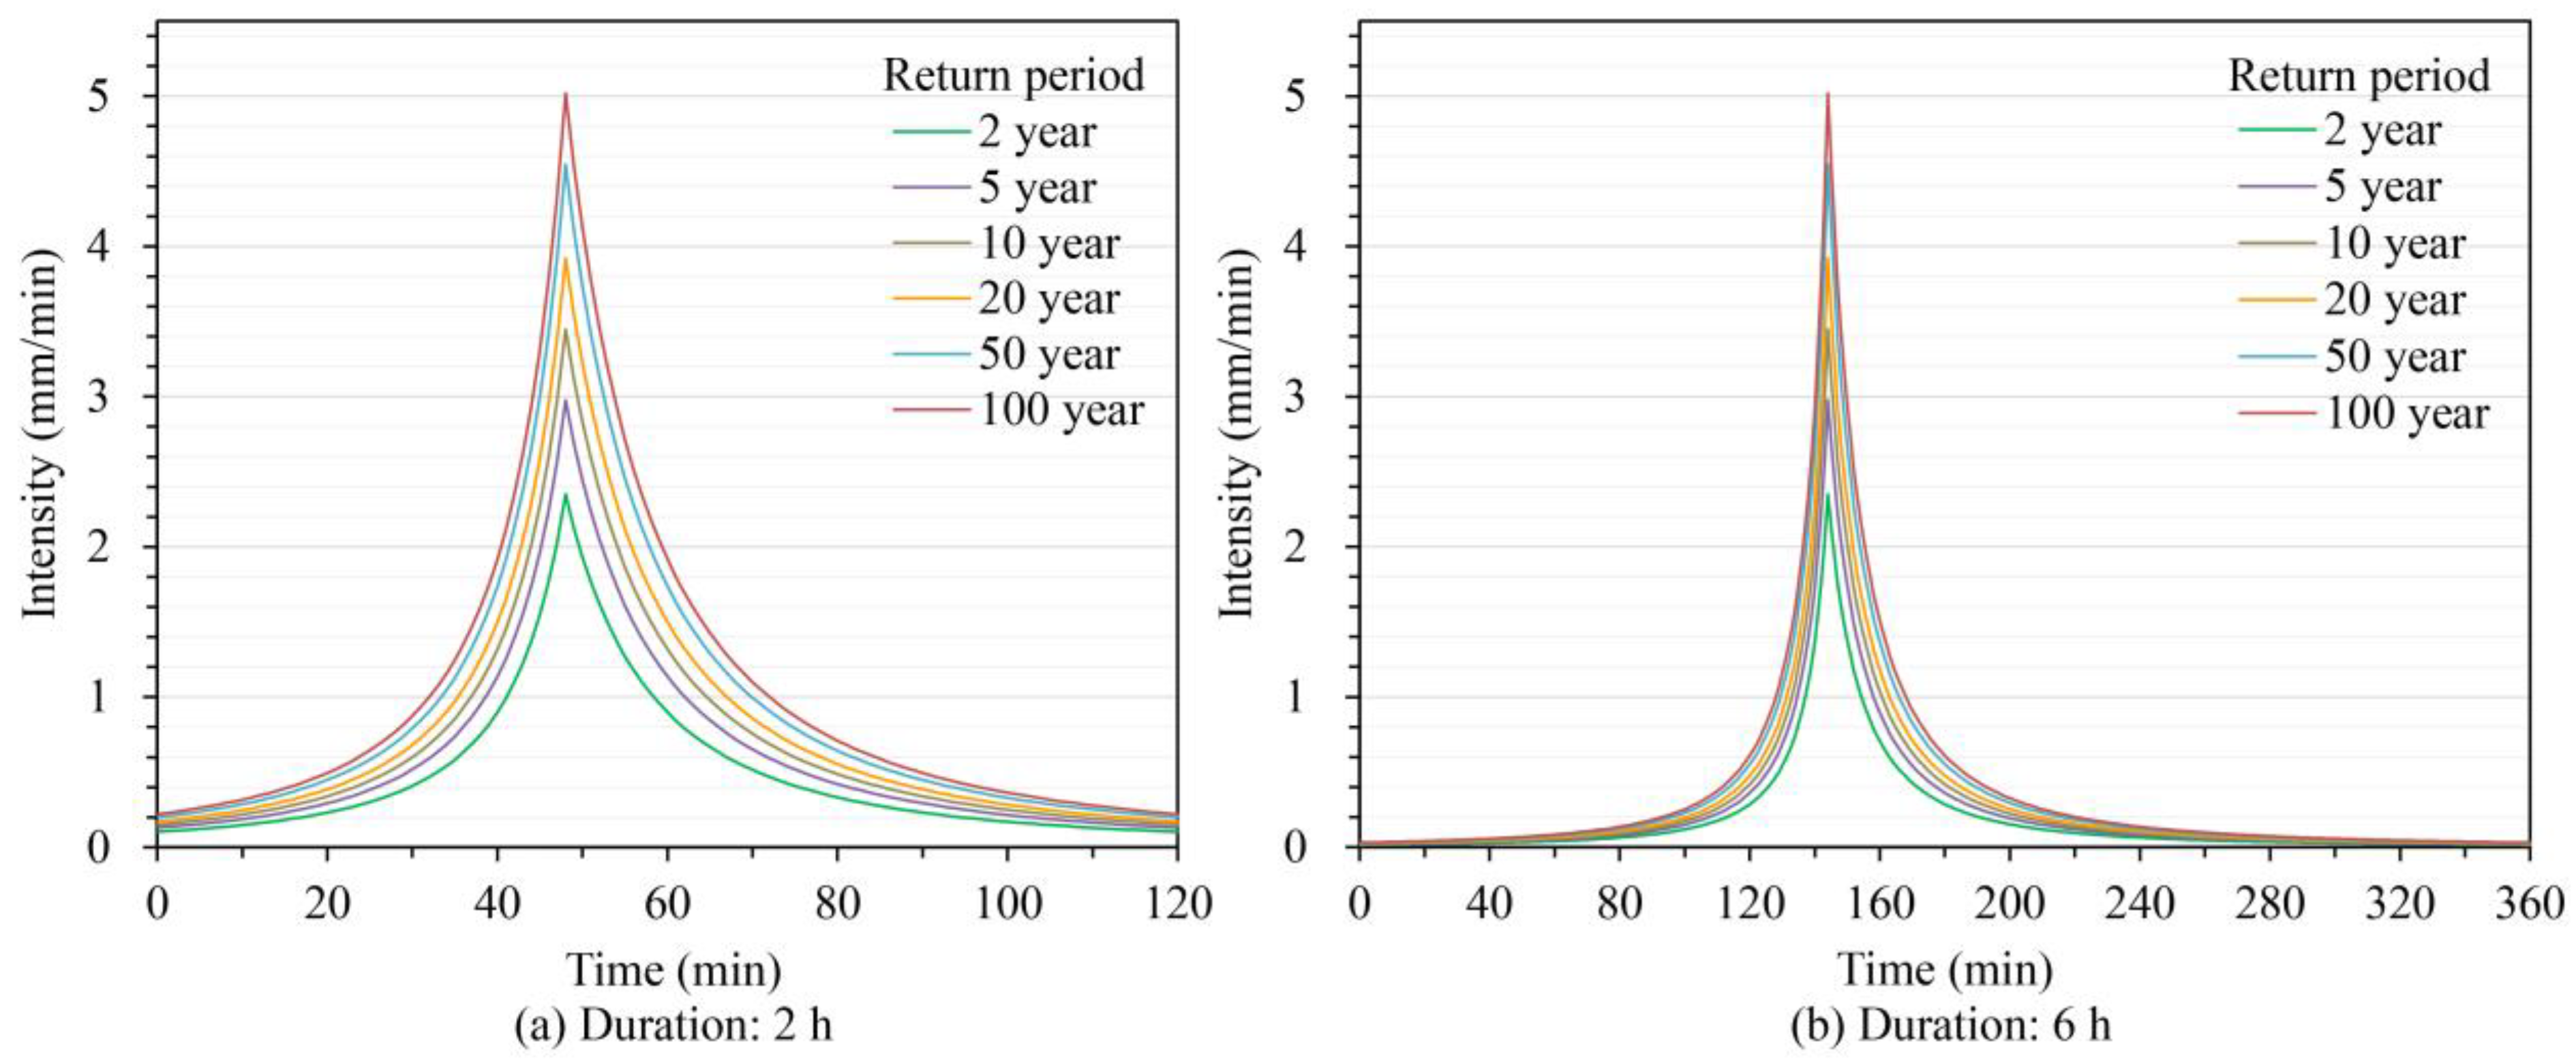
In the process of landscape and LID design practice in Guangyao Mountain Park, researchers first divided the mountain into three levels of stormwater control areas: the highland runoff generation area, the sloping runoff confluence area, and the lowland runoff concentration area (Figure 3), based on on-site investigation and hydrological characteristics at different elevation levels. The highland runoff generation areas are sources of runoff generation and are suitable for enhancing the in situ control capacity of runoff infiltration and retention by increasing permeable surface ratio and vegetation richness. The sloping runoff confluence areas are where runoff begins to converge and are appropriate for adoption of linear or distributed facilities to adjust short-term runoff and relieve drainage pressure downstream. The lowland runoff concentration areas are mainly located in downstream valleys and lowlands and are recommended for the adoption of concentrated facilities to ensure flood and drainage safety and create water landscapes.
Subsequently, multi-level control strategies and LID facilities were developed based on each level runoff volume and landscape design scheme. Based on previous mountain hydrological control studies [19,20] and hydrological landscape design practice [25,38], researchers were able to determine the suitability of this mountain park for multi-level or dispersed facilities in the practice of Guangyao Mountain Park. However, it remains unclear how different levels of strategies affect performance, and it is necessary to pre-assess the different schemes during the design stage. For this reason, a traditional grey drainage baseline strategy and four progressively enhanced green multi-level control strategies were designed and assessed in this study. According to the different levels of interception or storage facilities, the design strategies were mainly divided into terminal strategy, multi-level interception strategy, multi-level storage strategy, and multi-level interception and storage strategy. According to the relevant flood control and drainage requirements, the terminal facilities must be designed to ensure flood and drainage safety for 20-year storms based on the Nanjing Water Affairs Authority (2011); The eco-swales and detention ponds were progressively added as multi-level interception and storage facilities to control 2–5-year storms based on the Nanjing SC-LID design standard. The details of each strategy are as follows:
BS: Terminal interception and drainage strategy.
BS is a traditional terminal interception and drainage design for mountain stormwater management. As shown in Figure 4, an eco-intercepting channel (1020 m with a depth of 600 mm) is set up at the boundary between the mountain and the built-up area. Surface runoff from each sub-catchment would be transferred through the terminal channel, while the discharge outfall connects directly to the municipal network. Without any multi-level control facilities, this strategy is used as a baseline for the other four plans to enable a comparison of their performance.
S1: Terminal interception and storage strategy.
As shown in Figure 5, in addition to the same terminal channel (1020 m with a depth of 600 mm) around the mountain, a detention pond (1000 m2 with a depth of 1000 mm, with no infiltration capacity due to waterproofing materials placed in the bottom) in S2 is also set up at the lowland runoff concentration areas, which eventually connects to the municipal drainage network.
S2: Multi-level interception and terminal storage strategy.
S2 adopts multi-level interception and terminal storage facilities to intercept runoff for the sloping confluence and lowland concentration areas (Figure 6). As in S1, the same sized interception channel and detention pond are located in the same place and eventually connect to the municipal drainage network. A new eco-swale (580 m with a depth of 250 mm) with interception and infiltration function is placed along the footpath at the sloping runoff confluence areas. This plan has an additional multistage interception facility compared to S1 for comparison.
S3: Multi-level interception and storage strategy (The total storage volume stays as S2).
S3 adopts multi-level interception and storage facilities to intercept and retain runoff for the sloping confluence and lowland concentration areas (Figure 7). The eco-swale and terminal interception channels are the same as in S2. However, the detention pond in S2 is divided into two levels (P1, P2) with the same total volume. P1 and P2 are proportional to their catchment area. P1 (400 m2 with a depth of 1000 mm) holds the upstream runoff from the eco-swale, and P2 (600 m2 with a depth of 1000 mm) holds the entire upstream runoff. This strategy provides a new multi-level storage facility to compare S1 and S2 under the same storage volume situation.
S4: Multi-level interception and storage strategy (The total storage volume increases in proportion to sub-catchment areas).
S4 has the same multi-level interception and storage facilities as S3, including terminal channels, eco-swales, and two-level detention ponds of P1 and P2. The difference is that P2 (1000 m2 with a depth of 1000 mm) remains the same size and location as in S1 and S2, while P1 (400 m2 with a depth of 1000 mm) remains the same as in S3 (Figure 8). This means that S4 is used to compare the performance changes caused by the increased volume of multi-level storage facilities.

2.3. Design Storms

Nanjing has a subtropical monsoon climate. The average annual precipitation is about 1200 mm, when June to July is the rainy season and about 30–60% of the yearly rain falls in summer. The drainage capacity of Guanyao Mountain Park was designed based on the Nanjing Water Affairs Authority (2011) to resist 20-year return period storms. The mountain park’s SC-LID practice in Nanjing requires the control target to be higher than the total annual precipitation control rate of 85%, which corresponds to a daily rainfall of about 38.8 mm/d. As the design of this mountain park requires satisfying both the 20-year flood drainage standard and the sponge city standard, this study adopts a series of design storms of different durations and intensities to simulate each strategy performance synthetically, clustered by return periods (2 year, 5 year, 10 year, 20 year, 50 year, and 100 year) and durations (2 h and 6 h). The local formula for storm intensity in Nanjing [47] is
i = 64.30 × 1 + 0.837 × lg P t + 32.90 1.011
where i is the storm intensity (mm/min), t is precipitation duration (h), and P is the return period (y).
The Chicago synthetic rainfall model, closest to the actual observed conditions, was selected to reflect the rainfall-hyetographs for the various design return periods [48]. Based on historical climate statistics conditions and the Chicago synthetic rainfall model, the simulated synthetic hyetographs in Nanjing are shown in Figure 9. The formulas for the Chicago synthetic rainfall model in Nanjing [49] are
i t a = a × 1 n × t a 1 r + b ( t a 1 r + b ) n + 1
i t b = a × 1 n × t b r + b t b r + b n + 1
where i (ta) and i (tb) are the storm intensity after and before the peak time, respectively; a, b, and c are the parameters in Nanjing; a = 64.30 1 + 0.837 × lg P , b = 32.90, c = 1.011; r is the time-to-peak factor. A recommended range for r is 0.3–0.5 [39,50], and 0.4 was used here [49,51].

2.4. Hydrological Model

EPA SWMM is widely used for analysis and design related to SC-LID practices [52,53,54]. The key to simulation in SWMM lies in the completion and precision of the input parameters based on sensitivity analysis. Most of the parameters used to define the ground surface and drainage network characteristics were derived from the available GIS data (Table 1). The remaining parameters were determined by the surface type and sub-catchment properties, which include the following: the depth of depression storage for pervious and impervious areas; Manning’s n value for overland flow for pervious and impervious surfaces, conduits, grassed swales, and ecological intercepting channels. Most of the soil types around the mountain are loamy and sandy clay, with an aquifer depth of 1.5–2 m. In addition, this study adopted the Horton method to estimate infiltration and used the non-linear reservoir equation to simulate surface runoff [55]. Channel and pipe flow routing was simulated by the Saint-Venant equation [43]. All parameters in the SWMM modelling were first assigned based on the SWMM manual [43] and adjusted according to sub-catchment characteristics and relevant local studies in Nanjing. Among them, Deng et al. [56], Li et al. [57], and Song et al. [58] were calibrated to model parameters by observed rainfall and runoff data. Su et al. [59] and Shi et al. [60] were calibrated with empirical values. The corrected parameters in these studies provided good reflections of Nanjing’s actual precipitation runoff conditions. Finally, as shown in Table 2, the model parameters were adjusted and calibrated according to the mountain runoff coefficients. It is important to note that the calibration of the modelling parameters has a definite impact on the results and requires calibrating based on the local site’s hydrological characteristics.
According to the relevant simulation experiments [20,56], the runoff coefficient for non-hillside green spaces is generally 0.1–0.2, while the mountain runoff coefficient correlates with slope, vegetation cover, and precipitation intensity. When a mountain park has a slope of less than 25%, the runoff coefficient varies between 0.21 and 0.42, depending on the rainfall intensity [61]. The slope of the various sub-catchments in Guangyao Mountain Park ranges from 9% to 28%, with an average of 20%. The modelled average runoff coefficients were determined through simulation for 2–100-year return periods as 0.16–0.55, with an average of 0.36, which follows the runoff coefficient characteristics in a mountain environment.
The multi-level facilities mainly include two kinds of LID facilities: multi-level interception facilities (ecological channel and swale) and multi-level storage facilities (detention pond). The types, area, depth and location information of these facilities are listed in Figure 4, Figure 5, Figure 6, Figure 7 and Figure 8. The terminal channel was designed to a depth of 600 mm to ensure the safety of flood control and drainage for a 20-year event. The eco-swale on slopes is a 250 mm design depth limited by the digging and filling construction volume, which does not affect its interception and infiltration function. The average design depth of the detention pond depth is 1000 mm. Some other relevant parameters, such as vegetation volume fraction, surface slope, the thickness of soil and storage, etc., were determined during the design and construction process based on the on-site conditions to ensure consistency as much as possible with the actual situation. Other empirical parameters listed in Table 3, such as surface roughness, porosity, conductivity slope, etc., were set according to the SC-LID technical guide [8], recommended value in the SWMM manual [43] and the relevant literature [57,59].

2.5. Assessment Metrics

2.5.1. Hydrological Performance Metrics

LID stormwater management practices have been widely proven to reduce runoff volumes, peak flows, and lag time [26,27,28], and a system of hydrologic performance indicators has been developed based on this [62]. In particular, the reduction rates of runoff volume ( R V o l ), peak flow ( R Q ), concentration-time ( R T C ) , and runoff pollution are the most frequently used hydrological performance metrics to assess the comparative baseline strategies [63,64,65]. To analyze the hydrological effect of S1, S2, S3, and S4 compared to BS, R V o l , R Q , and R T C were selected in this study to assess the combined performance of the mountain park with minimal pollution problems.
The R V o l i for strategy i is defined as the reduced ratio for strategy i compared with that for BS in runoff volume:
R V o l i = V o l BS V o l i V o l BS × 100 %
where, V o l BS is the outflow volume of BS without any multi-level control facilities; V o l i is the outflow volume under S1, S2, S3, and S4.
The R Q i was calculated in a similar way as:
R Q i = Q BS Q i Q BS × 100 %
where, Q BS is the peak flow rate of BS without any multi-level control facilities; Q i is the peak flow rate under S1, S2, S3, and S4.
The R T C i for strategy i is defined as the delayed ratio for strategy i compared with that for BS in the time to peak runoff:
R T C i = T C BS T C i T C BS × 100 %
where, T C BS is the concentration-time of BS without any multi-level control facilities; T C i is the concentration-time i under S1, S2, S3, and S4.

2.5.2. Life-Cycle Cost Metrics

LCC assessment is a technique-based analysis of long-term economic benefits, which can be applied to get the best cost-benefit point on stormwater control [66,67]. According to related research on LID facilities’ service life [41,68], the design life of multi-level control facilities was assumed to be 30 years. The practice was assumed to be completed in year 0, while operation and maintenance (O&M) cost occurred from year 1 to 30. The calculation formulas of LCC [67] are as follows:
LCC = C capital + t = 1 n P V O & M
P V O & M t = F V O & M t 1 + k t    
F V O & M t = C capital × p × 1 + r t
where, C capital is the capital cost of facilities construction. Based on the Sponge City Construction Project Investment Estimation Index [69], the price of the terminal channel with a cross-sectional area less than 1 m2 is 348 $/m, 39 $/m2 for eco-swale, 59 $/m2 for detention ponds less than 500 m2, and 47 $/m2 for less than 1000 m2; P V O & M t is the present value of O&M costs in year t, and n is the number of service years; F V O & M t is the future value of O&M costs; The discount rate k is 8% according to The Methods and parameters of economic evaluation of construction projects in China [70]; the inflation rate r is 2.23% according to the statistics of China’s National Bureau of Statistics in the past decade; p is the proportion of the annual O&M cost to the capital cost, i.e., 5% for the ecological swale, 8% for the terminal channel, and 15% for the detention pond [71,72].

2.5.3. Hydrological Cost-Effectiveness Metrics

Cost-effectiveness analysis can be used in the decision-making process of LID strategy design by considering both aspects of hydrological performance and LCC. The cost-effectiveness value visually represents the ratio of the LID practices investment to its outcome [73]. A higher cost-effectiveness value indicates better performance at the exact investment cost. As shown in Equation (10) [41], the current discount of the performance hydrological benefit and the present value of the LCC is applied to calculate the hydrological cost-effectiveness ratio.
B / C i = P V B i P V C i  
where B / C i is the hydrological cost-effectiveness ratio under strategy i; P V C i is the ratio of LCC calculated by Equation (9) under strategy i; P V B i is the ratio of the hydrological performance under strategy i. This study assumes that the three indices are equally crucial for the comprehensive hydrological performance, and PVB is the average value of R V o l , R Q , and R T C .

3. Results and Discussion

3.1. Hydrological Performance Assessment

Figure 10 shows the changes of R V o l , R Q and R T C of each strategy under 2 h and 6 h duration in various return periods. In general, all multi-level strategies positively affect hydrological efficiency, with an overall performance of S4 > S3 > S2 > S1. Among them, S4 provides the best performance. S3 is slightly higher than S2, with an insignificant enhancement effect. These results demonstrate the advantages of the multilevel strategy for hydrological performance, consistent with the previous studies on segmented control of mountain runoff [19]. However, even with high-level facilities, each strategy may not be able to respond fully to the adverse effects of higher return-period storms. The performance decreased obviously, tended to be gentle, and finally showed a marginal effect. This is consistent with other LID hydrological performance studies [41,67].
In order to visualize the performance improvement, S2−S1, S3−S2, and S4−S3 are used to display the enhancement gap caused by the multi-level facilities. In terms of enhancing hydrological performance, increasing the multi-level storage volume (S4−S3) provides the best enhancement, and the multi-level interception facility (S2−S1) performs better than the multi-level storage facility (S3−S2) for a given storage volume, showing an overall result of S4−S3 > S2−S1 > S3−S2.
One statement should be stated here that the hydrological modelling requires parameter calibration based on the actual site conditions to avoid uncertainties caused by different regions and sites. In this study, parameter calibrations were conducted based on on-site runoff coefficients. The modelling results may inevitably be susceptible to some error; however, each hydrological metric and the integrated hydrological performance show special reduction rates and change trends. It achieves the intended objective of analyzing and comparing the effectiveness of different strategies.

3.1.1. Runoff Volume Reduction

The R V o l under S1, S2, S3, and S4 as compared with BS were calculated using Equation (4). As shown in Figure 10a,b, the R V o l can be improved effectively with an overall performance of S4 > S3 > S2 > S1. Compared with S1, S2 can rise 7% on average by increasing multi-level interception facilities. S4 can rise about 12% by increasing multi-level storage volume compared with S3. However, under the condition of a specific total storage capacity, S3 has no significant improvement effect on R V o l compared with S2, and the average increase is only 1%. As expected, the control of total runoff is greatly limited by the volume of storage facilities. At the same time, the contribution of multi-level interception facilities to R V o l cannot be ignored due to its inestimable infiltration and peak flow regulation. Therefore, to improve the control of total outflow, it is more effective to increase the storage capacity and multi-level interception facilities, and S2 and S4 are preferred.

3.1.2. Peak Flow Reduction

The performance under S1, S2, S3, and S4 as compared to BS for R Q are shown in Figure 10c,d. Consistent with the R V o l , S4 performs best and far better than others in R Q , and improves by about 11% on average compared with S3. In contrast, performance under S1, S2, and S3 are not significantly different from each other. S2 only improves by 5% on average compared with S1. S3 is only 3% higher than S2 on average for a given storage volume. These results indicate that the multi-level storage strategy is still the best method to reduce peak flow. Likewise, S2 and S3 have a positive, though not significant, effect on enhancing the R Q with the same storage volume.

3.1.3. Concentration Time Reduction

As is shown in Figure 10e,f, performance under S1, S2, S3, and S4 as compared with BS for R T C were significantly better for 2 h duration than for 6 h. It is very different from the results of R V o l and R Q . Compared with S1, S2 improves the R T C about 7% in 2 h duration and about 2% in 6 h on average. The average enhancement of S3 compared with S2 is 3% in 2 h duration, but the advantage of 1% in 6 h duration is negligible. Similar to R V o l and R Q , performance under S4 is still obviously better than others because of the increase in facilities volume. In 2 h duration, S4 improves on average by about 16% compared to S3, approximately 10% in 6 h. As a comparison, therefore, the R T C in the 6 h duration shows significantly lower than that in the 2 h duration.

3.1.4. Comprehensive Implications

As shown in Figure 10g,h, the comprehensive hydrologic performance gathers almost all the characteristics of the above reduction rates. A clear decreasing trend and marginal effect in hydrological performance were observed, attributed to heavy precipitation and mountain slope [73]. It is therefore not recommended that such practices set excessively high targets and should make full use of their high performers in 2–5-year events. Furthermore, the figures clearly show that S4 provides the best significant performance. S2 is slight below S3, but the enhancement of the multi-level interception strategy of S2–S1 is significantly better than S3–S2, especially in response to the 2–10-year precipitation events. It might suggest that storage volume and multi-level interception facilities would more effectively enhance the hydrological performance in slope areas. This is consistent with the findings for the hydrological performance of dispersed LID facilities concluded for non-hillside sites [33], but the multi-level storage facilities seem not to reach such significant effectiveness. Therefore, in this SC-LID practice of Guanyao Mountain Park, the increase in multi-level storage volume of S4 is the most effective method for enhancing the hydrological performance, and the multi-level interception facilities in S2 may be preferred in response to low-intensity precipitation events for a given storage volume. The enhancing effect of multi-level storage facilities in S3 is very slight, but the cumulative effect of this strategy on a larger scale area cannot be ignored [32].

3.2. Life-Cycle Cost Assessment

The LCCs of each multi-level facility and design strategy in these study cases were calculated using Equations (7)–(9). As shown in Figure 11a, the life-cycle O&M costs per unit area of each LID facility range from 42% to 68% of their LCCs. Of these, the channel and detention pond O&M costs are higher than their construction costs. This indicates that the O&M costs occupy a non-negligible proportion of the long-term LCC, and it is essential to consider them along with the overall input costs, which corresponds to previous studies [42,57]. In addition, the channel, in this case, needs to be of sufficient size and scale to provide flood interception and protection, resulting in the highest LCC per unit area.
Figure 11b shows the cost distribution of each strategy. As expected, the life-cycle O&M costs of S1 to S4 are higher than their construction costs, which further illustrates that the long-term O&M costs cannot be ignored. It is essential to consider them along with the overall input costs. Furthermore, as this research focuses on assessing the impact of adding a few multi-level facilities on hydrological cost-effectiveness, the design of S1 to S4 did not present as significant differences in scale and LCC as in previous studies [41,42]. This is mainly because, in this project, the design scheme has to comply with the requirements of the subsequent implementation without significant cost variances. In particular, the channel for ensuring drainage safety occupies a larger portion of the LLC, as shown in Figure 11a. It is possible to lower the cost by reducing the size and scale of the channel or by adjusting its structure. However, to ensure the flood prevention requirements of this site, this study maintained its design.

3.3. Hydrological Cost-Effectiveness Assessment

The cost-effectiveness of each designed strategy was calculated using Equation (10), and the normalized results are shown in Figure 12. As shown, the R V o l / LCC , R Q / LCC , R T C / LCC , and cost-effectiveness of each strategy generally show similar results to Figure 10, with an apparent marginal effect of S4 > S3 > S2 > S1. The cost-effectiveness enhancement is similar to hydrological performance, i.e., S4−S3 > S2−S1 > S3−S2.
However, some dissimilarities require attention to detail. The cost-effectiveness of each strategy in the low return period differs from the hydrological performance because of the additional life-cycle cost consideration. This finding was not available in the previous study [41,42]. In the 2-year scenario, the cost-effectiveness of each strategy shows an opposite performance, i.e., S1 > S2 > S3 > S4. This condition is observed in both the 2 h and 6 h duration and even shows S2 > S3 > S4> S1 in the 5-year 2 h scenario. Such differences may be that previous studies set a large range of scheme levels [42] and costs [41], while this study focused on small adjustments of multi-level interception and storage facilities during realistic design practice. This small variation indicates that different strategies may have high combined effectiveness for different storm scenarios. A high-level multi-level strategy may not suit all design precipitation events, given the costs of facility construction and long-term O&M.
In conclusion, S4 performs significant advantages in the hydrological performance assessment, especially in response to mid-and high-intensity events. However, its cost-effectiveness for low-intensity precipitation targets for 2−5-year is inadequate. Compared to S2, S3 performs only marginally better than S2 in the mid-intensity scenario (10–50-year period) and even less than S2 in the 2−5-year scenarios. The gap between S3−S2 reduces significantly due to the additional consideration of the costs, which further decreases the value of S3 being selected for a given storage volume. Therefore, S1 is preferred for the 2-year design precipitation event to ensure optimal cost-effectiveness in this study case. S2 or S3 can be set for the 2−5-year design target, depending on the local rainfall duration characteristics. S4 is suitable for mid-and high-intensity rainfall events.

4. Conclusions

This study analyzed and assessed the hydrological performance, life-cycle costs and hydrological cost-effectiveness of four multi-level control strategies for the Nanjing Guanyao Mountain Park. The hydrological performance and combined cost-effectiveness of these strategies were also compared for different return period precipitation scenarios. The following three aspects are summarized in detail:
(1)
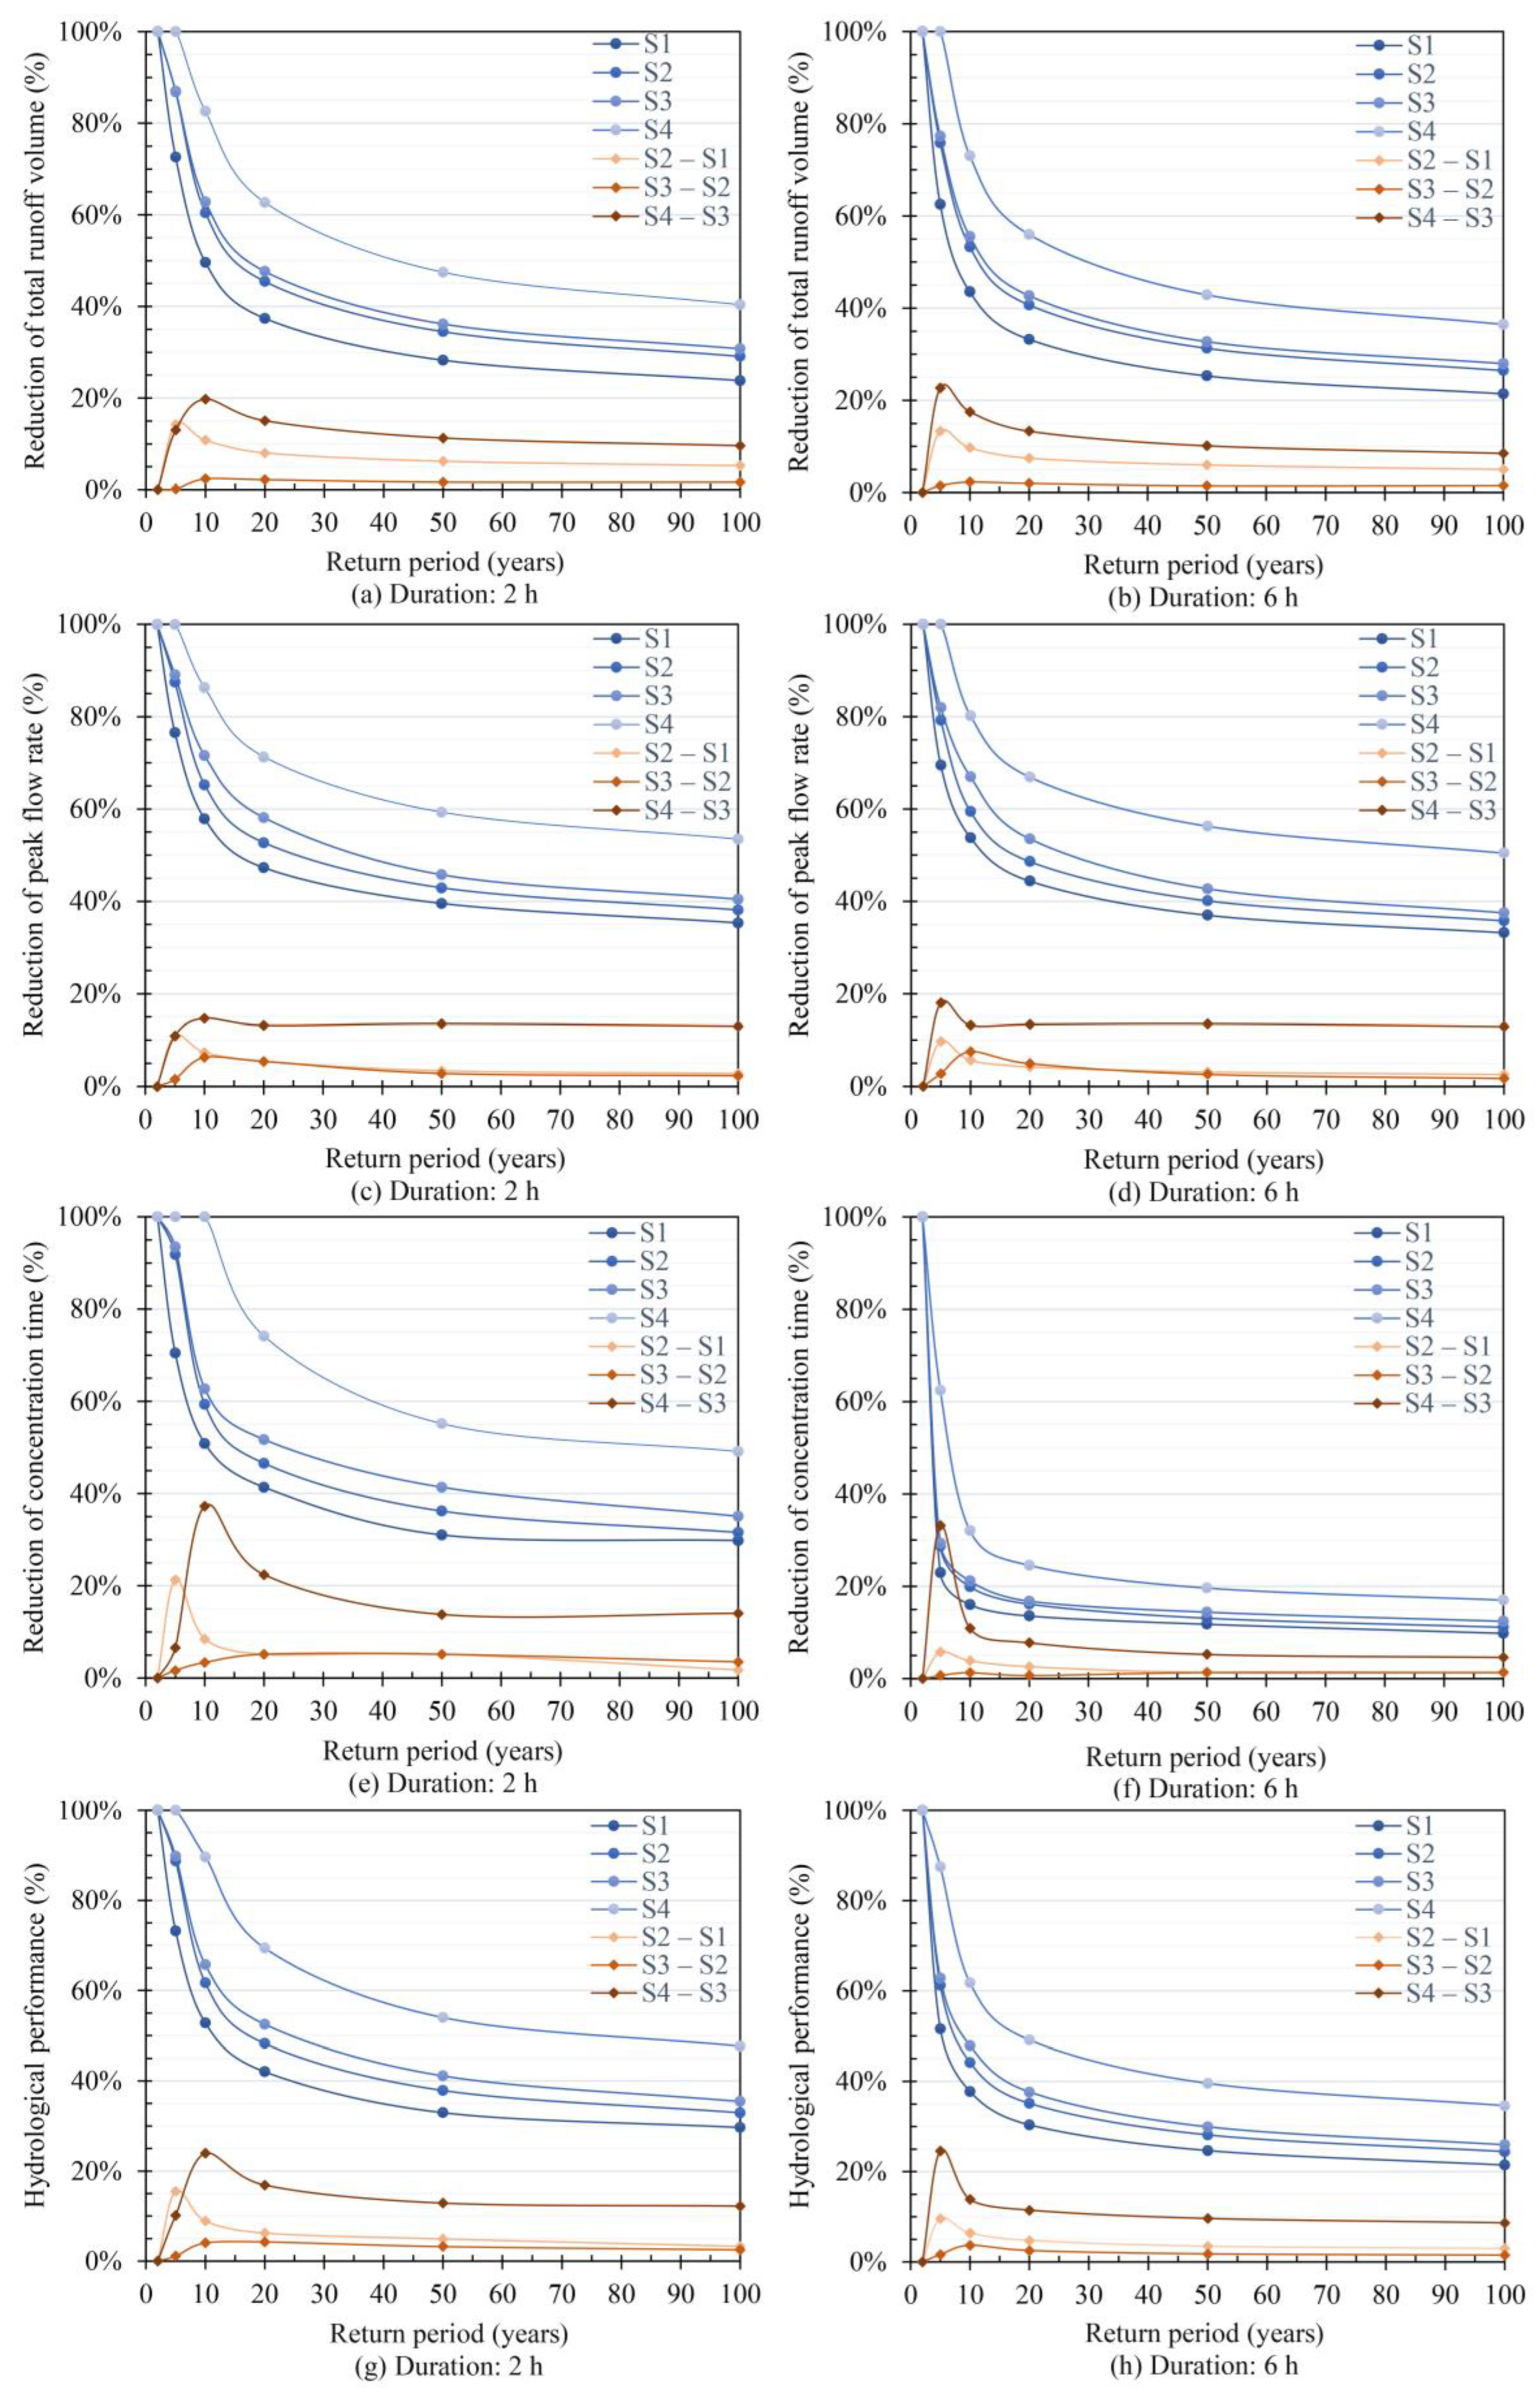
The results for hydrological performance indicate that the volume of multi-level storage is the most significant factor affecting its hydrological performance, providing the multi-level interception and storage strategy (S4) with a considerable advantage for benefit enhancement. This was followed by the multi-level interception strategy (S2) with a slightly lower overall performance than the multi-level storage strategy (S3), with the terminal strategy (S1) performing the worst. In particular, increasing multi-level storage is the most effective method for enhancing hydrological performance, and multi-level interception facilities are preferred for a specific storage volume. Although these pre-evaluation findings indicate a potentially positive hydrologic performance for multi-level or dispersed LID facilities in this mountain park, further validation with actual precipitation and runoff information should be required to improve the precision of this hydrological modelling study.
However, due to the life-cycle cost (LCC) limitations, the trend in hydrological cost-effectiveness is entirely the opposite in the 2–10-year return periods. The high-intensity multi-level strategy performs better under the high-intensity precipitation events, whereas a low- to mid-intensity strategy seems suitable for the low-intensity events (particularly for the 2–5-year events). It is mainly influenced by the LCC limitations and the marginal effect of hydrological performance, which require a combined consideration in this practice. Likewise, this conclusion may also be applicable to the LID practice. In most sponge city practices, a control target of 2−5 years of design precipitation (or less) is more appropriate for adopting a low-intensity LID strategy. The excessive pursuit of hydrological benefits may fail to fully utilize the LID facility, resulting in increased costs and wasted resources. Thus, we may be required to limit the LID practice levels based on control objectives; such a limited approach can be achieved by considering the objective of cost-effectiveness. Particular attention should be paid to local low- to mid-intensity precipitation characteristics and site characteristics, which are directly related to the size, type selection, and layout of LID facilities and will influence the target setting and overall hydrological cost-effectiveness.
(2)
Comparison of S2 and S3 in terms of hydrological performance and cost-effectiveness for a specific storage volume shows that the multi-level storage facility in S3 seems not to perform its distributed hydrological performance. The slope of the mountain may influence this. However, this study did not conduct a controlled experimental design for different topography and catchment areas. The effect of slope on the hydrological performance of multi-level regulation facilities could not be effectively concluded. This will probably be one of our future research directions. Research samples can also be further expanded in future research on this topic. We can design controlled texts to compare and verify the combined hydrologic performance of multi-level or dispersed LID facilities at different slope conditions on sloped and non-sloped sites. We will use actual projects as evidence-based research cases to promote the general applicability of this study.
(3)
This paper focuses on model building, cost-benefit simulation, and evaluation of hydrological multi-level control schemes. It actually belongs to the theoretical modelling stage, which can provide some theoretical support and technical reference for urban mountain park design and LID practice for sloped areas. However, due to constrained conditions, the soil type, infiltration rate, and other factors used in this paper mainly depend on the available data in the neighboring areas of Guanyao Mountain. In this study’s modelling and simulation process, the parameters were appropriately calibrated based on runoff coefficients, so there are some specific limitations. To further verify the effectiveness of multi-level control facilities in this mountain park, we can obtain the actual precipitation runoff data through field sensor monitoring and compare the model simulation results to optimize and validate this study.

Author Contributions

Methodology, data curation, formal analysis and visualization, Q.H.; supervision and funding acquisition, Y.C.; review and project administration, Y.Y.; methodology and suggestion, M.W. All authors have read and agreed to the published version of the manuscript.

Funding

This research was funded by the National Natural Science Foundation of China, grant number 51838003, the National Key Research and Development Program of China, grant number 2019YFD1100405, and the Postgraduate Research and Practice Innovation Program of Jiangsu Province, grant number KYCX20_0144.

Institutional Review Board Statement

Not applicable.

Informed Consent Statement

Not applicable.

Data Availability Statement

The data presented in this study are available on request from the corresponding author.

Acknowledgments

All authors appreciate the team of Cheng working on this project.

Conflicts of Interest

The authors declare no conflict of interest.

References

  1. Xiujuan, Q.; Kueihsien, L.; Randrup, T.B. Sustainable stormwater management: A qualitative case study of the Sponge Cities initiative in China. Sustain. Cities Soc. 2020, 53, 101963. [Google Scholar] [CrossRef]
  2. Li, X.; Li, J.; Fang, X.; Gong, Y.; Wang, W. Case studies of the sponge city program in China. In Proceedings of the World Environmental and Water Resources Congress 2016, West Palm Beach, FL, USA, 22–26 May 2016; pp. 295–308. [Google Scholar]
  3. Chan, F.K.S.; Griffiths, J.A.; Higgitt, D.; Xu, S.; Zhu, F.; Tang, Y.-T.; Xu, Y.; Thorne, C.R. “Sponge City” in China—A breakthrough of planning and flood risk management in the urban context. Land Use Policy 2018, 76, 772–778. [Google Scholar] [CrossRef]
  4. Jiang, Y.; Zevenbergen, C.; Fu, D. Understanding the challenges for the governance of China’s “sponge cities” initiative to sustainably manage urban stormwater and flooding. Nat. Hazards 2017, 89, 521–529. [Google Scholar] [CrossRef]
  5. Sun, Y.; Chen, Z.; Wu, G.; Wu, Q.; Zhang, F.; Niu, Z.; Hu, H.-Y. Characteristics of water quality of municipal wastewater treatment plants in China: Implications for resources utilization and management. J. Clean. Prod. 2016, 131, 1–9. [Google Scholar] [CrossRef] [Green Version]
  6. Xia, J.; Zhang, Y.; Xiong, L.; He, S.; Wang, L.; Yu, Z. Opportunities and challenges of the Sponge City construction related to urban water issues in China. Sci. China Earth Sci. 2017, 60, 652–658. [Google Scholar] [CrossRef]
  7. Köster, S. How the Sponge City becomes a supplementary water supply infrastructure. Water-Energy Nexus 2021, 4, 35–40. [Google Scholar] [CrossRef]
  8. MOHURD. The Construction Guideline of Sponge City in China—Low Impact Development of Stormwater System (Trail); China Architecture & Building Press: Beijing, China, 2014. [Google Scholar]
  9. Gao, J.; Li, J.; Li, Y.; Xia, J.; Lv, P. A Distribution Optimization Method of Typical LID Facilities for Sponge City Construction. Ecohydrol. Hydrobiol. 2021, 21, 13–22. [Google Scholar] [CrossRef]
  10. Liu, J.; Gong, X.; Li, L.; Chen, F.; Zhang, J. Innovative design and construction of the sponge city facilities in the Chaotou Park, Talent Island, Jiangmen, China. Sustain. Cities Soc. 2021, 70, 102906. [Google Scholar] [CrossRef]
  11. Yang, Y.; Guan, T.; Wu, L. An exploration of sponge city planning solutions for residential areas based on the XPdrainage model. Urban Plan. Forum 2018, S1, 126–129. [Google Scholar] [CrossRef]
  12. Cheng, Y.; Wang, R. A novel stormwater management system for urban roads in China based on local conditions. Sustain. Cities Soc. 2018, 39, 163–171. [Google Scholar] [CrossRef]
  13. GB/T 51345-2018; Evaluation Criteria for Sponge City Construction. MOHURD: Beijing, China, 2018.
  14. Chen, S.; Van De Ven, F.H.M.; Zevenbergen, C.; Verbeeck, S.; Ye, Q.; Zhang, W.; Wei, L. Revisiting China’s Sponge City Planning Approach: Lessons from a Case Study on Qinhuai District, Nanjing. Front. Environ. Sci. 2021, 9, 428. [Google Scholar] [CrossRef]
  15. Nguyen, T.T.; Ngo, H.H.; Guo, W.; Wang, X.C. A new model framework for sponge city implementation: Emerging challenges and future developments. J. Environ. Manag. 2020, 253, 109689. [Google Scholar] [CrossRef]
  16. Li, H.; Ding, L.; Ren, M.; Li, C.; Wang, H. Sponge City Construction in China: A Survey of the Challenges and Opportunities. Water 2017, 9, 594. [Google Scholar] [CrossRef] [Green Version]
  17. Li, F.; Zhang, J. A review of the progress in Chinese Sponge City programme: Challenges and opportunities for urban stormwater management. Water Supply 2022, 22, 1638–1651. [Google Scholar] [CrossRef]
  18. Wu, L. The science of human settlements should be established with major concern. Bull. Chin. Acad. Sci. 2012, 21, 442–443. [Google Scholar] [CrossRef]
  19. Yuan, Y.; Gan, Y.; Xu, Y.; Xie, Q.; Shen, Y.; Yin, Y. SWMM-Based Assessment of Urban Mountain Stormwater Management Effects under Different LID Scenarios. Water 2022, 14, 78. [Google Scholar] [CrossRef]
  20. Liu, J.; Li, Y.; Zhang, J. Analysis on Surface Runoff Property and Stormwater Utilization in Urban Mountain Parks in Chongqing. J. Hum. Settl. West China 2020, 34, 42–49. [Google Scholar] [CrossRef]
  21. Zhang, G.; Chen, Y.; Wu, Y. Commentary on Eco-Hydrological Regulation for Integrated River Basin Management. Sci. Geogr. Sin. 2019, 39, 1191–1198. [Google Scholar] [CrossRef]
  22. Zhao, W.; Zhu, M.; Shu, F. Mountainous Sponge City Planning Methods in the View of Ecohydrology—A Case Study of Chongqing Metropolitan Area. Mt. Res. 2017, 35, 68–77. [Google Scholar] [CrossRef]
  23. Mao, H.; Luo, P.; Sha, T. Study on Urban Design Strategy of Gully Area in Response to Mountain Hydrological Characteristics. Chin. Landsc. Archit. 2017, 33, 34–38. [Google Scholar] [CrossRef]
  24. Cheng, Y.; Yuan, Y. Research on Parametric Design of Imitating Natural Waterscape in Mountain Environment. Chin. Landsc. Archit. 2015, 31, 10–14. [Google Scholar] [CrossRef]
  25. Zhang, D.; Tang, Z. Ecological Restoration and Landscape Design of the Quarry Park in Tangshan of Nanjing. Chin. Landsc. Archit. 2019, 35, 5–12. [Google Scholar] [CrossRef]
  26. Hamel, P.; Daly, E.; Fletcher, T.D. Source-control stormwater management for mitigating the impacts of urbanisation on baseflow: A review. J. Hydrol. 2013, 485, 201–211. [Google Scholar] [CrossRef]
  27. Jia, H.; Lu, Y.; Yu, S.L.; Chen, Y. Planning of LID–BMPs for urban runoff control: The case of Beijing Olympic Village. Sep. Purif. Technol. 2012, 84, 112–119. [Google Scholar] [CrossRef]
  28. Eckart, K.; McPhee, Z.; Bolisetti, T. Performance and implementation of low impact development—A review. Sci. Total Environ. 2017, 607–608, 413–432. [Google Scholar] [CrossRef] [PubMed]
  29. Baek, S.S.; Choi, D.H.; Jung, J.W.; Lee, H.J.; Lee, H.; Yoon, K.S.; Cho, K.H. Optimizing low impact development (LID) for stormwater runoff treatment in urban area, Korea: Experimental and modelling approach. Water Res. 2015, 86, 122–131. [Google Scholar] [CrossRef]
  30. Davis, A.P.; Shokouhian, M.; Sharma, H.; Minami, C. Water quality improvement through bioretention media: Nitrogen and phosphorus removal. Water Environ. Res. 2006, 78, 284–293. [Google Scholar] [CrossRef]
  31. Zhang, K.; Chui, T.F.M. A comprehensive review of spatial allocation of LID-BMP-GI practices: Strategies and optimization tools. Sci. Total Environ. 2018, 621, 915–929. [Google Scholar] [CrossRef]
  32. Morsy, M.M.; Goodall, J.L.; Shatnawi, F.M.; Meadows, M.E. Distributed Stormwater Controls for Flood Mitigation within Urbanized Watersheds: Case Study of Rocky Branch Watershed in Columbia, South Carolina. J. Hydrol. Eng. 2016, 21, 05016025. [Google Scholar] [CrossRef]
  33. Towsif Khan, S.; Chapa, F.; Hack, J. Highly Resolved Rainfall-Runoff Simulation of Retrofitted Green Stormwater Infrastructure at the Micro-Watershed Scale. Land 2020, 9, 339. [Google Scholar] [CrossRef]
  34. Todeschini, S.; Papiri, S.; Ciaponi, C. Placement Strategies and Cumulative Effects of Wet-weather Control Practices for Intermunicipal Sewerage Systems. Water Resour. Manag. 2018, 32, 2885–2900. [Google Scholar] [CrossRef]
  35. Zhang, M.; Tan, W.; Zhong, J. A Research on the Applicable Modes of LID-Based Slope Residence Planning. IOP Conf. Ser. Earth Environ. Sci. 2021, 693, 012002. [Google Scholar] [CrossRef]
  36. Li, Y.; Liu, J.; Zhang, J. On the Strategy for Constructing a Low Impact Development (LID) Rainwater Control System Based on Different Types of Sub-catchments—A Case Study of Chongqing’s Main Urban Area. J. Southwest Univ. 2019, 41, 151–157. [Google Scholar] [CrossRef]
  37. Luan, Q.; Fu, X.; Song, C.; Wang, H.; Liu, J.; Wang, Y. Runoff Effect Evaluation of LID through SWMM in Typical Mountainous, Low-Lying Urban Areas: A Case Study in China. Water 2017, 9, 439. [Google Scholar] [CrossRef] [Green Version]
  38. Hou, Q.; Yuan, Y.; Liu, R.; Cheng, X. Research on Water Environment Optimization Design Methods of Urban Mountain Parks. Landsc. Archit. 2020, 27, 98–103. [Google Scholar] [CrossRef]
  39. Mei, C.; Liu, J.; Wang, H.; Yang, Z.; Ding, X.; Shao, W. Integrated assessments of green infrastructure for flood mitigation to support robust decision-making for sponge city construction in an urbanized watershed. Sci. Total Environ. 2018, 639, 1394–1407. [Google Scholar] [CrossRef] [PubMed]
  40. Wang, M.; Zhang, D.; Adhityan, A.; Ng, W.J.; Dong, J.; Tan, S.K. Assessing cost-effectiveness of bioretention on stormwater in response to climate change and urbanization for future scenarios. J. Hydrol. 2016, 543, 423–432. [Google Scholar] [CrossRef]
  41. Wang, Z.; Zhou, S.; Wang, M.; Zhang, D. Cost-benefit analysis of low-impact development at hectare scale for urban stormwater source control in response to anticipated climatic change. J. Environ. Manag. 2020, 264, 110483. [Google Scholar] [CrossRef]
  42. Liu, J.; Li, W.; Peng, Z.; Liu, Z. Research on Stormwater Management Landscape System Strategies in Mountainous Urban Parks Based on the Hydrological Cost Comprehensive Effectiveness. Landsc. Archit. 2021, 28, 90–96. [Google Scholar] [CrossRef]
  43. Rossman, L.A. Storm Water Management Model User’s Manual; version 5.1; USEPA: Washington, DC, USA, 2014.
  44. Norris, G.A. Integrating life cycle cost analysis and LCA. Int. J. Life Cycle Assess. 2001, 6, 118–120. [Google Scholar] [CrossRef]
  45. Krebs, G.; Kokkonen, T.; Valtanen, M.; Koivusalo, H.; Setälä, H. A high resolution application of a stormwater management model (SWMM) using genetic parameter optimization. Urban Water J. 2013, 10, 394–410. [Google Scholar] [CrossRef]
  46. Shen, J.; Zhang, Q. A GIS-Based Subcatchments Division Approach for SWMM. Open Civ. Eng. J. 2015, 9, 515–521. [Google Scholar] [CrossRef] [Green Version]
  47. Bureau, N.C.A. Formula of Rainstorm Intensity in Nanjing (Revised). Available online: http://cgj.nanjing.gov.cn/information/extrafile/1/201403121404284714 (accessed on 6 August 2021).
  48. Keifer, C.J.; Chu, H.H. Synthetic Storm Pattern for Drainage Design. J. Hydraul. Div. 1957, 83, 1332-1–1332-25. [Google Scholar] [CrossRef]
  49. Ni, Z.; Li, Q.; Du, F.; Jiang, H. Study on design of rainstorm pattern based on short duration in Nanjing City. J. Water Resour. Water Eng. 2019, 30, 57–62. [Google Scholar] [CrossRef]
  50. Jia, H.; Ma, H.; Sun, Z.; Yu, S.; Ding, Y.; Liang, Y. A closed urban scenic river system using stormwater treated with LID-BMP technology in a revitalized historical district in China. Ecol. Eng. 2014, 71, 448–457. [Google Scholar] [CrossRef]
  51. Zhang, L.; Li, J.; Pei, H.; He, G. Rainfall Pattern Analysis of Short Duration Rainstorm in Nanjing. Adv. Meteorol. Sci. Technol. 2019, 9, 15–20, 55. [Google Scholar] [CrossRef]
  52. Rosa, D.J.; Clausen, J.C.; Dietz, M.E. Calibration and Verification of SWMM for Low Impact Development. J. Am. Water Resour. Assoc. 2015, 51, 746–757. [Google Scholar] [CrossRef]
  53. Wang, M.; Zhang, D.; Lou, S.; Hou, Q.; Liu, Y.; Cheng, Y.; Qi, J.; Tan, S.K. Assessing Hydrological Effects of Bioretention Cells for Urban Stormwater Runoff in Response to Climatic Changes. Water 2019, 11, 997. [Google Scholar] [CrossRef] [Green Version]
  54. Li, Q.; Wang, F.; Yu, Y.; Huang, Z.; Li, M.; Guan, Y. Comprehensive performance evaluation of LID practices for the sponge city construction: A case study in Guangxi, China. J. Environ. Manag. 2019, 231, 10–20. [Google Scholar] [CrossRef]
  55. Horton, R.E. The Rôle of infiltration in the hydrologic cycle. Trans. Am. Geophys. Union 1933, 14, 446–460. [Google Scholar] [CrossRef]
  56. Deng, J.; Yin, H.; Kong, F.; Chen, J.; Dronova, I.; Pu, Y. Determination of runoff response to variation in overland flow area by flow routes using UAV imagery. J. Environ. Manag. 2020, 265, 109868. [Google Scholar] [CrossRef] [PubMed]
  57. Li, M.; Yin, H.; Kong, F.; Liu, J.; Qiu, S. Research on spatial distribution and stormwater regulation benefits of low impact development in Gulou District, Nanjing, China. J. Water Resour. Water Eng. 2019, 30, 30–38. [Google Scholar] [CrossRef]
  58. Song, Y.; Li, Q.; Niu, M.; Yan, F.; He, P.; Chen, Q.; Zhou, Z.; Du, Y. Rainstorm and waterlogging simulation in typical inundated districts of Nanjing based on SWMM. Adv. Sci. Technol. Water Resour. 2019, 39, 56–61. [Google Scholar] [CrossRef]
  59. Su, W.; Duan, H. Catchment-based imperviousness metrics impacts on floods in Niushou River basin, Nanjing City, East China. Chin. Geogr. Sci. 2017, 27, 229–238. [Google Scholar] [CrossRef] [Green Version]
  60. Shi, X.; Li, Y.; Huang, L.; Qiu, S. Waterlogging simulation and runoff analysis of urban rainstorm for Nanjing. Sci. Surv. Mapp. 2017, 42, 179–185. [Google Scholar] [CrossRef]
  61. Sun, Y.; Li, Q.; Liu, L.; Xu, C.; Liu, Z. Hydrological simulation approaches for BMPs and LID practices in highly urbanized area and development of hydrological performance indicator system. Water Sci. Eng. 2014, 7, 143–154. [Google Scholar] [CrossRef]
  62. Palla, A.; Gnecco, I. Hydrologic modelling of Low Impact Development systems at the urban catchment scale. J. Hydrol. 2015, 528, 361–368. [Google Scholar] [CrossRef]
  63. Xing, W.; Li, P.; Cao, S.-B.; Gan, L.-L.; Liu, F.-L.; Zuo, J.-E. Layout effects and optimization of runoff storage and filtration facilities based on SWMM simulation in a demonstration area. Water Sci. Eng. 2016, 9, 115–124. [Google Scholar] [CrossRef] [Green Version]
  64. Yang, Y.; Chui, T.F.M. Optimizing surface and contributing areas of bioretention cells for stormwater runoff quality and quantity management. J. Environ. Manag. 2018, 206, 1090–1103. [Google Scholar] [CrossRef]
  65. Spatari, S.; Yu, Z.; Montalto, F.A. Life cycle implications of urban green infrastructure. Environ. Pollut. 2011, 159, 2174–2179. [Google Scholar] [CrossRef]
  66. Chui, T.F.M.; Liu, X.; Zhan, W. Assessing cost-effectiveness of specific LID practice designs in response to large storm events. J. Hydrol. 2016, 533, 353–364. [Google Scholar] [CrossRef]
  67. Vineyard, D.; Ingwersen, W.W.; Hawkins, T.R.; Xue, X.; Demeke, B.; Shuster, W. Comparing Green and Grey Infrastructure Using Life Cycle Cost and Environmental Impact: A Rain Garden Case Study in Cincinnati, OH. J. Am. Water Resour. Assoc. 2015, 51, 1342–1360. [Google Scholar] [CrossRef]
  68. ZYA1-02(01)-2018; Sponge City Construction Project Investment Estimation Index. MOHURD: Beijing, China, 2018.
  69. Ministry of Housing and Urban-Rural Development of Peoples Republic of China. Methods and Parameters of Economic Evaluation for Municipal Utilities Construction Projects; China Planning Press: Beijing, China, 2008.
  70. Liao, Z.; Chen, H.; Huang, F.; Li, H. Cost–effectiveness analysis on LID measures of a highly urbanized area. Desalin. Water Treat. 2014, 56, 2817–2823. [Google Scholar] [CrossRef]
  71. Houle, J.J.; Roseen, R.M.; Ballestero, T.P.; Puls, T.A.; Sherrard, J. Comparison of Maintenance Cost, Labor Demands, and System Performance for LID and Conventional Stormwater Management. J. Environ. Eng. 2013, 139, 932–938. [Google Scholar] [CrossRef]
  72. Muhan, L.; Shuang, T. Review of Research Contents and Methods on Low Impact Development Cost-Effectiveness. Huazhong Archit. 2021, 39, 1–5. [Google Scholar] [CrossRef]
  73. Hou, J.; Han, H.; Qi, W.; Guo, K.; Li, Z.; Hinkelmann, R. Experimental investigation for impacts of rain storms and terrain slopes on low impact development effect in an idealized urban catchment. J. Hydrol. 2019, 579, 124176. [Google Scholar] [CrossRef]
Figure 1. The framework of hydrological cost-effectiveness.
Water 14 01524 g001
Figure 2. The basic situation of Guanyao Mountain Park.
Water 14 01524 g002
Figure 3. Schematic of hydrological multi-level control strategies for the mountain park.
Water 14 01524 g003
Figure 4. Facilities layout and design workflow diagram for BS.
Water 14 01524 g004
Figure 5. Facilities layout and design workflow diagram for S1.
Water 14 01524 g005
Figure 6. Facilities layout and design workflow diagram for S2.
Water 14 01524 g006
Figure 7. Facilities layout and design workflow diagram for S3.
Water 14 01524 g007
Figure 8. Facilities layout and design workflow diagram for S4.
Water 14 01524 g008
Figure 9. Synthetic hyetographs of 2 h (a) and 6 h (b) design rainfall events of Nanjing.
Water 14 01524 g009
Figure 10. Analysis of R V o l (a,b), R Q (c,d), R T C (e,f), and hydrological performance (g,h) for S1, S2, S3, and S4 as responses to various return periods and rainfall durations.
Water 14 01524 g010
Figure 11. LCC of each multi-level facility (a) and multi-level control strategy (b).
Water 14 01524 g011
Figure 12. Assessment of R V o l / LCC (a,b), R Q / LCC (c,d), R T C / LCC (e,f), and hydrological cost-effectiveness (g,h) for S1, S2, S3, and S4 as responses to various return periods and rainfall durations.
Water 14 01524 g012
Table 1. Characteristics of the sub-catchments in Guanyao Mountain Park.
Catchment NumberArea (m2)Primary LandcoverAverage Slope
C1-111,959Woodland22%
C1-26186Woodland and grassland15%
C2-110,420Woodland28%
C2-210,958Woodland and pavement9%
C3-12654Grassland19%
C3-21708Woodland and grassland24%
C4-12778Grassland19%
C4-220,859Woodland and water bodies21%
Table 2. Input parameters for the SWMM model.
ParametersUnitRecommended Range [43]Values in Previous Studies [56,57,58,59,60]Values in This Study
Depth of depression storage for impervious areasmm1.27–2.541.00–2.001.50
Depth of depression storage for pervious areasmm2.54–7.623.80–7.625.85
Manning’s N for impervious areas/0.001–0.0200.011–0.020.015
Manning’s N for pervious areas/0.01–0.800.30–0.800.40
Manning’s N for conduits/0.011–0.020.011–0.0150.011
Manning’s N for grassed swales/0.02–0.400.02–0.40.2
Manning’s N for ecological intercepting channels/0.02–0.350.02–0.050.05
Max Infiltration Ratemm/h25.40–127.0025.40–76.2050.80
Mini Infiltration Ratemm/h0.25–30.000.25–10.921
Decay Coefficients1/h2.00–7.001.85–3.003
Drying timed2–142–77
Table 3. Parameters used for multi-level controls in the SWMM model.
LayerParameterChannelEco-SwaleDetention Pond
SurfaceBerm height (mm)6002501000
Vegetation volume fraction (m3/m3)0.10.30.1
Surface roughness (Manning’s n)0.050.20.03
Surface slope (%)20.50.5
SoilThickness of soil (mm)600450450
Porosity (m3/m3)0.50.50.5
Field capacity (m3/m3)0.2840.2840.284
Wilting point (m3/m3)0.1350.1350.135
Conductivity (mm/h)6.66.66.6
Conductivity slope101010
Suction head (mm)70170170
StorageThickness of storage (mm)/500/
Void ratio (voids/solids)/0.5/
Seepage rate (mm/h)/500/
Clogging factor/0/
Publisher’s Note: MDPI stays neutral with regard to jurisdictional claims in published maps and institutional affiliations.

