Abstract
Sulphide build-up in pressure sewers has been identified as the main cause for the occurrence of odour and corrosion in sewer systems. Despite the efforts to optimize commonly used control technologies such as nitrate and iron salts to reduce sulphide emission, continuous addition of these chemicals is still required. A biocidal agent such as free nitrous acid can be added intermittently, less frequently, and in smaller quantities whilst achieving total sulphide control. So far, laboratory and field studies in Australia and the USA have successfully proven and applied the use of this control technology, exhibiting its strong biocidal effects during intermittent addition. In this study, nine trials were made to assess the application of the free nitrous acid (FNA) as an alternative sulphide control technology in Germany. The sewer pilot plant of the Berlin Water Utility Company was used to perform the trials at a technical scale using a supply of raw sewage. FNA exposure times ranging from 5 to 24 h in varying concentrations were investigated. The effectiveness of the FNA treatment was monitored using the online hydrogen sulphide (H2S) gas and dissolved-sulphide sensors installed in the sewer pilot plant. Effective sulphide control was only possible during dosing periods, with rapid resumption of sulphide production for the trials with exposure times of <12 h and concentrations ranging from 0.08 to 0.56 mg HNO2-N L−1 suggesting a slight inhibitory effect. A more pronounced biocidal effect was observed for the trials exposed to FNA treatment for 24 h at concentrations >0.29 mg HNO2-N L−1. Overall, the trials of this study demonstrated that the biofilms were FNA resistant and that the concentrations and exposure times used were inadequate to develop an effective intermittent dosing strategy.
1. Introduction
Pressure sewers are an integral component of the wastewater collection system. Typically, they are used when the transport of wastewater using gravitational forces is not enough and when deemed more cost effective to build lengthy sewer lines rather than a treatment facility [1]. Operated by pumps, pressure sewers are full-flowing with inadequate contact to the atmosphere for sewage reaeration to prevent anaerobic conditions [2,3,4]. Under anaerobic conditions, sulphate-reducing bacteria (SRB) found in the biofilms attached to the sewer walls are activated and participate in sulphate respiration in which sulphate is reduced to sulphide which then diffuses into flowing bulk wastewater. It is generally seen that lengthy pressure sewers with infrequent pumping and long residence times are often associated with severe sulphide problems. At the discharge point of pressure sewers, the sulphide-rich wastewater makes its first contact with the atmosphere partaking in the release of the gaseous form hydrogen sulphide (H2S). Indeed, the flow conditions (turbulent flow), sewage pH, and temperature at the point of discharge all influence the extent to which H2S is transferred from the bulk wastewater to the gas phase. H2S gas release from sewers is known for its adverse effects like odour nuisance and corrosion of the sewer infrastructure which are major concerns for water utilities worldwide [5,6]. In fact, a survey on the status of sewer systems in Germany indicated that 10% of the sewer system are estimated to show surface damages including corrosion [5].
The formation of sulphide in pressure sewers should ideally be addressed at the design and construction phase to avoid anaerobic conditions and turbulence at the discharge points. However, for sewers that already exist, several methods have been investigated with the use of chemical and biological technologies being generally favoured to prevent or decrease sulphide formation and H2S gas emission [6]. These technologies are typically applied to target the sulphide flux across the sewer biofilm–wastewater interface; target the release of the hydrogen sulphide across the wastewater–sewer atmosphere interface; or be able to provide conditions that limit the mass transfer of sulphide across both aforementioned interfaces, e.g., magnesium hydroxide (Mg(OH)2) or ferric chloride (FeCl3).
The application of conventional technologies such as the use of nitrate salts-sulphide removal by oxidation and iron salts-sulphide removal by precipitation are highly favoured in Germany [7,8,9]. To date, the dosage of these conventional salts is generally conducted at the pump stations at the start of the pressure sewer requiring high chemical demand. Recent studies on optimizing the application of these conventional chemicals suggest that less chemicals are required when added near the end of the pressure sewer [3,10,11]. However, continuous chemical dosing is still required, incurring high chemical consumption and operational cost [12].
In the last decade, the intermittent use of biocidal agents such as sodium hydroxide, free nitrous acid, and ferrate has emerged as a potential technology to reduce the chemical input in sewers whilst attaining total control of sulphide-producing activity [13,14,15]. Both laboratory and field studies have demonstrated the strong biocidal effects of free nitrous acid (FNA) on sewer biofilms when applied intermittently, highlighting the opportunity to reduce the chemical input into sewers for sulphide control [12,14,16]. Laboratory trials performed by Jiang et al. (2011) [14] found that FNA was able to suppress sulphide and methane production at concentrations of 0.26 g N L−1 or higher when exposed for 12–96 h. Under these conditions, a dosing interval of 4.5 days was required to reduce sulphide production by 80%. Gao et al. (2016) studied the responses of a model sewer corrosion bacterium Desulfovibrio vuglaris which was exposed to FNA treatment to further increase the fundamental understanding of the antimicrobial mechanisms of FNA treatment for sulphide control [17]. The study revealed that the switch from a status prolific growth to a phase of severely inhibited growth, shutting down protein synthesis, and oxidative stress were key antimicrobial mechanisms of FNA exposure [17].
So far, reported field applications of FNA dosing have been made only in Australia and the USA [12,16]. In both studies, sodium nitrite and hydrochloric acid were simultaneously dosed to the wet-well of the pump station in a controlled manner to ensure that wastewater slugs being pumped have the desired FNA concentration. The field application of FNA in Australia demonstrated that one single dose for 8–24 h at a concentration of 0.26 mg N L−1 can provide lasting effects up to 10 days for an average reduction of sulphide by 80% [8]. Furthermore, these studies have demonstrated that the concentration of FNA, exposure time, and the recovery of sulphide production directly influence the length of the dosing intervals. Altogether, these parameters form the necessary parameters to develop a cost-effective intermittent dosing strategy.
In light of the successful FNA applications, this present work aims to assess the application of free nitrous acid as an alternative sulphide control technology in Germany. Specifically, for systems with long pressure mains that are used for conveying wastewater from rural or suburban areas to a centralized treatment facility. Using the sewer pilot plant of the Berlin Water Company (Berliner Wasserbetriebe, BWB, Berlin, Germany), the effectiveness and biocidal effects of FNA were investigated. Finally, the possible side effects and practical implications of FNA usage in Germany are reviewed and discussed to shed light on future FNA dosing applications.
2. Materials and Methods
2.1. Sewer Pilot Plant
The sewer pilot plant used in this study is designed to mimic the operation of a real sewer system using a direct supply of raw wastewater from the wet-well of the BWB Berlin Neukölln pump station (Figure 1). Wastewater is intermittently fed to a high-density polyethylene (HDPE) 200 m long pressure sewer with a nominal diameter of 100 mm using a dry centrifugal wastewater pump (ORPU ES 130, ORPU Pumpenfabrik GmbH, Oranienburg, Germany). The pressure sewers are enframed by a steel structure forming a helical coil-like geometry to reduce space requirements in the experimental hall. The corresponding area to volume (A/V) ratio is 40 m2/m3. The discharged wastewater from the pressure sewer is conveyed through an HDPE 25 m long gravity pipe with a nominal diameter of 400 mm and a slope of 1.2%. The transfer zone between pressurized and gravity sewer represents a typical critical point for the release of hydrogen sulphide H2S gas along a sewer network. The gravity sewer was therefore used to monitor and evaluate the release of H2S gas across the bulk wastewater–sewer atmosphere interface during the FNA treatment of the pressure main. Wastewater sampling was possible at the ball valves installed at multiple locations of the pilot plant.
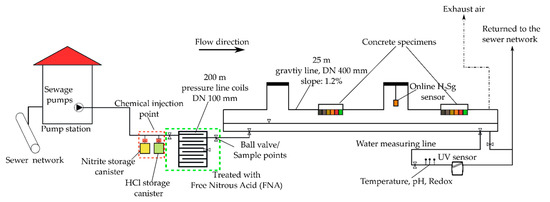
Figure 1.
Schematic representation of the sewer pilot plant used for investigating the dosing of free nitrous acid for sulphide control in pressure sewers.
To promote anaerobic conditions for sulphate reduction by sulphate-reducing bacteria in the pressure sewer, we adopted wastewater pump cycles and a diurnal hydraulic residence time pattern similar to Gutierrez et al. (2011) [18] (see Figure 2). A total of 17 pump cycles was made daily in which each pump event lasts 7 min at a flow of 4.5 m³ h-1 resulting in a parcel volume of 0.785 m³. The pumping schedule was programmed on the digital weekly timer (MaxiRex D72/1 Plus, Legrand, France) that is connected to a VLT HVAC Drive FC 100 frequency converter (Danfoss, Nordborg, Denmark) that controls the operation of the wastewater pumps. This schedule results in hydraulic retention times ranging from 1 to 8 h with an average HRT of 2.83 h and was used for the nondosing periods of all trials. The pumping schedule during the dosing duration of trial 6, 8, and 9 was altered (see Section 2.2). With the chosen flow rate and the pipe diameter of 100 mm, a flow velocity of 0.16 m s−1 is achieved. Operating the wastewater pump at higher flow rates was possible (maximum 9 m3 h−1); however, this continuously led to blockages, interrupting the operation of the pilot plant.
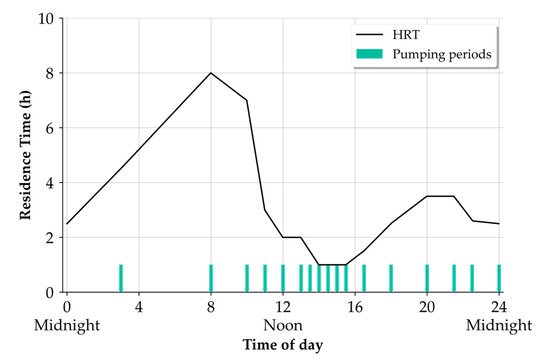
Figure 2.
Times of the wastewater pump operation and associated residence times of wastewater slugs exiting the experimental pressure sewer.
The wastewater entering the pump station and subsequently used for the dosing trials was a mixture of wastewater composed of discharges from combined and separate sewer systems. The sewage samples taken at the inlet of the pressure sewer under dry-weather flow conditions are characterized as being medium to high strength [4]. The sewage typically contained soluble chemical oxygen demand (COD) in the range 350–600 mg L−1, dissolved oxygen <1 mg L−1, and a pH between 7 and 8.5. Nitrate was typically <2 mg N L−1, and nitrite was found in trace amounts, <0.05 mg N L−1. The sulphate concentrations were typically very high (87–174 mg L−1) due to the high sulphate in the drinking water in Berlin resulting from mining activities upstream of the drinking water reservoirs [9]. The total dissolved-sulphide concentrations were <3 mg L−1, with temperatures ranging from 8 to 17 °C.
2.2. Dosing Trials Scheme
Each trial consisted of three phases, a baseline, a dose, and a recovery phase. Replications were difficult to achieve due to the challenges of having a continuous operation of the pilot plant and varying conditions and wastewater concentrations. The first set of trials was made during October (trials 1–6), hereafter referred to as autumn trials. During the autumn trials, we tested the effect of FNA considering short exposure times and varying concentrations. The second phase of the experiment (trials 7–9) was conducted in January, hereafter called the winter trials. In the winter trials, we studied the response of the pressure sewer biofilm when exposed to higher FNA concentrations and a treatment period of 24 h. The treatment period or exposure time defines the duration the pressure sewer biofilms were exposed to FNA and the period dosing was administered. Table 1 summarizes the trials made in this study.

Table 1.
Overview of the free nitrous acid (FNA) dosing trials; normal pump schedule refers to the pump cycles shown in Figure 2. With a 7 min pumping event, the pressure pipe is half-filled; with 14 min pump cycles, the pipe is filled. The FNA concentrations provided are based on the median of the inlet measurements conducted during the trial.
In this study, hydrochloric acid and sodium nitrite were simultaneously dosed directly into the beginning of the pressure sewer to achieve the target concentrations of FNA. The dosing rates were determined using Equation (1) to calculate the amount of acid and nitrite needed [19]. During the treatment period of all dosing trials (Table 1), we aimed to lower the pH of the wastewater parcel entering the pressure sewer to a pH of 6.
Before the trials, we determined the acid capacity and titration curves at different times of the day following DIN 38409–7 to estimate the amount of acid required to lower the pH [20]. From the derived titration curve, it was determined that on average 4.9 mmol L−1 H+-Ions were necessary to lower the wastewater to a pH of 6 and 2.4 mmol L−1 for a pH of 6.5. 36 w-% of HCl (technical grade Roth, Germany) was diluted to 20 w% with distilled water for safety reasons and then dosed into the inlet of the pressure pipe using a Gamma/4b solenoid-driven diaphragm dosing pump (Prominent, Heidelberg, Germany). For the nitrite, a stock solution from sodium nitrite (Roth, >99% purity) with a concentration of 135 g N L−1 was prepared. Dosing of both chemicals was made each time the sewage pump switched on and lasted for 7–14 min (specified by the pumping schedule in Table 1). The dosed FNA concentrations were verified by withdrawing samples from the inlet sample point (directly after the dosing point) during dosing periods. The median FNA concentrations are reported in Table 1.
2.3. Monitoring and Sampling
To account for the plug flow nature and biotransformation taking place within the pressure sewer, a salt tracer test following [21] was applied to derive a synchronized sample monitoring scheme to ensure that samples collected at the inlet and outlet belonged to the same wastewater parcel. Wastewater sampling of the pressure sewer was made predominantly at the inlet (L = 0 m) and outlet (L = 200 m). The coupled samples collected from the inlet and outlet of the pressure pipe were used to investigate the change in sulphide production and sulphate reduction. Some samples were also analysed for soluble COD to explore any heterotrophic activities of degrading COD. Additionally, nitrite and pH were also measured to determine the FNA-concentrations and nitrite consumption during the dosing event. All collected samples were immediately transported to the laboratory where they were stored and cooled to 4 °C. Samples for which sulphide measurements were to be made were immediately filtered and preserved by adding zinc acetate solution (0.4 mL 1 M per 100 mL of sample) to the filtered sample. All samples were measured within two days.
With regards to the online monitoring of the sewage parameters, a connection tube (called the water measuring line, WML) was installed at the outlet of the gravity sewer to divert wastewater to the measuring unit where Redox, pH (Kuntze Instruments GmbH, Meerbusch, Germany), and temperature sensors (Easytemp TSM487, Endress + Hauser, Reinach BL, Switzerland) were installed. Additionally, a UV spectrometer with a spectral range of 200–360 nm and optical path length of 1 mm (OPUS, TriOS, Rastede, Germany) was installed at the end of the WML in a 50 L barrel. Measurements were recorded every minute to capture the periods when the wastewater pump was switched on. The spectrometer was locally calibrated to measure nitrate, nitrite, soluble COD, and total dissolved sulphide. Since the spectrometer directly measures the bisulfide ion (HS-), the recorded pH and temperature values were used to calculate the total dissolved-sulphide concentration using Equations (A1)–(A3) provided in the Appendix A.
An online H2S gas sensor (H2S-guard, Kemira Oyj, Helsinki, Finland) was installed in the gravity line to monitor the sewer atmosphere and to evaluate the H2S emission of the wastewater parcels that were subjected to FNA treatment. To compare the different dosing trials with each other and with previous studies we calculated the parameters of the biofilm regrowth for each trial. The H2S gas concentration normalized on the baseline was used as a rough indication for sulphate-reducing bacteria (SRB) activity. The baseline was calculated by the hourly daily pattern of the 3 days prior to dosing. A concentration of 1 means the H2S after dosing reached the predosing level. For the fit, we resampled the H2S-concentration by taking the median over 3 hours. Furthermore, a temperature correction using the Arrhenius equation with α = 1.07 was applied to H2S gas measurements used for comparison. A modified Gompertz model (Equation (2)) was used to model the recovery since it was used in previous studies for FNA recovery modeling [22]. Y (-) describes the temperature and baseline-corrected H2S-ratio, Y0 (-) the residual H2S ratio during dosing, A the Amplitude (-), α the recovery rate (d−1), and t0 the time of maximum recovery rate (d).
The data recorded from the WML were used to specifically evaluate the change in wastewater during the FNA treatment and the immediate recovery periods. To further analyse the effectiveness of the FNA dosing trials, the dissolved sulphide, nitrite, pH, and H2S gas concentration of the wastewater slugs or parcels exiting the experimental pressure sewer were measured and evaluated. The median and median absolute deviation of the measurement obtained from the online sensors (described in Section 2.3) during a pumping event was also used to describe the effect and transformations that occurred during each event.
2.4. Chemical Analysis
Samples that were measured for soluble COD, sulphate, nitrate, and nitrite were filtered through a 0.45 µm combined glass fibre-polyester syringe filter (GF/PET-45/25, Macherey-Nagel, Düren, Germany) before being measured photometrically using the relevant Hach Lange cuvette test kits. The samples taken during the dosing and immediate recovery periods contained residual nitrite concentrations above 1–180 mg L−1, we corrected the measured COD by subtracting the contribution of nitrite on the basis of 1.1 g COD/g NO2-N to account for nitrite interference [23]. Sulphide was measured using a modified method by Saračević, 2009 [24] based on the DIN 384405-D 27 [25]. Sample preservation was done immediately after sample collection following APHA Standards [26] in which sodium aluminium hydroxide and sodium hydroxide were used for flocculation and sedimentation instead of filtration, followed by the addition of zinc acetate for sample preservation.
3. Results and Discussion
3.1. Baseline Sulphide Monitoring
Figure 3a,b shows the diurnal profiles of the gaseous H2S and total dissolved-sulphide concentrations recorded during the baseline monitoring of the autumn trials. Measurements were made at the end of the pressure sewer. Typically, the highest H2S gas and dissolved-sulphide concentrations were recorded for the wastewater slugs with the highest residence times (8 h) as illustrated in Figure 3c. However, it was observed that the wastewater fed to the experimental lines immediately after the cleaning cycle of the wet-well of the pump station (10:00 am) had the tendency to produce the highest H2S gas and dissolved-sulphide concentration at a residence time of 2 h. This is likely due to the increased sulphide and soluble COD concentrations entering the experimental pressure sewers.
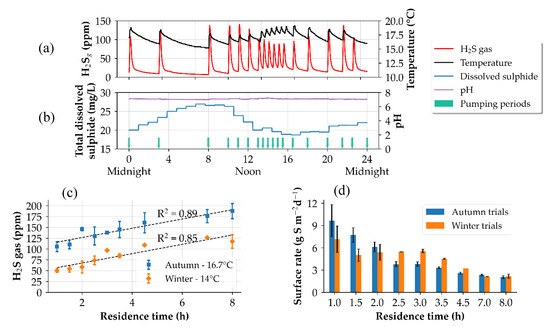
Figure 3.
Depiction of the baseline monitoring of the pressure sewer without FNA treatment. (a) hydrogen sulphide (H2S) gas concentration and wastewater temperature, (b) pH and dissolved-sulphide concentrations. (c) Comparison of the baseline H2S gas concentrations at different temperatures, (d) surface sulphide production rates of the autumn and winter trials. The median absolute deviation is used as the error bars.
The average dissolved-sulphide concentration during autumn trials was 22.0 ± 4.8 mg L−1 at a sewage temperature of 16.8 ± 1.7 °C. For winter trials, a temperature drop of 2.7 °C was noted with an average dissolved concentration of 16.1 ± 6.4 mg L−1. The averaged H2S gas concentrations during the autumn and winter trials were 144.6 ± 30.3 and 87.5 ± 26.1 ppm, respectively. During the periods of no flow through the gravity sewers, the H2S decreased to concentrations below 5 ppm, indicating that there was a disappearance of H2S gas either by uptake of sulphide by concrete specimens placed in the gravity sewers, air dilution, or discharge to the exhaust vent. Jiang et al. (2013) [12] found a similar disappearance of H2S gas concentration during the field trials. Under baseline conditions, the wastewater pH entering the pressure sewer ranged from 7 to 8.5. The measurements at the end of the pressure sewer showed that the pH usually decreased by 0.2–0.4 pH units indicating that there was an increase in H+ ions, probably because of volatile fatty acid production during the transport time of the wastewater slug.
The sulphide production rates were measured before the start of both trial periods (autumn and winter trials) to quantify the SRB activity before FNA treatment was applied. For the autumn measurements, the average sulphide production was 4.78 ± 0.54 g S m−2 d−1 with the highest sulphide production rates being measured at the lower residence times which gradually decreased with increasing residence times as shown in Figure 3d. A similar trend was observed for the winter measurements, however with a lower production rate of 3.60 ± 0.54 g S m−2 d−1 as a result of a temperature drop of 2.7 °C. Since the reduction of sulphate to sulphide mostly occurs during the periods of active mixing and immediately following the end of a pumping event, the wastewater slugs with shorter residence times yielded higher production rates as compared to the slugs with higher residence times where quiescent or still conditions dominated [27].
The production rates measured in the pilot plant were considerably higher compared to values reported from real sewers where the typical range is 0.19 to 2.4 g S m−2 d−1 [4,18,28]. Compared to the operation of real pressure sewers, the experimental pressure sewers were operated with low flow velocities of 0.16 m s−1, much less than the minimum recommended design values (flow velocities >0.8 m s−1 or shear stress of 4 N m−2) for self-cleaning in pressure sewers [4,29,30]. Under these flow conditions, thicker and more resistant biofilms with higher sulphide production potential are expected. Furthermore, the relatively high soluble COD and sulphate concentrations measured at the inlet of the experimental pressure sewer are believed to influence the high sulphide production rates [4,31].
3.2. Effectiveness during the FNA Dosing Event
Figure 4 shows an example of the online gas- and liquid-phase measurements of the wastewater parcels exiting the pressure sewer before, during and after the dosing event. The dissolved sulphide during the dosing events was typically reduced to concentrations <0.5 mg L−1 with sulphide decrease >90%. As for the H2S gas concentrations measured in the connecting experimental gravity sewer, the decrease was found to be much less in comparison to the liquid-phase dissolved-sulphide removal. During the autumn trials, reduction in H2S gas ranged from 54 to 79%, while for the winter trials, reduction values of >85% were achieved for two out of the three trials. (Figure A2). It is noteworthy that at negligible dissolved-sulphide concentrations (<0.1 mg L−1) measured during a dosing event, H2S gas release exceeded concentrations of 5 ppm in the headspace of the connecting gravity sewer. This indicates that the lowering of wastewater pH during the dosing event can enhance the H2S transfer from bulk wastewater to the sewer gas phase [14]. This finding suggests that FNA treatment on pressure sewers that are directly connected to a gravity inceptor and act as the main supply to the inceptor can still contribute to H2S release during the treatment period.
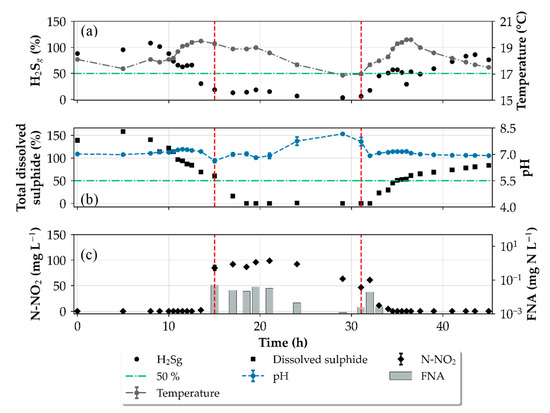
Figure 4.
Example (trial 5) of the profiles for H2S gas and wastewater temperature (a), dissolved sulphide and pH (b), and the residual nitrite and free nitrous acid profiles (c) during the fifth trial. Start and stop of the FNA treatment in (---), and (-⋅-) marks the 50% H2S gas recovery. The median absolute deviation (MAD) is used as the error bars. An exposure time of 12 h and a target FNA concentration of 0.56 mg N L−1 were used for this trial.
The gradual decrease in the H2S gas and dissolved-sulphide concentrations at the start of the dosing period indicate that chemical or biological oxidation of the sulphide by nitrite occurred, supporting the observations made in Jiang et al. (2011, 2013) [12,14]. Furthermore, the residual nitrite concentration measured by the UV spectral sensor in the water measurement line (exemplified in Figure 4), revealed that the added nitrite for each trial was consistently decreased by an interquartile range value of 48 mg N L−1 indicating that heterotrophic denitrification also occurred during the dosing period. A similar observation was made in the field study [12]. Furthermore, an increase of 0.3 to 1.3 pH units and higher COD removal rates during and immediately after dosing (25 g m−3 h−1 compared to 10 g m−3 h−1) also provided evidence that denitrification took place during the dosing. As a result of the sharp nitrite decrease and pH increase, the reductions of the FNA concentrations were mostly >90% for the autumn trials. The reductions indicate weaken FNA concentrations and explain the slight inhibitory effects observed during the autumn trials (Figure 5). In the last two trials significantly lower FNA reductions were measured. It is presumed that the change in dosing pattern, as well as the lower temperature and higher FNA-concentrations, may have led to the inhibition of microbial activity and therefore lower nitrite consumption.
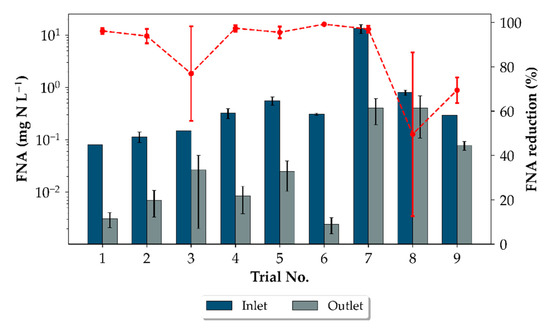
Figure 5.
Change in the FNA concentration during dosing. Inlet FNA concentration in ■ and the corresponding outlet concentration in ■. FNA reduction during the dosing periods for each trial are shown by (-●-). The error bars express the median absolute deviation (MAD). Correspondingnitrite and pH values are shown in Figure A1.
To investigate these mechanisms further, we computed the surface nitrite consumption rate using the inlet and outlet nitrite concentration and the residence times of the wastewater slugs during the exposure period. The maximum nitrite consumption rates found in this study were 0.78 and 0.69 g N m−2 h−1 for the autumn and winter trials, respectively. These consumption rates were found to be at least one order of magnitude higher than in Jiang et al. (2011) [14]. This shows the biofilms have a high capacity to utilize nitrite. Presumably, these high rates are caused by the biofilms adaption to previous nitrate salt dosing at the pilot plant. The long-term (3 months) and continuous addition of ferric nitrate before this study could have altered the biological and physical heterogeneity of the biofilms. Furthermore, the operation and flow conditions of the pilot plant may have also contributed to an increased thickness of the biofilm.
Finally, the ability of SRB species to consume nitrite and subsequently reduce the FNA concentration was shown by Gao et al. (2016) [17]. The authors of [17] indicated that the nitrite reductase in the studied SRB bacterium reduced nitrite to ammonium, allowing it to survive in environments in the presence of nitrite. Jiang et al. (2011) [14] also indicated that 4–5% of microorganisms in the studied sewer biofilms survived the exposure to FNA at 0.31 mg N L−1 for 24 h highlighting the possibility of FNA resistance. These findings corroborate that the sewer biofilms in the pilot plant were able to utilize nitrite and were extensively resistant to FNA treatment.
3.3. Biocidal Effects
To compare the biocidal effects, we used a Gompertz growth model following [22] to fit the recovery of H2S gas released into the headspace of the experimental gravity line after the end of each dosing trial. The recovery plots in Figure 6a show that an increase of the FNA concentration from 0.11 to 0.68 mg N L−1 and exposure time of 12 h had little-to-no effect on attaining H2S gas release to <10% for long periods as sulphide production resumed almost immediately. Figure 6b demonstrates that increased FNA concentration and exposure time had a greater influence on the recovery of sulfidogenic activity. It is apparent that at a dosage of 13.3 mg N L−1 for 24 h (trial 7), the shape of the fitted model appeared to closely resemble the regrowth of the sulphide producing activity as demonstrated in [14] when compared to the trials in this study with lower FNA concentrations and shorter exposure times. However, trial 7 was performed at a lower temperature (2.5 °C less) compared to the first six trials and was severely affected by rain events; both of which could have caused a delay in the recovery process.
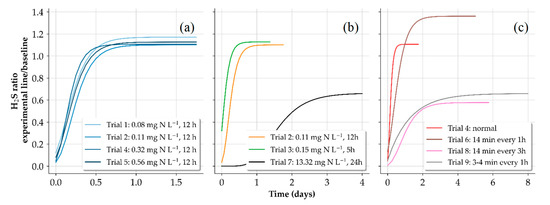
Figure 6.
Gompertz fit for different concentrations of FNA and an exposure time of 12 h (a). Different exposure times (b). Chemical addition of trials in (a,b) corresponded to the wastewater pump schedule. Recovery period for different dosing strategies (c). Zero on the x-axis marks the stop of the dosing.
The FNA concentration of 13.3 mg N L−1 used in trial 7 was much higher than the levels reported in other studies investigating sewer biofilms (0.26 mg N L−1, ~51 times higher) [14] and sewer sediments (2.34 mg N L−1, ~6 times higher) [32]. H2S gas release recovered to 50% in about 2 days, which eventually increased and remained to around 64% until the next dosing trial. Even at a high FNA concentration, increased exposure time, and the influence of environmental conditions, we were unable to achieve biocidal effects as demonstrated in previous studies [12,14,33]. Furthermore, because of the low flow velocity used throughout the trials, sediment deposition and accumulation was likely, and thicker biofilms were expected. As a result, the thick layers (sediment + biofilm) were likely to limit the penetration of FNA into sulphide producing regions. Zuo et al. 2020 [32] found that FNA exposure does not have a notable effect on the microorganisms in the deeper layers of the sediments and that FNA suppression was only effective at the sediment surface. Furthermore, Jiang et al. (2011) [33] pointed out that the biocidal effect of FNA is reduced by the limitation of mass transfer in thick sewer biofilms and that some microorganisms in the biofilm might be resistant to FNA, even at concentrations of 3 mg N L−1 for an exposure time of 24 h.
The trials shown in Figure 7a,b were all made using the normal dosing schedule in which chemical addition was made each time the wastewater came on. Given the immediate recovery of trials 1–5, we deduced that FNA concentrations of the treated wastewater slugs were drastically reduced by the time it was transported to the second section of the pressure sewer. For this reason, in the final autumn trial (trial 6), we investigated the effects of completely filling the entire pressure sewer with FNA-dosed wastewater to expose the entire pressure sewer biofilm to the same FNA concentration. However, we found no significant change in the recovery when compared to the previous trials (Figure 6c). Noting the daily transitions of the active mixing to the prevalence of quiescent conditions in pressure sewers, we investigated the difference between a scenario in which quiescent conditions dominate during the dosing period (trial 8) to a case in which active mixing is dominant (trial 9). However, we found no conclusive evidence suggesting that the different transport states influenced the recovery of the sulphide producing activity since the winter trials were severely affected by rain events.
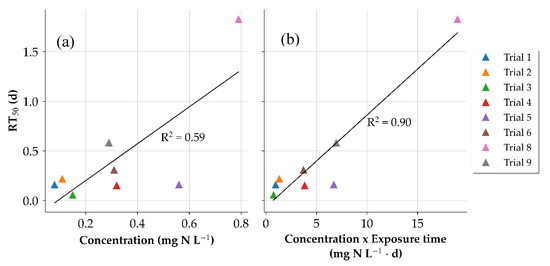
Figure 7.
Comparison of times for half recovery (RT50) with respect to concentration (a) and concentration and exposure time combined (b) for the FNA dosing trials.
To further compare the influence of the different concentrations and exposure times, the times for half recovery (RT50) was used as an indicator for the biocidal effects which were calculated from the Gompertz curves of the respective trials. The results are shown in Figure 7. For the concentration, it could be shown that the concentration and the recovery have a slightly visible linear correlation (R2 = 0.59). To include the combination of exposure time and concentration the product of both parameters was compared. A stronger linear relationship (R2 = 0.90) was visible indicating a stronger biocidal effect for increased concentrations and exposure times. Jiang et al. (2011) [14] found that the speed of the recovery did not depend on the concentration or exposure time when complete suppression was achieved indicating that the bacteria embedded in the biofilm matrix were completely inactivated. As for this study, it is suspected that true inactivation was not attained throughout the length of the pressure sewer during the dosing duration, and some metabolic activity in the biofilm was sustained. Therefore, instead of only increasing the concentration suggested in [34] to complete inactivation, longer exposure times are also recommended.
For an efficient intermittent dosing strategy, the H2S needs to be lowered, e.g., to 3 ppm to avoid corrosion [8,35], which means a 2% recovery time (RT2) for the autumn trials and 4% recovery (RT4) in winter trials considering the baseline H2S concentration of 144.6 ± 30.3 and 87.5 ± 26.1 ppm, respectively, during the pumping events. These efficiencies were only reached directly during dosing. The RT2 or RT4 should have been calculated to model when the next dosing event would have been necessary to keep the H2S below 3 ppm. However, these values were so low that no comparison of the trials would have been possible.
The concentrations and exposure times investigated in this study were comparable to the ones from [14]. With these concentrations, little-to-no biocidal effects were detected in this study (RT50 of 0.2–0.3 days). There are a few indications that higher concentrations and exposure times can suppress sulphide production longer, but further investigations are necessary to prove this since the winter trials were interrupted by rain events which were proven to slow down the recovery by dilution [12]. The reason for the described differences can be the performance of the pilot plant as described in Section 3.1., with high initial sulphide production rates, the high sulphate and COD values in the influent wastewater offering enough substrate to regrow, thick biofilms due to low shear forces, and several previous dosing trials with nitrate salts which might have led to the increased resistance of the biofilms. It can be concluded that for the pilot plant overall conditions, with strong influential wastewater in moderate climate regions, higher FNA concentrations, and assumably exposure times >24 h are necessary to reach a biocidal effect.
3.4. Impact of Rain Events
The wastewater used for the investigations composed of discharges from separate and combined sewers and is heavily influenced by weather conditions. For the rain-affected days, it is expected that the added rainwater dilutes the sewage substrates, inducing lower sulphide production rates [12]. Besides the lowering of the sulphide production rates, the acid-binding capacity of the wastewater during rain events can also be altered. In our study, we found that the acid added to achieve the desired FNA-concentration reduced the pH below the target of 6.0 indicating the acid-binding capacity during the rain-affected days was lowered. In Figure 8b, the pH measurements at the outlet of the pressure sewer during the winter trials are shown, highlighting the influence of the rain events on pH values and subsequently the FNA concentration, since lower pH values yield higher FNA concentrations. In trial 7, a median pH of 4.7 was recorded during the verification of the inlet measurements resulting in an FNA concentration of 13.3 mg N L−1 instead of the targeted 0.46 mg N L−1. Under dry-weather conditions and the same doing rates, a pH of 6.2 was measured at the inlet for trial 9. An overall average sulphide reduction of 64% was maintained during winter trials when FNA was added intermittently at 7 day intervals at exposure times of 24 h (Figure 8a). This shows that the intermittent application was able to achieve partial sulphide control despite the rapid recovery of the sulphide producing activity. Furthermore, a dosing program similar to the winter trials can be used for further optimization strategies. For example, a shock dosage—a high dosage that completely disrupts SRB activity, followed by conditioning dosage—ensures that SRB activity is completely deactivated and maintenance dosages—to keep sulphide at the target level—can be implemented [16,36].
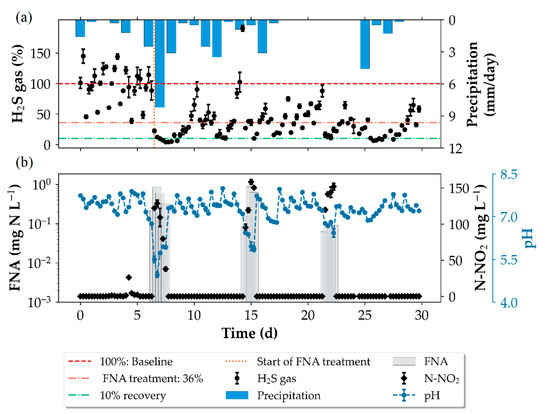
Figure 8.
Influence of the rain events on the recovery of H2S gas release in the experimental gravity sewer (a), pH changes and FNA concentrations (b). Residual nitrite concentration at the end of the pressure sewer also in (b). Error bars are represented by median absolute deviation.
3.5. Possible Side Effects
Nitrite and FNA are biocides that could affect the biology of the wastewater treatment plant (WWTP) if they reach it in high concentrations. As shown in Figure 5, the FNA-concentrations in the pilot plant decreased by more than 90% or 70–80% for the higher concentrations, respectively. Furthermore, usually only a section of the sewer network is treated at a time; therefore, the dosed wastewater is mixed with other receiving wastewater upon arrival at the inlet of the WWTP and most likely has no influence on biological treatment processes.
The minimum recommended acid capacity for working nitrogen removal in the WWTP is 1 mmol L−1 per 7 g total nitrogen [37]. In the studied wastewater, an acid capacity of 3–6 mmol L−1 on average is remaining after the addition of 4.35 mmol L−1 HCl to reach a pH of 6. Therefore, with a total nitrogen of 60–90 mg L−1 (data not shown), the remaining acid capacity could be problematic. However, the denitrification taking place consumes protons as confirmed by pH measurements. In addition, again, the dosed wastewater is expected to be diluted on its journey to the treatment plant. Therefore, it can be concluded that no biocidal effects or negative impacts due to a lack of acid-binding capacity on the WWTP are expected.
Dosing FNA can consequently influence the greenhouse gas effect based on two processes with contrasting contributions: (1) the production of nitrous oxide (N2O) with a global warming potential (GWP) of 265–298 CO2-eq [38] due to the nitrite addition [39,40] and (2) the long-lasting inhibition of methane (GWP of 28–36 CO2-eq [38])-producing microorganisms by FNA [33,41,42]. Several studies investigating N2O formation in WWTP indicated that a high nitrite concentration in the anoxic zones was strongly linked to N2O formation [39,40]. Indeed, a high nitrite concentration causes a high turnover for nitrite reductase during denitrification, resulting in a higher production rate of N2O [43]. The high nitrite concentrations used in our study and the resulting high consumptions rates are indicative of a potential N2O build-up during the FNA treatment. Jiang et al. (2011) [14] measured an average N2O production rate of 0.23 mg-N L−1 during the FNA trials in a laboratory-scaled anaerobic sewer reactor with nitrite consumption rates one order of magnitude less than our study, further supporting the occurrence of the N2O build-up in our study. With significant concentrations of N2O in wastewater and turbulent conditions, N2O release is imminent and should therefore be taken into consideration during the planning and development stage of the dosing strategy.
Methane release from anaerobic sewers was estimated to be 43–52% of the overall emission from the wastewater system [40]. FNA treatment can permanently suppress methane production in sewers, with the recovery of production seven times slower compared to sulphide production as shown by Jiang et al. (2011) [33]. If the dosing is kept short and only one section is dosed at a time, the methane emission inhibition could compensate for the additional N2O emission. However, N2O and methane need to be measured in the sewer atmosphere before drawing any conclusions. In summary, negative effects on the treatment plant and climate change effects can be avoided only once one sewer section is dosed at a time to dilute the dosed wastewater and measures are implemented to minimize N2O release.
3.6. Practical Implications and Usage in Germany
In terms of local availability, the German chemical producing company BASF is the largest producer of sodium nitrite outside of China [44]. This means that nitrite can be locally sourced making it a potentially price-competitive alternative to the existing conventional chemicals. Unlike the conventionally used chemicals like iron and nitrate salts, the solution requires preparation from sodium nitrite powder which is laborious. Furthermore, the powder is strongly oxidizing and requires special safety handling as well as breathing protection against dust.
From a legal perspective, the dosing of toxic compounds in sewers is usually not allowed in Germany due to the possible subsequent problems in the treatment plant [45]. However, dosing FNA is still legally possible if the dosing facilities comply with safety measures and ensure sufficient dilution and nitrite consumption within the sewer network to assure safe operation of the receiving wastewater treatment plant. In Germany, the water management act [46] is generally responsible to protect water bodies from harmful influences. The criteria by which the wastewater discharged must fulfil is described in the wastewater ordinance [47]. For the dosing of FNA and nitrite, the indirect discharge ordinance might be of interest, which exists differently in every federal state in Germany, i.e., as in [48], and regulates which substances are permitted to be discharged into a public sewer. The water management act §58 [46] states that permission to discharge water into a public sewer can only be given if the criteria of the wastewater ordinance can still be met by the receiving wastewater treatment plant. Therefore, the discharges from an FNA-treated sewer section must be sufficiently diluted before reaching the treatment plant. Additionally, the dosing station has to abide by the ordinance for facilities dealing with water endangering substances to avoid contaminations of surrounding water bodies by leakages of the dosing agent [49].
Furthermore, it is recommended to dose directly into the wet-well where better mixing is possible and sulphide has not been formed yet. For practical applicability, it is also easier to dose two chemicals since no second injection point is needed. A simple application would be the installation of a controlled pH system because pH-sensors are cheap and widely available [50]. That would also prevent an overdosage of acid during rain events or during the day because acid capacity measurements in this study showed high variations within the diurnal pattern.
The pH lowering during dosing events can lead to unstable sulphide measurements when using UV/Vis spectral sensors, mainly because the sensor directly measures the bisulfide ion (HS−) in which the absorption is strongly pH dependent. At lower pH values, the molecular form H2S is mostly present, lowering the detection of HS- by the sensor. The measurements during trial 7 showed supposedly too high of the total dissolved-sulphide concentrations due to the low pH disturbing the HS- measurement. This could affect online dosing control systems that are based on UV-Vis sulphide measurements.
In a real pressure sewer, higher flow velocities are expected to influence the mass transfer of solute (FNA) into deeper biofilm layers where sulphate reduction occurs. Additionally, biofilm sloughing and detachment processes occur in sewers that are self-cleansing. During FNA treatment, increase biofilm detachment is expected allowing the consecutive FNA dosing application to be more effective over time. Unfortunately, these occurrences were not observed in our study due to low flow velocities, giving rise to the assumption of the influence of hydraulic conditions on mass transfer processes which were highlighted by the relatively weak biocidal effects in this study.
The findings of this study can be applied to sewer systems and sections that are severely affected by sediment deposition and accumulation such as inverted siphons, sewers operated with infrequent wastewater pumping, and low flow velocities. Under these conditions, much higher FNA concentrations and exposure times may be necessary to effectively inactivate sulphide-producing bacteria which would increase the risk of contributing to N2O emission.
4. Conclusions
In contrast to other studies investigating the biocidal effects of free nitrous acid on sewer biofilms, it was found that concentrations as high as 13.3 mg N L−1 are insufficient to achieve long-lasting inactivation of sulphide producing bacteria. The sewer pilot plant used in this study provided conditions that were symptomatic of a system with severe sediment accumulation which was identified as a key factor affecting the SRB suppression by FNA. Furthermore, high nitrite consumption and sharp pH increase ranging from 0.3 to 1.3 pH units during the dosing weakened the FNA concentration, inducing a negligible inactivation effect.
From the standpoint of usability in Germany, FNA is legally possible; however, concerns of its contribution to greenhouse gas emissions as a result of N2O production and release require further investigation. In the winter trials, a dosing interval of 7 days was able to maintain an H2S gas removal efficiency of 64%, which was inadequate to avoid problems of odour and corrosion. Only partial sulphide control was achieved, even though these trials were affected by rain events, highlighting the ability of sulphate-reducing bacteria to resist FNA treatment and adapt to changing conditions. Overall, the idea of using intermittent chemical addition for sulphide control remains at large and the results of this study stress the challenges of chemical dosing on different systems as microbial variability and operating conditions always tend to differ. Therefore, it is important to question the suitability of FNA for systems with similar conditions shown in the studied pilot plant. To further understand the working mechanisms of the FNA and possible FNA-resistant species of SRB, a thorough investigation of the biofilms in the pilot plant in comparison to sewer sections affected by sedimentation should be considered.
Author Contributions
D.D. and L.R. conceived and designed the experiments; D.D. and L.R. performed the experiments; L.R. made preliminary data analysis; D.D. made final data analysis and visualization; D.D. wrote the paper; L.R., A.A., and M.B. revised the paper. All authors have read and agreed to the published version of the manuscript.
Funding
This work was supported by the DFG Urban Water Interfaces (UWI) Research Training Group (GRK 2032).
Institutional Review Board Statement
Not applicable.
Informed Consent Statement
Not applicable.
Data Availability Statement
The data presented in this study are available upon request from the corresponding author.
Acknowledgments
The Berliner Wasserbetriebe (BWB) allowed the use of the research sewer pilot plant and supported the investigation.
Conflicts of Interest
The authors declare no conflict of interest. The funders had no role in the design of the study; in the collection, analyses, or interpretation of data; in the writing of the manuscript, or in the decision to publish the results.
Appendix A
Appendix A.1. Conversion of the Bisulphide (HS−) to Total Dissolved-Sulphide (ST)
Since S2− is not expected at pH < 10, we only considered the bisulfide and molecular H2S form in the conversion. The pK1 value was calculated according to [51]
Appendix A.2. Summary of the Hach Lange Cuvette Test Kits Used in the Study
Table A1.
Hach-Lange LCK cuvette tests used for chemical analysis.
Table A1.
Hach-Lange LCK cuvette tests used for chemical analysis.
| Parameter | Cuvette Test | Range |
|---|---|---|
| Sulphate | LCK 153 | 40–150 mg/L |
| COD | LCK 114 | 150–1000 mg/L |
| Nitrite | LCK 341/342 | 0.015–0.6/0.6–6 mg N-NO2−/L |
| Nitrate | LCK 339 | 0.23–13.5 mg N-NO3−/L |
Appendix A.3. Response of Pressure Sewer Biofilms to the FNA Dosing
Figure A1 shows the nitrite reduction and subsequent pH increase during FNA dosing trials and provides supporting arguments that denitrification took place and consequently reduced the FNA concentration during the dosing.

Figure A1.
Reduction in nitrite concentration (a) and increase in pH (b) during the dosing periods of the trials. Inlet sample taken for verification of target concentrations are in ■, wastewater slugs arriving at the outlet of pressure sewer are in ■. Error bars are represented by the median absolute deviation.
Figure A2 provides supporting arguments on the point that H2S gas release during FNA dosing is still possible due to the lowering of the pH which favours the release of H2S gas.

Figure A2.
Reduction in dissolved sulphide and H2S gas concentration during the dosing periods of each trial. Dissolved-sulphide concentration at the end of the pressure sewer measured using an online UV spectral sensor are in ■, H2S gas concentration measured in the connecting gravity line is in ■. The reduction percentages were derived from calculating the difference between the baseline concentrations and the median concentrations during dosing periods.
Appendix A.4. Fitting the Recovery of H2S Gas Release


Figure A3.
Recovery periods with model fit for all FNA trials. The concentrations dosed are displayed in the graph. Parentheses indicate no inlets were measured and this is the calculated concentration. The data points are resampled values over 3 h, error bars indicate the 20% and 80% quantile. FNA 9 is not shown because no fit was possible.
References
- Butler, D.; Digman, C.J.; Makropoulos, C.; Davies, J.W. Pump systems. In Urban Drainage, 4th ed.; Taylor & Francis Group: Abingdon, UK; CRC Press: Boca Raton, FL, USA, 2018; p. 293. ISBN 978-1-4987-5060-8. [Google Scholar]
- Boon, A. Septicity in sewers: Causes, consequences and containment. Water Sci. Technol. 1995, 31, 237–253. [Google Scholar] [CrossRef]
- Kiilerich, B.; Nielsen, A.H.; Vollertsen, J. Kinetics of sulfide precipitation with ferrous and ferric iron in wastewater. Water Sci. Technol. 2018, 78, 1071–1081. [Google Scholar] [CrossRef]
- Hvitved-Jacobsen, T.; Vollertsen, J.; Nielsen, A.H. Sewer Processes: Microbial and Chemical Process Engineering of Sewer Networks, 2nd ed.; CRC Press: Boca Raton, FL, USA, 2013; pp. 10, 21, 222–223. ISBN 978-1-4398-8178-1. [Google Scholar]
- Berger, C.; Falk, C.; Hetzel, F.; Pinnekamp, J.; Roder, S.; Ruppelt, J. Zustand der Kanalisation in Deutschland. Zustand Kanalis. Dtschl. 2016, 2016, 498–508. [Google Scholar] [CrossRef]
- Zhang, L.L.; Ma, J.; Jin, Y.Y.; Zhang, H.H.; Liu, Y.Y.; Cai, L.L. Abatement of sulfide generation in sewage by glutaraldehyde supplementation and the impact on the activated sludge accordingly. Front. Environ. Sci. Eng. 2014, 9, 365–370. [Google Scholar] [CrossRef]
- Ott, F. Untersuchungen von ausgewählten Maßnahmen zur Verringerung der Geruchsproblematik in Abwassernetzen unter Berücksichtigung von Erfahrungen aus der Praxis. Master’s Thesis, University of Rostock, Rostock, Germany, 2004. [Google Scholar]
- Barjenbruch, M. Geruchsbelästigungen—die biogene Schwefelsäurebildung in Kanälen Ursachen und Maßnahmen. In Proceedings of the Geruchsbelaestigungen—Ursachen und Massnahmen, Berlin, Germany, 12 October 2007; p. 4. [Google Scholar]
- Dombrowski, E.-M.; Gnirss, R.; Kokles, S.; Sperlich, A. Wasserwerksschlämme Kontra Geruch Und Korrosion. WWT Online 2015, 7-8/2015, 29–33. [Google Scholar]
- Auguet, O.; Pijuan, M.; Guasch-Balcells, H.; Borrego, C.M.; Gutierrez, O. Implications of downstream nitrate dosage in anaerobic sewers to control sulfide and methane emissions. Water Res. 2015, 68, 522–532. [Google Scholar] [CrossRef]
- Kiilerich, B.; Van De Ven, W.; Nielsen, A.H.; Vollertsen, J. Sulfide precipitation in wastewater at short timescales. Water 2017, 9, 670. [Google Scholar] [CrossRef]
- Jiang, G.; Keating, A.; Corrie, S.; O’Halloran, K.; Nguyen, L.; Yuan, Z. Dosing free nitrous acid for sulfide control in sewers: Results of field trials in Australia. Water Res. 2013, 47, 4331–4339. [Google Scholar] [CrossRef]
- Gutierrez, O.; Sudarjanto, G.; Ren, G.; Ganigué, R.; Jiang, G.; Yuan, Z. Assessment of pH shock as a method for controlling sulfide and methane formation in pressure main sewer systems. Water Res. 2014, 48, 569–578. [Google Scholar] [CrossRef]
- Jiang, G.; Gutierrez, O.; Sharma, K.R.; Keller, J.; Yuan, Z. Optimization of intermittent, simultaneous dosage of nitrite and hydrochloric acid to control sulfide and methane productions in sewers. Water Res. 2011, 45, 6163–6172. [Google Scholar] [CrossRef]
- Yan, X.; Sun, J.; Kenjiahan, A.; Dai, X.; Ni, B.-J.; Yuan, Z. Rapid and strong biocidal effect of ferrate on sulfidogenic and methanogenic sewer biofilms. Water Res. 2020, 169, 115208. [Google Scholar] [CrossRef] [PubMed]
- Shultz, C.; Nostro, M.; Weidl, D. New technology for biofilm removal and hydrogen sulfide control in sewer lines: Lake Nona Trial. Fla. Water Resour. J. 2017, 68, 14–17. [Google Scholar]
- Gao, S.-H.; Ho, J.Y.; Fan, L.; Richardson, D.J.; Yuan, Z.; Bond, P.L. antimicrobial effects of free nitrous acid on Desulfovibrio vulgaris: Implications for sulfide-induced corrosion of concrete. Appl. Environ. Microbiol. 2016, 82, 5563–5575. [Google Scholar] [CrossRef]
- Gutierrez, O.; Sudarjanto, G.; Sharma, K.R.; Keller, J.; Yuan, Z. SCORe-CT: A new method for testing effectiveness of sulfide-control chemicals used in sewer systems. Water Sci. Technol. 2011, 64, 2381–2388. [Google Scholar] [CrossRef]
- Anthonisen, A.C.; Loehr, R.C.; Prakasam, T.B.; Srinath, E.G. Inhibition of nitrification by ammonia and nitrous acid. J. Water Pollut. Control. Fed. 1976, 48, 835–852. [Google Scholar]
- DIN Deutsches Institut für Normung e.V. German Standard Methods for the Examination of Water, Wastewater and Sludge—Parameters Characterizing Effects and Substances (Group H)—Part 7: Determination of Acid and Base-Neutralizing Capacities (H 7); DIN 38409-7; Beuth Verlag: Berlin, Germany, 2005. [Google Scholar]
- Huisman, J.L. Transport and Transformation Processes in Combined Sewers. Ph.D. Thesis, ETH Zurich, Zurich, Germany, 2001; pp. 21–22. [Google Scholar]
- Jiang, G.; Gutierrez, O.; Sharma, K.R.; Yuan, Z. Effects of nitrite concentration and exposure time on sulfide and methane production in sewer systems. Water Res. 2010, 44, 4241–4251. [Google Scholar] [CrossRef] [PubMed]
- Ma, B.; Bao, P.; Wei, Y.; Zhu, G.; Yuan, Z.; Peng, Y. Suppressing nitrite-oxidizing bacteria growth to achieve nitrogen removal from domestic wastewater via anammox using intermittent aeration with low dissolved oxygen. Sci. Rep. 2015, 5, 13048. [Google Scholar] [CrossRef]
- Saračević, E. Zur Kenntnis der Schwefelwasserstoffbildung und -vermeidung in Abwasserdruckleitungen; Inst. für Wassergüte, Ressourcenmanagement und Abfallwirtschaft, Technische Universität Wien: Wien, Austria, 2009; pp. 15–16. ISBN 978-3-85234-103-3. [Google Scholar]
- DIN Deutsches Institut für Normung e.V. German Standard Methods for the Examination of Water, Waste Water and Sludge—Anions (Group D)—Part 27: Determination of Sulfide by Gas Extraction Method (D 27); DIN 384405-D 27; Beuth Verlag: Berlin, Germany, 2016. [Google Scholar]
- APHA American Public Health Association. Standard methods for the examination of water and wastewater. In “4500-S2—SULFIDE”, Standard Methods for the Examination of Water and Wastewater; APHA-AWWA-WEF: Washington, DC, USA, 2018. [Google Scholar] [CrossRef]
- Shypanski, A.H.; Yuan, Z.; Sharma, K. Influence of pressure main pumping frequency on sulfide formation rates in sanitary sewers. Environ. Sci. Water Res. Technol. 2018, 38, 92. [Google Scholar] [CrossRef]
- Liang, Z.-S.; Sun, J.; Chau, H.K.-M.; Leong, E.I.-M.; Wu, D.; Chen, G.-H.; Jiang, F. Experimental and modelling evaluations of sulfide formation in a mega-sized deep tunnel sewer system and implications for sewer management. Environ. Int. 2019, 131, 105011. [Google Scholar] [CrossRef] [PubMed]
- Geruchsemissionen aus Entwässerungssystemen: Vermeidung oder Verminderung; ATV-DVWK, Deutsche Vereinigung für Wasserwirtschaft, Abwasser und Abfall, Ed.; ATV-DVWK-Regelwerk Merkblatt; Oktober 2003; ATV-DVWK Deutsche Vereinigung für Wasserwirtschaft, Abwasser und Abfall e.V: Hennef (Sieg), Germany, 2003; ISBN 978-3-924063-82-5.
- Park, K.; Lee, H.; Phelan, S.; Liyanaarachchi, S.; Marleni, N.; Navaratna, D.; Jegatheesan, V.; Shu, L. Mitigation strategies of hydrogen sulphide emission in sewer networks—A review. Int. Biodeterior. Biodegrad. 2014, 95, 251–261. [Google Scholar] [CrossRef]
- Feldhaus, R.; Poppe, A.; Frechen, F.-B.; Frey, M. Beeinflussung von Gewässern und Abwasserreinigung durch die Zugabe von Stoffen in Freispiegelkanälen zur Geruchsminimierung; Fachhochschule Köln: Köln, Germany, 2005; p. 449. [Google Scholar]
- Zuo, Z.; Zheng, M.; Chang, J.; Ren, D.; Huang, X.; Yuan, Z.; Liu, Y. Free nitrous acid-based suppression of sulfide production in sewer sediments: In-situ effect mechanism. Sci. Total Environ. 2020, 715, 136871. [Google Scholar] [CrossRef]
- Jiang, G.; Gutierrez, O.; Yuan, Z. The strong biocidal effect of free nitrous acid on anaerobic sewer biofilms. Water Res. 2011, 45, 3735–3743. [Google Scholar] [CrossRef]
- Jiang, G.; Yuan, Z. Inactivation kinetics of anaerobic wastewater biofilms by free nitrous acid. Appl. Microbiol. Biotechnol. 2013, 98, 1367–1376. [Google Scholar] [CrossRef] [PubMed]
- Weissenberger, J. Betonkorrosion Ein Forschungsprojekt Aus Norwegen.; Hydro-Care, 3.Mai In: Barjenbruch, Germany, 2007; [8]. [Google Scholar]
- Sercombe, D.C.W. The control of septicity and odours in sewerage systems and at sewage treatment works operated by anglian water services limited. Water Sci. Technol. 1995, 31, 283–292. [Google Scholar] [CrossRef]
- Gujer, W. Siedlungswasserwirtschaft: Mit 84 Tabellen; 3., bearb. Aufl.; Springer: Berlin/Heidelberg, Germany, 2007; ISBN 978-3-540-34329-5. [Google Scholar]
- US EPA Inventory of U.S. Greenhaouse Gas Emissions and Sinks 1990–2017; US EPA: Washington, DC, USA, 2019. [Google Scholar]
- Ahn, J.H.; Kim, S.; Park, H.; Rahm, B.; Pagilla, K.; Chandran, K. N2O Emissions from Activated Sludge Processes, 2008−2009: Results of a National Monitoring Survey in the United States. Environ. Sci. Technol. 2010, 44, 4505–4511. [Google Scholar] [CrossRef]
- Guo, L.; Porro, J.; Sharma, K.R.; Amerlinck, Y.; Benedetti, L.; Nopens, I.; Shaw, A.; Van Hulle, S.W.H.; Yuan, Z.; Vanrolleghem, P.A. Towards a benchmarking tool for minimizing wastewater utility greenhouse gas footprints. Water Sci. Technol. 2012, 66, 2483–2495. [Google Scholar] [CrossRef] [PubMed]
- Jiang, G.; Yuan, Z. Synergistic inactivation of anaerobic wastewater biofilm by free nitrous acid and hydrogen peroxide. J. Hazard. Mater. 2013, 250-251, 91–98. [Google Scholar] [CrossRef] [PubMed]
- Mohanakrishnan, J.; Gutierrez, O.; Meyer, R.; Yuan, Z. Nitrite effectively inhibits sulfide and methane production in a laboratory scale sewer reactor. Water Res. 2008, 42, 3961–3971. [Google Scholar] [CrossRef]
- Schulthess, R.; Gujer, W. Release of nitrous oxide (N2O) from denitrifying activated sludge: Verification and application of a mathematical model. Water Res. 1996, 30, 521–530. [Google Scholar] [CrossRef]
- Corkran, D.; Koopman, R.; Brecker, S.; Robinson, C.; Gallagher, P. Sodium Nitrite from China and Germany; Investigation Nos. 701-TA-453 and 731-TA-1136-1137; U.S International Trade Commission: Washington, DC, USA, 2014; p. 17. [Google Scholar]
- Franke, W. Abwasserkonditionierung—Chemische Verfahren. In Proceedings of the DWA-Seminar Odour and Corrosion, Wernigerode, Germany, 7 November 2018. [Google Scholar]
- German Federal Water Act (Wasserhaushaltsgesetz). Enacted on Juli 31st 2009 (Federal Law Gazette I p. 2585); Changed Lastly on June 19th 2020 (Federal Law Gazette I p. 1408). Available online: https://www.gesetze-im-internet.de/whg_2009/WHG.pdf (accessed on 19 January 2021).
- German Wastewater Ordinance (Abwasserverordnung). Version of June 17th 2004 (Federal Law Gazette I p. 1108, 2625); Changed Lastly on June 16th 2020 (Federal Law Gazette I p. 1287). Available online: https://www.gesetze-im-internet.de/abwv/AbwV.pdf (accessed on 19 January 2021).
- Hallesche Wasser und Stadtwirtschaft GmbH. Thresholds for Discharging into a Public Sewer; Appendix 2 of General Wastewater Discharge Conditions of the City of Halle, Saxony-Anhalt, Germany. 2007. Available online: https://hws-halle.de/privatkunden/kundenservice/downloads/abwasser (accessed on 19 January 2021).
- German Ordinance on Facilities Dealing with Substances Hazardous to Water (Verordnung über Anlagen zum Umgang mit Wassergefährdenden Stoffen). Enacted on April 18th 2017 (Federal Law Gazette. I p. 905); changed lastly on 19 June 2020 (Federal Law Gazette. I p. 1328). Available online: https://www.gesetze-im-internet.de/awsv/AwSV.pdf (accessed on 19 January 2021).
- Yuan, Z.; Ganigue, R.; Jiang, G.; Liu, Y.; Chen, J. Sewer Corrosion and Odour Research Linkage Project; The University of Queensland: Queensland, Australia, 2015. [Google Scholar]
- Millero, F.J.; Plese, T.; Fernandez, M. The dissociation of hydrogen sulfide in seawater1. Limnol. Oceanogr. 1988, 33, 269–274. [Google Scholar] [CrossRef]
Publisher’s Note: MDPI stays neutral with regard to jurisdictional claims in published maps and institutional affiliations. |
© 2021 by the authors. Licensee MDPI, Basel, Switzerland. This article is an open access article distributed under the terms and conditions of the Creative Commons Attribution (CC BY) license (https://creativecommons.org/licenses/by/4.0/).