Article

Hydroclimatic Variability and Land Cover Transformations in the Central Italian Alps

by
Matteo Balistrocchi
1,*,
Massimo Tomirotti
2,
Alessandro Muraca
2 and
Roberto Ranzi
2,*
1
Department of Engineering Enzo Ferrari, University of Modena and Reggio Emilia, Via Pietro Vivarelli 10, 41125 Modena, Italy
2
Department of Civil, Environmental, Architectural Engineering and Mathematics, University of Brescia, Via Branze 43, 25123 Brescia, Italy
*
Authors to whom correspondence should be addressed.
Water 2021, 13(7), 963; https://doi.org/10.3390/w13070963
Submission received: 28 February 2021 / Revised: 25 March 2021 / Accepted: 27 March 2021 / Published: 31 March 2021
(This article belongs to the Special Issue Climate Change Impact and Adaptation in Water Resources Management)

Abstract

:
Extreme streamflow nonstationarity has probably attracted more attention than mean streamflow nonstationarity in the assessment of the impacts of climate change on the water cycle. Nonetheless, a significant decrease in mean streamflow could lead to conditions of scarcity of freshwater in the long-term period, seriously compromising the sustainability of the demand for civil, agricultural, and industrial uses. Regional analyses are useful to better characterize an area’s nonstationarity, since a clear trend at a global scale has not been detected yet. In this article, long-term and high-quality series of streamflow discharges observed in five rivers in the Central Italian Alps, including two multicentury series and two new precipitation and streamflow series not analyzed before, are investigated to statistically characterize individual trends of mean annual runoff volumes. Nonparametric pooled statistics are also introduced to assess the regional trend. Additional climatic and nonclimatic factors, namely, precipitation trends and land cover transformations, have also been considered as potential change drivers. Unlike precipitation, runoff volumes show a marked and statistically significant decrease of −1.45 mm/year, which appears to be homogeneous in the region. The land cover transformation analysis presented here revealed extensive woodland expansions of 510 km2 in 2018 out of the 2650 km2 area measured in 1954, representing 38% of the area investigated in this study: this anthropic driver of enhanced hydrologic losses can be recognized as an additional likely cause for the regional runoff volume decrease.

1. Introduction

The assessment of the impact of climate change on streamflow discharges continues to be one of the most crucial issues in hydrologic research and water engineering applications [1]. Changing trends could have dramatic consequences on a number of issues, such as the sustainable exploitation of freshwater resources or the mitigation of flood risk. Although this problem has been the subject of study for several years, definitive and general outcomes have not been achieved yet. The existence of a global trend in streamflow discharges has recently been questioned by the scientific community. Analyses of the Fifth Assessment Report of the International Panel for Climate Change [2] no longer support the conclusions of earlier studies [3]. According to the most recent comprehensive analyses [4,5], there is little certainty of a correlation between an increasing trend in global river discharge and global warming in the 20th century. Multidecadal analyses of the variability and trends of streamflow discharge are available at regional and global levels. For instance, studies investigated streamflow discharge trends in near-natural rivers in more than 400 small watersheds located in 15 countries across Europe from 1962 to 2004 [6,7]. A coherent regional pattern of annual streamflow trends was revealed to have negative trends in southern and eastern regions and generally positive trends elsewhere. The results of the trend analysis for the period 1948–2004 of the monthly and annual outflows into the oceans of 916 rivers worldwide were recently published [8], showing that for 120 rivers, the trends are positive, while for 51 of them, they are negative with a statistical significance of 5%. Considering these results, an important study at the European level has made it possible to identify variations in the last 50 years that appear to be related to floods’ seasonal distribution rather than their intensity [9].
Hence, changes in streamflow discharges progressively arise as strongly site-dependent phenomena, which are driven by both climatic and nonclimatic factors. There are many reasons for such heterogeneous results. First, precipitation trends show a high regional variability in terms of type, magnitude, and significance, depending on the time reference scale (annual, seasonal, individual storm). The reference time scale is crucial in detecting trends in streamflow discharges as well since extreme and mean values may exhibit different trends even in the same watershed. Second, streamflow trends are strongly influenced by changes in the watershed’s hydrologic characteristic and in the local water management practices. Land cover transformations, freshwater uptakes, and flood control strategies can have quantitative impacts on streamflow discharges similar to those of climate change, depending on the reference time scale. Finally, the quality and the length of the analyzed time series are decisive factors of the reliability of the statistical analyses. The trend rates are often relatively weak to the point that series heterogeneities (due to updates in stage–discharge relationships and changes in the monitoring system or random fluctuations) could bias the estimates and lead to the misinterpretation of a trend.
As a consequence, the collection and analysis of high-quality and long-term time series of hydrological data is still needed not only for the improvement of the understanding of the earth’s climate variability but also for its practical implications. Time series quality is strictly related to the removal of anthropogenic regulations from the observed streamflow in order to assess natural ones. The community of climatologists and meteorologists has collected, shared, and processed meteorological data in large geographical areas for decades [10]. Similar efforts are being made by hydrologists in creating data sets for streamflow series, which are suitable for reliable analyses at the regional level and for the identification of actual anthropic or climatic drivers.
In this regard, the detection of trends in extreme hydrologic events has attracted most of the research interest [11,12]: this is due to the more abrupt impact that extreme events have on communities and economic assets. The literature regarding trends in mean values of hydrologic variables is instead less abundant. Statistically significant decreases in the mean values of streamflow discharges (i.e., runoff volumes) could however have severe consequences on the freshwater demand sustainability, in particular in those regions where their usage is intense and conflicting. The aim of this paper is therefore to add information regarding potential long-term trends in mean annual runoff volumes in the region of the Central Italian Alps in northern Italy and to identify their causes.
In researching this paper, extended and high-quality time series of streamflow for five main rivers were collected: the rivers Adige, Mincio, Chiese, Oglio, and Adda, originating from the southern side of the Central Alps, from east to west. In particular, the time series of the Adda river [13,14] and the Adige river [15] span a period that is longer than a century and thus provide a nonordinary set of data that are highly valuable. The nonstationarity in precipitations and hydrologic losses can be deemed to be potential drivers of changes in runoff volumes on an annual time scale. Trends in mean areal annual precipitations were taken into consideration for the Adda river [16] and for the Chiese river, for which a new time series was constructed to complete the database of previous studies. Trend analyses of individual series were conducted by using nonparametric estimators, which do have some advantages compared with conventional ones. In addition, a pooled estimator was used to assess the existence of a regional trend and to evaluate its statistical significance. On an annual basis, the hydrologic losses’ nonstationarity can be traced back to changes in the evapotranspiration process, which depends on both temperatures and land cover. Bearing in mind the consolidated and overall accepted evidence of a global increase trend in temperatures, the analysis was focused on land cover transformations that occurred in the last 65 years (1954 to 2018) in a large portion of the study area, and results support our conjecture about the influence of afforestation on the increase in hydrological losses.

2. Study Watersheds and Data Collection

The trend in regional runoff volumes in the southern side of the Central Alps was investigated in this article by using long-term time series observed at five gauging stations: Trento, in the Adige river watershed; Monzambano, immediately downstream of Lake Garda in the Sarca-Mincio watershed; Gavardo, a few kilometers downstream of Lake Idro in the Chiese river watershed; Sarnico, at the Lake Iseo outlet in the Oglio river watershed; and Lecco, at the Lake Como outlet in the Adda river watershed. These watersheds are represented in Figure 1, along with the main river network, on an 80-meter-resolution digital elevation model of the Central Alps. All watersheds mentioned are entirely in Italy, except for the Adda and Adige watersheds, which marginally reach into parts of Switzerland.
The Adda, Oglio, and Mincio rivers are the main left-bank tributaries of the Po river, while the Chiese river is a left-bank tributary of the Oglio river. The Adige river is the second longest in Italy and drains directly into the Adriatic Sea. The Adda and Adige rivers originate near the Italian national border, whereas the Oglio and Chiese rivers spring from the Adamello mountain range. The Mincio river is the effluent of Lake Garda, whereas the Sarca river, which springs from the Adamello-Presanella mountain range, is the main inflowing river.
The main morphological characteristics of the five studied watersheds are listed in Table 1. As can be seen, the total investigated area amounts to 19,395 km2, which represents most of the Central Italian Alps. The selected case studies also offer a broad set of morphological changes in size, exposure, and shape, thus providing an overview of the varying responses, which are given by different watersheds in reaction to drivers of change. Hence, the trend detection in the streamflow time series becomes crucially important to the agricultural exploitation of the Po River Valley, which is still a fundamental asset in the economy of northern Italy. Ever since the Middle Ages, agriculture here has benefitted from the high availability of freshwater originating from the mountain watersheds, and water-intensive irrigation practices have long been supported by an extensive distribution network. All the major lakes are currently regulated, so that freshwater is made available during the crop growing season.
The first artificially regulated lake was Lake Idro in 1932 (current regulation volume of 35.0 × 10⁶ m3), while the regulations of Lakes Iseo (regulation volume of 85 × 106 m3), Como (regulation volume of 246.5 × 10⁶ m3), and Garda (regulation volume of 458.1 × 10⁶ m3) started in 1933, 1946, and 1950, respectively. In addition, the investigated watersheds are heavily exploited for the generation of hydropower, which amounts to about 40% of the total generated in Italy. The hydropower generation reservoirs were mainly built between the early 1920s and the late 1960s of the last century, and upstream of the analyzed outlets, their storage capacities are estimated to be 522.2 × 10⁶ m3 in the Adige watershed, 222.6 × 10⁶ m3 in the Mincio watershed, 73.5 × 10⁶ m3 in the Chiese watershed, 113.6 × 10⁶ m3 in the Oglio watershed, and 515 × 106 m3 in the Adda watershed. The total streamflow discharge regulation capacity over the whole analyzed area is therefore assessed in the order of 2.3 × 10⁹ m3.
It is important to underline that annual runoff volumes are not affected by lake regulations, which mainly aim to satisfy the agricultural demand for water. The regulations are based on annual cycles, according to which runoff volumes are partially stored in spring (wet season) to be released in summer (dry season) for irrigation purposes, so that lake levels are restored to the minimum level after the end of the irrigation season. Furthermore, the generation of hydropower does not involve any sizeable transfer of water volume from year to year. For instance, Lake Idro’s management rule [17] enforces that the regulation volume must be filled at the beginning of the irrigation season on 30 June, and that it must be completely emptied at the end on 10 September. The regulation rules of Lake Como and Lake Garda are very similar.
To achieve this aim, upstream hydropower reservoirs contribute by releasing relevant volumes stored out of the irrigation season. In [14], long-term changes in monthly runoff regimes in the Adda river are shown, indicating a decrease in seasonality due to the reservoirs used for hydropower generation plants, requiring the storage of relevant water volumes during summer and autumn and the release in the cold months of January–April and November–December. However, on an annual basis, the natural runoff is not affected by reservoir management because of the water volume continuity. The consistency of the collected data is summarized in Table 1, where the observation period indicates the first and last available years. The actual sample size is also reported since not all the annual data are available within such periods. As can be seen, this data collection provides a large data set, including some of the longest hydrologic time series retrievable in the Po River Valley.

2.1. Streamflow Data

The time series of the annual runoff volumes for the five stations considered in the study were obtained from the series of the mean daily streamflow discharge. For the Adda and Oglio rivers, the data referring to the regulation periods were generally provided by the respective authorities in charge of lake management, and for the Mincio river, they were provided by the Interregional Agency for the Po river (AIPo). Moreover, for the Adda river, long series of daily water levels were recorded at different hydrometric stations: Malpensata–Malgrate and Fortilizio (at Lake Como’s outlet in Lecco). These data were combined with water stage–discharge relationships that are attested in scholarship [18,19,20] in order to carefully cross-check the data and construct a streamflow time series for the preregulation period from 1845 onwards [13,14]. After 1964, streamflow uptakes from the Spöl watershed, an Alpine tributary of the Inn river, were conducted to increase the Adda streamflow. Such contributions determine a trivial impact on the annual runoff volume, but can be significant to trend detection, so that they were estimated and subtracted from the observed runoff, to obtain the natural one. The Adda streamflow discharge series spans over the 172-year period from 1845 to 2016 and is the second-longest streamflow series to have been collected in Italy.
In the case of the Chiese river, the time series of annual runoff volumes analyzed in this paper was constructed by using different sources of information. The data up to 1989 were published in the Italian Hydrographic Service’s yearly records (with a 5-year gap from 1943 to 1947). After 1989, the data were provided (with a 3-year gap between 1990 and 1992) by the Regional Agency for Environmental Protection (ARPA) of the Lombardy Region, which succeeded the Italian hydrological service in monitoring regional hydrological processes. It must be noted that for the period between 1970 and 1989, we used a different data set (provided by ARPA), which corrected significant inconsistencies in the data published by the Italian Hydrographic Service (particularly after 1985). The greater reliability of the former data set was confirmed over the course of this study by controlling the original records of the gauging station. The years 1993–1998, 2000, and 2002 were not considered in the analysis due to significant lacunae in the data.
Finally, for the Adige river, official data collected at the Trento gauging station by the Italian Hydrographic Service starting in 1923 were combined with the daily observations compiled in the years 1862 to 1923 by the Municipality of Trento and the Austrian Hydrographic Service. Annual runoff volumes were then computed [15], and a more detailed description of these data is currently under preparation. As a whole, these time series of annual data can be considered made of natural runoff volumes, not significantly affected by anthropogenic regulations.

2.2. Precipitation Data

Attention was focused on the Chiese river watershed since annual precipitation depths in this watershed had not yet been investigated. Annual and monthly hydrologic water balances were routinely conducted at the Gavardo river gauge station by the Italian Hydrographic Service, until it ceased to operate in the late 1980s. A series of mean areal annual precipitation depths is therefore available from 1934 to 1989, excluding the interval from 1943 to 1947. After 1989, a rain gauge network, featuring 29 stations quite uniformly distributed over the watershed, was used to estimate the mean areal annual precipitation depths. The annual depths were obtained as an area weighted sum of monthly point depths by using the maximum number of available stations for each month: on average 10 stations were simultaneously available, with the lowest figure of available stations at any given time being 5 and the highest 14. This made it possible to extend the time series until 2018.
In the Adda river watershed, the mean areal annual precipitation depths were assessed in [13,16] starting from monthly point precipitations recorded by a rain gauge network, including a maximum of more than 250 stations located inside and in the outer region surrounding the watershed divide. The number of available stations progressively increased from the first decades of the 19th century, when about fewer than 10 stations could be used, up to 53 stations in 1860 and 250 in 1900. Point precipitations were spatially interpolated over the study domain onto a 30-arc sec resolution digital elevation model by means of the anomaly approach coupled with a local weighted linear precipitation–elevation regression (for details, see [16] and references therein). Gridded precipitation fields were then integrated and averaged over the watershed area to obtain the mean areal monthly precipitation depths, which were then summed to obtain the annual depths.

2.3. Land Cover Data

The investigation was based on the so-called GAI survey, the most ancient survey of surface coverage, which comprehensively depicts how things were in Italy after the Second World War. The survey was carried out in 1954 and produced high-resolution orthophotos, which were recently georeferenced and interpreted by the Lombardy Region. This process has allowed scholars to classify the different land covers that existed inside the regional administrative boundary (Geoportale Regione Lombardia, available online: http://www.geoportale.regione.lombardia.it, accessed on: 1 February 2021). The land cover classes were defined using the key classes from the CORINE project (CORINE Land Cover, available online: https://land.copernicus.eu/pan-european/corine-land-cover, accessed on: 1 February 2021), making it possible to easily compare past land covers with the present ones. The only exception is the land that has been classified as “pasture” in the original key: this could not be detected in the photos and was consequently classified as “grassland.” The most recent review of the land cover in the Lombardy Region (DUSAF 6.0) highlights the classifications as they were in 2018. In order to make the trends evident, the same land cover analysis was conducted also for the conditions depicted in 1980 and in 1999. Thus, the land cover change was evaluated about every 20 years. The spatial data in that study were cross-referenced in a sample check with current satellite imagery, thus revealing that there was a satisfactory level of reliability.

3. Trend Analysis Methodology

Each k-th time series is assumed to be a stochastic process x k = x k ( t ) indexed with respect to time t, whose trends can be expressed by a linear regression model such as that reported in Equation (1), where mk and qk are the k-th series slope and intercept.
x k = m k   t +   q k
In this paper, the nonparametric Theil–Sen estimators for the linear regression [21,22,23,24,25] were used to detect trends in the observed annual series. Hence, the linear regression of each individual series is computed as the median of slopes skij between observation pairs xki and xkj defined according to Equation (2), where xki is the value observed in the ti year for the k-th series and nk is the k-th series size (for the estimate of medians in discrete samples, see [25]).
m k = m e d i a n ( s k i j = x k j x k i t j t i ; 1 i < j n k )
Once the individual series slope mk is estimated, the corresponding intercept qk is supplied by Equation (3) [26].
q k = m e d i a n ( x k i m k   t i ; 1 i n k )
The Theil–Sen estimators bear some advantages compared with the conventional parametric least squares estimators [27]: (i) they are more robust when outliers are present; (ii) they are comparable to least squares estimators in terms of standard error according to the hypotheses of normality and homoscedasticity of the dependent variable, but they are superior according to the hypothesis of normality (when used on its own), (iii) and confidence boundaries for regression line slopes can straightforwardly be derived. In particular, these estimates appear to be effective in quantifying the trend slope uncertainty by providing upper and lower limits mku and mkl of a confidence interval with fixed width (details on this procedure are reported in Appendix A).
In order to evaluate the trend significance associated with each individual series, the Theil test for the slope of the regression line [21], the Mann–Kendall test [28,29], and the Spearman test [30] were conducted. All these tests are distribution-free, and as such, no assumption regarding the probability distribution of random variables has been made. Different from the other tests, the Theil test makes it possible to estimate the statistic reliability of any fixed trend slope, according to the procedure briefly illustrated in Appendix B. In addition, the Sen–Adichie test for trend slope parallelism was conducted to verify the hypothesis of the existence of a common regional trend slope [25,31,32,33]. As shown in Equation (4), the null hypothesis H0 to be tested is the equality of all regression slopes mk of N ≥ 2 series to an unspecified value mp. This hypothesis does not involve any assumption on the intercepts of the regression lines given in Equation (3).
H 0 :   m k = m p ,   w i t h   k = 1 ,     , N
As suggested by Sen–Adichie, under the null hypothesis given in Equation (4), a common pooled slope mp can be obtained by using Equation (5), in which data from the different k-th series with sample size nk are aligned and pooled together in a unique sample.
m p = k = 1 N i = 1 n k ( t k i t k ^ )   x k i k = 1 N i = 1 n k ( t k i t k ^ ) 2 ,   w h e r e   t k ^ = i = 1 n k t k i n k
The pooled slope mp can be interpreted as a regional trend for the hydrological process of interest, if the parallelism hypothesis of the linear trends of the individual series cannot be rejected for a sufficiently large p-value α. Its reliability is much greater than that of the individual series slopes, since the pooled slope is estimated using a significantly larger sample size, thus providing a more robust trend estimator. Moreover, the test of parallelism makes it possible to delimitate homogeneous regions, including watersheds featuring statistically similar linear trends, which can be assembled to form a virtual watershed. Further details on this test are provided in Appendix C.

4. Results and Discussion

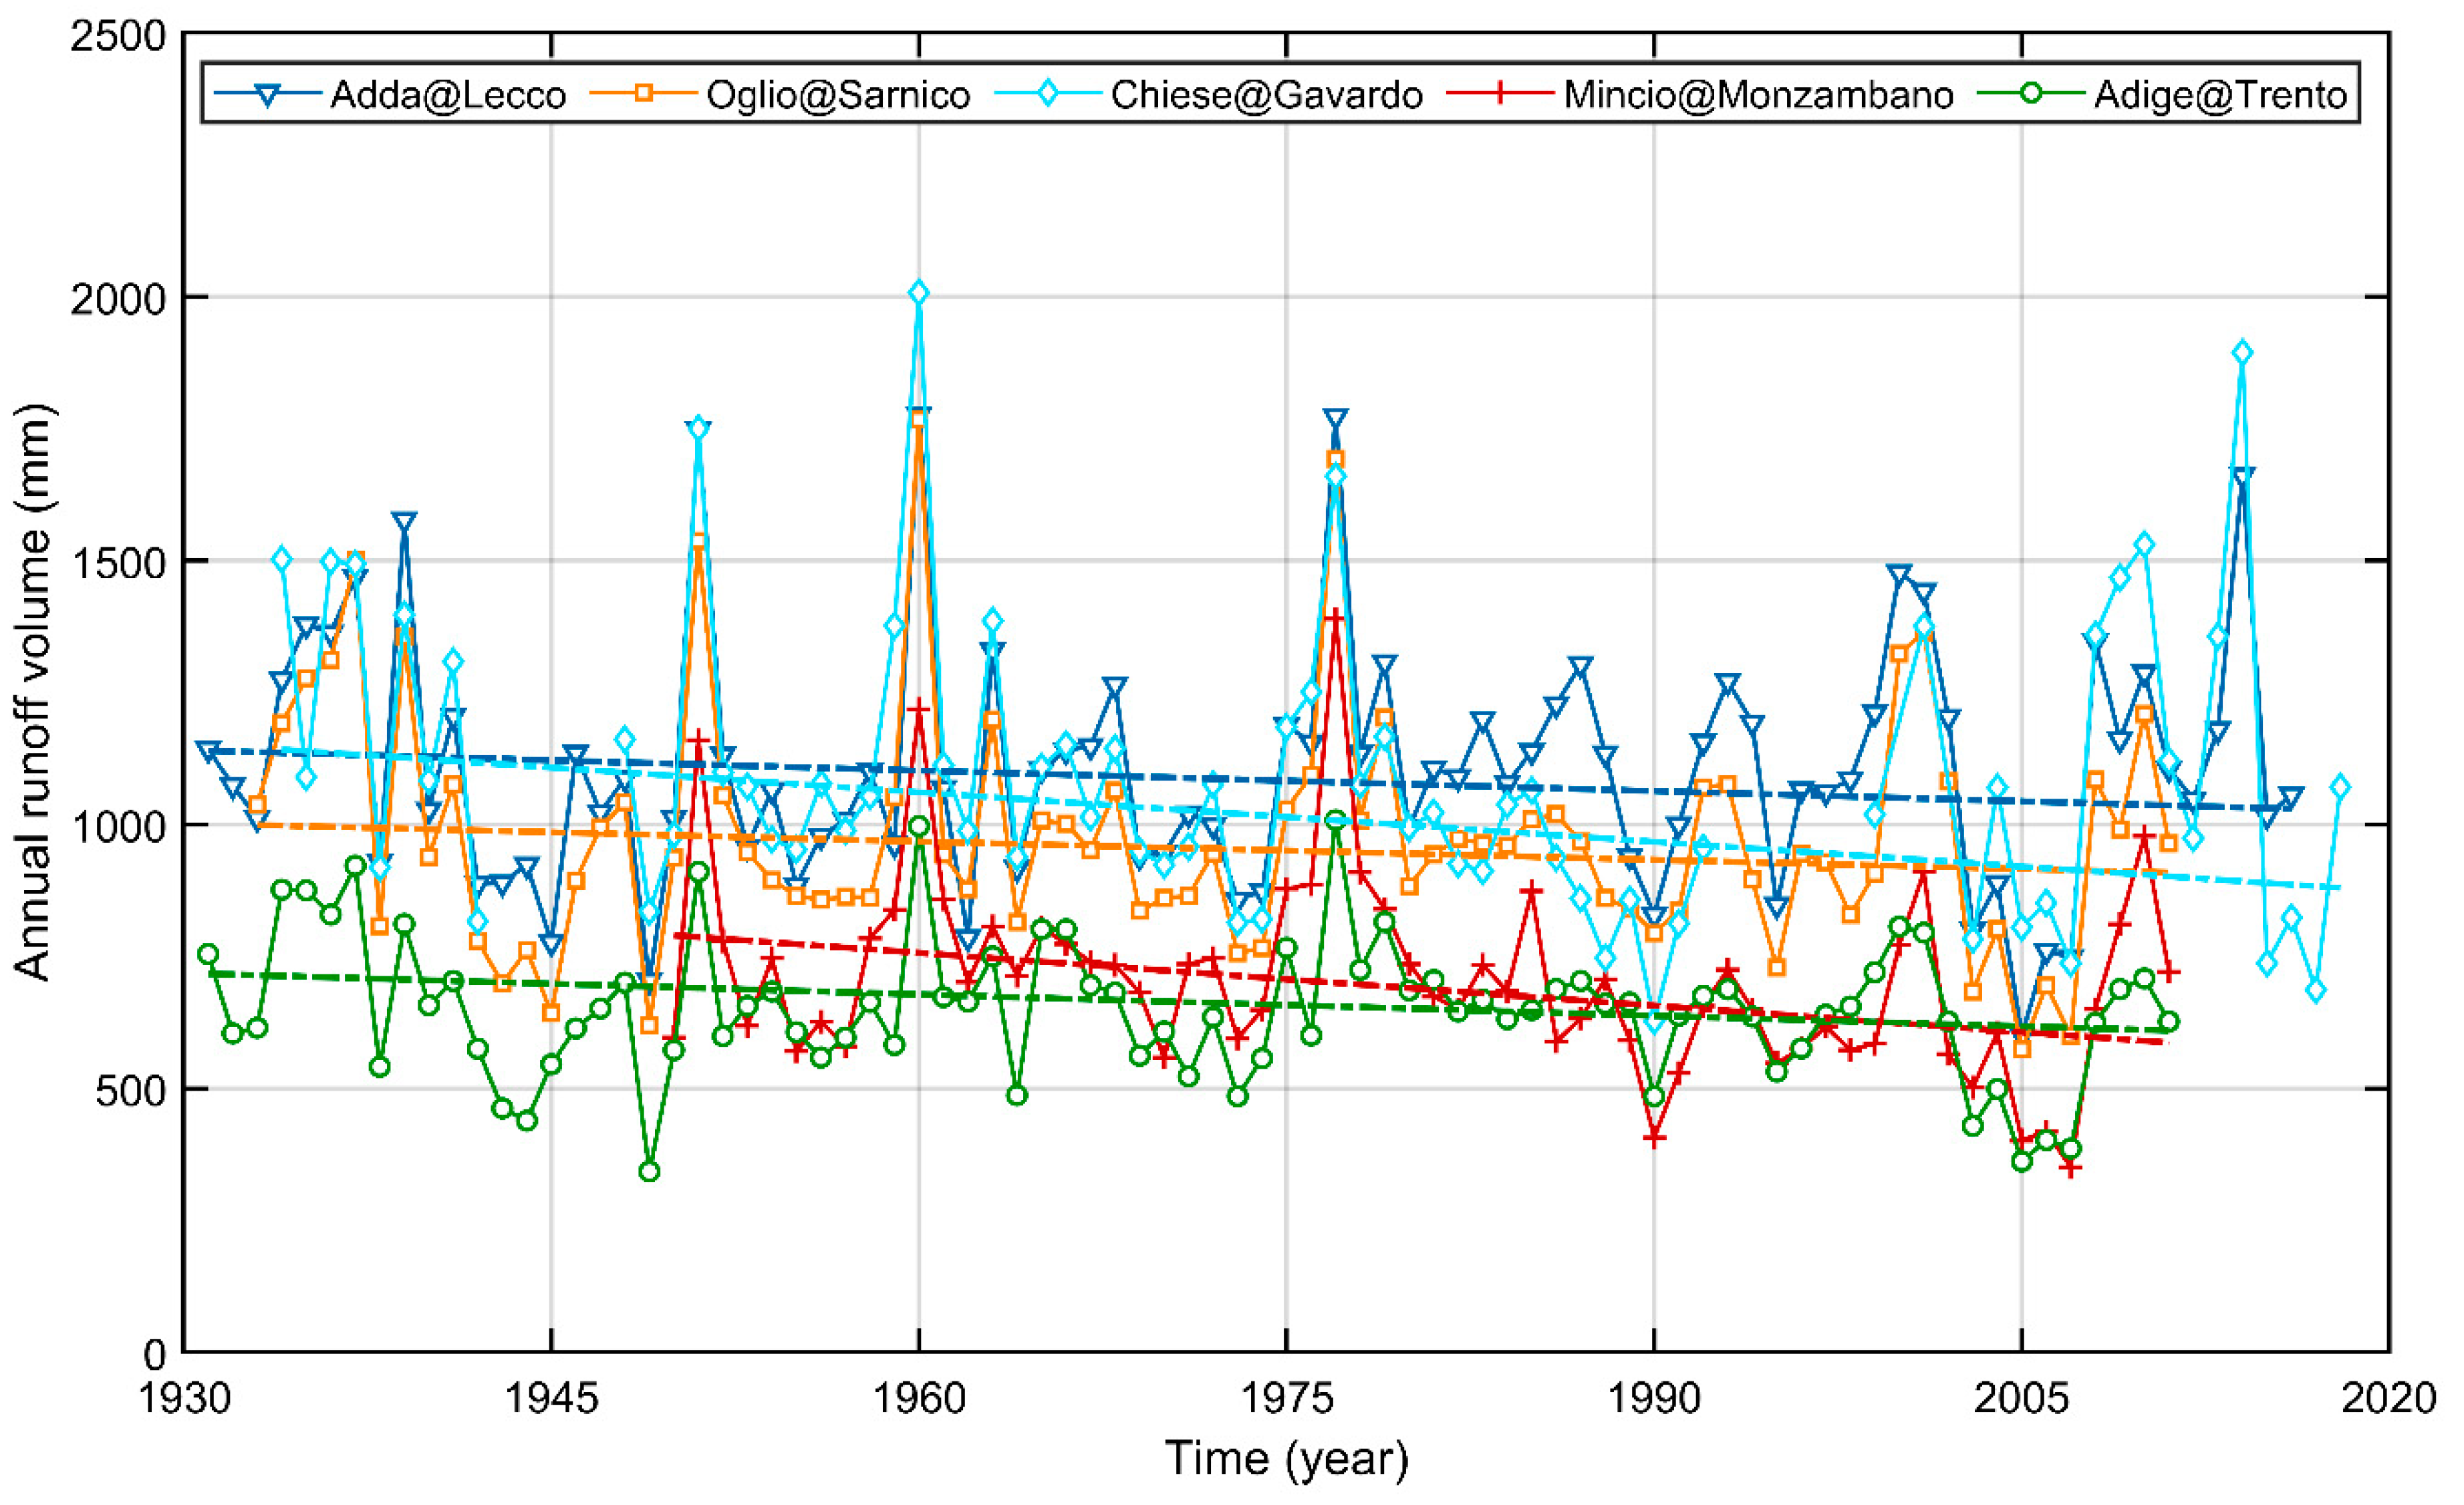
4.1. Runoff Volume Series Analysis

Table 2 reports the trend slopes mk of each individual series along with the corresponding lower and upper confidence boundaries mkl and mku, derived for a confidence interval of 90%. As can be seen, all series show a decreasing trend, with rates varying from −1.16 to −3.33 mm/year. The uncertainty related to these estimates amounts to about ±0.60 mm/year for the longest series (the Adda and Adige rivers) and to ±1.75 mm/year for the shortest ones (the Oglio, Chiese, and Mincio rivers). As regards the shortest series, such uncertainties are significantly high. More precisely, the estimate of the Oglio series trend rate, at −1.16 mm/year, is such that the uncertainty interval includes even positive values.
The Theil test for null slope (i.e., mk equal to 0), the Mann–Kendall test, and the Spearman test all consistently evidence statistically significant trends for all series, except for the Oglio river basin. In Table 2, the p-values (α0k, αtk, and αrk refer to the Theil, Mann–Kendall, and Spearman tests, respectively), for which the null hypothesis of trend absence cannot be rejected, are generally much less than 1.0%. Conversely, for the Oglio river series, a significance value slightly greater than 32% is estimated. It is worth noting that the Oglio river series trend is close to the one from the Adda river. Therefore, this result could be explained by considering that this trend size would need a far longer series to be recognized as significant.
The homogeneous nature of the observed individual trends is supported by the Sen–Adichie test. As can be seen in Table 2, the p-value αp, according to which the null hypothesis of parallelism cannot be rejected, is 54.8%. This evidences a high confidence both in this hypothesis and in the possibility of exploiting the pooled slope as an estimate of a regional trend rate. This value amounts to −1.45 mm/year due the major sample size of the Adda river and the Adige river series in the pooled sample with respect to the others. Finally, the Theil tests were repeated assuming the pooled slope mp as individual trend slope. Such tests always yield p-values αpk larger than 10% for the hypothesis not to be rejected. In particular, the significance of the Oglio river series is slightly larger than 70% due to the similarity of the individual series’ slope with the pooled slope. Therefore, on a regional level, there is evidence of a statistically significant decreasing trend in the annual runoff volumes from the watersheds of the Central Italian Alps.
A visual representation of the limited slope variability of regression lines is supplied in Figure 2. The time series of the annual runoff volumes are plotted in the period 1934–2018, when there is a high overlap of data availability, along with the corresponding individual trends, computed with respect to the complete series. Intercepts of regression lines plotted in Figure 2 are estimated according to Equation (3).
The decreasing trends estimated for the annual runoff volumes could be related both to nonstationarity in the annual precipitation depth and to a simultaneous increase in annual hydrologic losses. A combination of increasing air temperatures and extensive variations in land cover is probably responsible for this negative trend. Indeed, other potential factors, such as changes in irrigation practices and in glacier coverage in this area, were taken into account and excluded. The first factor is excluded by considering the scarcity of irrigated crops in the mountains (the only exception being fruit tree cultivations in the Adige and Adda watersheds whose coverages are, however, trivial as compared with the total watershed area; see land cover discussion reported below). The seasonal regulation of lakes is mainly due to the need to satisfy the demand for irrigation water. Nevertheless, irrigation has an impact on freshwater exploitation only in the downstream lowlands, and the analyzed time series are not affected by relevant irrigation uptakes. Moreover, the second factor can be excluded by bearing in mind the well-established evidence of a globally significant trend in glacier retreats in the Alps [2], which, on the contrary, should partially compensate the negative trend in runoff volumes by supplying additional contributions as a result of the ice melting.

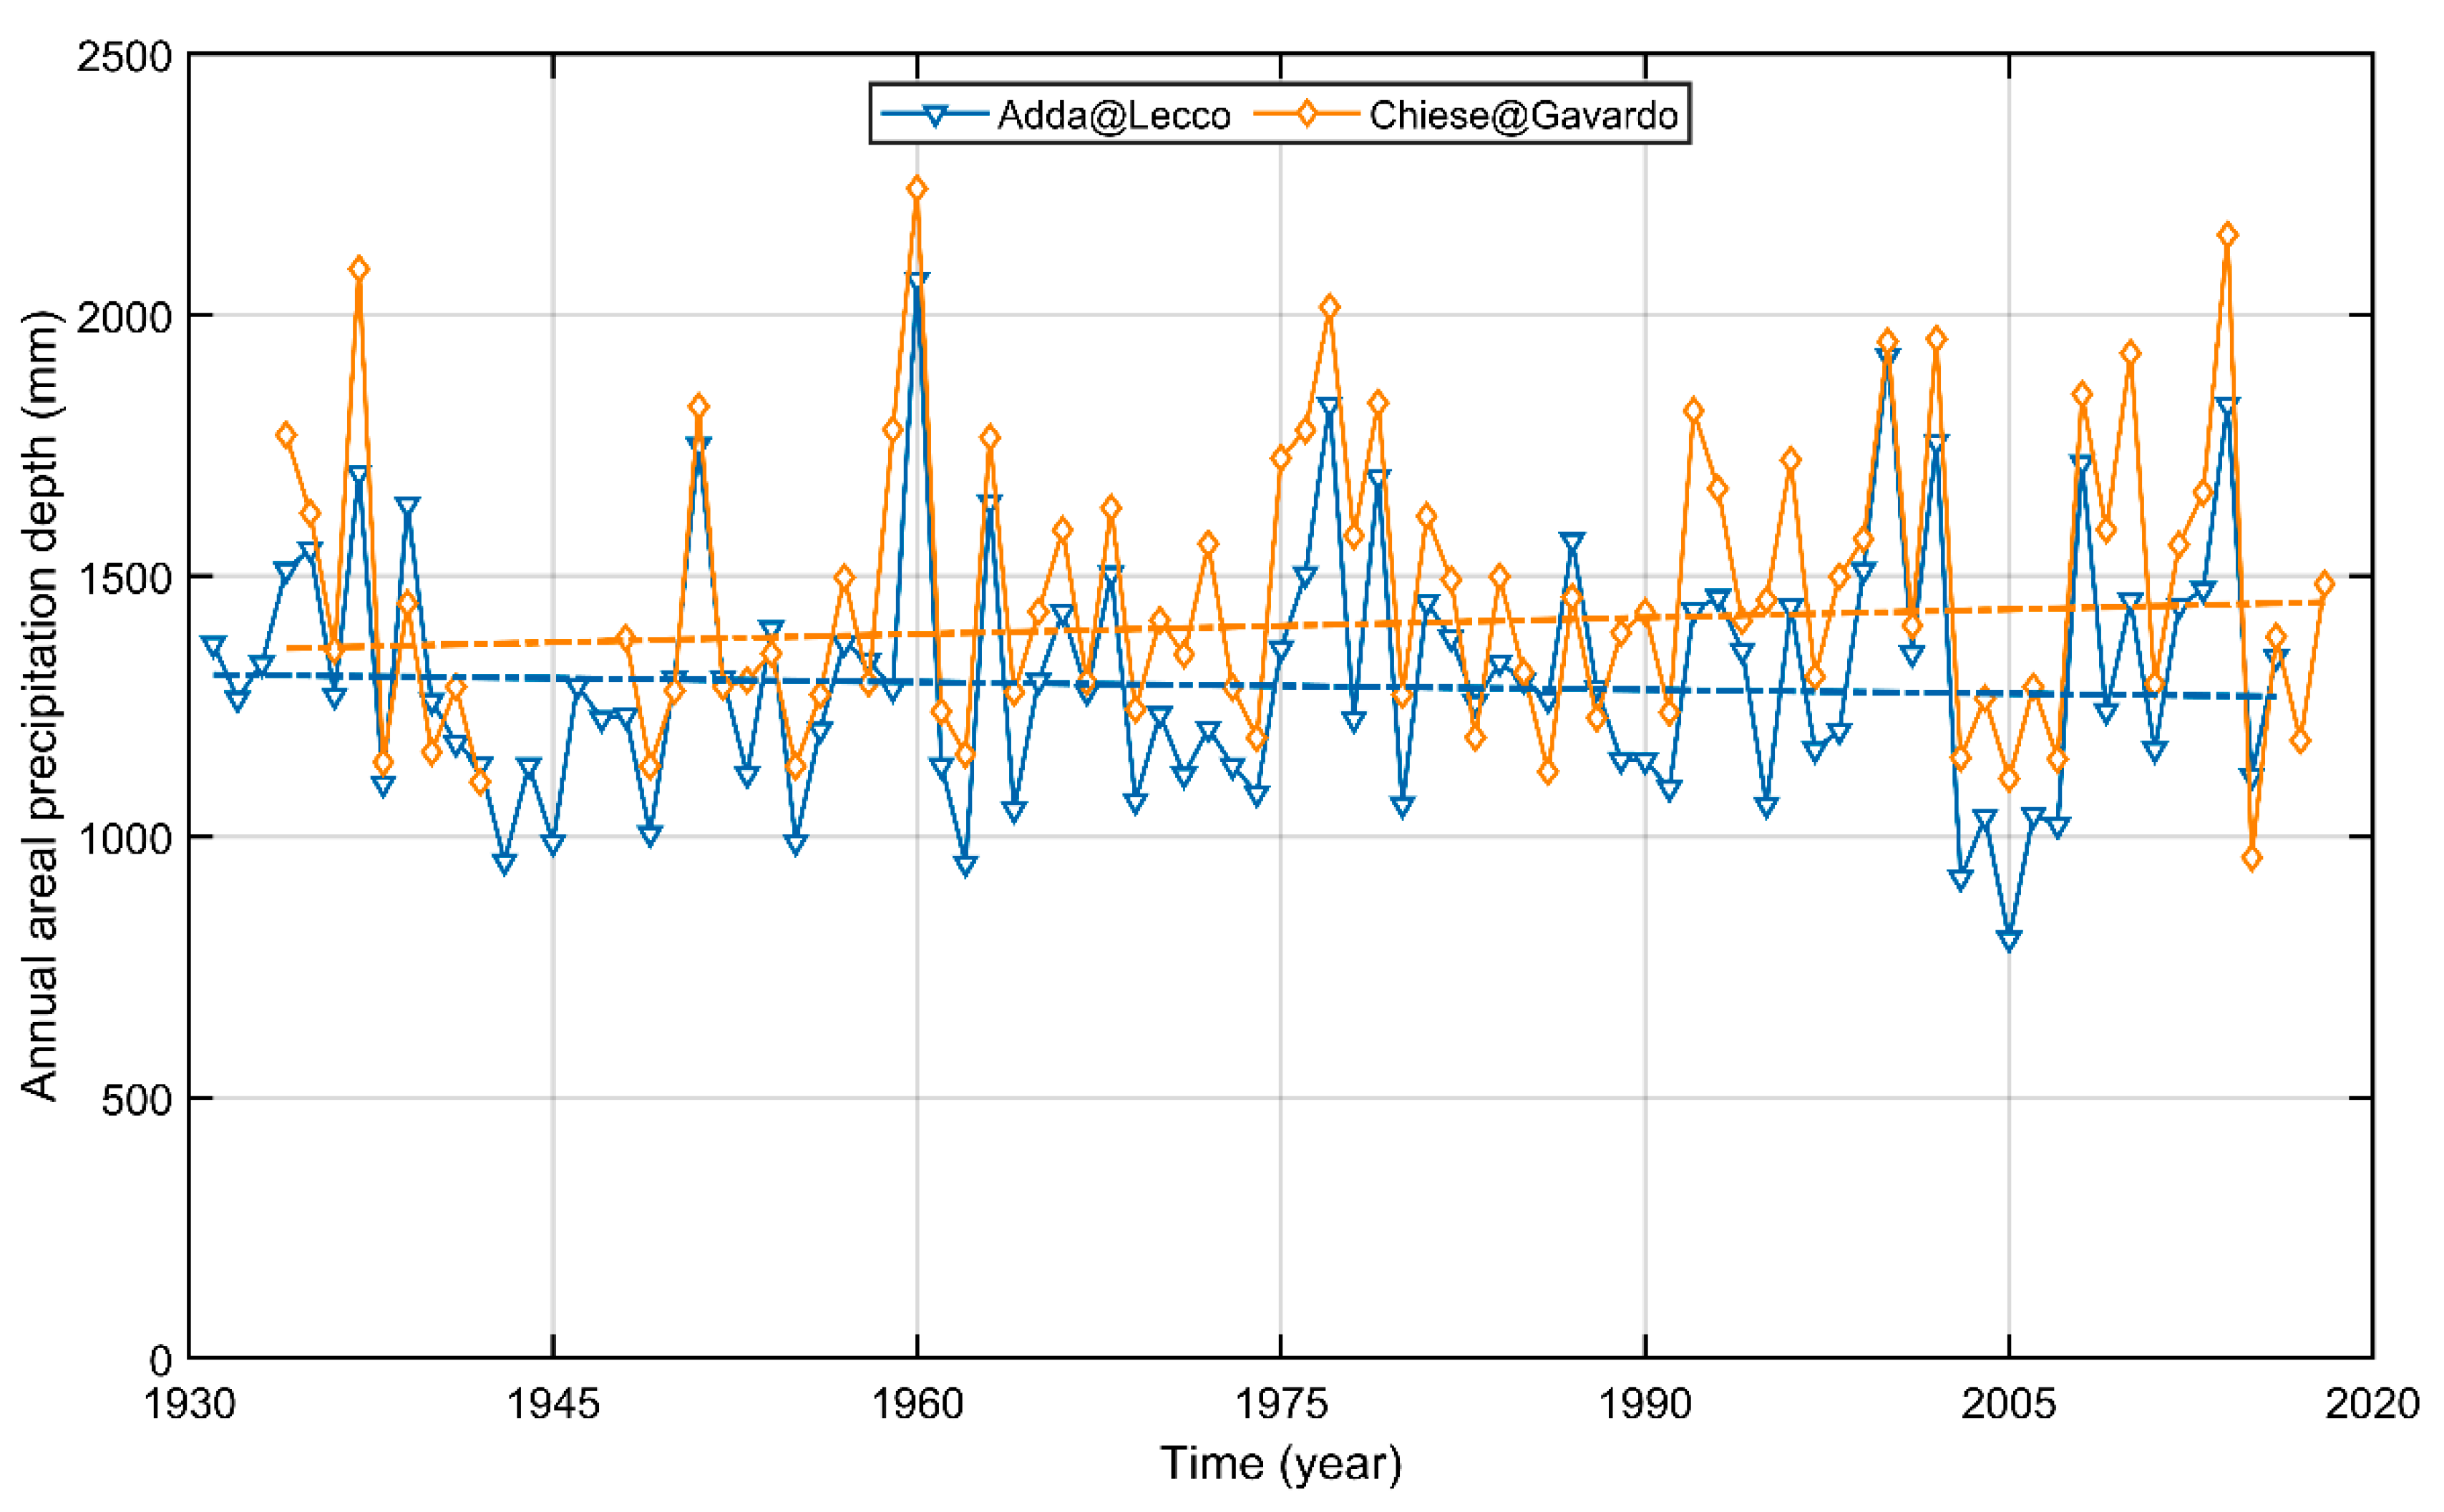
4.2. Precipitation Series Analysis

An analysis analogous to the runoff volume one was conducted for the mean areal precipitation depths of the Chiese and the Adda watersheds, and its results are reported in Table 3. Plots of the precipitation series and corresponding trends are instead illustrated in Figure 3 for the period 1930–2018 when both series are available.
It is worth noting that the precipitation trend rate in the Chiese watershed amounts to +1.05 mm/year and is strongly in contrast to the decreasing trend rate of −3.12 mm/year, estimated for the runoff volume series (Table 2). Moreover, when the Theil test for individual regression slopes is conducted by assuming the trend absence, the p-value α0k according to which the null hypothesis cannot be rejected is 40.8%. The Mann–Kendall test and the Spearman test yield analogous results since their coefficients are close to zero and the corresponding p-values αtk and αrk are greater than 40%. When the mean areal precipitations of the Adda watershed are considered, a decreasing trend is found. However, the trend rate is far less than the runoff volume one (Table 2), and its statistical significance is negligible, as confirmed by the p-values α0k, αtk, and αrk for the trend absence hypothesis not to be rejected, all larger than 20%.
When the two individual series are pooled together, the common trend rate is estimated to be negative and the parallelism hypothesis cannot be rejected with p-values greater than 22%. Accordingly, the pool trend rate mp cannot be rejected as an individual slope for large p-values, even for the Chiese series. All the tests that were performed, therefore, agree that the regional trend is nonstatistically significant since the hypothesis of trend absence cannot be rejected for large significance values. This outcome is consistent with that obtained for the Adige river watershed. A 150-year-long series of mean areal precipitation estimated from the Historical instrumental climatological surface time series of the greater Alpine region (HISTALP) database was investigated for the Adige watershed [15], and a negative precipitation trend was assessed by the Theil–Sen estimator to be −0.31 mm/year. Despite the length of the series, the null hypothesis of trend absence cannot be rejected for significances larger than 29%, according to all three tests that were used above. On the whole, it can be concluded that the marked regional negative trend in the annual runoff volumes visible in the major rivers of the Central Italian Alps cannot be justified by means of a statistically significant decrease in the annual precipitation depths, and therefore, trends in hydrologic losses must be taken into consideration, in particular the evapotranspiration processes.
Two factors affect such processes: temperatures and land cover. Regarding the first factor, there has been significant progress in the field of temperature studies, with evidence of statistically significant increasing trends having been collected. For instance, it has been demonstrated that the whole Alpine subregion is characterized by uniform trends in temperature [34]. Over the period from 1886 to 2005, the rate increase in mean annual temperatures was 1.4 ± 0.1 °C/century [10], with very high confidence in accordance with the Mann–Kendall test, which confirms the increased speed of the global warming trend. In the second half of the 20th century, trend rates are acknowledged to be higher than those observed in the same regions in the previous half.
Nevertheless, increasing trends in temperatures alone cannot explain those in total hydrologic losses. For instance, the increase rate in observed hydrological losses (i.e., the difference between the mean areal precipitation and the runoff volumes) in the Adda watershed is higher than the increase rate estimated for the potential evapotranspiration by accounting for only the temperature nonstationarity [14]. By using the Thornthwaite method on a gridded surface assuming stationary land cover, the trend rate of mean areal potential evapotranspiration (including evaporation from water surfaces) is assessed to be 36 mm/century. In contrast, the trend rate in the mean areal total hydrologic losses is assessed to be 92 mm/century.

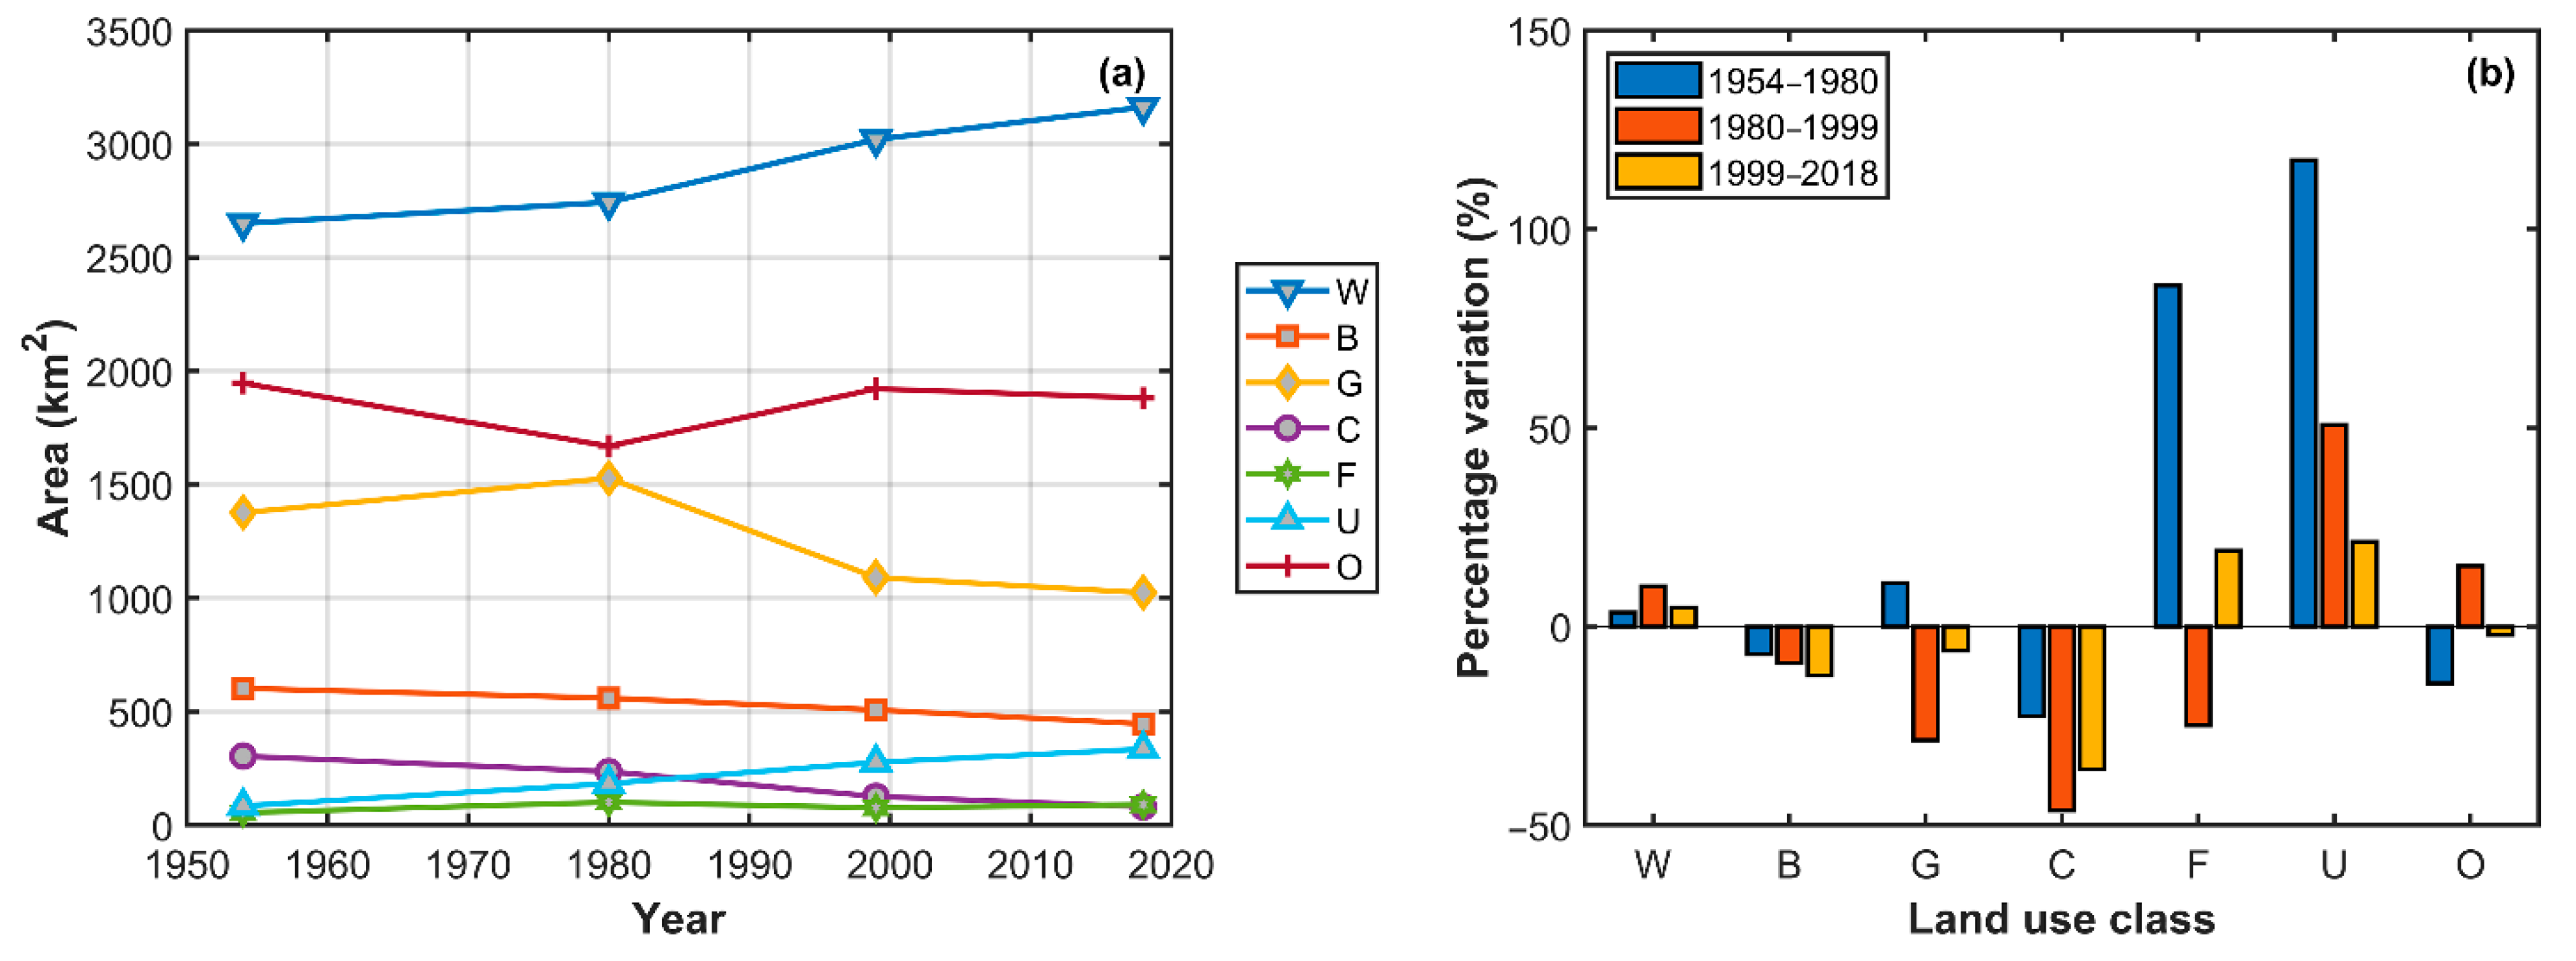
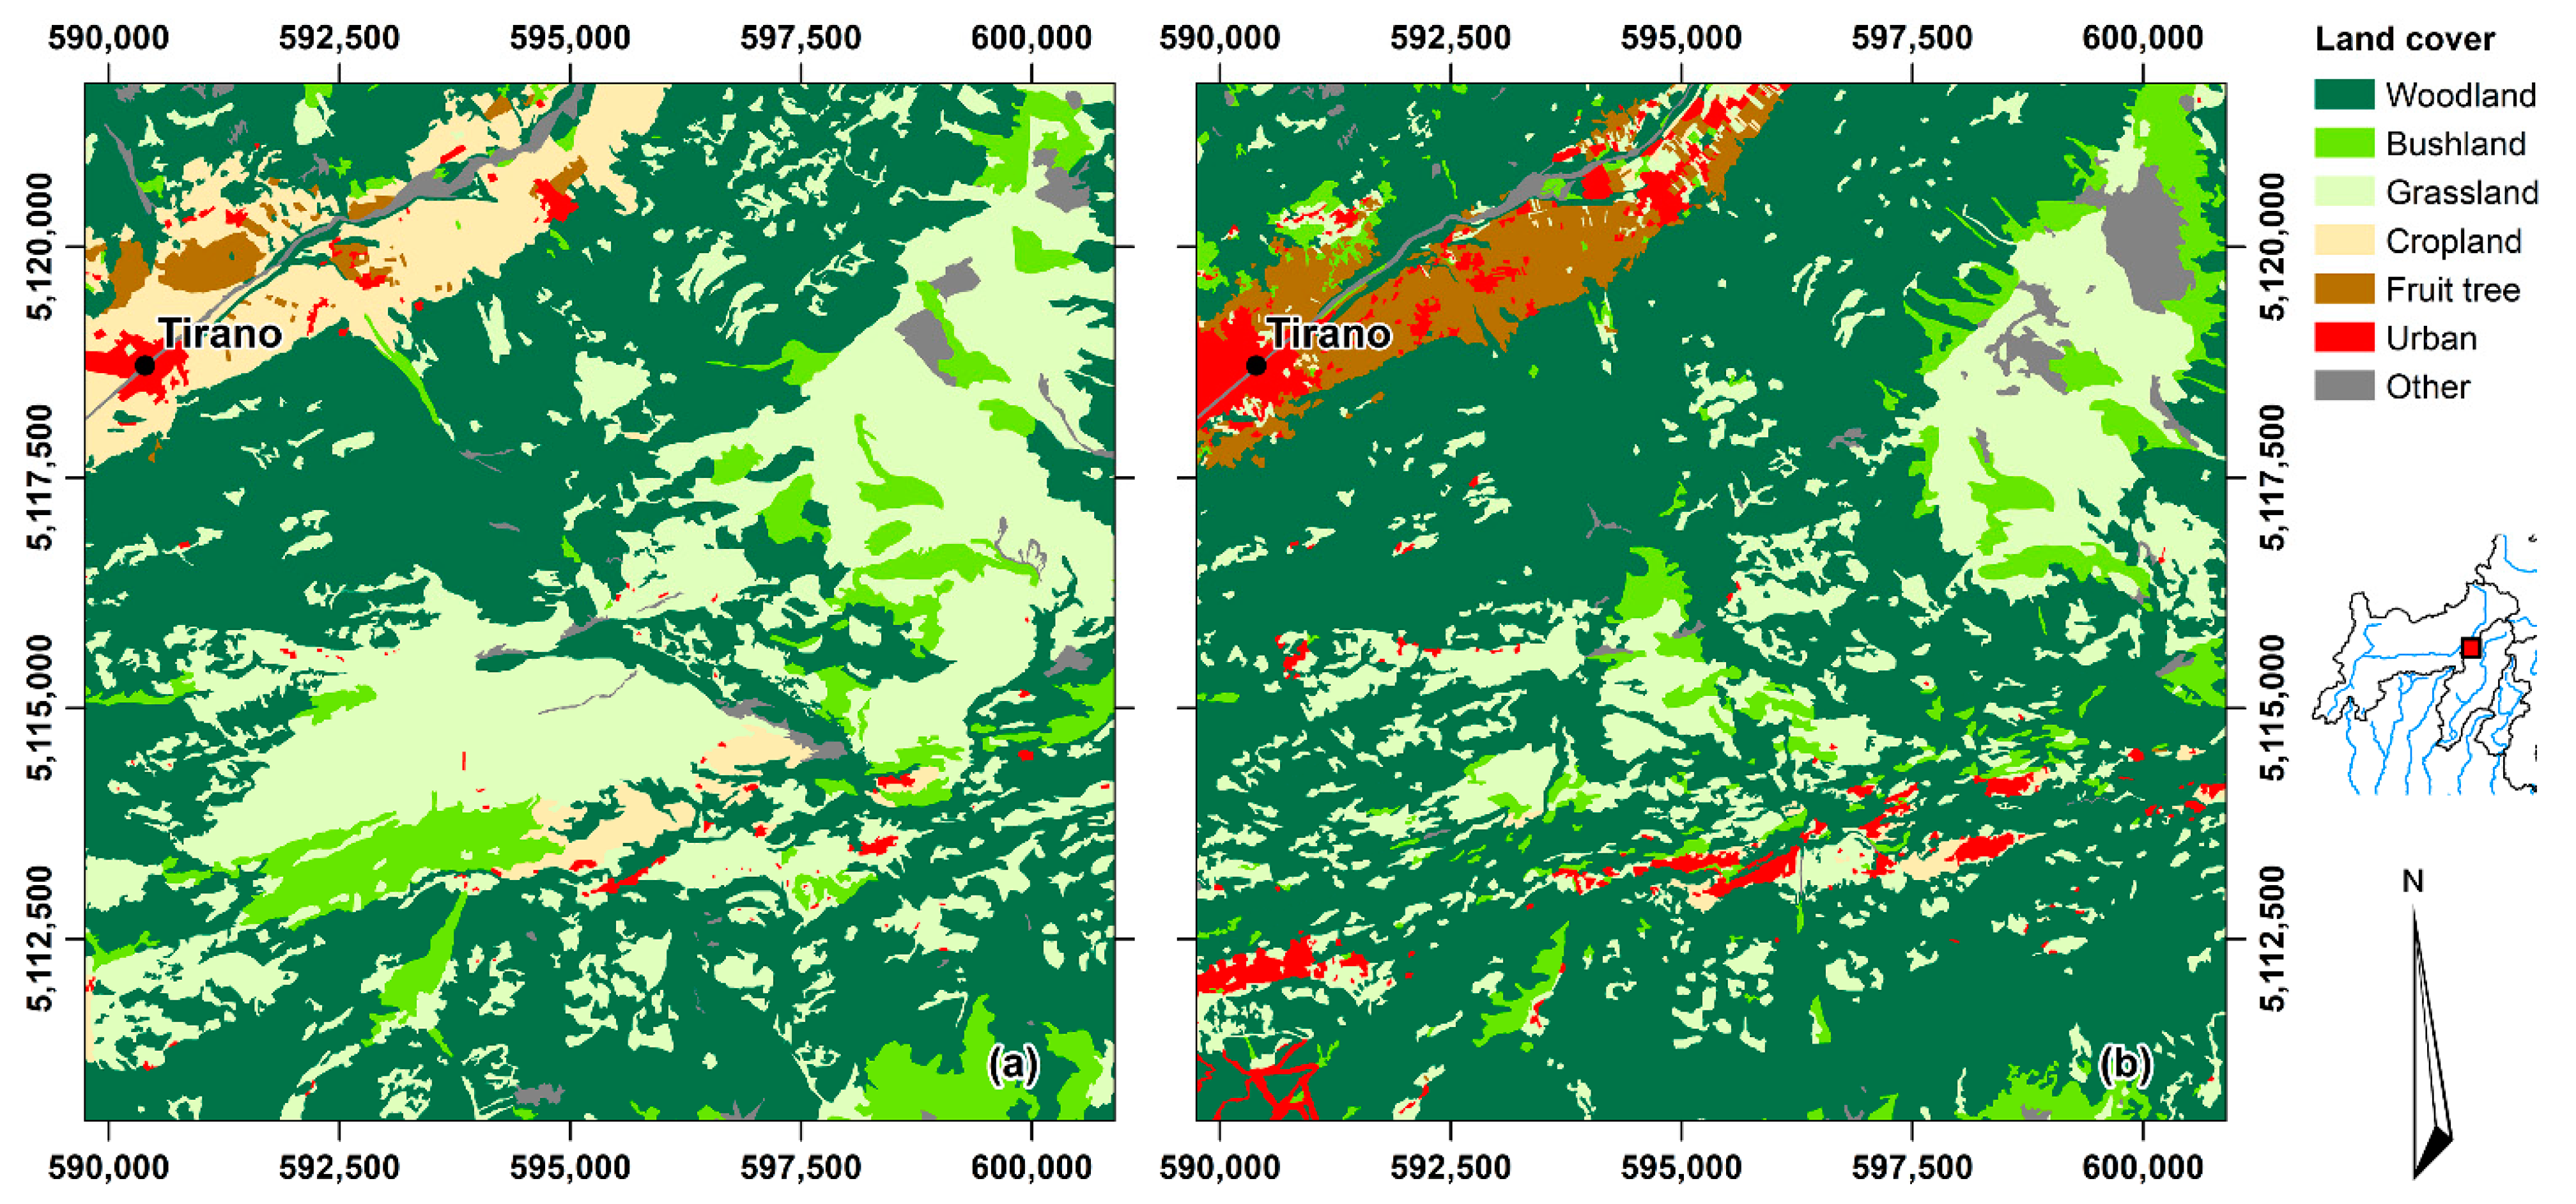
4.3. Land Cover Transformation Analysis

In consideration of the remarkable difference between trend rates of annual losses and evapotranspiration, additional causes must be advocated to explain the more rapid decline in observed runoff volumes. Consequently, land cover transformations must be taken into consideration as an additional reason for the observed regional decrease in the streamflow discharges by using spatial data from the Lombardy Region database. Large portions of the watersheds in this study lie within the Lombardy Region boundary (see Figure 1); the only exception to this is the Adige river. The analysis is particularly significant for the Oglio river watershed, which is completely covered by the available spatial land cover data; for the Adda river watershed (89% area analyzed); and for the Chiese river and Mincio river watersheds (57% and 28% of the area analyzed, respectively). Overall, the area investigated for land use changes covers 7020 km2. Seven macroclasses, featuring highly different responses in terms of hydrologic balance, were considered: woodland (including broad-leaved trees, conifers, and mixed woods), bushland (including scrub and/or herbaceous vegetation, except for natural grasslands), cropland (including arable lands but excluding permanent crops and pastures), fruit trees (including permanent crops, such as apple orchards, vineyards, and olive groves), grassland (including natural grasslands and pastures), urban (including all artificial surfaces), and others (including water bodies, wetlands, glaciers, and uncultivated lands).
The regional land cover layers were then clipped by the total watershed divide of the analyzed area and reclassified according to the above-mentioned land cover list. The results are summarized in Figure 4a, where they are expressed in terms of the area covered by each of these macroclasses, spanning from 1954 and 2018. In Figure 4b, the percentage variations of area covered by each class, occurring in the three time periods separating the survey years, are reported. Such percentage variations were calculated using the difference between the present and the past coverage areas and dividing it by the past coverage area. Although the results are aggregated with respect to the total study area, they are actually representative of what occurred in all the analyzed watersheds since similar results were found for each of them.
The most impressive increase is associated with the urban land cover, which totally grew by almost 300% from 1954 to 2018 (increase of 250 km2), even if it remains a minor portion of the total watershed area (less than 5%). This evidence can be explained in the examined mountain context by the widespread urban development as a result of touristic demand for holiday houses and hotels. In particular, inside the study area, the western shore of Lake Garda experienced a dramatic urban sprawl, being strongly attractive for aquatic leisure activities. The urban expansion mainly occurred at the expense of croplands, which were subjected to strong decreases, totally assessed at 73%. Such an abrupt decrease can also be explained by the conversion into fruit tree cultivations, in particular apple orchards, vineyards, and olive groves. Areas devoted to fruit production totally increased by 66%. A demonstration of this is visible in Figure 5, which represents the land cover transformation that occurred between 1954 and 2018 in a square sample area of 125 km2 across the watershed divide separating the Adda and Oglio rivers. The major urban expansion is that of the Tirano urban settlement, located in the valley, which has progressively spread into the surrounding cropland areas. Furthermore, the substitution of arable land with permanent crops (in this case, apple tree orchards) contributed to the phenomenon of cropland disappearance. Due to the socioeconomic development of the area, permanent crops have progressively become more attractive and remunerative than traditional seasonal crops.
The rest of the land covers show different trends, with figures for woodland increasing (total variation by about 20%) and those for bushland and grassland decreasing (total percentage variation by about 26% both, starting from 600 and 1380 km2, respectively, in 1954). As a consequence, woodland that covered 37.8% of the total area in 1954 expanded its area by up to 45% in 2018 (Figure 4a), corresponding to an areal expansion of about 510 km2 in 2018 out of the 2650 km2 covered in 1954. This result is not surprising as an increase in the percentage of land covered by woodland has been documented all over Europe by the Food and Agriculture Organization (FAO) [35,36]. The FAO states that woodland areas have universally increased by 1.1 × 10⁶ km2 since 1990 in nontropical regions, with their highest rate of growth between 2000 and 2010. Overall, the phenomenon is referred to as afforestation and accounts for three processes: the spontaneous regeneration of woodlands, the reforestation of formerly wooded areas, and the afforestation of new areas, which had previously been used for different purposes.
The existence of afforestation trends has also been confirmed in other regions of the Alps in Switzerland and Austria. By comparing georeferenced land registry maps with current satellite images, land cover changes were investigated in some sample areas of the Adige river watershed, and it was found that an afforestation trend can be identified from the mid-19th century onwards, with strong variations in the percentage increases, depending on the sample area location [15]. The evolution of this phenomenon since 1954 is clearly shown in Figure 5, selected as an example. It is evident that the increase in woodland coverage mainly resulted from the contraction of bushland and grassland. Afforestation can thus be understood in terms of the abandonment of pasture activities and the reduction of woodland exploitation for firewood harvestings. Forestry has also gained prominence in mountain communities, which has led to better woodland maintenance and promotion of woodland expansion.
Therefore, the land cover transformations assessed in the watersheds analyzed between 1954 and 2018 are consistent with those observed in Europe. Although the urban sprawl is characterized by far larger percentage increases than afforestation, woodlands still account for a large portion of land coverage, as made clear in the areas detailed in Figure 4a. As opposed to urban sprawl, afforestation can therefore have a noticeable impact on the hydrologic balance by increasing evapotranspiration. Measurements and simulations of evapotranspiration processes conducted on nearby Swiss watersheds at variable spatial scales by using the Penman–Monteith equation [37] demonstrate that annual evapotranspiration depth increase with the woodland cover percentage. A crucial role is played by the leaf area index of woodlands, which is far greater than that of grassland. The impact of afforestation in decreasing mean runoff volumes is also clearly evidenced by recent studies conducted in Swiss Alps [38], which simulated the effects of afforestation and deforestation scenarios on streamflow discharges in seven Alpine watersheds and recorded a noteworthy impact when the increase in woodland area was about 20%, with a 1% runoff volume decrease per 10% increase in forested areas, approximately. Potential impacts involve an increase in hydrologic losses, namely, in canopy interception and evapotranspiration. Applying the results reported in [38], the 20% increase in woodland we identified in the investigated area for the 1954–2018 period would result in a 20 mm decrease in runoff volume, on average, a value that can explain a major part of the 36 mm of runoff volume losses that cannot be explained by claiming the enhanced potential evaporation due to temperature increase only, assessed with a −36 mm/century rate for the Adda watershed in [14]. Afforestation can therefore be confirmed as a potential concomitant cause for the statistically significant decreases assessed for the annual runoff volumes.
A final remark regards the expansion of water surfaces due to the construction of artificial reservoirs during the last century. It must be considered that their total water area is about 20.6 km2 in the Adda, Oglio, Chiese, and Mincio watersheds, whose overall catchment area measures 9632 km2 (see Table 1). According to [39], the evaporation from lakes in Italy is about 1200 mm per year at middle elevations, while the average actual evapotranspiration losses in watersheds similar to those investigated in this paper are about 500 mm per year [37]. Therefore, the increase rate in annual evaporation losses due to the artificial water surface expansion in the 20th century in the area of these four watersheds can be estimated to be less than 1.5 mm/century. As a consequence, this factor cannot be advocated as a significant concomitant cause for the marked runoff volume decline.

5. Conclusions

In this paper, runoff volumes originating from a wide portion of the Central Italian Alps were statistically analyzed in order to detect potential trends. Five long-term and high-quality series of annual runoff volumes were collected: Adige, Mincio, Chiese, Oglio, and Adda rivers. All the series revealed marked decreasing trends, which appear to be homogeneous in the study area and statistically significant. The only exception is given by the Oglio river, whose decreasing trend is not statistically significant, even if its rate is homogeneous with respect to the others. This can be explained by the relatively limited series length coupled with the weakness of the climate change signal. The use of the Sen–Adichie test for parallelism of regression lines at the regional scale is therefore highly recommended to overcome the limited length of individual series, one of the most common drawbacks to a reliable assessment of trend significances.
Moreover, to estimate the statistical significances of individual series, the Theil, Mann–Kendall, and the Spearman tests were conducted, which yielded consistent results, further confirming their equivalence in linear trend analysis. Finally, the Sen–Adichie test, based on a least squares estimator of the common slope from a unique sample, obtained by pooling the individual series, was applied. For the five series investigated, a statistically significant regional decrease at annual runoff volumes of −1.45 mm/year is assessed. This is a marked decreasing trend, which poses serious challenges to the sustainability of freshwater demand in the downstream lowlands, where irrigation practices and water consumption habits have been established over centuries and have been crucial in reshaping the natural landscape into the present one. It is worthy to underline that the streamflow discharge decline rate is presently mitigated by the glacier cover retreat, and in the future, this contribution is expected to rapidly disappear, making the annual runoff volume decrease rate even more marked. If confirmed, a long-lasting decline in runoff will require a thorough revision of local freshwater management policies and could compromise the water bodies’ ecosystem services.
Nevertheless, further research is still needed in order to assess the impact of climate change on freshwater demand sustainability. Although streamflow is expected to decrease while freshwater demand is expected to increase in the mean values, a redistribution of the annual precipitation depths could worsen or better the future deficit. Changes in the temporal structure of precipitation events could also have consequences on the runoff regime due to the nonlinear nature of the precipitation–runoff transformation processes. Such items thus delineate a research gap that has to be filled. Finally, the decline in streamflow cannot be explained by a decrease in annual precipitations, as some watersheds show increasing trends while others show decreasing trends, all statistically nonsignificant. From the statistical point of view, these behaviors are homogeneous in this area. The literature has evidenced that a marked and statistically significant increase in temperatures can be identified as a leading cause for the increase in evapotranspiration losses in this area, whereas afforestation, which was marked in the investigated area, accounting for an expansion of 540 km2 out of 2500 km2 from 1954 to 2018, is herein demonstrated to be a very likely concomitant cause. It must be pointed out, however, that afforestation plays a positive role in segregating greenhouse gasses and in mitigating the severity of extreme floods by enhancing canopy interception and thus decreasing runoff volumes. The different weights of temperature increase and afforestation in yielding the streamflow discharge’s decreasing trend remain to be evaluated in future research.

Author Contributions

Methodology, R.R. and M.T.; software, M.B.; investigation, M.B., M.T., A.M., and R.R.; data curation, M.B., M.T., A.M., and R.R.; writing—original draft preparation, M.B., A.M., and R.R.; writing—review and editing, M.B. and R.R.; visualization, M.B.; supervision, R.R. and A.M. All authors have read and agreed to the published version of the manuscript.

Funding

The Po River Water District funded the project “Caratterizzazione del regime di frequenza degli estremi idrologici nel distretto Po, anche considerando scenari di cambiamento climatico,” which supported part of this study.

Institutional Review Board Statement

Not applicable.

Informed Consent Statement

Not applicable.

Data Availability Statement

Streamflow and precipitation data used in this study for the Adda river are available at the repository “Multi-century (1800–2016) meteo-hydrological series for the Adda river basin (Central Alps)” available online: https://doi.org/10.1594/PANGAEA.919890 (accessed on 1 February 2021). Land cover data can be freely downloaded from the Lombardy Region’s geodatabase web portal available online: http://www.geoportale.regione.lombardia.it/ (accessed on 1 February 2021).

Acknowledgments

The authors wish to thank the Consorzio dell’Adda, the Consorzio dell’Oglio, the Regional Agency for Environmental Protection of Lombardy Region (ARPA–Lombardia), and the Interregional Agency for the Po River (AIPo) for providing the data series herein analyzed. Particular thanks must be given to Roberto Serra and Matteo Cislaghi of ARPA for their essential support in the collection and quality verification of raw hydrometric data from the Chiese river.

Conflicts of Interest

The authors declare no conflict of interest.

Appendix A

A symmetric two-sided confidence interval associated with the Theil slope estimator (2) can be assessed by using a distribution-free procedure [21,22,23]. First, the integer Cα must be computed with regard to a confidence band width (1 − α), according to Equation (A1), valid for large samples (nk > 40), where z(α/2) is the α/2 upper percentile of the standard normal distribution.
To estimate C α for small samples, see details in [25]. In general, Equation (A1) does not yield an integer. To be conservative, C α can be approximated to the largest integer less than or equal to the right-hand side.
C α = z ( α / 2 )     n k ( n k 1 ) ( 2   n k + 5 ) 18
With regard to the slope sample sorted in ascending order { s k i j ( 1 ) s k i j ( n k c ) } , being n k c = n k ( n k 1 ) / 2 the number of independent couples, the lower confidence boundary mkl and the upper confidence boundary mku are given by Equation (A2).
m k l = s k i j ( M )   w i t h   M = n k c C α 2 ;   m k u = s k i j ( Q )   w i t h   Q = M + C α  

Appendix B

According to Theil [21], to test the null hypothesis H0 shown in Equation (A3) that a regression line has a slope mk equal to a specified value m ¯ k , a distribution-free procedure can be implemented as follows [25].
H 0 :   m k = m ¯ k
First, nk differences dki defined in Equation (A4) must be computed; then, the sum C k must be evaluated by using function ζ ( · ) as shown in Equation (A5).
d k i = x k i m ¯ k   t i   f o r   i = 1 , ,   n k
C k = i = 1 n k 1 j = i + 1 n k ζ ( d k j d k i ) ,   w i t h   ζ ( λ ) = { 1 i f   λ < 0 0 i f   λ = 0 1 i f   λ > 0
The test approximation for large samples (nk > 40) is based on the asymptotic normality C k * of the sum C k , which can be standardized according to Equation (A6). The procedure for small samples is supplied by [25].
C k * = C k   n k ( n k 1 ) ( 2   n k + 5 ) / 18
The null hypothesis given by Equation (A3) can be rejected if the condition given in Equation (A7) is satisfied. In this inequality, z(α/2) is the α/2 upper percentile of the standard normal distribution and α is the test p-value. This is a two-sided symmetric test, where α/2 is the probability in the tails of a standard normal distribution of C k * .
| C k * | z ( α / 2 )
Equation (A7) can be inverted to estimate the test p-value α for which the null hypothesis given by Equation (A3) cannot be rejected. Let N ( · ) be the nonexceedance probability function of the standard normal distribution. Thus, the null hypothesis cannot be rejected if inequality reported in Equation (A8) holds.
α < 2   [   1 N ( | C k * | )   ]

Appendix C

An asymptotically distribution-free test for parallelism of regression lines (Sen–Adichie test) can be derived according to the following procedure [25,31,32,33]. The null hypothesis H0 of interest, given by Equation (4), is that N > 2 regression lines have a common unspecified slope mp that can be estimated by using Equation (5). Thus, for each k regression sample, the aligned observations y k i * must be computed according to the expression in Equation (A9) for each series.
y k i * = x k i m p   t k i ,   f o r   k = 1 , , N   a n d   i = 1 , , n k
The sums T k * and C k 2 must then be computed for each of the N series as indicated in Equations (A10) and (A11), respectively.
T k * = i = 1 n k ( t k i t ^ k )   r k i * n k + 1 ,   f o r   k = 1 , , N
C k 2 = i = 1 n k ( t k i t ^ k ) 2 ,   f o r   k = 1 , , N
r k i * denotes the rank of y k i * in the k-th regression series, and t ^ k is computed as shown in Equation (5). The Sen–Adichie sample statistics V can finally be computed according to Equation (A12).
V = 12   k = 1 N ( T k * C k ) 2
Therefore, the null hypothesis stated in Equation (4) can be rejected for a test p-value α if the condition given by Equation (A13) is satisfied. In this inequality, χ 2 ( N 1 , α ) is the α upper percentile of a chi-square distribution with (N − 1) degrees of freedom.
V χ 2 ( N 1 ,   α )
Equation (A13) can be inverted to estimate the test p-value α for which the null hypothesis given by Equation (4) cannot be rejected. Let C N 1 2 ( · ) be the nonexceedance probability function of the chi-square distribution with (N − 1) degrees of freedom. Thus, the null hypothesis cannot be rejected if the inequality in Equation (A14) holds.
α < 1 C N 1 2 ( V )

References

  1. Bates, B.C.; Kundzewicz, Z.W.; Wu, S.; Palutikof, J.P. Climate Change and Water. Technical Paper VI of the Intergovernmental Panel on Climate Change; IPCC: Geneva, Switzerland, 2008; p. 210. [Google Scholar]
  2. Hartmann, D.L.; Klein Tank, A.M.G.; Rusticucci, M.; Alexander, L.V.; Brönnimann, S.; Charabi, Y.; Dentener, F.J.; Dlugokencky, E.J.; Easterling, D.R.; Kaplan, A.; et al. Observations: Atmosphere and Surface. In Climate Change 2013: The Physical Science Basis; Stocker, T.F., Qin, D., Plattner, G.-K., Tignor, M., Allen, S.K., Boschung, J., Nauels, A., Xia, Y., Bex, V., Midgley, P.M., Eds.; Cambridge University Press: Cambridge, UK, 2013; pp. 159–254. [Google Scholar]
  3. Labat, D.; Godderis, Y.; Probst, J.L.; Guyot, J.L. Evidence for global runoff increase related to climate warming. Adv. Water Resour. 2004, 27, 631–642. [Google Scholar] [CrossRef]
  4. Milliman, J.D.; Farnsworth, K.L.; Jones, P.D.; Xu, K.H.; Smith, L.C. Climatic and anthropogenic factors affecting river discharge to the global ocean, 1951–2000. Global Planet. Chang. 2008, 62, 187–194. [Google Scholar] [CrossRef]
  5. Dai, A.; Qian, T.T.; Trenberth, K.E.; Milliman, J.D. Changes in continental freshwater discharge from 1948 to 2004. Int. J. Climatol. 2009, 22, 2773–2792. [Google Scholar] [CrossRef]
  6. Stahl, K.; Hisdal, H.; Hannaford, J.; Tallaksen, L.; Van Lanen, H.; Sauquet, E.; Demuth, S.; Fendekova, M.; Jordar, J. Streamflow trends in Europe: Evidence from a dataset of near-natural catchments. Hydrol. Earth Syst. Sci. 2010, 14, 2367–2382. [Google Scholar] [CrossRef] [Green Version]
  7. Stahl, K.; Tallaksen, L.M.; Hannaford, J.; Van Lanen, H.A.J. Filling the white space on maps of European runoff trends: Estimates from a multi-model ensemble. Hydrol. Earth Syst. Sci. 2012, 16, 2035–2047. [Google Scholar] [CrossRef] [Green Version]
  8. Su, L.; Miao, C.; Kong, D.; Duan, Q.; Lei, X.; Hou, Q.; Li, H. Long-term trends in global river flow and the causal relationships between river flow and ocean signals. J. Hydrol. 2018, 563, 818–833. [Google Scholar] [CrossRef]
  9. Blöschl, G.; Hall, J.; Parajka, J.; Perdigão, R.A.; Merz, B.; Arheimer, B.; Aronica, G.T.; Bilibashi, A.; Bonacci, O.; Borga, M.; et al. Changing climate shifts timing of European floods. Science 2017, 357, 588–590. [Google Scholar] [CrossRef] [Green Version]
  10. Brunetti, M.; Lentini, G.; Maugeri, M.; Nanni, T.; Auer, I.; Böhm, R.; Schöner, W. Climate variability and change in the Greater Alpine Region over the last two centuries based on multi-variable analysis. Int. J. Climatol. 2009, 29, 2197–2225. [Google Scholar] [CrossRef]
  11. Montanari, A. Hydrology of the Po River: Looking for changing patterns in river discharge. Hydrol. Earth Syst. Sci. 2012, 16, 3739–3747. [Google Scholar] [CrossRef] [Green Version]
  12. Zanchettin, D.; Traverso, P.; Tomasino, M. Po river discharge: A preliminary analysis of a 200-year time series. Clim. Chang. 2008, 88, 411–433. [Google Scholar] [CrossRef]
  13. Crespi, A.; Brunetti, M.; Maugeri, M.; Ranzi, R.; Tomirotti, M. 1845–2016 gridded dataset of monthly precipitation over the upper Adda river basin: A comparison with runoff series. Adv. Sci. Res. 2018, 15, 173–181. [Google Scholar] [CrossRef]
  14. Ranzi, R.; Michailidi, E.M.; Tomirotti, M.; Crespi, A.; Brunetti, M.; Maugeri, M. A multi-century meteo-hydrological analysis for the Adda river basin (central Alps). Part II: Daily runoff (1845–2016) at different scales. Int. J. Climatol. 2021, 41, 181–199. [Google Scholar] [CrossRef]
  15. Ranzi, R.; Caronna, P.; Tomirotti, M. Impact of climatic and land use changes on river flows in the Southern Alps. In Sustainable Water Resources Planning and Management under Climate Change; Kolokytha, E., Oishi, S., Teegavarapu, R.S.V., Eds.; Springer: Singapore, 2017; pp. 61–83. [Google Scholar]
  16. Crespi, A.; Brunetti, M.; Ranzi, R.; Tomirotti, M.; Maugeri, M. A multi-century meteo-hydrological analysis for the Adda river basin (central Alps). part I: Gridded monthly precipitation (1800–2016) records. Int. J. Climatol. 2021, 41, 162–180. [Google Scholar] [CrossRef]
  17. Regione Lombardia, 2002. Regolamento per la gestione coordinata del Lago d’Idro e dei serbatoi dell’Alto Chiese. Edizione 21 Marzo 2002. Deliberazione di Giunta Regionale n° VII/9297 del 7 Giugno 2002. (In Italian). Available online: www.consultazioniburl.servizirl.it (accessed on 1 February 2021).
  18. Lombardini, E. Della Natura dei Laghi e Delle Opere Intese a Regolarne il Deflusso, 2nd ed.; Tipografia Degli Ingegneri: Milan, Italy, 1866; p. 165. (In Italian) [Google Scholar]
  19. Fantoli, G. Il lago di Como e l’Adda Emissario Nella Condizione Idraulica Odierna e Nella Divisata Regolazione Del Deflusso Mediante Opere Mobile di Trattenuta e di Scarico; Hoepli: Milan, Italy, 1921; p. 306. (In Italian) [Google Scholar]
  20. Citrini, D. Le Piene del Lario e dell’Adda nel Regime Regolato; Consorzio dell’Adda: Milan, Italy, 1978; p. 40. (In Italian) [Google Scholar]
  21. Theil, H. A Rank-Invariant Method of Linear and Polynomial Regression Analysis, I; Koninklijke Nederlandse Akademie van Wetenschappen 53: Amsterdam, The Netherlands, 1950; pp. 386–392. [Google Scholar]
  22. Theil, H. A Rank-Invariant Method of Linear and Polynomial Regression Analysis, II; Koninklijke Nederlandse Akademie van Wetenschappen 53: Amsterdam, The Netherlands, 1950; pp. 521–525. [Google Scholar]
  23. Theil, H. A Rank-Invariant Method of Linear and Polynomial Regression Analysis, III; Koninklijke Nederlandse Akademie van Wetenschappen Series A 53: Amsterdam, The Netherlands, 1950; pp. 1397–1412. [Google Scholar]
  24. Sen, P.K. Estimates of the regression coefficient based on Kendall’s tau. J. Am. Stat. Assoc. 1968, 63, 1379–1389. [Google Scholar] [CrossRef]
  25. Hollander, M.; Wolfe, D.A.; Chicken, E. Regression problems. In Nonparametric Statistical Methods, 3rd ed.; Hollander, M., Wolfe, D.A., Chicken, E., Eds.; Wiley & Sons: New York, NY, USA, 2014; pp. 451–494. [Google Scholar]
  26. Hettmansperger, T.P.; McKean, J.W. A robust alternative based on ranks to least squares in analyzing linear models. Technometrics 1977, 19, 275–284. [Google Scholar] [CrossRef]
  27. Wilcox, R.R. Fundamentals of Modern Statistical Methods, 2nd ed.; Springer: New York, NY, USA, 2010. [Google Scholar]
  28. Kendall, M.G. A new measure of the rank correlation. Biometrika 1938, 30, 81–93. [Google Scholar] [CrossRef]
  29. Mann, H.B. Nonparametric tests against trend. Econometrics 1945, 13, 245–259. [Google Scholar] [CrossRef]
  30. Spearman, C. The proof and measurement of association between two things. Am. J. Psychol. 1904, 15, 72–101. [Google Scholar] [CrossRef]
  31. Sen, P.K. On a class of rank order tests for the parallelism of several regression lines. Ann. Math. Stat. 1969, 40, 1668–1683. [Google Scholar] [CrossRef]
  32. Adichie, J.N. Testing parallelism of regression lines against ordered alternatives. Commun. Stat. Theory 1976, 5, 985–997. [Google Scholar] [CrossRef]
  33. Adichie, J.N. Rank tests in linear model. In Handbook of Statistics 4: Nonparametric Methods; Krishnaiah, P.R., Sen, P.K., Eds.; North Holland: Amsterdam, The Netherlands, 1984; pp. 229–257. [Google Scholar]
  34. Auer, I.; Böhm, R.; Jurkovic, A.; Lipa, W.; Orlik, A.; Potzmann, R.; Schoener, W.; Ungersboeck, M.; Matulla, C.; Briffa, K.; et al. HISTALP—historical instrumental climatological surface time series of the Greater Alpine Region. Int. J. Climatol. 2007, 27, 17–46. [Google Scholar] [CrossRef]
  35. FAO. State of the World’s Forests, 2011; Food and Agriculture Organization of the United Nations: Rome, Italy, 2011. [Google Scholar]
  36. FAO. State of the World’s Forests, 2018; Food and Agriculture Organization of the United Nations: Rome, Italy, 2018. [Google Scholar]
  37. Gurtz, J.; Baltensweiler, A.; Lang, H. Spatially distributed hydrotope-based modelling of evapotranspiration and runoff in mountainous basins. Hydrol. Process. 1999, 13, 2751–2768. [Google Scholar] [CrossRef]
  38. Zierl, B.; Bugmann, H. Global change impacts on hydrological processes in Alpine catchments. Water Resour. Res. 2005, 41, W02028. [Google Scholar] [CrossRef]
  39. Moisello, U. Idrologia Tecnica; La Goliardica Pavese: Pavia, Italy, 1999. (In Italian) [Google Scholar]
Figure 1. Location of the five studied watersheds in the Southern Alps region showing boundaries of the Lombardy Region and Trento and Bolzano Provinces, inset (a), and map of their main physiographic characteristics.
Water 13 00963 g001
Figure 2. The analyzed annual runoff volumes from 1930 to 2018, with comparison between the corresponding individual linear trends, evaluated with respect to the complete series.
Water 13 00963 g002
Figure 3. The observed annual areal precipitations from 1930 to 2018, with comparison between the corresponding individual linear trends, evaluated with respect to the complete series.
Water 13 00963 g003
Figure 4. Land cover transformation in the Lombardic portion of the analyzed area: trends of the area covered by the different classes in 1954, 1980, 1999, and 2018 (a) and percentage variations in the three temporal periods (b) (W: woodland, B: bushland, G: grassland, C: cropland, F: fruit trees, U: urban, and O: others).
Water 13 00963 g004
Figure 5. Comparison of land cover maps referred to the 1954 GAI survey (a) and to the 2018 DUSAF 6.0 survey (b): focus is on the area of land on the watershed divide separating the Adda watershed and the Oglio watershed (area, 125 km2) (Datum WGS84 coordinates UTM 32N).
Water 13 00963 g005
Table 1. Hydrological characteristics (area A, maximum, mean, and minimum elevations Zx, Zm, and Zn, annual mean of the precipitation depth Hm and of the runoff volume Dm) of the studied watersheds and data consistency (P, precipitation; R, runoff).
WatershedOutletAZxZmZnHmDmObservation PeriodSample Size nk
(km2)(m a.s.l.)(m a.s.l.)(m a.s.l.)(mm)(mm)PR
AdigeTrento9763389917351869507081862–2011-150
MincioMonzambano235035569666011807091950–2011-62
ChieseGavardo93434621230198146010901934–20188072
OglioSarnico18403554142915412609801933–2011-79
AddaLecco450840501569197133011501845–2016172172
Table 2. Results 1 of the analysis of the annual runoff volume trends 2.
Watershedmkmklmkuα0kτkαtkρkαrkmpαpαpk
(mm/year)(mm/year)(mm/year)(%)-(%)-(%)(mm/year)(%)(%)
Adige−1.34−1.75−0.98<0.1−0.30<0.1−0.46<0.1−1.4554.866.2
Mincio−3.33−5.00−1.280.5−0.240.6−0.321.015.8
Chiese−3.12−5.02−1.100.8−0.210.8−0.281.616.2
Oglio−1.16−2.910.5632.2−0.0832.4−0.1132.871.3
Adda−1.29−1.85−0.70<0.1−0.19<0.1−0.27<0.162.2
1mk, individual trend slopes; mkl, individual trend slope 5% percentile; mku, individual trend slope 95% percentile; α0k, p-value of the Theil test for null slope to be the individual trend slope; τk, Mann–Kendall coefficient of individual trends; αtk, p-value of the Mann–Kendall test for individual trend absence; ρk, Spearman coefficient of individual trends; αrk, p-value of the Spearman test for individual trend absence; mp, pool trend slope; αp, p-value of the Sen–Adichie test for linear trend parallelism; αpk, p-value of the Theil test for pool slope to be the individual trend slope. 2 Boldface indicates statistically significant trends (i.e., significance less than 5% when testing trend absence).
Table 3. Results 1 of the analysis of the annual precipitation volume trends.
Watershedmkmklmkuα0kτkαtkρkαrkmpαpαpk
(mm/year)(mm/year)(mm/year)(%)-(%)-(%)(mm/year)(%)(%)
Chiese1.05−0.943.0940.80.0641.10.0941.6−0.2522.140.8
Adda−0.49−1.090.1521.0−0.0621.0−0.0921.521.0
1mk, individual trend slopes; mkl, individual trend slope 5% percentile; mku, individual trend slope 95% percentile; α0k, p-value of the Theil test for null slope to be the individual trend slope; τk, Mann–Kendall coefficient of individual trends; αtk, p-value of the Mann–Kendall test for individual trend absence; ρk, Spearman coefficient of individual trends; αrk, p-value of the Spearman test for individual trend absence; mp, pool trend slope; αp, p-value of the Sen–Adichie test for linear trend parallelism; αpk, p-value of the Theil test for pool slope to be the individual trend slope.
Publisher’s Note: MDPI stays neutral with regard to jurisdictional claims in published maps and institutional affiliations.

