The Effect of the Effluent from a Small-Scale Conventional Wastewater Treatment Plant Treating Municipal Wastewater on the Composition and Abundance of the Microbial Community, Antibiotic Resistome, and Pathogens in the Sediment and Water of a Receiving Stream
Abstract
1. Introduction
2. Materials and Methods
2.1. Site Descriptions and Sampling Method
2.2. Chemical Analyses
2.3. DNA Extraction
2.4. Quantitative PCR Conditions and Analysis
2.5. Metagenome Sequencing and Analysis
2.6. Statistical Analysis
3. Results
3.1. Chemical Properties of WWTP Effluent, and Water and Sediment of the Stream and River
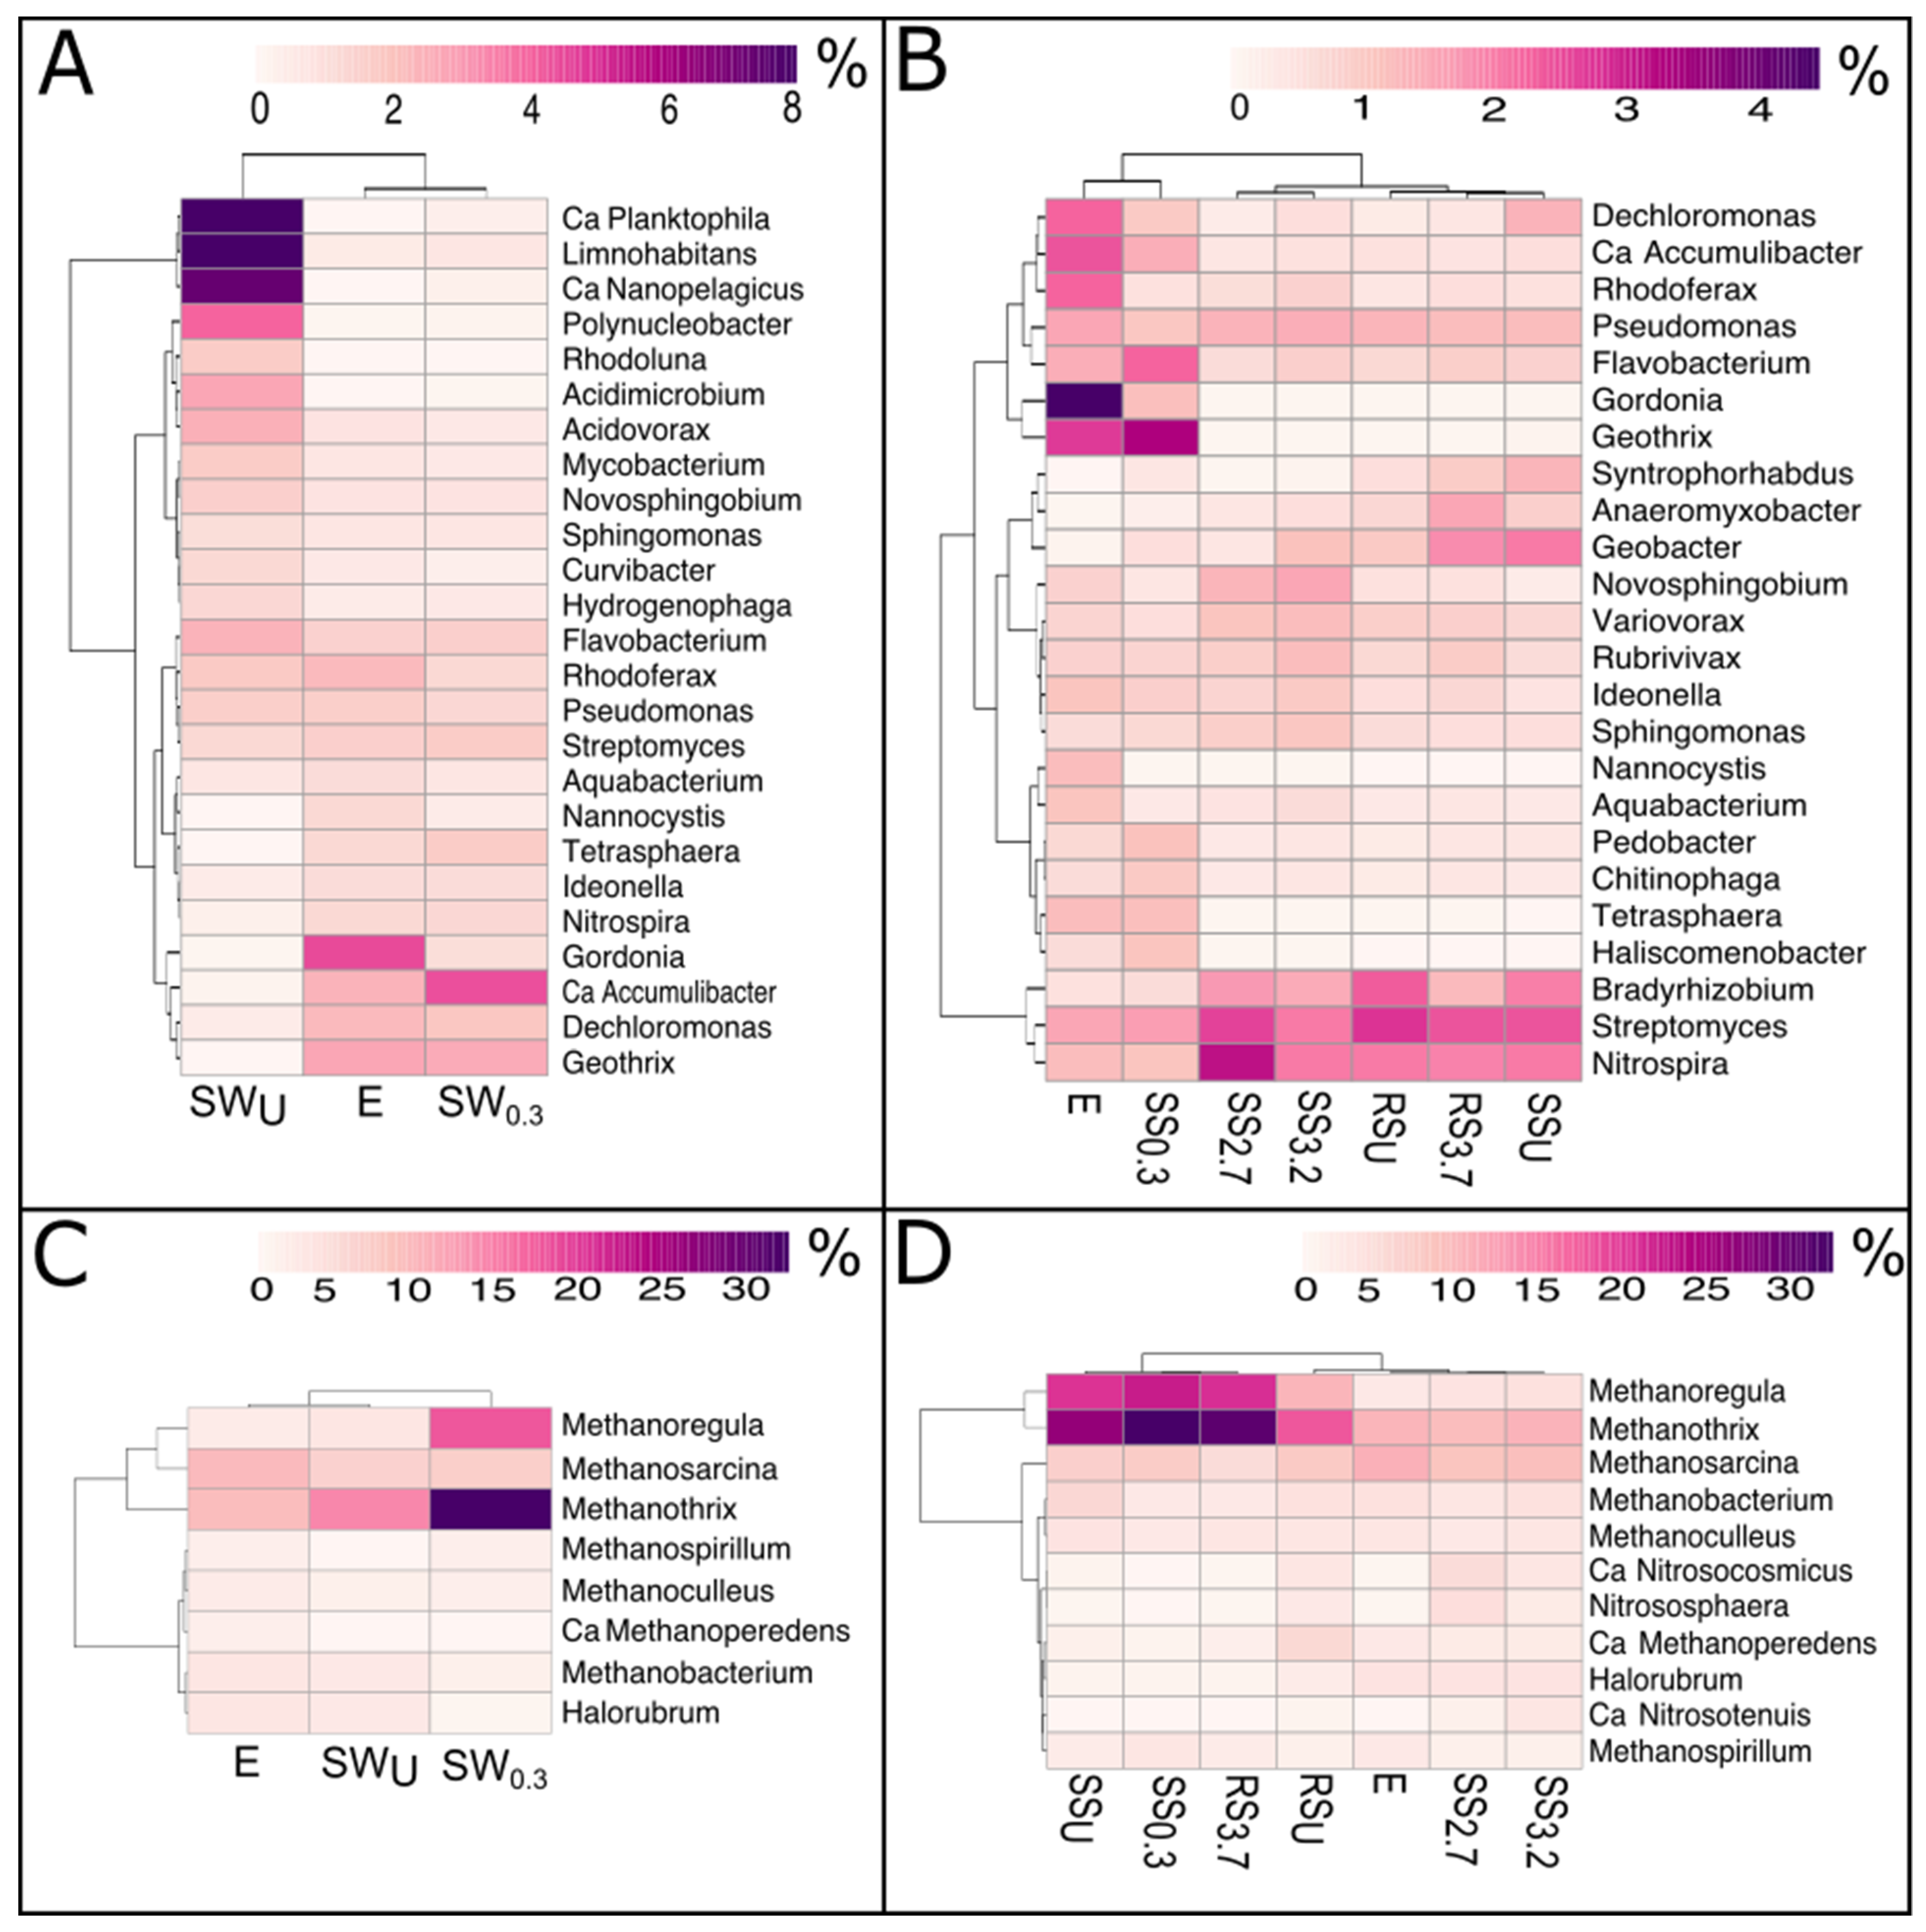
3.2. The Bacterial and Archaeal Community Abundance and Structure
3.2.1. WWTP Effluent
3.2.2. Stream and River Water
3.2.3. Stream and River Sediments
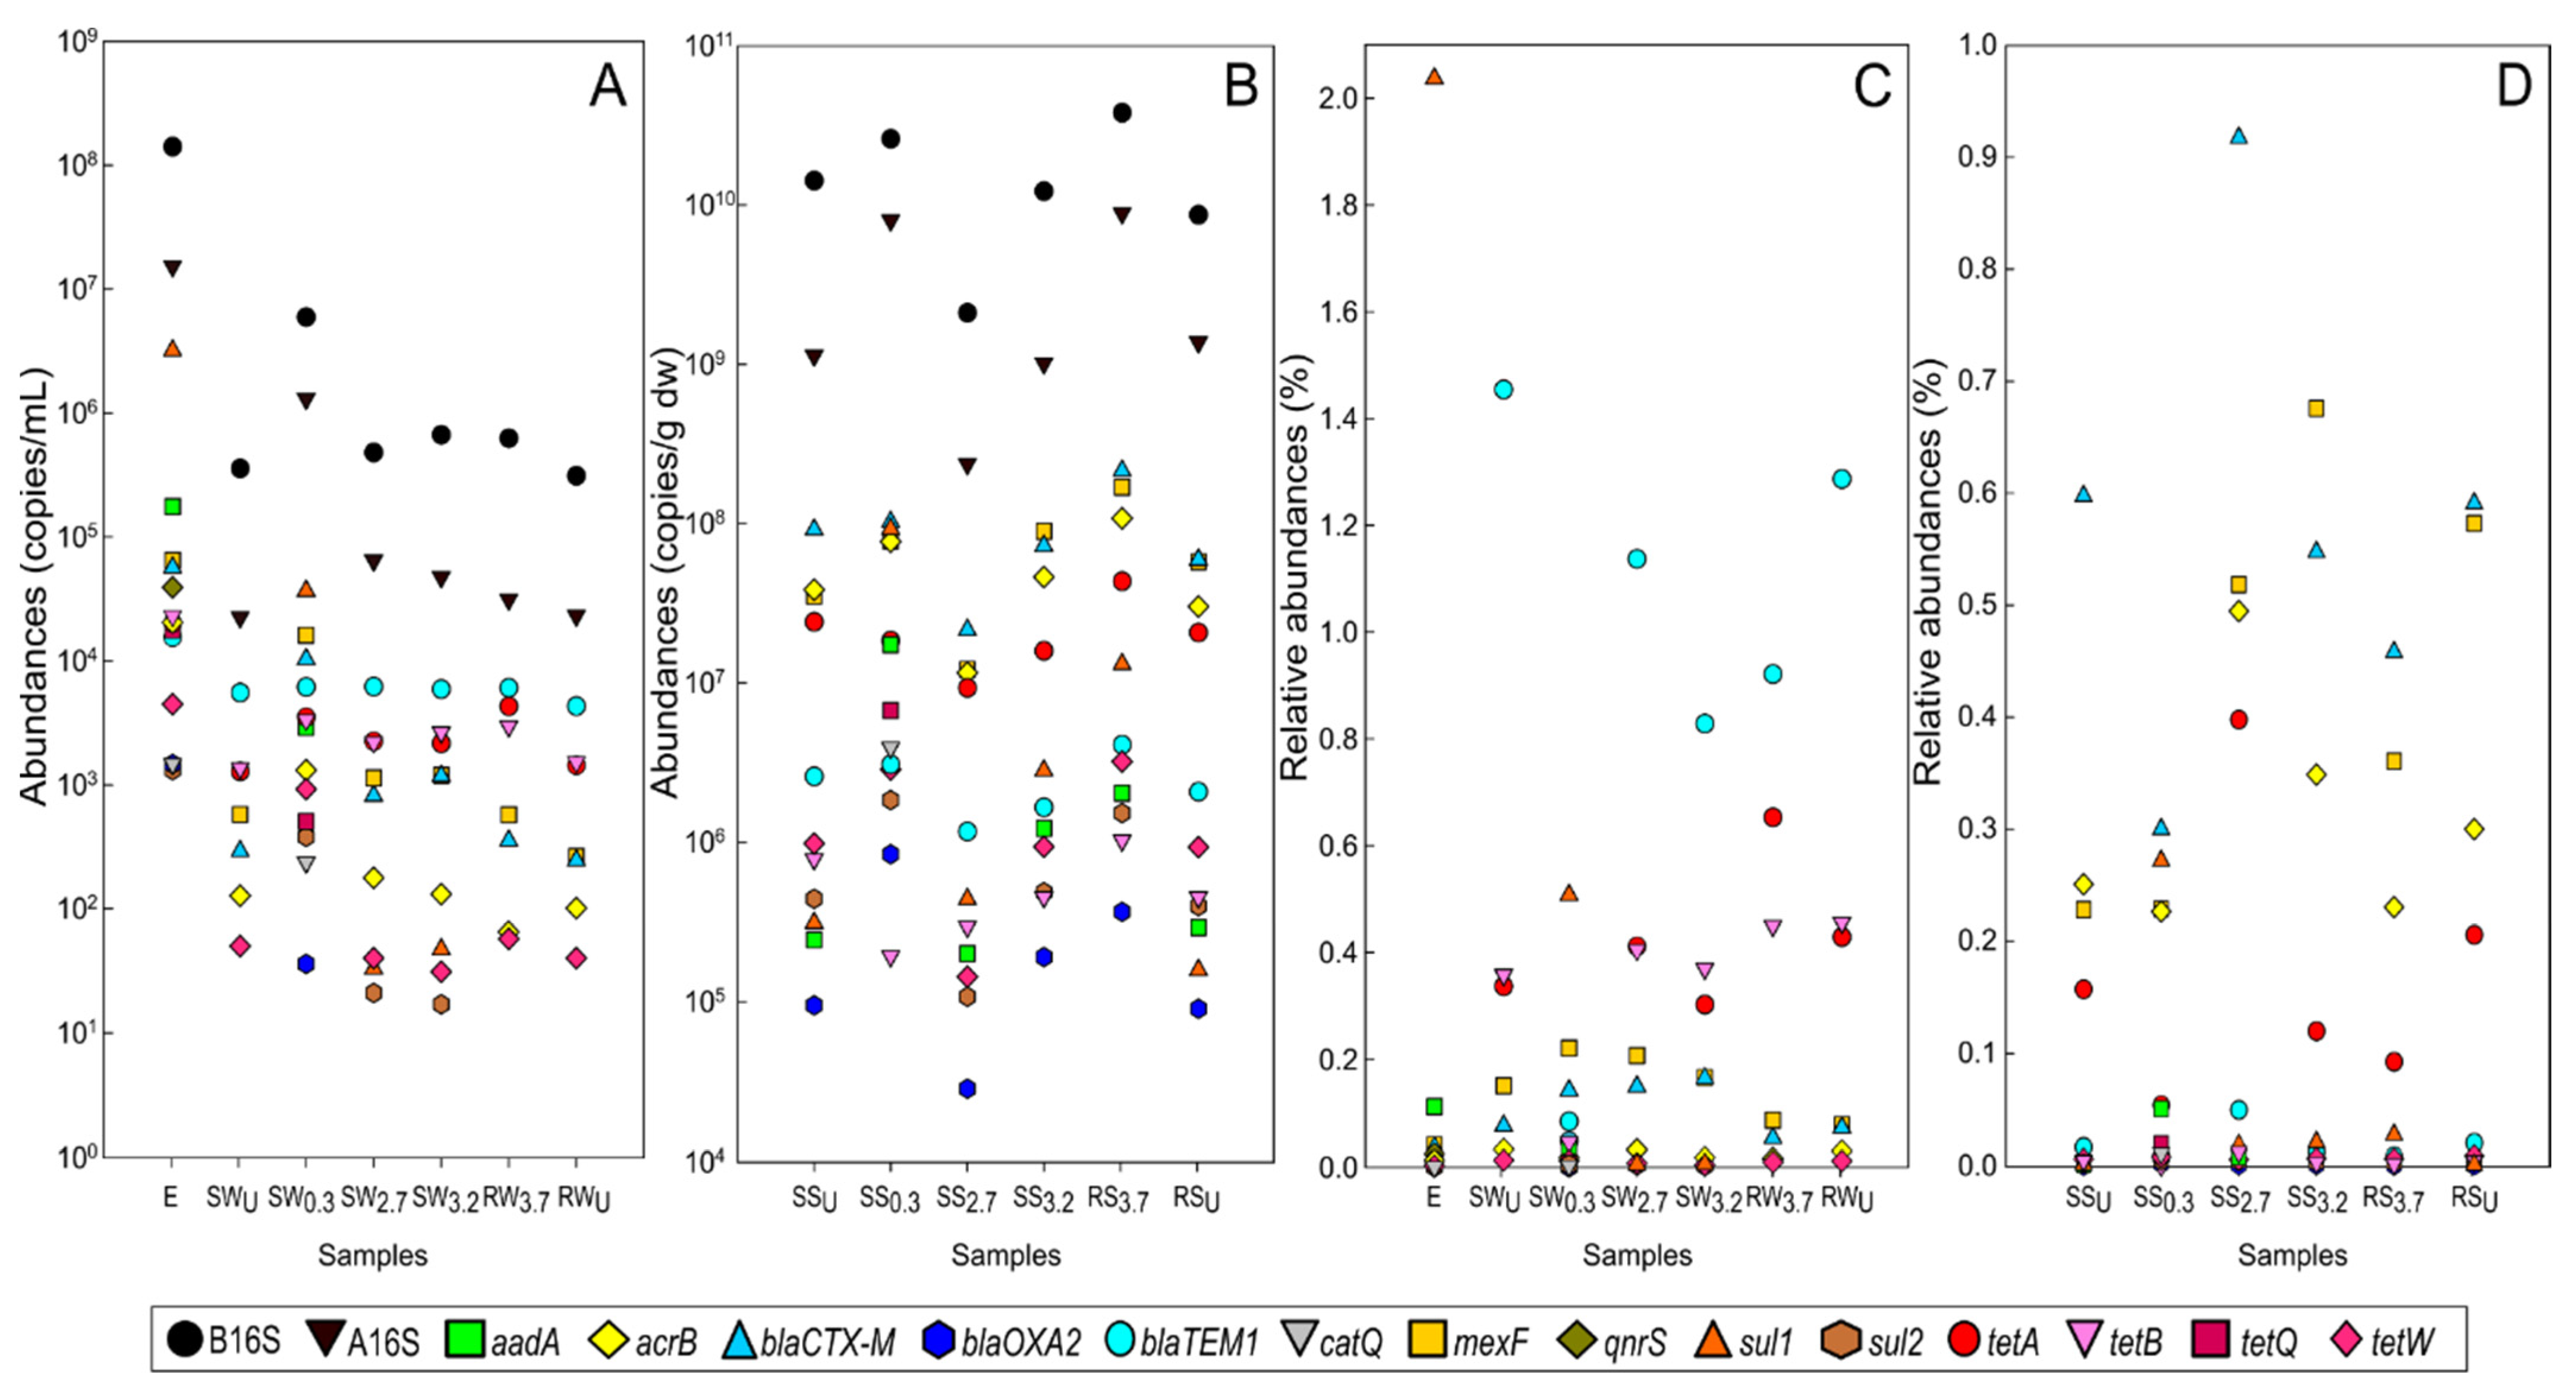
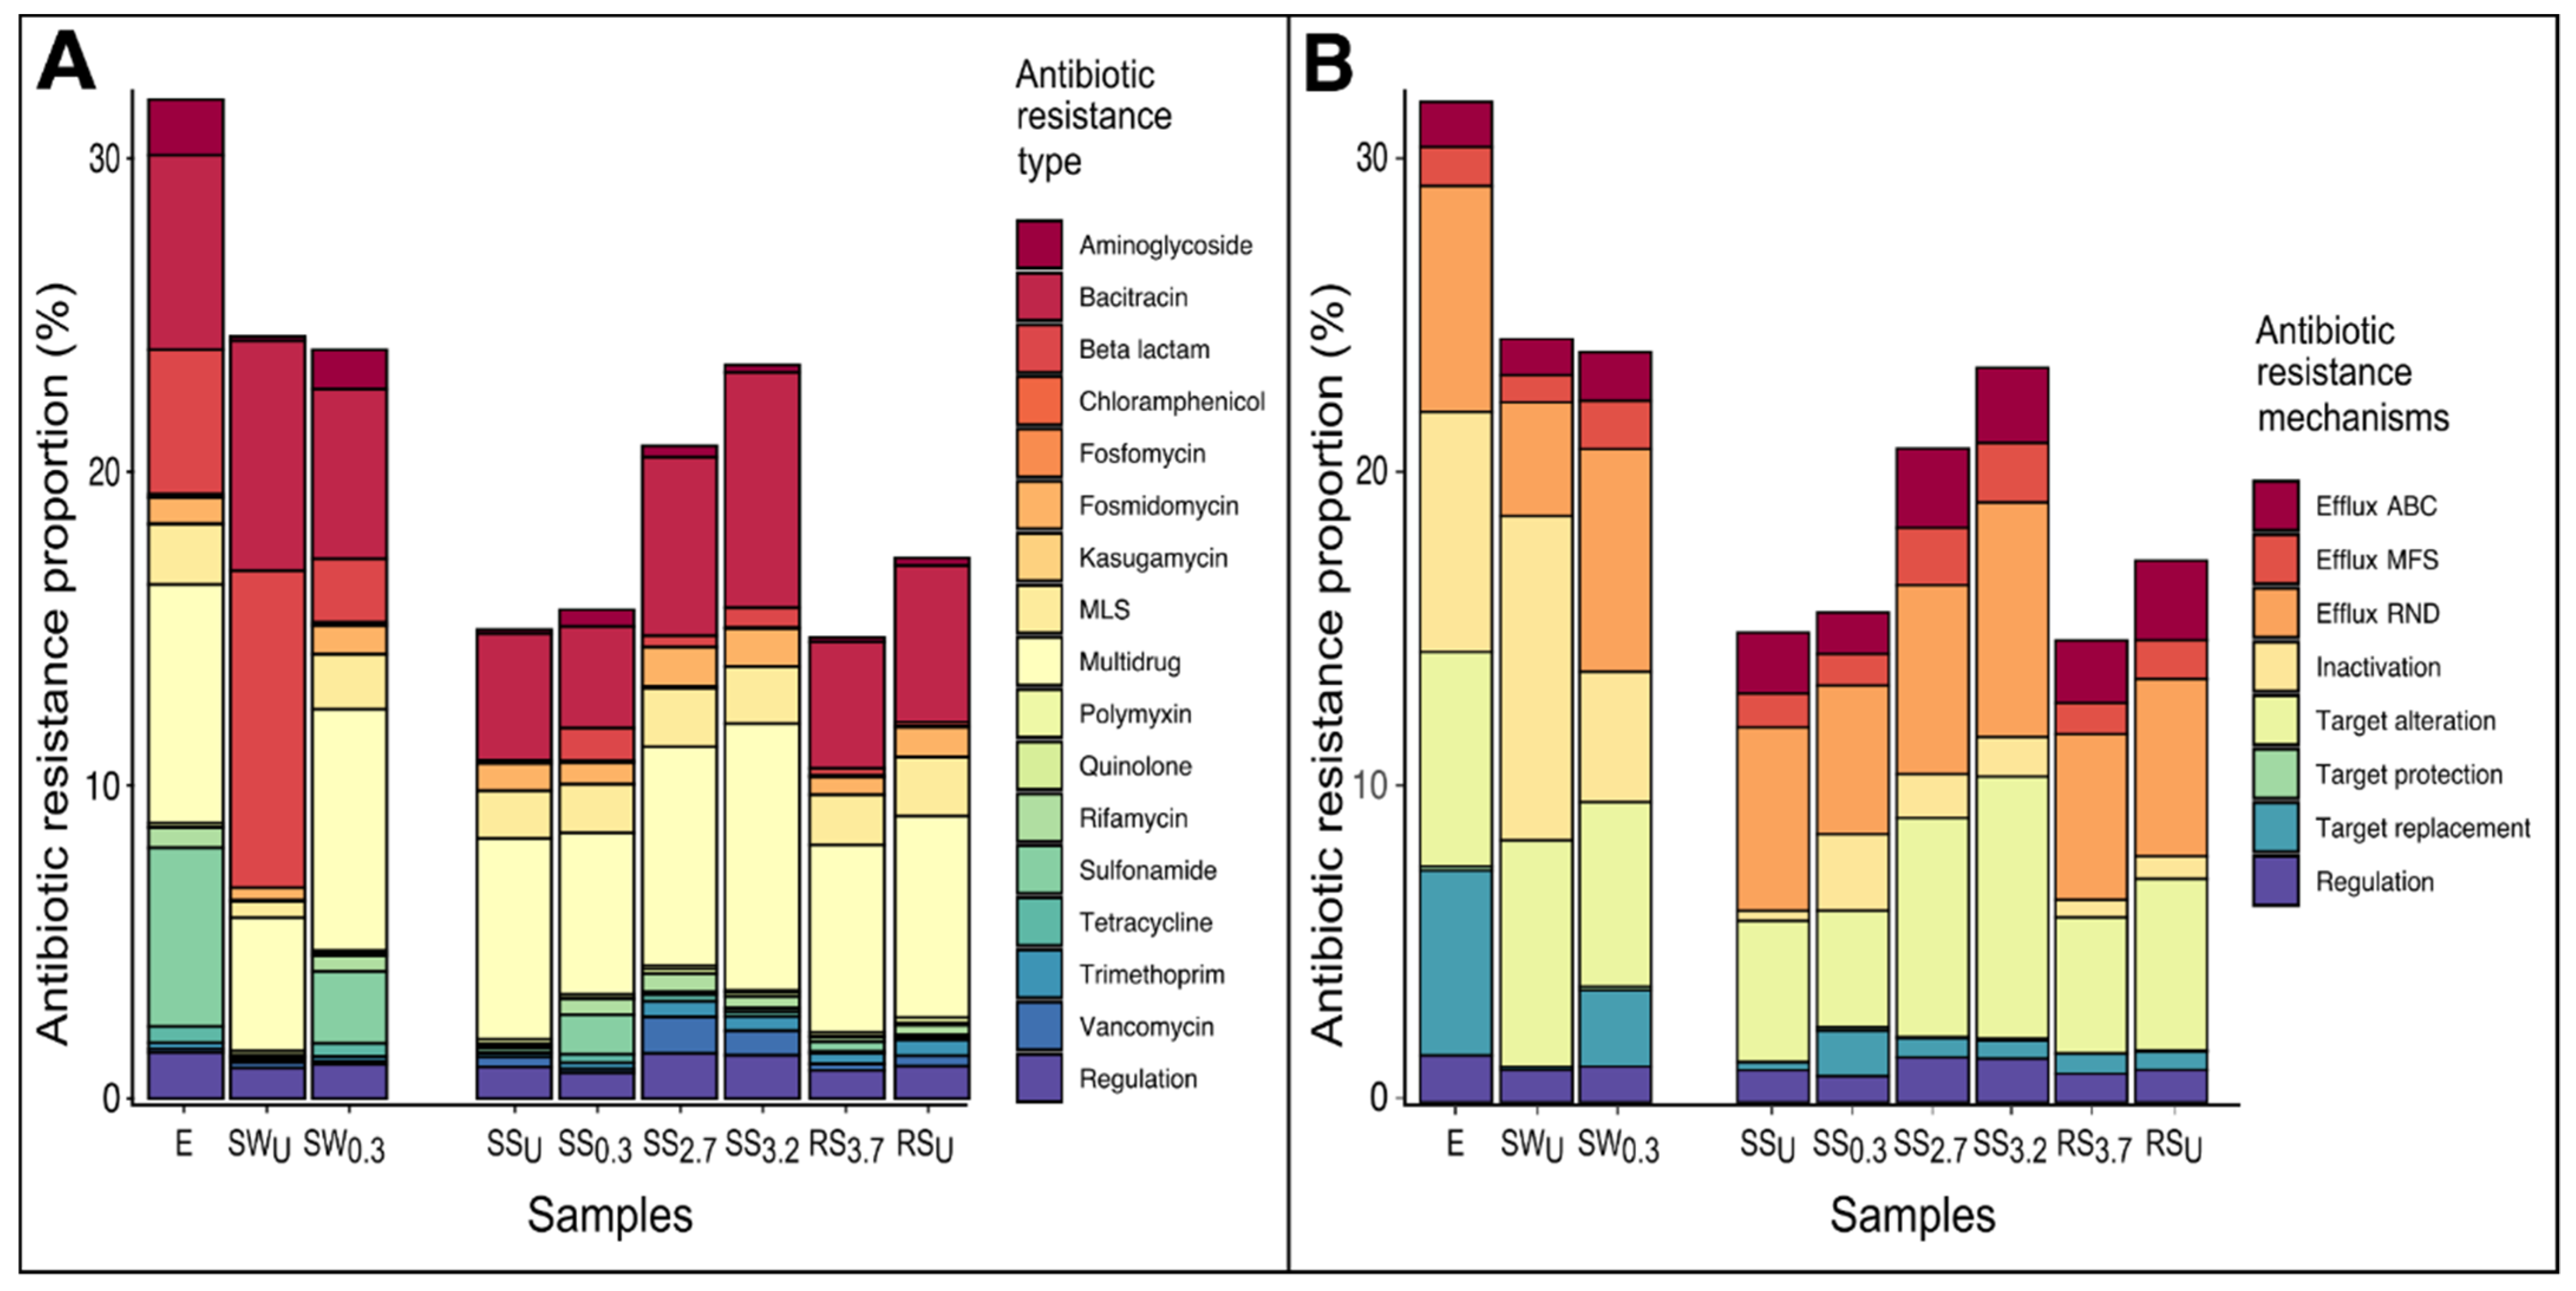
3.3. The Abundance and Composition of Antibiotic Resistome
3.3.1. WWTP Effluent
3.3.2. Stream and River Water
3.3.3. Sediments of Stream and River
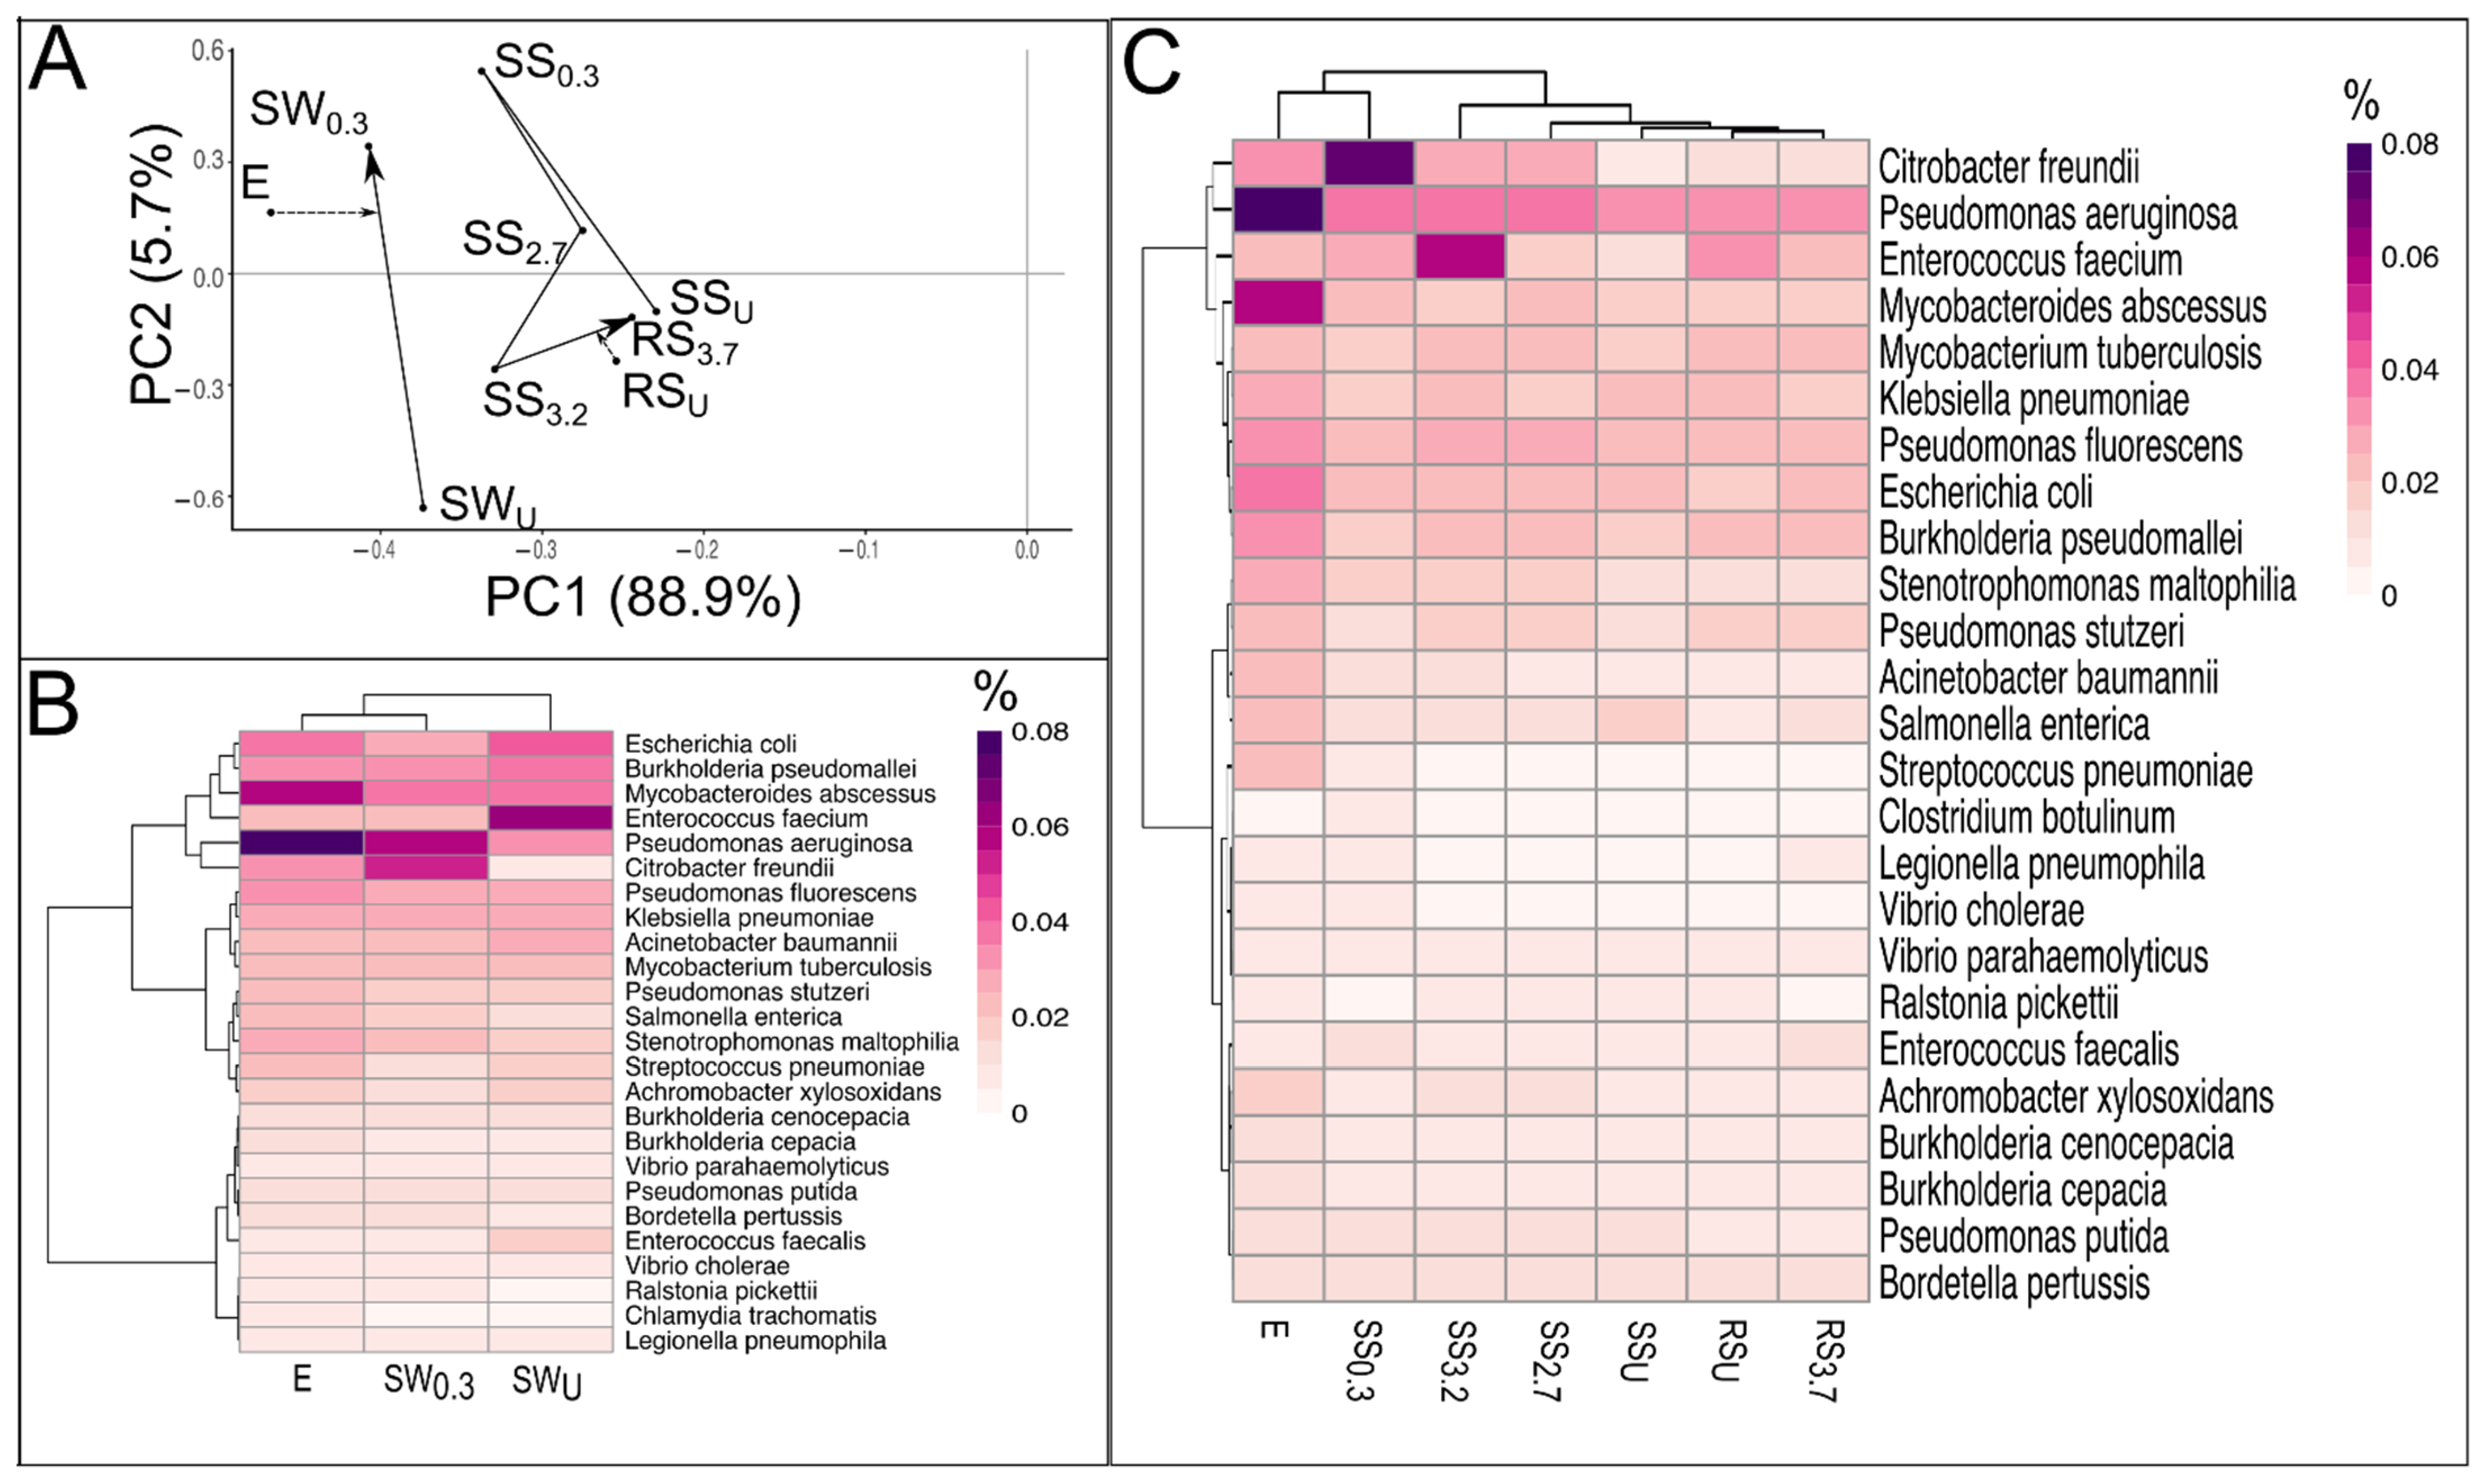
3.4. Pathogens in WWTP Effluent, Stream and River Water, and Sediment
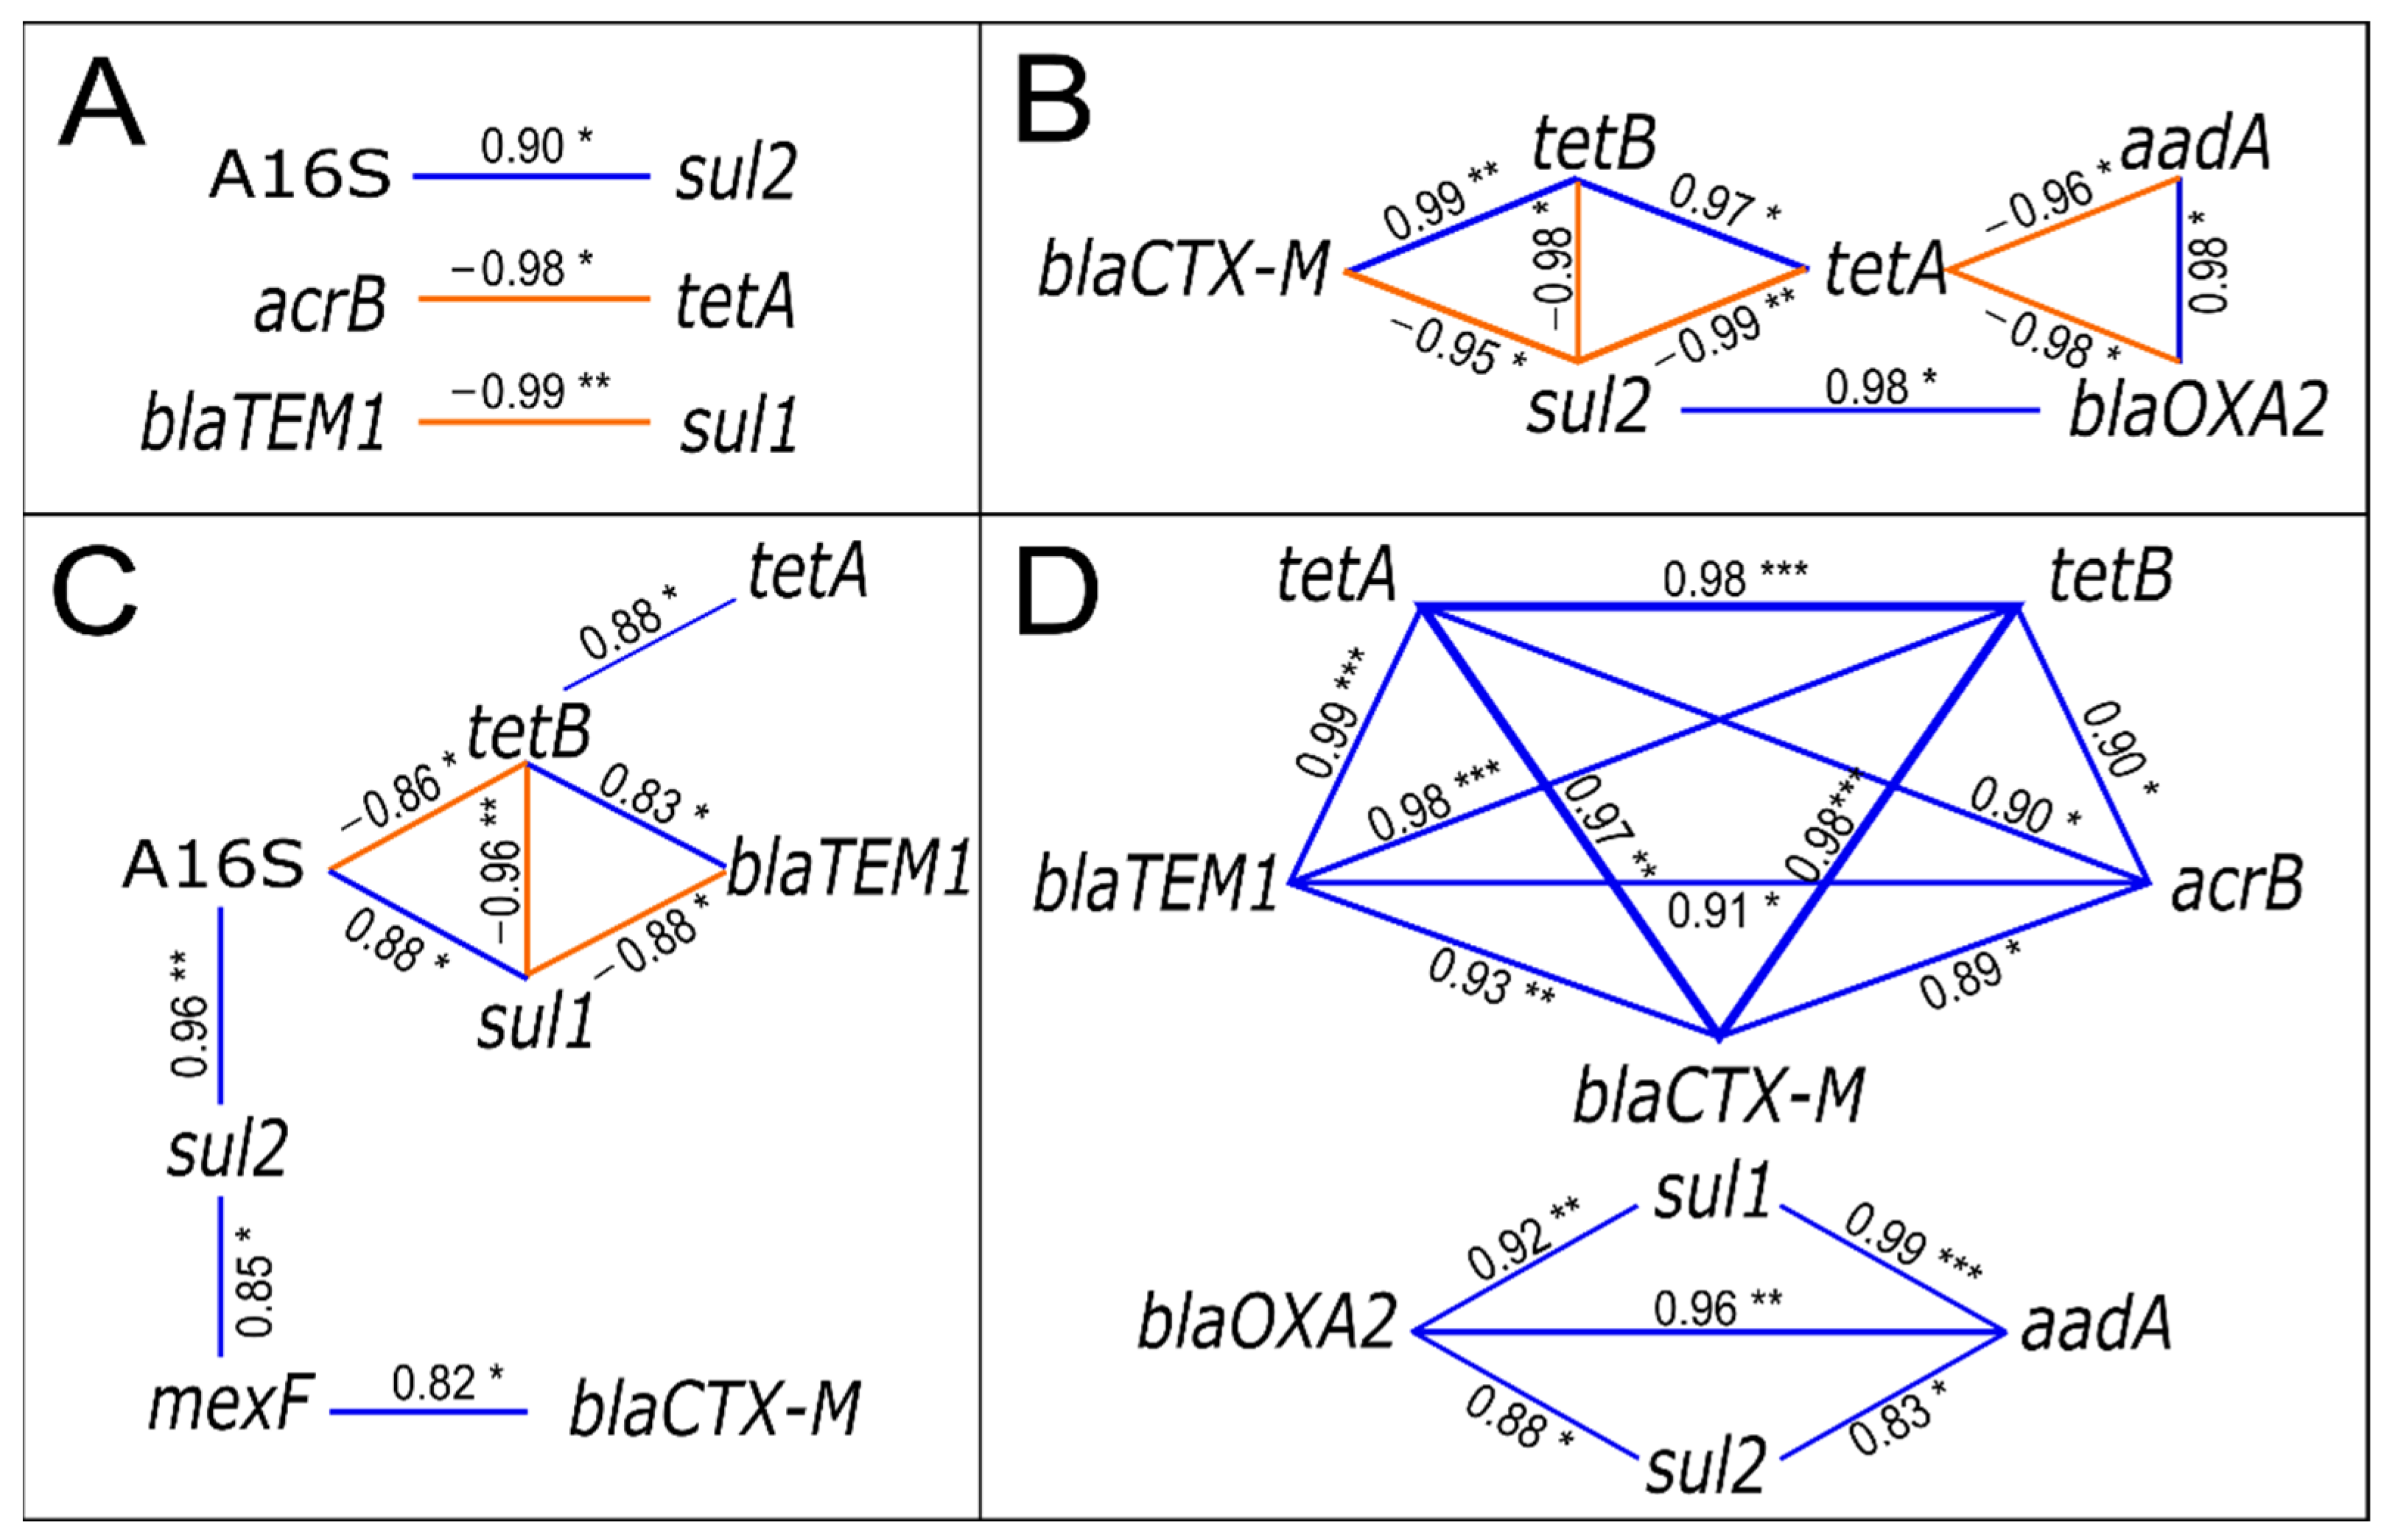
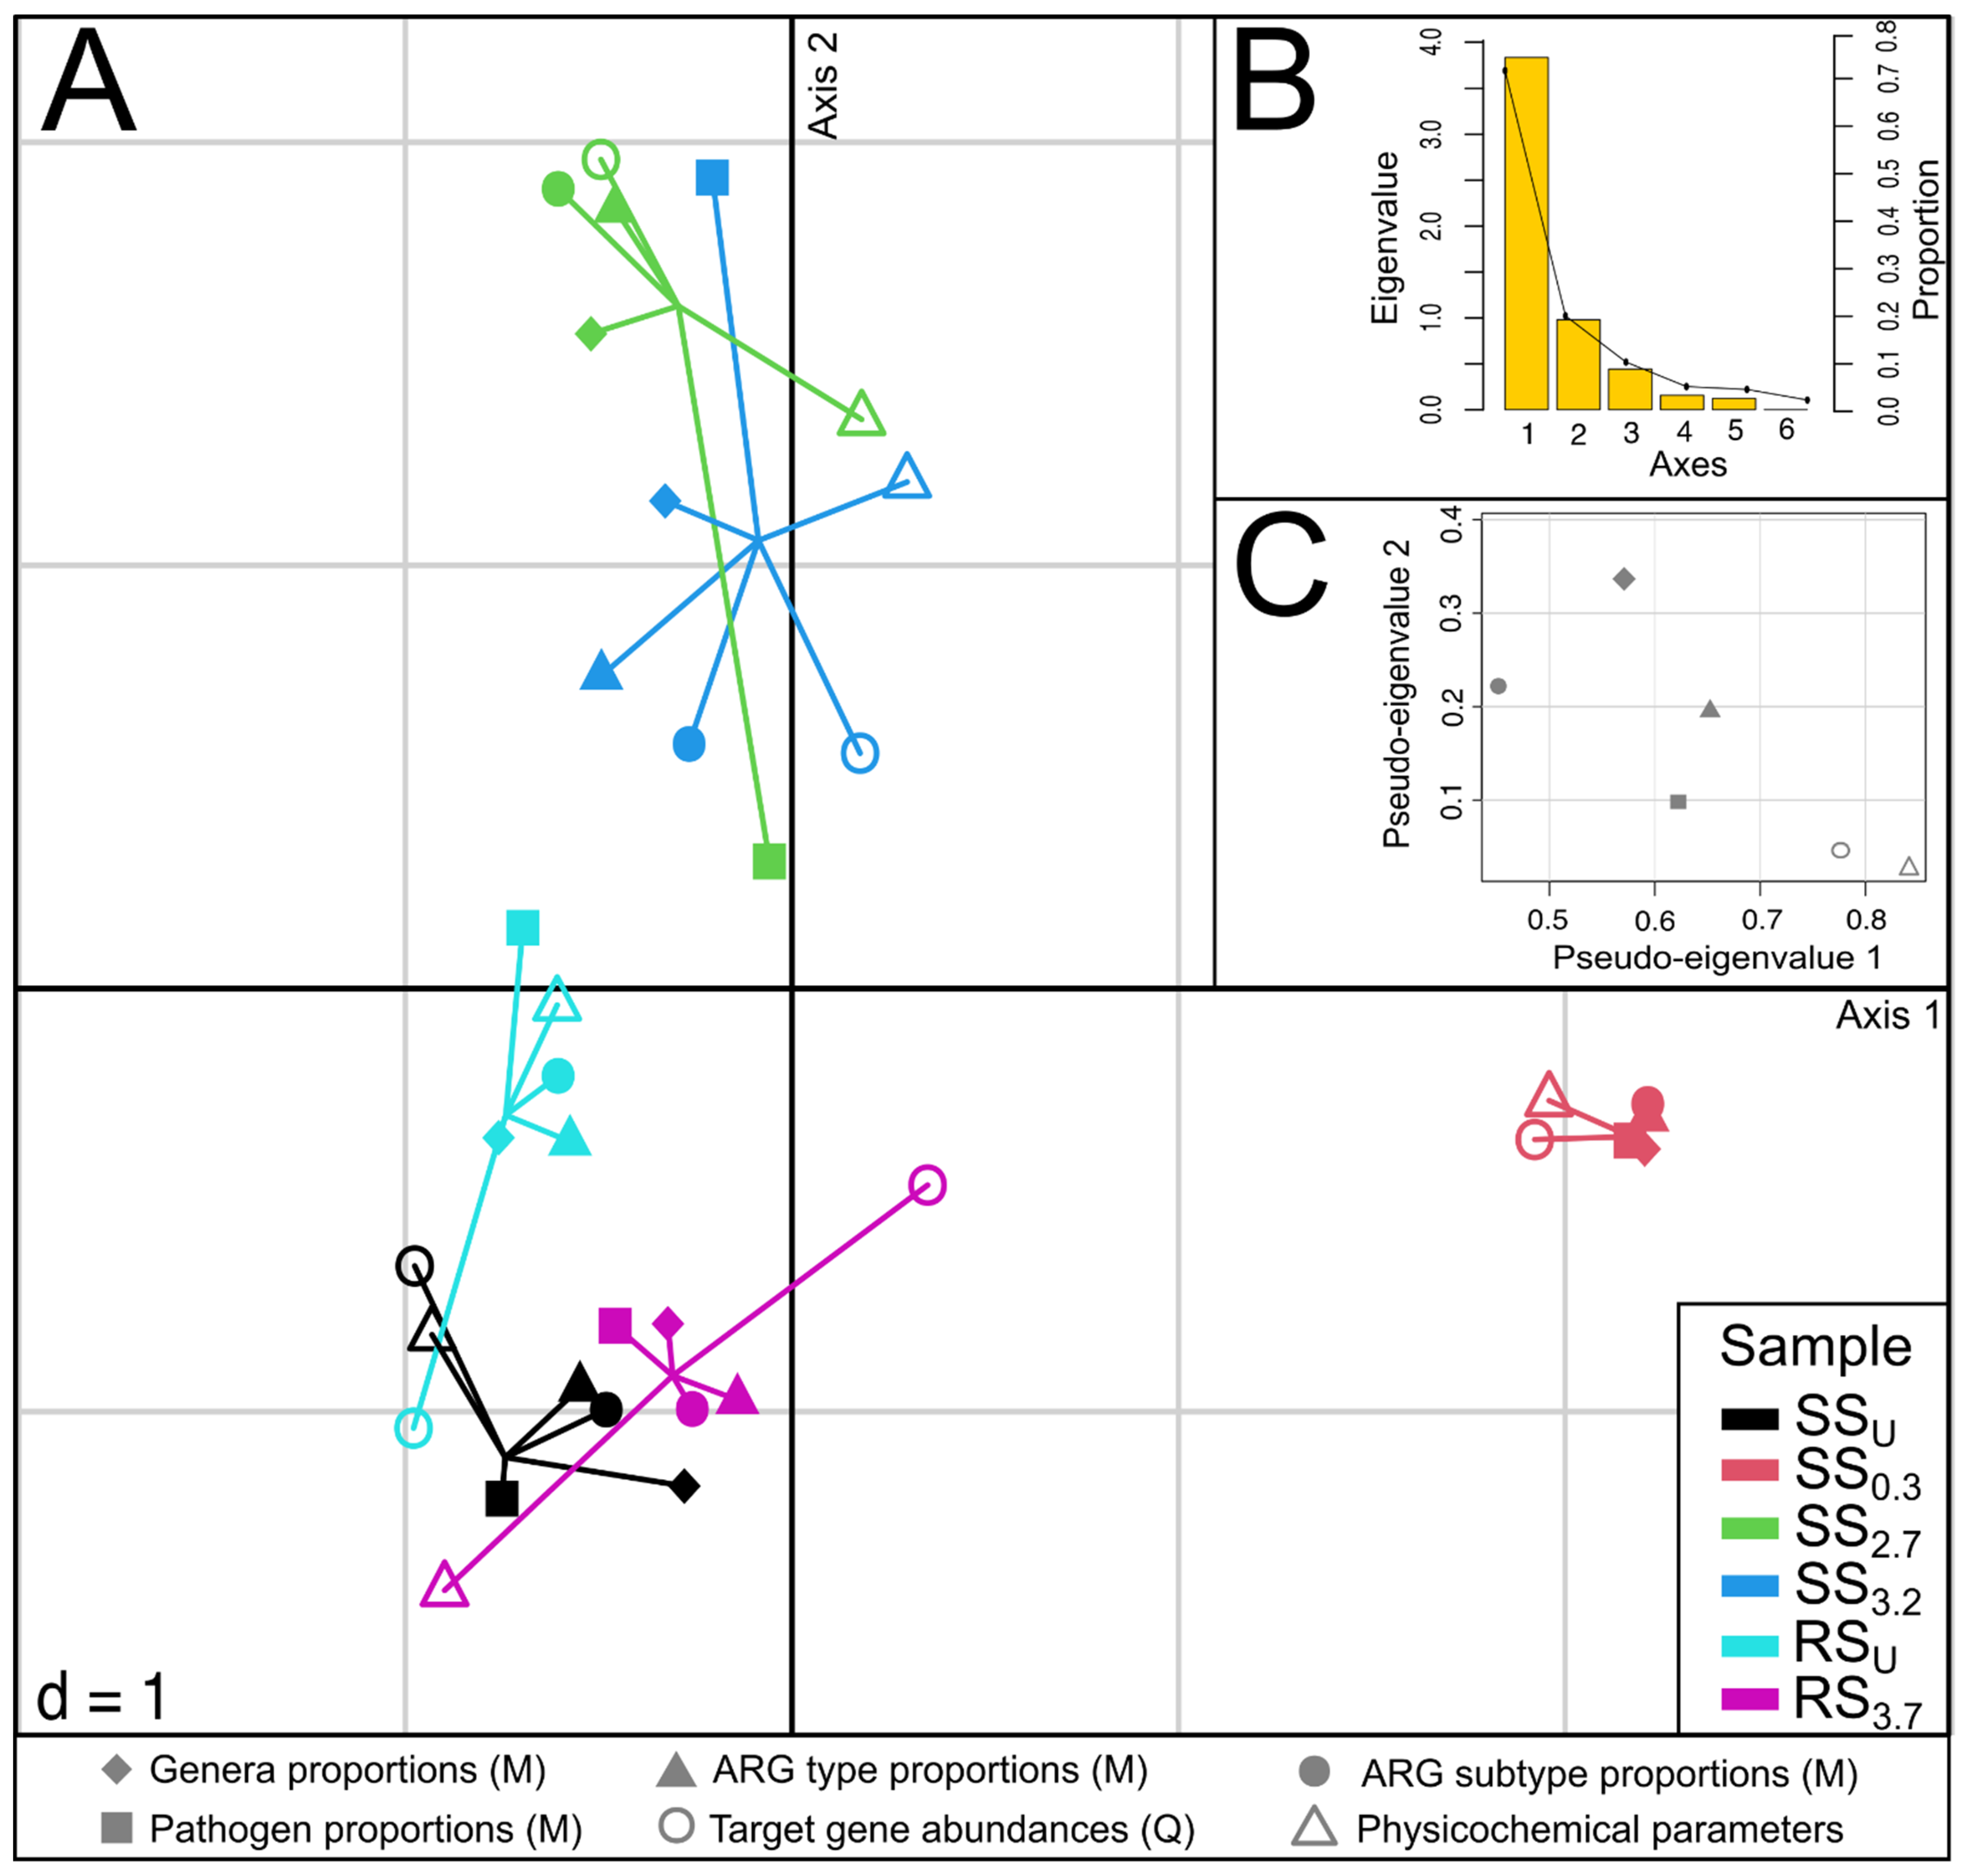
3.5. The Relationships between Community Composition, Resistome, Pathogens, and Physicochemical Parameters in Sediments
4. Discussion
4.1. The Characteristics of WWTP Effluent and Its Effect on the Physicochemical Conditions in the Water and Sediments of a Receiving Stream
4.2. The Effect of WWTP Effluent on Microbial Community Abundance and Structure in the Water and Sediments of a Stream and River
4.3. The Effect of WWTP Effluent on the Antibiotic Resistome in Water and Sediments of Stream and River
4.4. The Effect of WWTP Effluent on the Pathogenic Community of the Receiving Stream
4.5. Integration of Different Datasets for Assessing the Effect of WWTP Effluent on Sediment
5. Conclusions
Supplementary Materials
Author Contributions
Funding
Institutional Review Board Statement
Informed Consent Statement
Data Availability Statement
Acknowledgments
Conflicts of Interest
References
- Guitor, A.K.; Raphenya, A.R.; Klunk, J.; Kuch, M.; Alcock, B.; Surette, M.G.; McArthur, A.G.; Poinar, H.N.; Wright, G.D. Capturing the Resistome: A Targeted Capture Method to Reveal Antibiotic Resistance Determinants in Metagenomes. Antimicrob. Agents Chemother. 2019, 64, e01324-19. [Google Scholar] [CrossRef]
- Ventola, C.L. Antibiotic Resistance Crisis Part 1: Causes and Threats. Pharm. Ther. 2015, 40, 277–283. [Google Scholar]
- Antimicrobial Resistance. Tackling the Burden in the European Union. Available online: https://www.oecd.org/health/health-systems/AMR-Tackling-the-Burden-in-the-EU-OECD-ECDC-Briefing-Note-2019.pdf (accessed on 1 February 2021).
- No Time to Wait: Securing the Future from Drug Resistant Infections. Available online: https://www.who.int/docs/default-source/documents/no-time-to-wait-securing-the-future-from-drug-resistant-infections-en.pdf?sfvrsn=5b424d7_6 (accessed on 1 February 2021).
- Sengupta, S.; Chattopadhyay, M.K.; Grossart, H.P. The multifaceted roles of antibiotics and antibiotic resistance in nature. Front. Microbiol. 2013, 4, 47. [Google Scholar] [CrossRef] [PubMed]
- Osińska, A.; Korzeniewska, E.; Harnisz, M.; Felis, E.; Bajkacz, S.; Jachimowicz, P.; Niestępski, S.; Konopka, I. Small-scale wastewater treatment plants as a source of the dissemination of antibiotic resistance genes in the aquatic environment. J. Hazard. Mater. 2020, 381, 121221. [Google Scholar] [CrossRef]
- Almakki, A.; Jumas-Bilak, E.; Marchandin, H.; Licznar-Fajardo, P. Antibiotic resistance in urban runoff. Sci. Total Environ. 2019, 667, 64–76. [Google Scholar] [CrossRef]
- Fang, H.; Zhang, Q.; Nie, X.; Chen, B.; Xiao, Y.; Zhou, Q.; Liao, W.; Liang, X. Occurrence and elimination of antibiotic resistance genes in a long-term operation integrated surface flow constructed wetland. Chemosphere 2017, 173, 99–106. [Google Scholar] [CrossRef]
- Karkman, A.; Do, T.T.; Walsh, F.; Virta, M.P.J. Antibiotic resistance genes in waste water. Trends Microbiol. 2018, 26, 220–228. [Google Scholar] [CrossRef]
- Harnisz, M.; Kiedrzynska, E.; Kiedrzynska, M.; Korzeniewska, E.; Czatzkowska, M.; Koniuszewska, I.; Jozwik, A.; Szklarek, S.; Niestepski, S.; Zalewski, M. The impact of WWTP size and sampling season on the prevalence of antibiotic resistance genes in wastewater and the river system. Sci. Total Environ. 2020, 741, 140446. [Google Scholar] [CrossRef]
- Estonian Environmental Information, Wastewater Treatment. Available online: http://register.keskkonnainfo.ee/envreg/main?list=KOGA&mount=view (accessed on 1 February 2021).
- Berglund, B.; Fick, J.; Lindgren, P.-E. Urban wastewater effluent increases antibiotic resistance gene concentrations in a receiving Northern European river. Environ. Toxicol. Chem. 2015, 34, 192–196. [Google Scholar] [CrossRef]
- Proia, L.; von Schiller, D.; Sanchez-Melsio, A.; Sabater, S.; Borrego, C.M.; Rodriguez-Mozaz, S.; Balcazar, J.L. Occurrence and persistence of antibiotic resistance genes in river biofilms after wastewater inputs in small rivers. Environ. Pollut. 2016, 210, 121–128. [Google Scholar] [CrossRef]
- Brown, P.C.; Borowska, E.; Schwartz, T.; Horn, H. Impact of the particulate matter from wastewater discharge on the abundance of the antibiotic resistance genes and facultative pathogenic bacteria in downstream river sediments. Sci. Total Environ. 2019, 649, 1171–1178. [Google Scholar] [CrossRef]
- Price, J.R.; Ledford, S.H.; Ryan, M.O.; Toran, L.; Sales, C.M. Wastewater treatment plant effluent introduces recoverable shifts in microbial community composition in receiving streams. Sci. Total Environ. 2018, 613–614, 1104–1116. [Google Scholar] [CrossRef]
- Mansfeldt, C.; Deiner, K.; Mächler, E.; Fenner, K.; Eggen, R.I.L.; Stamm, C.; Schönenberger, U.; Walser, J.-C.; Altermatt, F. Microbial community shifts in streams receiving treated wastewater effluent. Sci. Total Environ. 2020, 709, 135727. [Google Scholar] [CrossRef]
- Ruijter, J.M.; Ramakers, C.; Hoogaars, W.M.H.; Karlen, Y.; Bakker, O.; van den Hoff, M.J.B.; Moorman, A.F.M. Amplification efficiency: Linking baseline and bias in the analysis of quantitative PCR data. Nucleic Acids Res. 2009, 37, e45. [Google Scholar] [CrossRef]
- Nõlvak, H.; Truu, M.; Kanger, K.; Tampere, M.; Espenberg, M.; Loit, E.; Raave, H.; Truu, J. Inorganic and organic fertilizers impact the abundance and proportion of antibiotic resistance and integron-integrase genes in agricultural grassland soil. Sci. Total Environ. 2016, 562, 678–689. [Google Scholar] [CrossRef]
- Andrews, S. FastQC: A Quality Control Tool for High Throughput Sequence Data. Available online: http://www.bioinformatics.babraham.ac.uk/projects/fastqc (accessed on 1 February 2021).
- Martin, M. Cutadapt removes adapter sequences from high-throughput sequencing reads. EMBnet J. 2011, 17, 10. [Google Scholar] [CrossRef]
- Rodriguez, L.M.; Gunturu, S.; Tiedje, J.M.; Cole, J.R.; Konstantinidis, K.T. Nonpareil 3: Fast estimation of metagenomic coverage and sequence diversity. mSystems 2018, 3, e00039. [Google Scholar] [CrossRef] [PubMed]
- Menzel, P.; Ng, K.L.; Krogh, A. Fast and sensitive taxonomic classification for metagenomics with Kaiju. Nat. Commun. 2016, 7, 11257. [Google Scholar] [CrossRef]
- Li, D.; Luo, R.; Liu, C.-M.; Leung, C.-M.; Ting, H.-F.; Sadakane, K.; Yamashita, H.; Lam, T.W. MEGAHIT W1.0: A fast and scalable metagenome assembler driven by advanced methodologies and community practices. Methods 2016, 102, 3–11. [Google Scholar] [CrossRef]
- Yin, X.; Jiang, X.-T.; Chai, B.; Li, L.; Yang, Y.; Cole, J.R.; Tiedje, J.M.; Zhang, T. ARGs-OAP W2.0 with an expanded SARG database ad Hidden Markov Models for enhancement characterization and quantification of antibiotic resistance genes in environmental metagenomes. Bioinformatics 2018, 34, 2263–2270. [Google Scholar] [CrossRef]
- Revelle, W. Psych: Procedures for Psychological, Psychometric, and Personality Research; R Package Version 2.0.12; Northwestern University: Evanston, IL, USA, 2020; Available online: https://CRAN.R-project.org/package=psych (accessed on 1 February 2021).
- Kolde, R. Pheatmap: Pretty Heatmaps. R Package Version 1.0.12. Available online: https://CRAN.R-project.org/package=pheatmap (accessed on 1 February 2021).
- Kassambara, A. Factoextra: Extract and Visualize the Results of Multivariate Data Analyses. R Package Version 1.0.7. Available online: https://CRAN.R-project.org/package=factoextra (accessed on 1 February 2021).
- Meng, C.; Kuster, B.; Culhane, A.C.; Gholami, A.M. A multivariate approach to the integration of multi-omics datasets. BMC Bioinform. 2014, 15, 162. [Google Scholar] [CrossRef] [PubMed]
- Naaber, P.; Mitt, P. The Use of Antibiotics in Estonia and its Effect on the Spread of Drug-resistant Microbials. In 20 Years of Estonian Statistics on Medicines; Republic of Estonia Agency of Medicines: Tartu, Estonia, 2015; pp. 57–63. [Google Scholar]
- Numberger, D.; Ganzert, L.; Zoccarato, L.; Mühldorfer, K.; Sauer, S.; Grossart, H.P.; Greenwood, A.D. Characterization of bacterial communities in wastewater with enhanced taxonomic resolution by full-length 16S rRNA sequencing. Sci. Rep. 2019, 9, 9673. [Google Scholar] [CrossRef] [PubMed]
- Gonzalez-Martinez, A.; Sihvonen, M.; Muñoz-Palazon, B.; Rodriguez-Sanchez, A.; Mikola, A.; Vahala, R. Microbial ecology of full-scale wastewater treatment systems in the Polar Arctic Circle: Archaea, Bacteria and Fungi. Sci. Rep. 2018, 8, 2208. [Google Scholar] [CrossRef]
- Vítězová, M.; Kohoutová, A.; Vítěz, T.; Hanišáková, N.; Kushkevych, I. Methanogenic microorganisms in industrial wastewater anaerobic treatment. Processes 2020, 8, 1546. [Google Scholar] [CrossRef]
- Proia, L.; Anzil, A.; Subirats, J.; Borrego, C.; Farrè, M.; Llorca, M.; Balcázar, J.L.; Servais, P. Antibiotic resistance along an urban river impacted by treated wastewaters. Sci. Total Environ. 2018, 628–629, 453–466. [Google Scholar] [CrossRef] [PubMed]
- Sabri, N.A.; Schmitt, H.; van der Zaan, B.; Gerritsen, H.W.; Zuidema, T.; Rijnaarts, H.H.M.; Langenhoff, A.A.M. Prevalence of antibiotics and antibiotic resistance genes in a wastewater effluent-receiving river in the Netherlands. J. Environ. Chem. Eng. 2020, 8, 102245. [Google Scholar] [CrossRef]
- Yu, K.; Li, P.; He, Y.; Zhang, B.; Chen, Y.; Yang, J. Unveiling dynamics of size-dependent antibiotic resistome associated with microbial communities in full-scale wastewater treatment plants. Water Res. 2020, 187, 116450. [Google Scholar] [CrossRef]
- Ibekwe, A.M.; Ma, J.; Murinda, S.E. Bacterial community composition and structure in an Urban River impacted by different pollutant sources. Sci. Total Environ. 2016, 566–567, 1176–1185. [Google Scholar] [CrossRef]
- Pascual-Benito, M.; Ballesté, E.; Monleón-Getino, T.; Urmeneta, J.; Blanch, A.R.; García-Aljaro, C.; Lucena, F. Impact of treated sewage effluent on the bacterial community composition in an intermittent mediterranean stream. Environ. Pollut. 2020, 266, 115254. [Google Scholar] [CrossRef]
- Neuenschwander, S.M.; Ghai, R.; Pernthaler, J.; Salcher, M.M. Microdiversification in genome-streamlined ubiquitous freshwater Actinobacteria. ISME J. 2018, 12, 185–198. [Google Scholar] [CrossRef]
- Yang, S.; Liebner, S.; Winkel, M.; Alawi, M.; Horn, F.; Dörfer, C.; Ollivier, J.; He, J.-S.; Jin, H.; Kühn, P.; et al. In-depth analysis of core methanogenic communities from high elevation permafrost-affected wetlands. Soil Biol. Biochem. 2017, 111, 66–77. [Google Scholar] [CrossRef]
- Angle, J.C.; Morin, T.H.; Solden, L.M.; Narrowe, A.B.; Smith, G.J.; Borton, M.A.; Rey-Sanchez, C.; Daly, R.A.; Mirfenderesgi, G.; Hoyt, D.W.; et al. Methanogenesis in oxygenated soils is a substantial fraction of wetland methane emissions. Nat. Commun. 2017, 8, 1567. [Google Scholar] [CrossRef] [PubMed]
- Corno, G.; Yang, Y.; Eckert, E.M.; Fontaneto, D.; Fiorentino, A.; Galafassi, S.; Zhang, T.; Di Cesare, A. Effluents of wastewater treatment plants promote the rapid stabilization of the antibiotic resistome in receiving freshwater bodies. Water Res. 2019, 158, 72–81. [Google Scholar] [CrossRef] [PubMed]
- Hu, A.; Wang, H.; Li, J.; Mulla, S.I.; Qiu, Q.; Tang, L.; Rashid, A.; Wu, Y.; Sun, Q.; Yu, C.P. Homogeneous selection drives antibiotic resistome in two adjacent sub-watersheds, China. J. Hazard. Mater. 2020, 398, 122820. [Google Scholar] [CrossRef] [PubMed]
- Jiang, H.; Zhou, R.; Zhang, M.; Cheng, Z.; Li, J.; Zhang, G.; Chen, B.; Zou, S.; Yang, Y. Exploring the differences of antibiotic resistance genes profiles between river surface water and sediments using metagenomic approach. Ecotoxicol. Environ. Saf. 2018, 161, 64–69. [Google Scholar] [CrossRef] [PubMed]
- Yang, S.; Wen, Q.; Chen, Z. Impacts of Cu and Zn on the performance, microbial community dynamics and resistance genes variations during mesophilic and thermophilic anaerobic digestion of swine manure. Bioresour. Technol. 2020, 312, 123554. [Google Scholar] [CrossRef] [PubMed]
- Anderson, M.T.; Mitchell, L.A.; Zhao, L.; Mobley, H.L.T. Citrobacter freundii fitness during bloodstream infection. Sci. Rep. 2018, 8, 11792. [Google Scholar] [CrossRef]
- Liu, L.; Chen, D.; Liu, L.; Lan, R.; Hao, S.; Jin, W.; Sun, H.; Wang, Y.; Liang, Y.; Xu, J. Genetic diversity, multidrug resistance, and virulence of citrobacter freundii from diarrheal patients and healthy individuals. Front. Cell. Infect. Microbiol. 2018, 8, 233. [Google Scholar] [CrossRef]
- Pascual-Benito, M.; Nadal-Sala, D.; Tobella, M.; Ballesté, E.; García-Aljaro, C.; Sabaté, S.; Sabater, F.; Martí, E.; Gracia, C.A.; Blanch, A.R.; et al. Modelling the seasonal impacts of a wastewater treatment plant on water quality in a Mediterranean stream using microbial indicators. J. Environ. Manag. 2020, 261, 110220. [Google Scholar] [CrossRef]
| Physicochemical Parameter | ||||||||||||
|---|---|---|---|---|---|---|---|---|---|---|---|---|
| Water Samples | ||||||||||||
| Sample | Temp. (°C) | O2 (mg/L) | pH | ORP (mV) | Ntot (mg/L) | NH4–N (mg/L) | NO3–N (mg/L) | Ptot (mg/L) | PO43−–P (mg/L) | SO42− (mg/L) | TOC (mg/L) | DOC (mg/L) |
| E | 18.0 | 6.4 | 7.55 | 90.5 | 4.6 | 1.42 | 3.09 | 2.70 | 2.600 | 71 | 17 | 13 |
| SWU | 8.7 | 7.7 | 7.78 | 61.0 | 1.5 | 0.03 | 0.91 | 0.049 | 0.024 | 12 | 10.3 | 10.1 |
| SW0.3 | 9.8 | 6.8 | 7.75 | 85.8 | 2.0 | 0.16 | 1.33 | 0.54 | 0.310 | 21 | 10.5 | 10.3 |
| SW2.7 | 6.6 | 11.7 | 7.88 | 88.4 | 2.6 | 0.10 | 2.34 | 0.18 | 0.160 | 26 | 7.8 | 7.6 |
| SW3.2 | 6.4 | 11.6 | 7.86 | 88.1 | 2.6 | 0.07 | 2.55 | 0.18 | 0.150 | 24 | 7.3 | 7.2 |
| RWU | 8.6 | 9.4 | 7.89 | 91.1 | 1.1 | 0.03 | 0.68 | 0.02 | 0.008 | 11 | 5.4 | 5.3 |
| RW3.7 | 7.8 | 9.6 | 7.88 | 92.4 | 1.2 | 0.03 | 0.65 | 0.03 | 0.018 | 15 | 5.6 | 5.5 |
| Sediment Samples | ||||||||||||
| Sample | pH | Ntot (mg/kg dw) | Ptot (mg/kg dw) | TOC (%) | ||||||||
| SSU | 7.4 | 4100 | 950 | 6.8 | ||||||||
| SS0.3 | 6.8 | 16,600 | 8400 | 17.0 | ||||||||
| SS2.7 | 8.1 | 210 | 270 | <1.0 | ||||||||
| SS3.2 | 7.5 | 1300 | 810 | 3.2 | ||||||||
| RSU | 7.7 | 2300 | 480 | 4.2 | ||||||||
| RS3.7 | 7.4 | 7100 | 2200 | 9.7 | ||||||||
| Target Gene | Physicochemical Parameter | ||||||||
|---|---|---|---|---|---|---|---|---|---|
| Water | Sediment | ||||||||
| Temp. | O2 | Ntot | NH4–N | NO3–N | Ptot | PO43−–P | pH | Ptot | |
| A | |||||||||
| B16S | 0.86 * | 0.95 ** | 0.87 * | −0.83 * | |||||
| A16S | 0.95 ** | 0.99 *** | 0.93 ** | −0.83 * | |||||
| aadA | 0.88 * | ||||||||
| blaCTX-M | 0.90 * | 0.97 ** | |||||||
| sul2 | 0.92 * | 0.95 * | 0.90 * | ||||||
| B | |||||||||
| B16S | −0.96 ** | −0.93 ** | −0.91 * | −0.83 * | |||||
| A16S | 0.96 ** | 0.93** | 0.91 * | 0.83 * | |||||
| aadA | 0.93 * | ||||||||
| blaCTX-M | 0.96 * | 0.98 ** | 0.90 * | ||||||
| sul1 | 0.96 ** | ||||||||
| tetW | 0.93 * | −0.89 * | |||||||
Publisher’s Note: MDPI stays neutral with regard to jurisdictional claims in published maps and institutional affiliations. |
© 2021 by the authors. Licensee MDPI, Basel, Switzerland. This article is an open access article distributed under the terms and conditions of the Creative Commons Attribution (CC BY) license (http://creativecommons.org/licenses/by/4.0/).
Share and Cite
Tiirik, K.; Nõlvak, H.; Truu, M.; Peeb, A.; Kõiv-Vainik, M.; Truu, J. The Effect of the Effluent from a Small-Scale Conventional Wastewater Treatment Plant Treating Municipal Wastewater on the Composition and Abundance of the Microbial Community, Antibiotic Resistome, and Pathogens in the Sediment and Water of a Receiving Stream. Water 2021, 13, 865. https://doi.org/10.3390/w13060865
Tiirik K, Nõlvak H, Truu M, Peeb A, Kõiv-Vainik M, Truu J. The Effect of the Effluent from a Small-Scale Conventional Wastewater Treatment Plant Treating Municipal Wastewater on the Composition and Abundance of the Microbial Community, Antibiotic Resistome, and Pathogens in the Sediment and Water of a Receiving Stream. Water. 2021; 13(6):865. https://doi.org/10.3390/w13060865
Chicago/Turabian StyleTiirik, Kertu, Hiie Nõlvak, Marika Truu, Angela Peeb, Margit Kõiv-Vainik, and Jaak Truu. 2021. "The Effect of the Effluent from a Small-Scale Conventional Wastewater Treatment Plant Treating Municipal Wastewater on the Composition and Abundance of the Microbial Community, Antibiotic Resistome, and Pathogens in the Sediment and Water of a Receiving Stream" Water 13, no. 6: 865. https://doi.org/10.3390/w13060865
APA StyleTiirik, K., Nõlvak, H., Truu, M., Peeb, A., Kõiv-Vainik, M., & Truu, J. (2021). The Effect of the Effluent from a Small-Scale Conventional Wastewater Treatment Plant Treating Municipal Wastewater on the Composition and Abundance of the Microbial Community, Antibiotic Resistome, and Pathogens in the Sediment and Water of a Receiving Stream. Water, 13(6), 865. https://doi.org/10.3390/w13060865


