Article

Modelling Microplastics in the River Thames: Sources, Sinks and Policy Implications

by
Paul G. Whitehead
1,*,
Gianbattista Bussi
1,
Jocelyne M. R. Hughes
1,
Ana T. Castro-Castellon
2,
Magnus D. Norling
3,
Elizabeth S. Jeffers
4,
Cordelia P. N. Rampley
5,
Daniel S. Read
6 and
Alice A. Horton
7
1
School of Geography and the Environment, University of Oxford, Oxford OX1 3QY, UK
2
Newton Campus, School of Science, Bath Spa University, Bath BA2 9BN, UK
3
Norwegian Institute for Water Research, Gaustadalléen 21, 0349 Oslo, Norway
4
Department of Zoology, University of Oxford, Oxford OX1 3SZ, UK
5
Oxford Molecular Biosensors, Centre for Innovation and Enterprise, Begbroke Science Park, Oxford OX5 1PF, UK
6
UK Centre for Ecology & Hydrology (UKCEH), Maclean Building, Wallingford, Oxfordshire OX10 8BB, UK
7
National Oceanography Centre, European Way, Southampton SO14 3ZH, UK
*
Author to whom correspondence should be addressed.
Water 2021, 13(6), 861; https://doi.org/10.3390/w13060861
Submission received: 18 February 2021 / Revised: 13 March 2021 / Accepted: 16 March 2021 / Published: 22 March 2021

Abstract

:
With widespread, long-term historical use of plastics and the presence of microplastics in a range of new and existing products, there is rising concern about their potential impacts on freshwater ecosystems. Understanding how microplastics are transported and distributed along river systems is key to assessing impacts. Modelling the main flow dynamics, mixing, sedimentation and resuspension processes is essential for an understanding of the transport processes. We use the new, processed based, dynamic, integrated catchments (INCA) microplastics model and apply this to the whole of the freshwater catchment of the River Thames, UK, to evaluate inputs, loads and concentrations along the river system. Recent data from UK water industry studies on microplastics in effluent discharges and sewage sludge disposal has been utilised to drive the INCA microplastics model. Predicted concentrations and microplastic loads moving along the river system are shown to be significant, with a build-up of concentrations along the river, with increasing deposition on the riverbed. The potential impacts on aquatic ecosystems are evaluated and a review of policy implications is explored.

1. Introduction

Microplastics have long been recognised as a serious problem impacting the land and the marine environments [1], but there has been little analysis of microplastics transport and distribution along river systems, sources into rivers, and interactions of microplastics with aquatic ecosystems. Environmental plastics are a heterogeneous group of materials that can be characterized by various descriptors. In the literature, they are frequently categorised according to size, shape, polymer type and colour. Microplastics can also be categorized according to their origin: primary microplastics are produced as resin pellets (raw materials for plastic products) or as additives for personal care products (e.g., shower gels and cosmetic peelings); and secondary microplastics are degradation products of larger plastic items, which are broken down by UV radiation, biological degradation and physical abrasion to smaller fragments. This latter category includes fragments of litter and fibres shed from textiles and fishing gear. Microplastic shape can be categorized into fragments (heterogeneous, angular), pellets (cylinders, disks, spherules), fibres (filaments), films and foams. The categorization of microplastics into polymer type is dependent on spectroscopy and thermo-analytical methods. In concordance with global production rates, high- and low-density polyethylene (HD/LD-PE), polyethylene terephthalate (PET), polypropylene (PP), polystyrene (PS) and polyvinyl chloride (PVC) are the most common polymers found in the environment [2,3].
Microplastics are an emerging environmental contaminant of concern due to their abundance and persistence throughout the environment [4]. Microplastics can enter rivers via runoff and drainage systems, land disposal, effluent inputs and sewage sludge from wastewater treatment works and from the breakdown of in situ plastic litter. Air deposition of microplastics is also significant [5]. Once released into the environment, microplastics are practically impossible to remove and will remain indefinitely. Particles transported in the environment can be further broken down into microplastic fragments, spread over a wider area, thereby increasing the risk of exposure to organisms.
Microplastics (defined here as particles smaller than 5 mm) can be ingested throughout the food web more readily than larger particles. Environmental scientists started investigating marine microplastics in the early 2000s [6]. Two decades later, a wealth of studies demonstrate that microplastics have ubiquitously permeated the marine ecosystem, including polar regions and the deep-sea realm. Microplastics ingestion has been documented for an increasing number of marine species, but to date only a few studies have investigated their prevalence and biological effects in freshwater ecosystems.
The presence of microplastics in freshwaters has gained global attention since 2018 [7,8] and, in the UK, several publications have focused on rivers, catchments, lakes and sediments. Microplastics can enter rivers via point and non-point sources of pollution in similar pathways to pesticides and fertilizers [9,10,11]. Point sources of microplastics pollution are effluent discharges and inputs from urban drainage systems [12]; non-point sources include runoff from arable land, and breakdown of in situ plastic litter [4,13]. Atmospheric deposition of fibres can be an important source of microplastics in waterbodies as found by Turner et al. (2019) [14] in the sediment of an urban lake in London which was isolated from wastewater inputs. Recently, Brahney et al. (2020) [15] showed global, regional and local transport of microplastics in the atmosphere with different rates of deposition with dry deposition representing 75% of total atmospheric deposition.
Only a few studies have provided evidence of the presence of microplastics in UK rivers and lakes [14,16]. The research of Horton et al., 2017 [13,17] has yielded data on microplastics in sediments and recently a study by UK Water Industry Research (UKWIR) [18,19] has provided data on waste water samples including influents, treated effluents, sludge from sewage treatment and raw (river or ground) water [18]. Data on the biological effects of microplastics in freshwater species is lacking and the accumulation of other freshwater contaminants on microplastics is of special interest because ingestion might increase chemical exposure. However, in order to assess the environmental risk associated with microplastics, comprehensive data on their abundance, fate, sources, and biological effects in freshwater ecosystems are needed [17]. Whilst research in this field is growing, there is no standard methodology for measuring microplastics in environmental samples. The lack of standardisation between measurement approaches precludes comparison across studies and, thus, impedes attempts to determine the current extent of microplastics pollution across catchments and evaluate the impacts on freshwater ecosystems [19]. Establishing standardisation of data critically depends on a collaborative effort by environmental scientists from diverse disciplines, e.g., chemistry, hydrology, fisheries, ecotoxicology and modelling [20,21].
Mathematical models can be used to assess the transport processes of microplastics in rivers and catchments. Process-based dynamic models can be useful in quantifying fluxes and concentrations along river systems, the storage of microplastics in riverbed sediments, and fluxes into estuaries and marine ecosystems. In this paper we make use of the INCA microplastics model [22] and we apply the model to the whole River Thames catchment. We consider fluxes of microplastics along the river under changing effluent discharges and different land applications of sludge. Thus, the aim of this paper is to (1) gain an understanding of microplastics pathways and transport in river systems; (2) apply a process-based model to the River Thames and evaluate the impacts of microplastics on river water quality from effluent discharges and sewage sludge applications to agricultural land; (3) determine the fluxes of microplastics moving down the river system; (4) examine effective microplastics mitigation strategies; and (5) review UK policy and regulation instruments. There are lessons to be learnt from using a case study approach, the results of which can be applied to different catchments, regions and countries, as in the case of other extensive INCA applications globally [20].

2. Methods

2.1. Measuring Microplastics in Rivers

Nets with different mesh sizes are generally used for sampling plastics in river systems, but there is no standardised procedure for measuring and quantifying microplastics. A call for standardization of microplastics particle size in research was made by Frias and Nash (2019) [23] and their call was echoed by a number of researchers who have argued that standardization is required for sampling, processing and quantification of microplastics [24,25]. Koelmans et al. (2019) [24] consider the limitation of mesh size used for sampling and reporting microplastics sizes. For example, the most common net mesh size used for microplastics research is 300–330 µm [4,12,17,25] omitting microplastics size below 300 µm which may be under-represented. The continued use of this mesh size may be attributed to availability and researcher habit, but there are, however, commercial plankton net mesh sizes available for a broad size range (1–2000 µm), e.g., Duncan and associates in the UK provide 10–1000 µm mesh sizes (http://www.duncanandassociates.co.uk, accessed 15 May 2020); while 1–2000 µm is the size range from KC Denmark (http://www.kc-denmark.dk/products/plankton-nets.aspx accessed 15 May 2020).
The UKWIR study [18,19] overcame this limitation by developing a standardised approach to obtain repeated samples (down to 10 μm) in time and space. Samples were processed consistently to maximise representation of microplastics while minimising losses and were measured with an automated imaging Fourier transform infrared (FTIR) spectroscopy system. Samples were concentrated onto a filter, which was loaded onto the mechanical stage of the imaging FTIR. Infrared spectra were measured at each 25 μm point along the filter to produce a chemical map of 160,000 spectra. Image analysis software matches each of the sample spectra to a reference library of known polymers, and then an algorithm quantifies the size and shape of each of the target microplastics [19]. The combination of spectroscopy and imaging analysis offers great potential for monitoring microplastics due to the relatively low per-sample cost compared to more intensive methods such as gas chromatography- mass spectrometry. This FTIR method, along with Raman spectroscopy, can measure microplastics particles down to 6 and 1 μm, respectively, although computational costs and running time increase significantly at these lower resolutions. To capture these smallest microplastics particles, an alternative approach may be needed that uses image analysis to target likely particles for spectral analysis, thus greatly reducing the number of spectra collected in each sample, although at a cost of potentially missing some particles [26]
For the application of the INCA model of microplastics distribution in the River Thames catchment, we selected four classes of microplastics sizes based on their reported frequency from reviewed literature and we utilized the Ball et al. (2020) [18] UKWIR study as a key dataset for rivers in the UK and in particular, the River Thames.

2.2. Application of INCA Microplastics Model to the River Thames—Model Structure

The INCA model is a process-based model which simulates the main processes related to rainfall-runoff transformation and the cycle and fate of several compounds, such as nitrate, ammonium and phosphorus. Several publications can be found in the literature, regarding both the model conceptualisation and the model application. The main papers describing the model structure are Whitehead et al. (1998) [27], who presented the INCA-N model structure and modelling philosophy, Wade et al. (2002a) [28], who described some modifications to the INCA-N structure, Wade et al. (2002b) [29], who presented the INCA-P model structure, and Lázár et al. (2010) [30], who described the INCA-Sediment model structure. The INCA microplastics model was first presented by Nizzetto et al. (2016) [22] as an extension of the INCA-Sediment model adapted for the assessment of microplastics, and applied to the River Thames.
The hydrological and water quality sub-models of INCA have been applied to several basins across the UK and Europe, and, in particular, to the River Thames catchment [31,32,33,34,35,36,37,38]. INCA is a semi-distributed process-based model which simulates the transformation of rainfall into runoff and the propagation of water through a river network [28]. Its inputs are daily time series of precipitation, temperature, hydrologically-effective rainfall and soil moisture deficit. The latter two are estimated using another semi-distributed hydrological model, called PERSiST [39]. PERSiST is a semi-distributed catchment-scale rainfall-runoff model which is specifically designed to provide input series for the INCA family of models. It is based on a user-specified number of linear reservoirs which can be used to represent different hydrological processes, such as snow melt, direct runoff generation, soil storage, aquifer storage and stream network movement. The description of its application to the River Thames can be found in Futter et al. (2014) [39].
The sediment transport module uses direct runoff fluxes and predicted stream flow regimes to calculate entrainment and depositions of particles from/to bed sediments. This module can be used to simulate the transport of natural particles (soil particles and suspended sediments) as well as the transport of artificial particles (such as microplastics). In addition, direct effluent inputs can be arbitrarily postulated in multiple locations throughout a river network to simulate emission of particles directly to the stream or sediment bed. This for example can be used to set direct inputs of microplastics to the river (e.g., from WWTP effluents).
The sediment particle classes used in this study are clay (0–2 μm), silt (2–60 μm), fine sand (60–200 μm), medium sand (200–600 μm) and coarse sand (600–2000 μm). However, in the case of the microplastics, no microplastics particles above 1000 μm were measured [18], and so the MP particle classes used in this study were limited to four class size ranges, namely MP1 (1–5 μm), MP2 (5–100 μm), MP3 (100–350 μm) and MP4 (350–1000 μm).

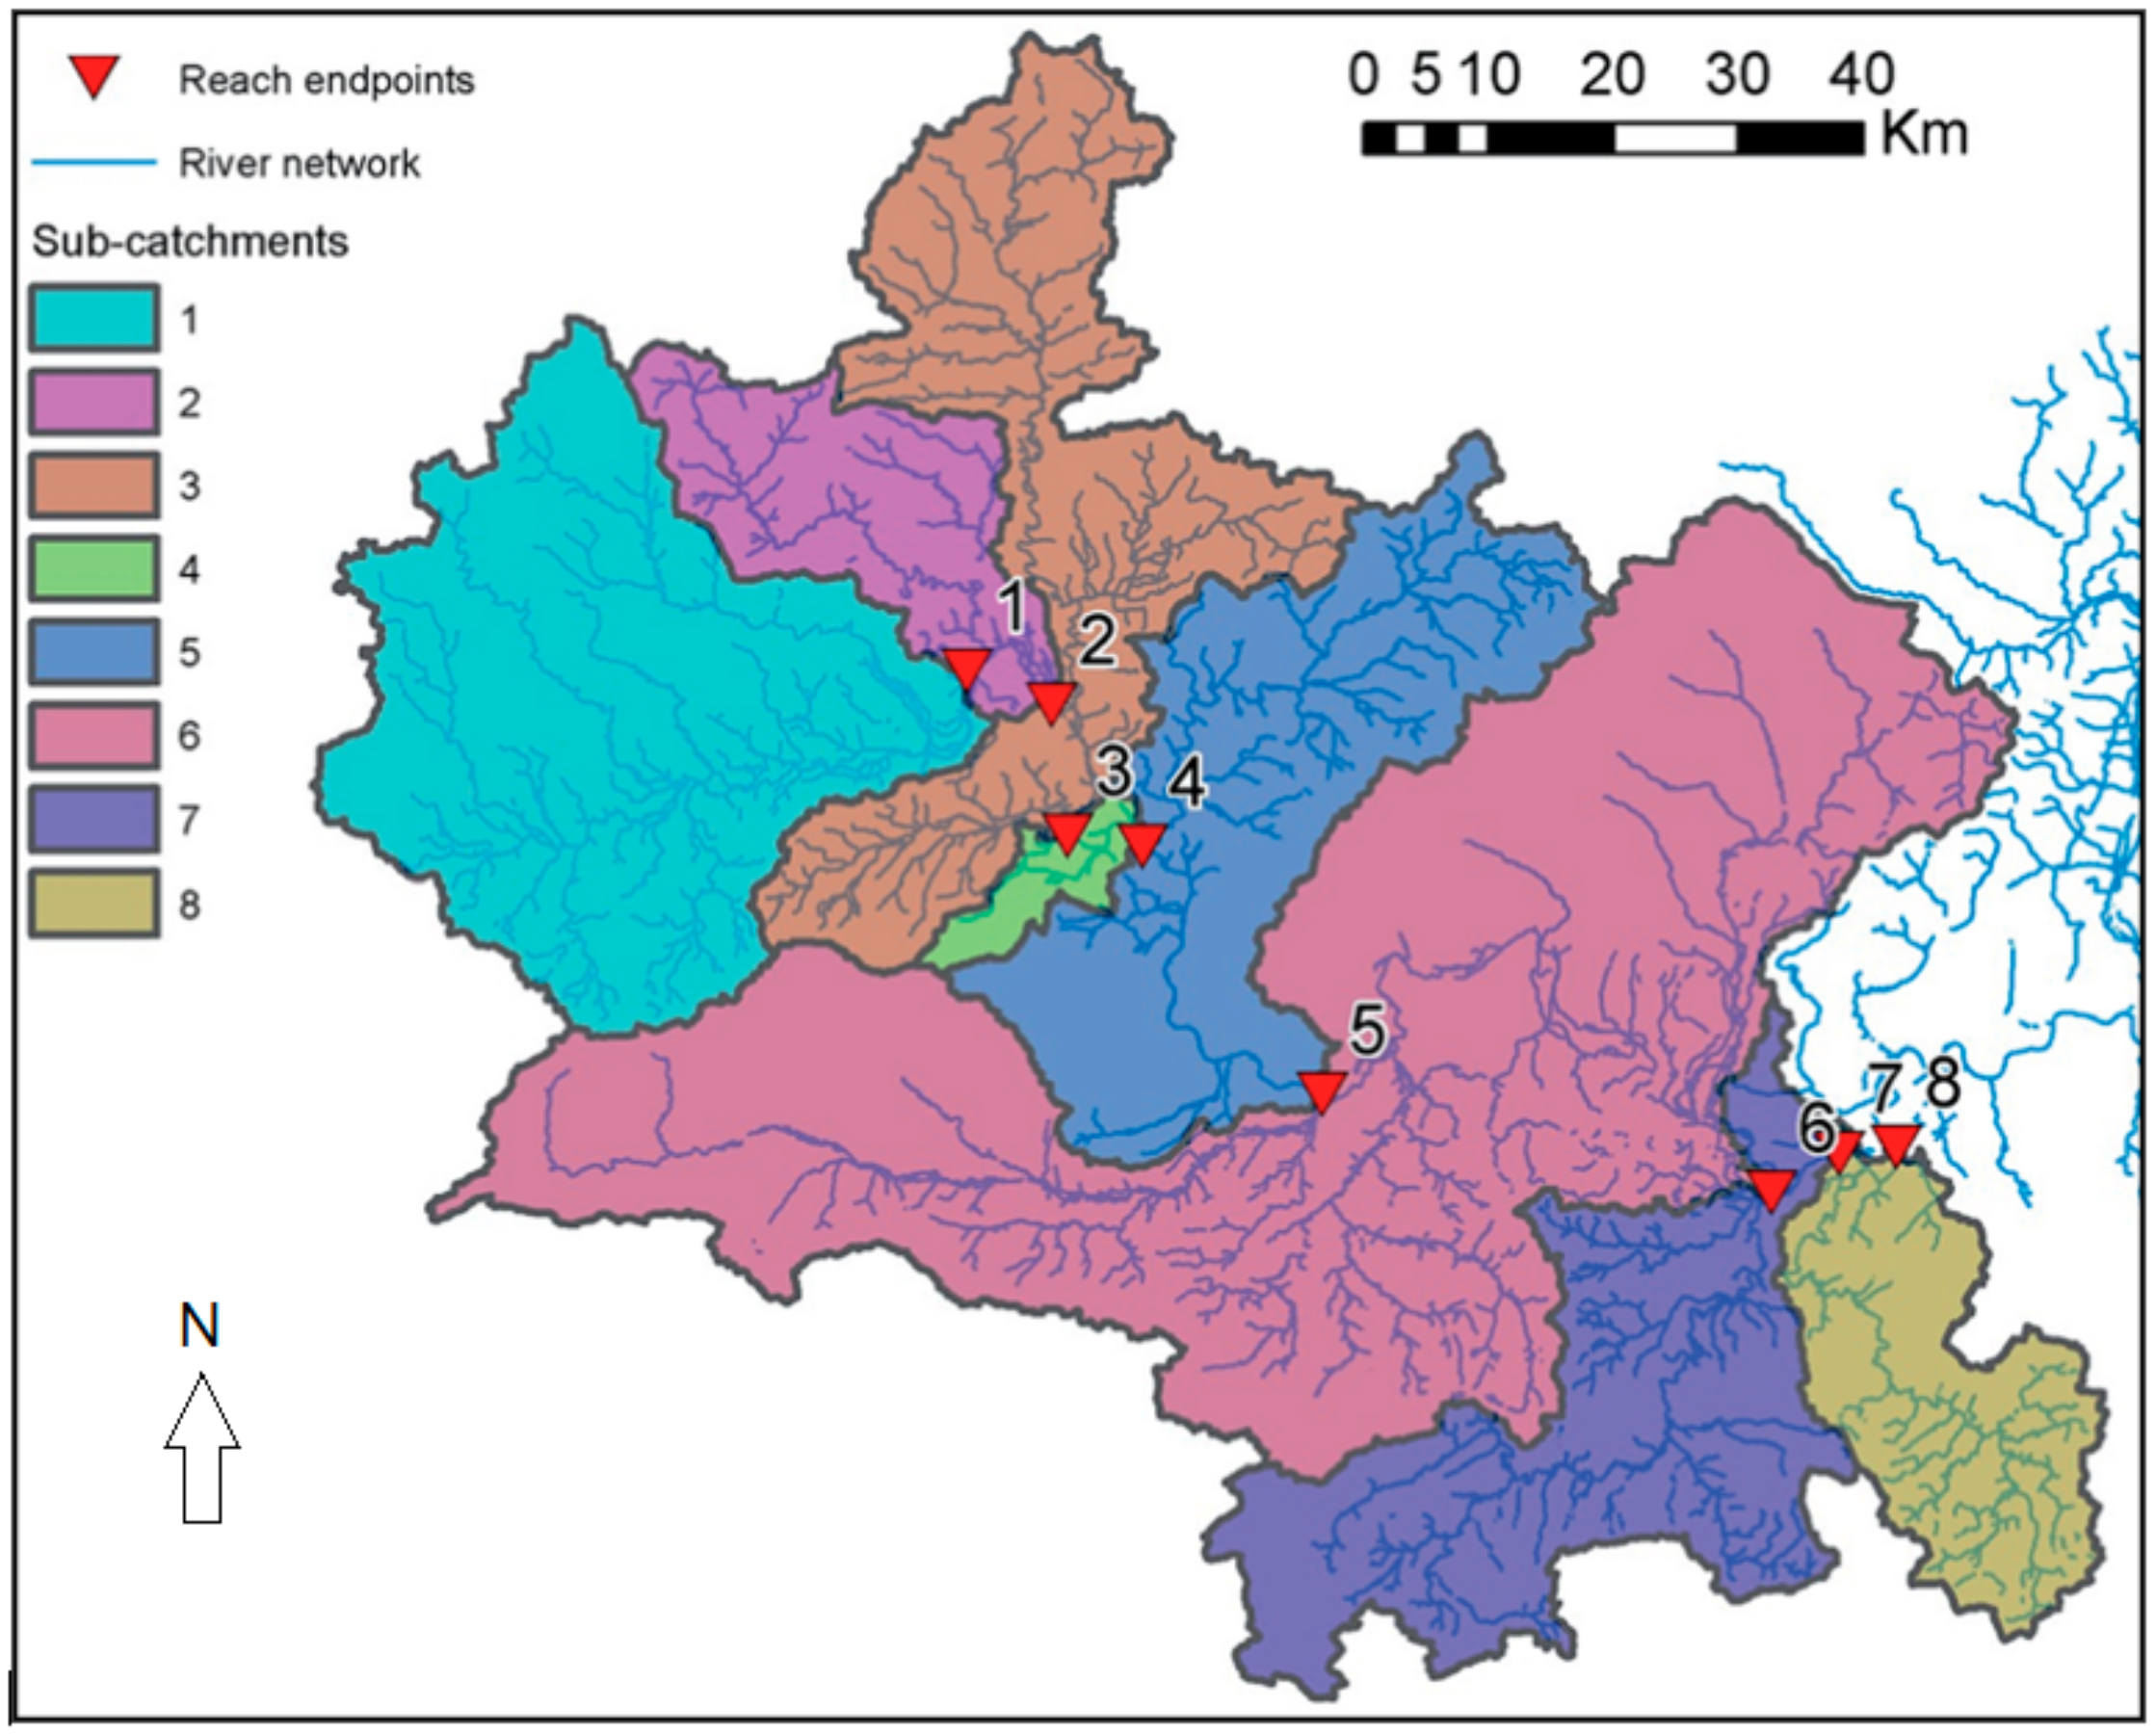
2.3. Thames Case Study

The Thames is the longest river in England at 212 km in length, rising in Cricklade near Cirencester and flowing down to London and on to the North Sea. The river passes through an urbanised area in the UK, including cities such as Swindon, Oxford, Reading and Greater London. The Thames is also the main source of water for many of the cities along its path, including Oxford and London, where over two thirds of London’s water supply is abstracted from the Thames. Thus, it is a crucial source of water for South East England. The river also has extensive monitoring networks managed by the UK Environment Agency for both for flows and water quality with water quality data going back to the 1930s [40] and flows going back to the 1870s. Average flows are around 29.8 m3/s at Days Weir and up to 65.8 m3/s at its tidal limit at Teddington Weir at Kingston. The River Thames is also highly valued for its ecology with extensive fisheries and it is also used for recreational use such as canoeing, boating, etc. Thus, the Thames is an ideal catchment with which to model and evaluate impacts of microplastics.
The River Thames and its tributaries drain a catchment area of approximately 10,000 km2 (non-tidal part) in Southern England, with both permeable and impermeable geologies. Land cover is characterised by significant areas of arable agriculture and pasture in the upper parts of the catchment, while significant forest areas are found throughout. Total population in the catchment approaches 10 million. The model was set up by dividing the River Thames into 8 reaches, as shown in Table 1, and their respective sub-catchments, from the source of the River Thames at Cricklade to its tidal limit at Teddington Weir, Kingston (Figure 1). This setup has been used in many previous applications of INCA-type models to simulate transport of contaminants, sediments and pathogens. Thus, the simulations presented here finish at the most downstream freshwater point at Teddington Weir, and do not include the tidal sections. However, the model does provide concentration time series and fluxes flowing over Teddington weir and, hence, the loads being transported into the tidal and estuarine system. In this study we have used datasets for the period 2008–2018 inclusive and simulations are presented covering this time period.

3. Results

3.1. Driving Climate and Spatial Data

The INCA model requires daily precipitation and mean daily temperature series as a time series daily driver for the model hydrology. Given the topography of the catchment, with steep upper reach slopes and a relatively large difference in altitude from the uplands to the lowlands, and the natural spatial variability of rainfall, a single station cannot provide exhaustive information about the precipitation falling on the catchment. For this reason, the average precipitation, minimum and maximum temperature falling on the catchment was determined, using information from several active rain gauges located within the catchment. The mean temperature was calculated as the average between minimum and maximum temperature. The Met Office station meteorological information can be found in the British Atmospheric Data Centre. The average daily rainfall and temperature series were computed by creating a gridded dataset of daily precipitation and temperature data on a 5 × 5 km, based on the available station data and using the Thiessen polygons method.
Spatially distributed information is needed to estimate some of the INCA model parameters. The Ordnance Survey (OS) Terrain 50 m Map was used as a digital elevation model. The digital elevation model was used to define the sub-catchment boundaries, to calculate the area of the sub-catchments and to compute mean sub-catchment and reach slope. The Land Cover Map 2007 (LCM2007), released by the Centre of Ecology and Hydrology (CEH) in 2011, was used to characterise the land uses in the catchment (https://www.ceh.ac.uk/services/land-cover-map-2007 accessed 12 November 2019).
Observations of flows, sediment fluxes and microplastics fluxes are required to adjust the INCA model parameters to correctly reproduce the natural system (i.e., for calibration and validation purposes). Daily flow data are available at several stations along the River Thames, provided by the National River Flow Archive (NRFA). Suspended sediment concentration measurements were available from the UK Environment Agency at several points along the River Thames and these measurements, together with the corresponding flow measurements for the same days of sampling, were used to estimate the daily observed sediment flux.
Measurements of MP abundance in wastewater effluent and wastewater sludges were obtained from the UK Water Industry Research (UKWIR) [18] together with estimates of microplastics abundance and size distributions in British rivers. Microplastics concentration data in wastewater effluents were combined with the wastewater flows for all the main STWs along the Thames to create a mass discharge rate of microplastics into the river system. In addition, the UKWIR study evaluated microplastics in agricultural sludge applications to land and found that microplastics in sewage sludges vary between 500 and 4000 particles per gram. The average application rate of sludges in agricultural areas is 10 kg/ha/year [41]. In the INCA model the sludge applications are applied to agricultural land and erosion and transport equations are used to flush and transport the microplastics from the land surface into the river system.

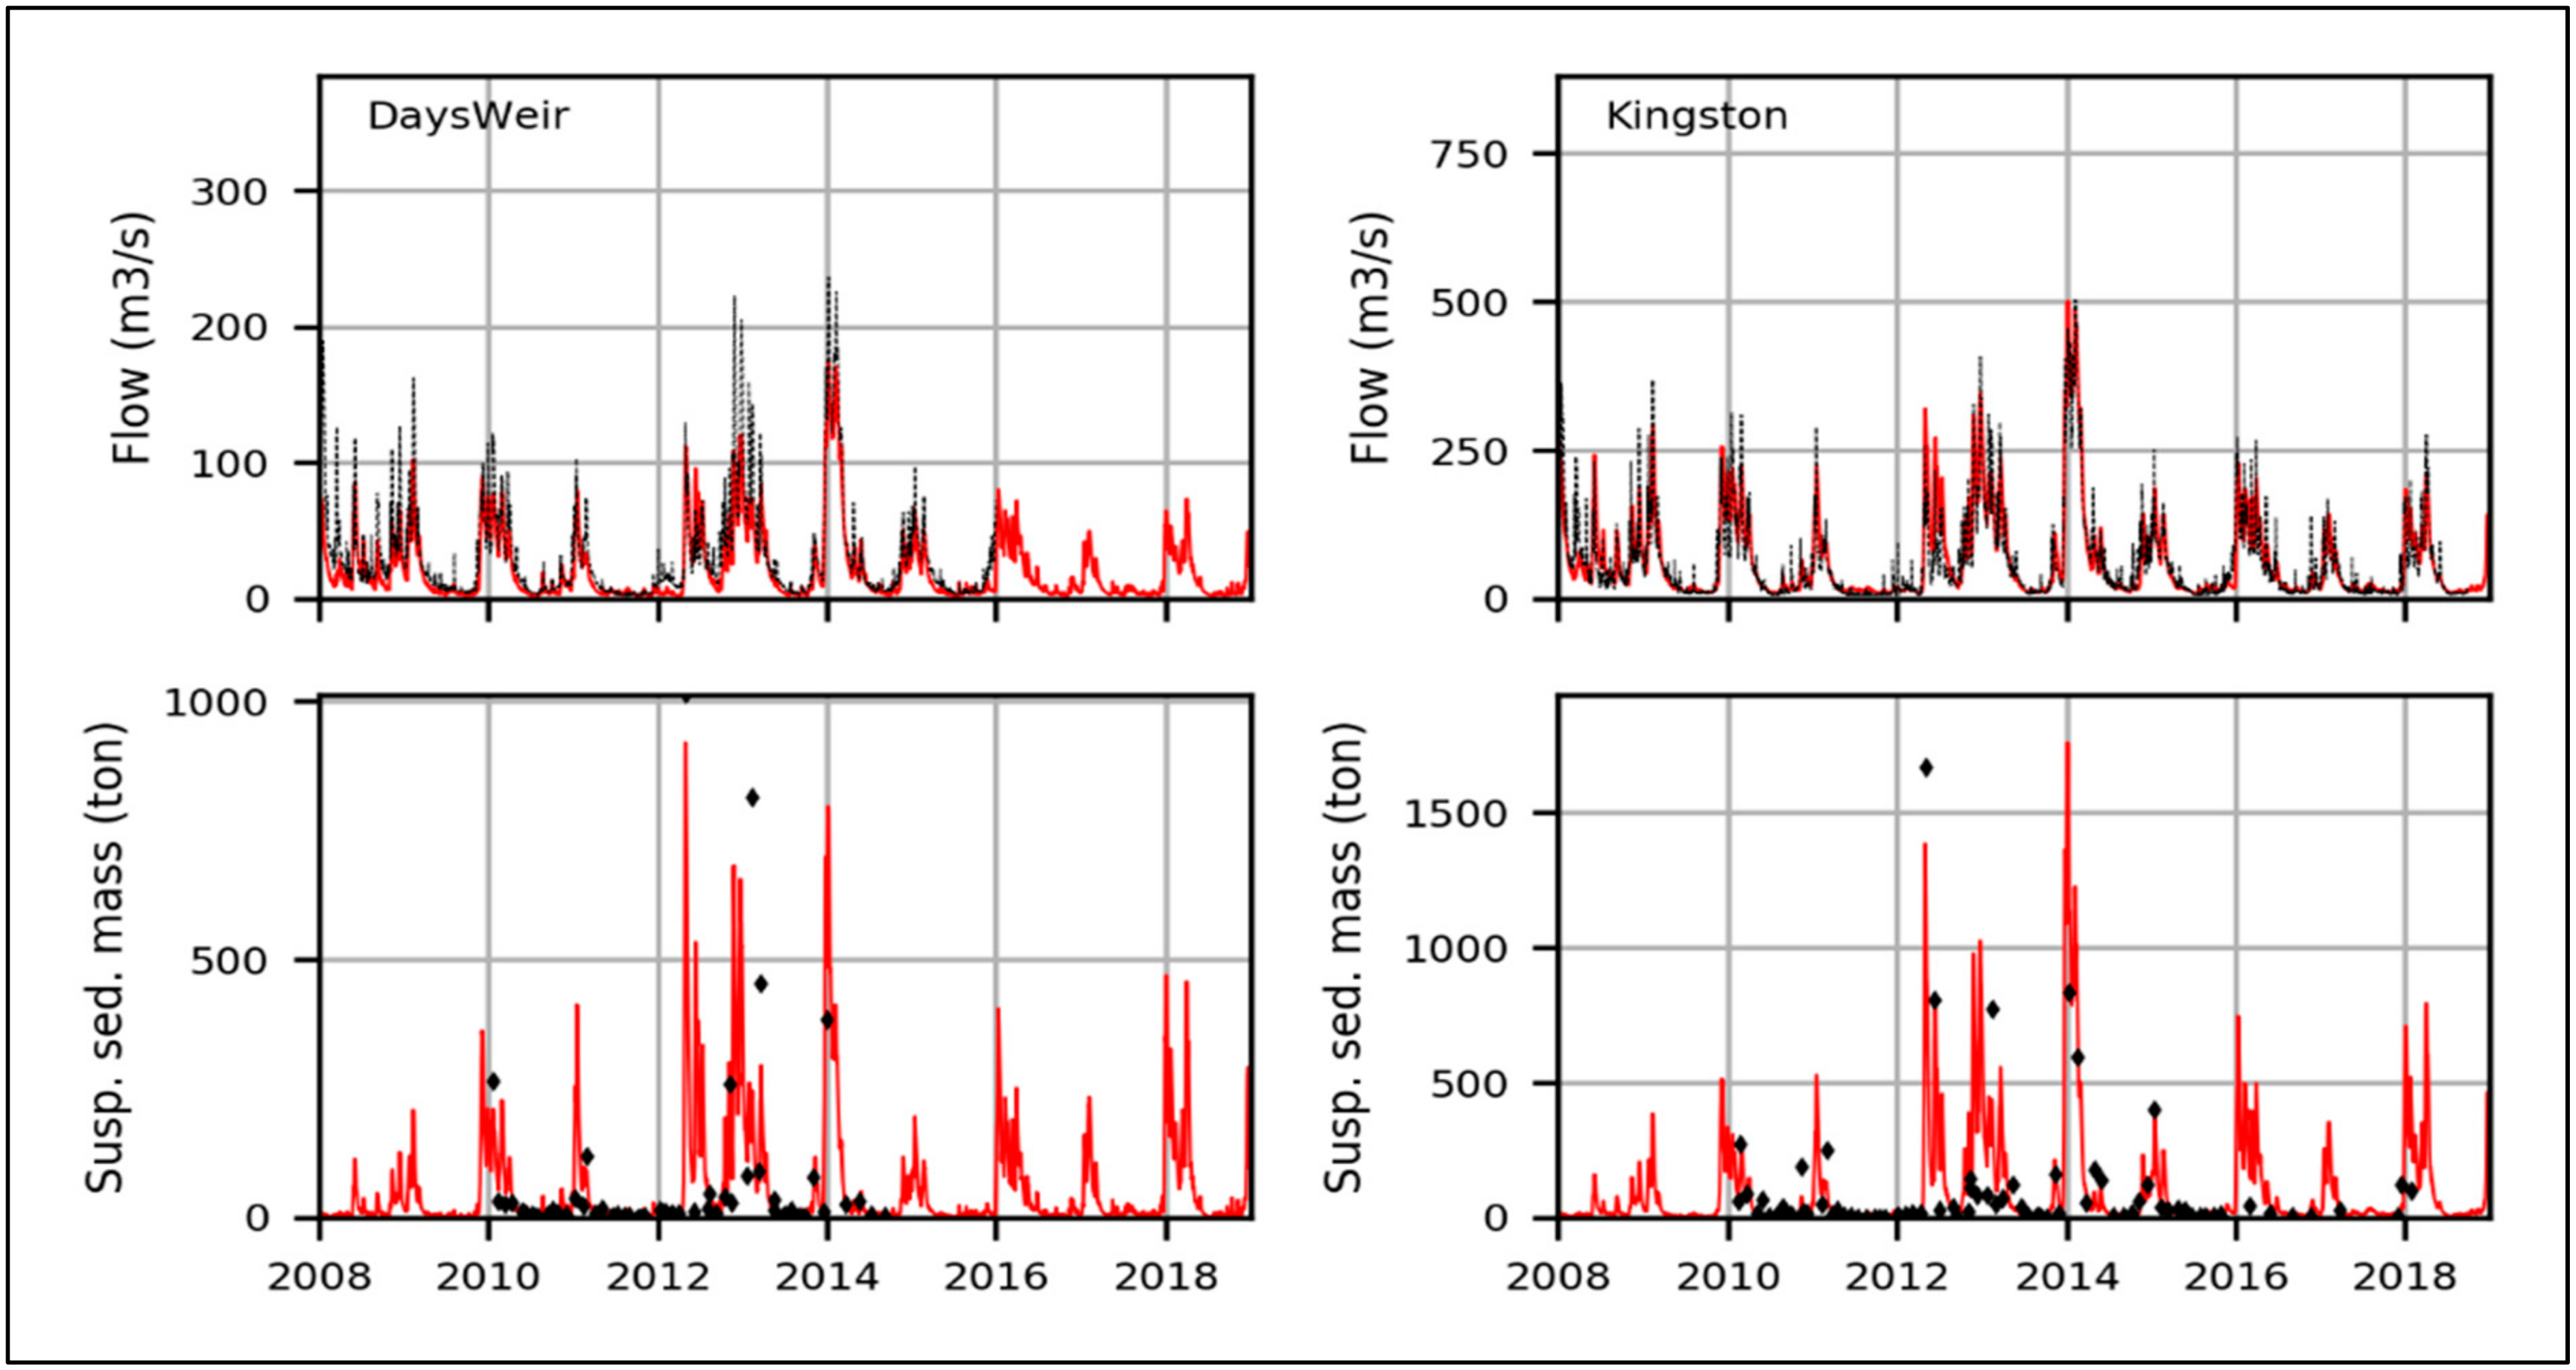
3.2. Model Calibration and Validation

The model parameters were adjusted to reproduce the flow and sediment flux of the River Thames at several sections. Given the lack of microplastics data, it was assumed that the goodness of fit of the model in reproducing the sediment flux was a proxy for its suitability to reproduce microplastics transport [42]. The calibration and validation results for flow and sediments are shown in Figure 2.
The goodness of fit of the model was measured by means of the Kling and Gupta Efficiency (KGE [43] on the flow and sediment mass. The model showed a KGE value of 0.459 and 0.588 for the flow (calibration and validation periods respectively) at Days Weir and 0.845 and 0.956 at Kingston. In terms of sediment mass, the KGE values were 0.859 and 0.282 at Days Weir and 0.820 and 0.81 at Kingston.

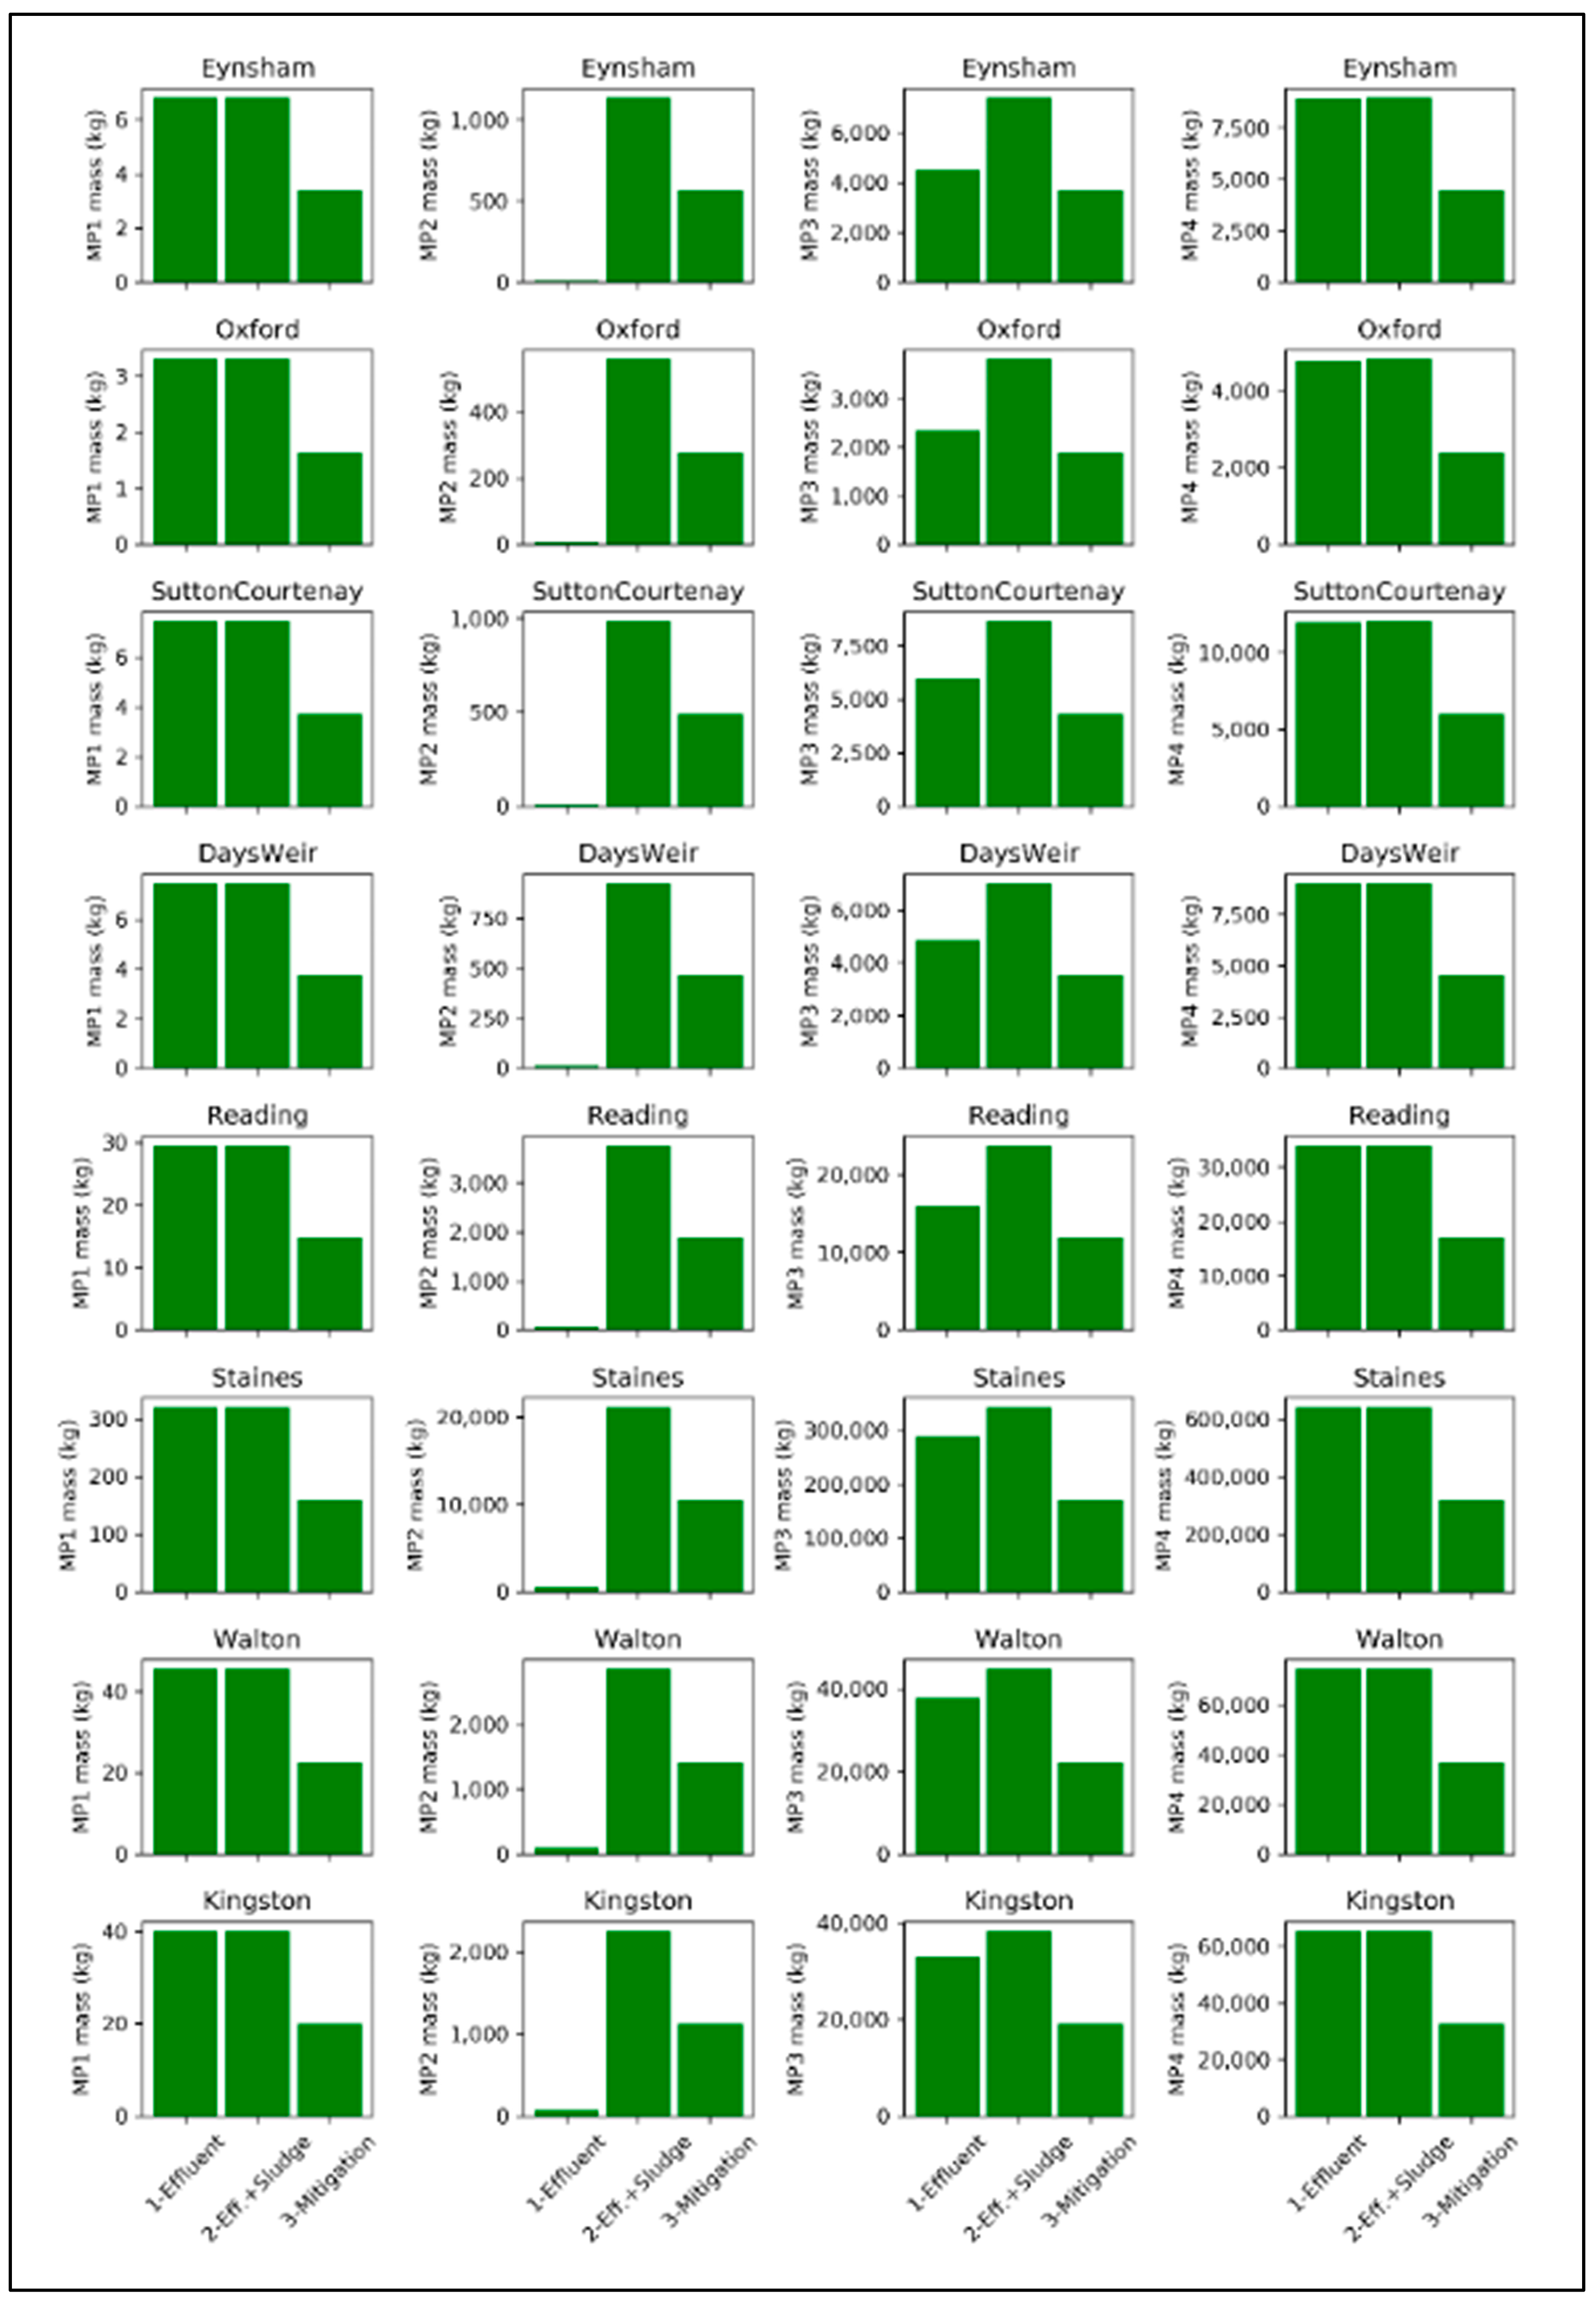
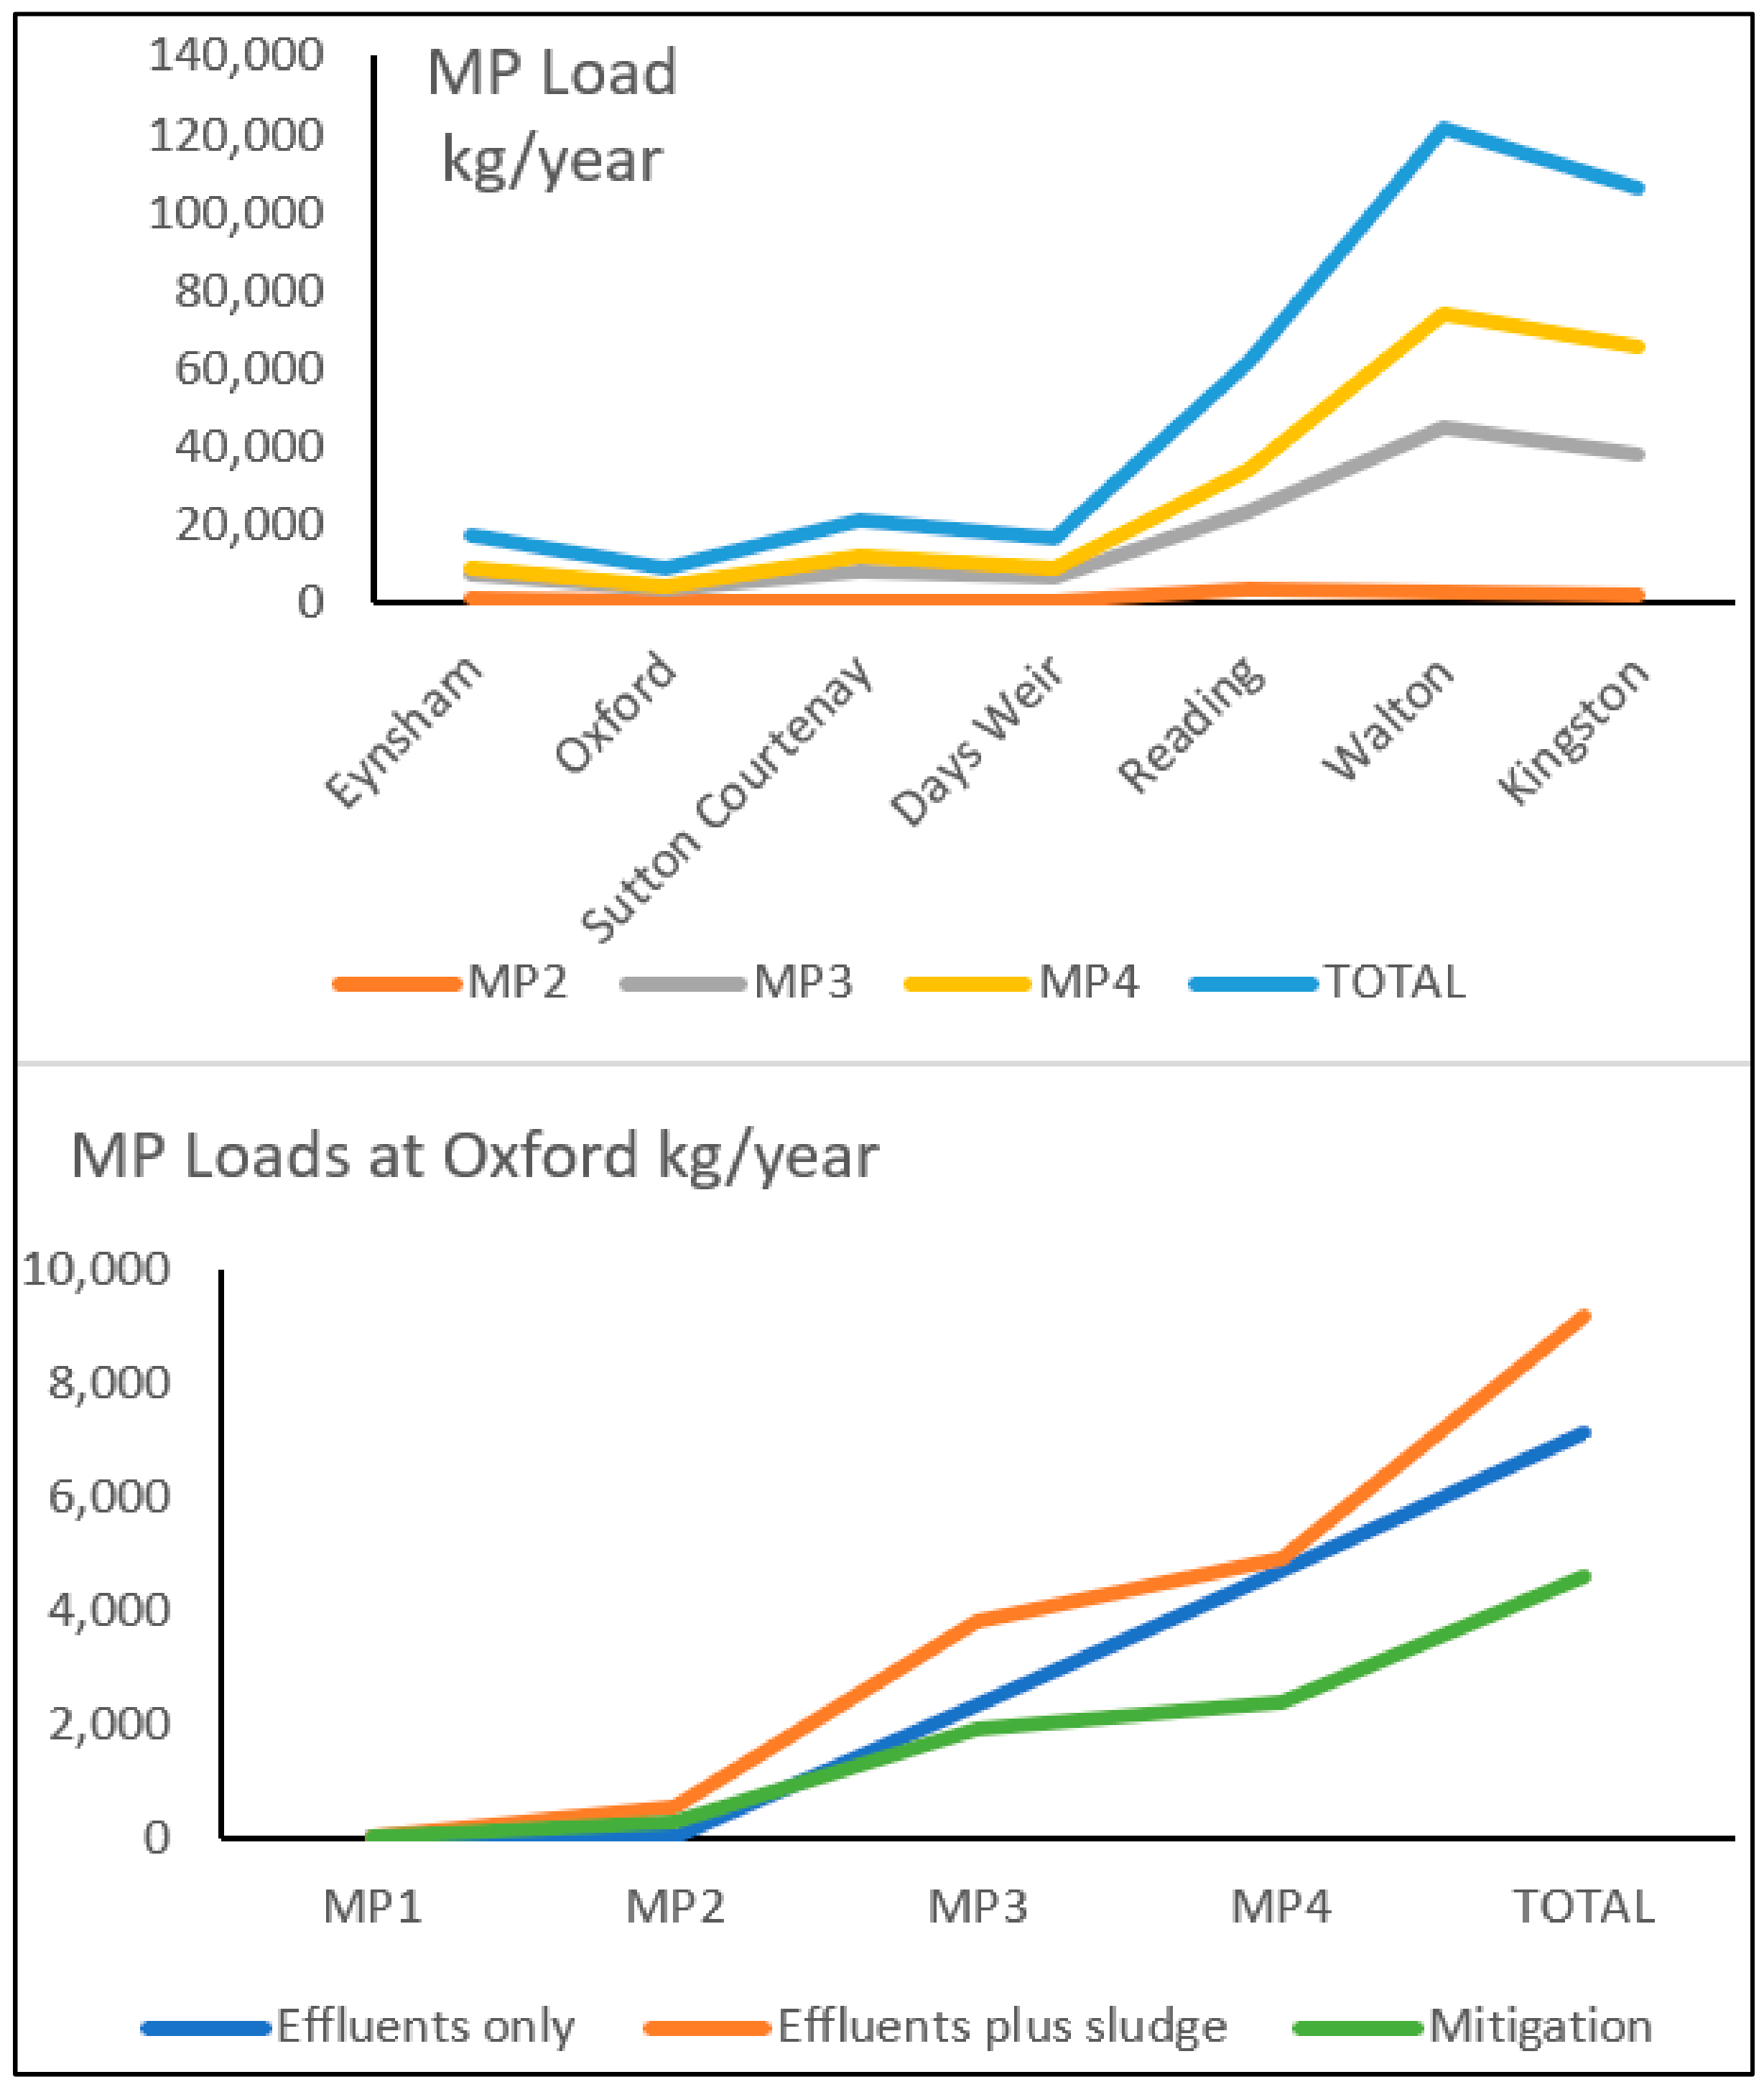
3.3. Model Comparison with MP Measurements for Sediments and Surface Waters

Horton et al. (2017) [13] carried out measurements of microplastics abundance in bed sediment for tributaries of the River Thames, including the Rivers Cut, Leach and Lambourn and these measurements were made downstream of sewage treatment discharge points. Horton et al. (2017) [13] measured the number of particles observed in 100 g of bed sediment and by assuming a density of the plastic particles of 1200 kg m−3 and, knowing the particle diameters, we computed a percentage of plastics in the bed sediments equal to 0.1–0.47%. In terms of sediment microplastics, the model used in our study returned an average percentage of microplastics in the bed sediment values of 0.1% during low flows, which correspond with the samplings by Horton et al. (2017) but are slightly lower. However, the samples collected by Horton et al. (2017) [13] were collected downstream of sewage works discharge points in tributaries of the Thames and, therefore, higher values were obtained in the Horton analysis. In the main river, away from direct discharges, average levels would be lower due to dilution and the increased scale of the main Thames.
The modelled suspended microplastics size distribution were also compared with the mass distributions for raw water provided by Ball et al. (2020) [18]. The UKWIR report [18] provides a total count of microplastics in wastewater and wastewater sludges, and a diameter distribution. In order to estimate the mass, we computed the volume of one particle of each microplastics class by diameter assuming the shape of the particles was a sphere, and then their mass, assuming a density of 1200 kg/m3. Then, given the total count of microplastics and the diameter distribution provided by UKWIR, we estimated the total number of particles for each class. Using the particle mass computed above, we calculated the total microplastics mass (per class and overall) to be approximately 30% of MP3 and 70% of MP4 in terms of mass. We estimated a negligible presence of MP2, as an average across rivers. The INCA Microplastics model results estimate proportions of MP3 and MP4 for the Thames and these range from 31–69%, with this range varying slightly depending on the reach or location along the river. This variation is driven by the sources of microplastics entering a specific reach and reach characteristics such as depth and velocity, which will control sedimentation and transport rates.
Given that the model was reproducing the observed flows, the sediment loads and the MP3 and MP4 loads in the river system, we decided a set of scenarios could be conducted using the INCA model.
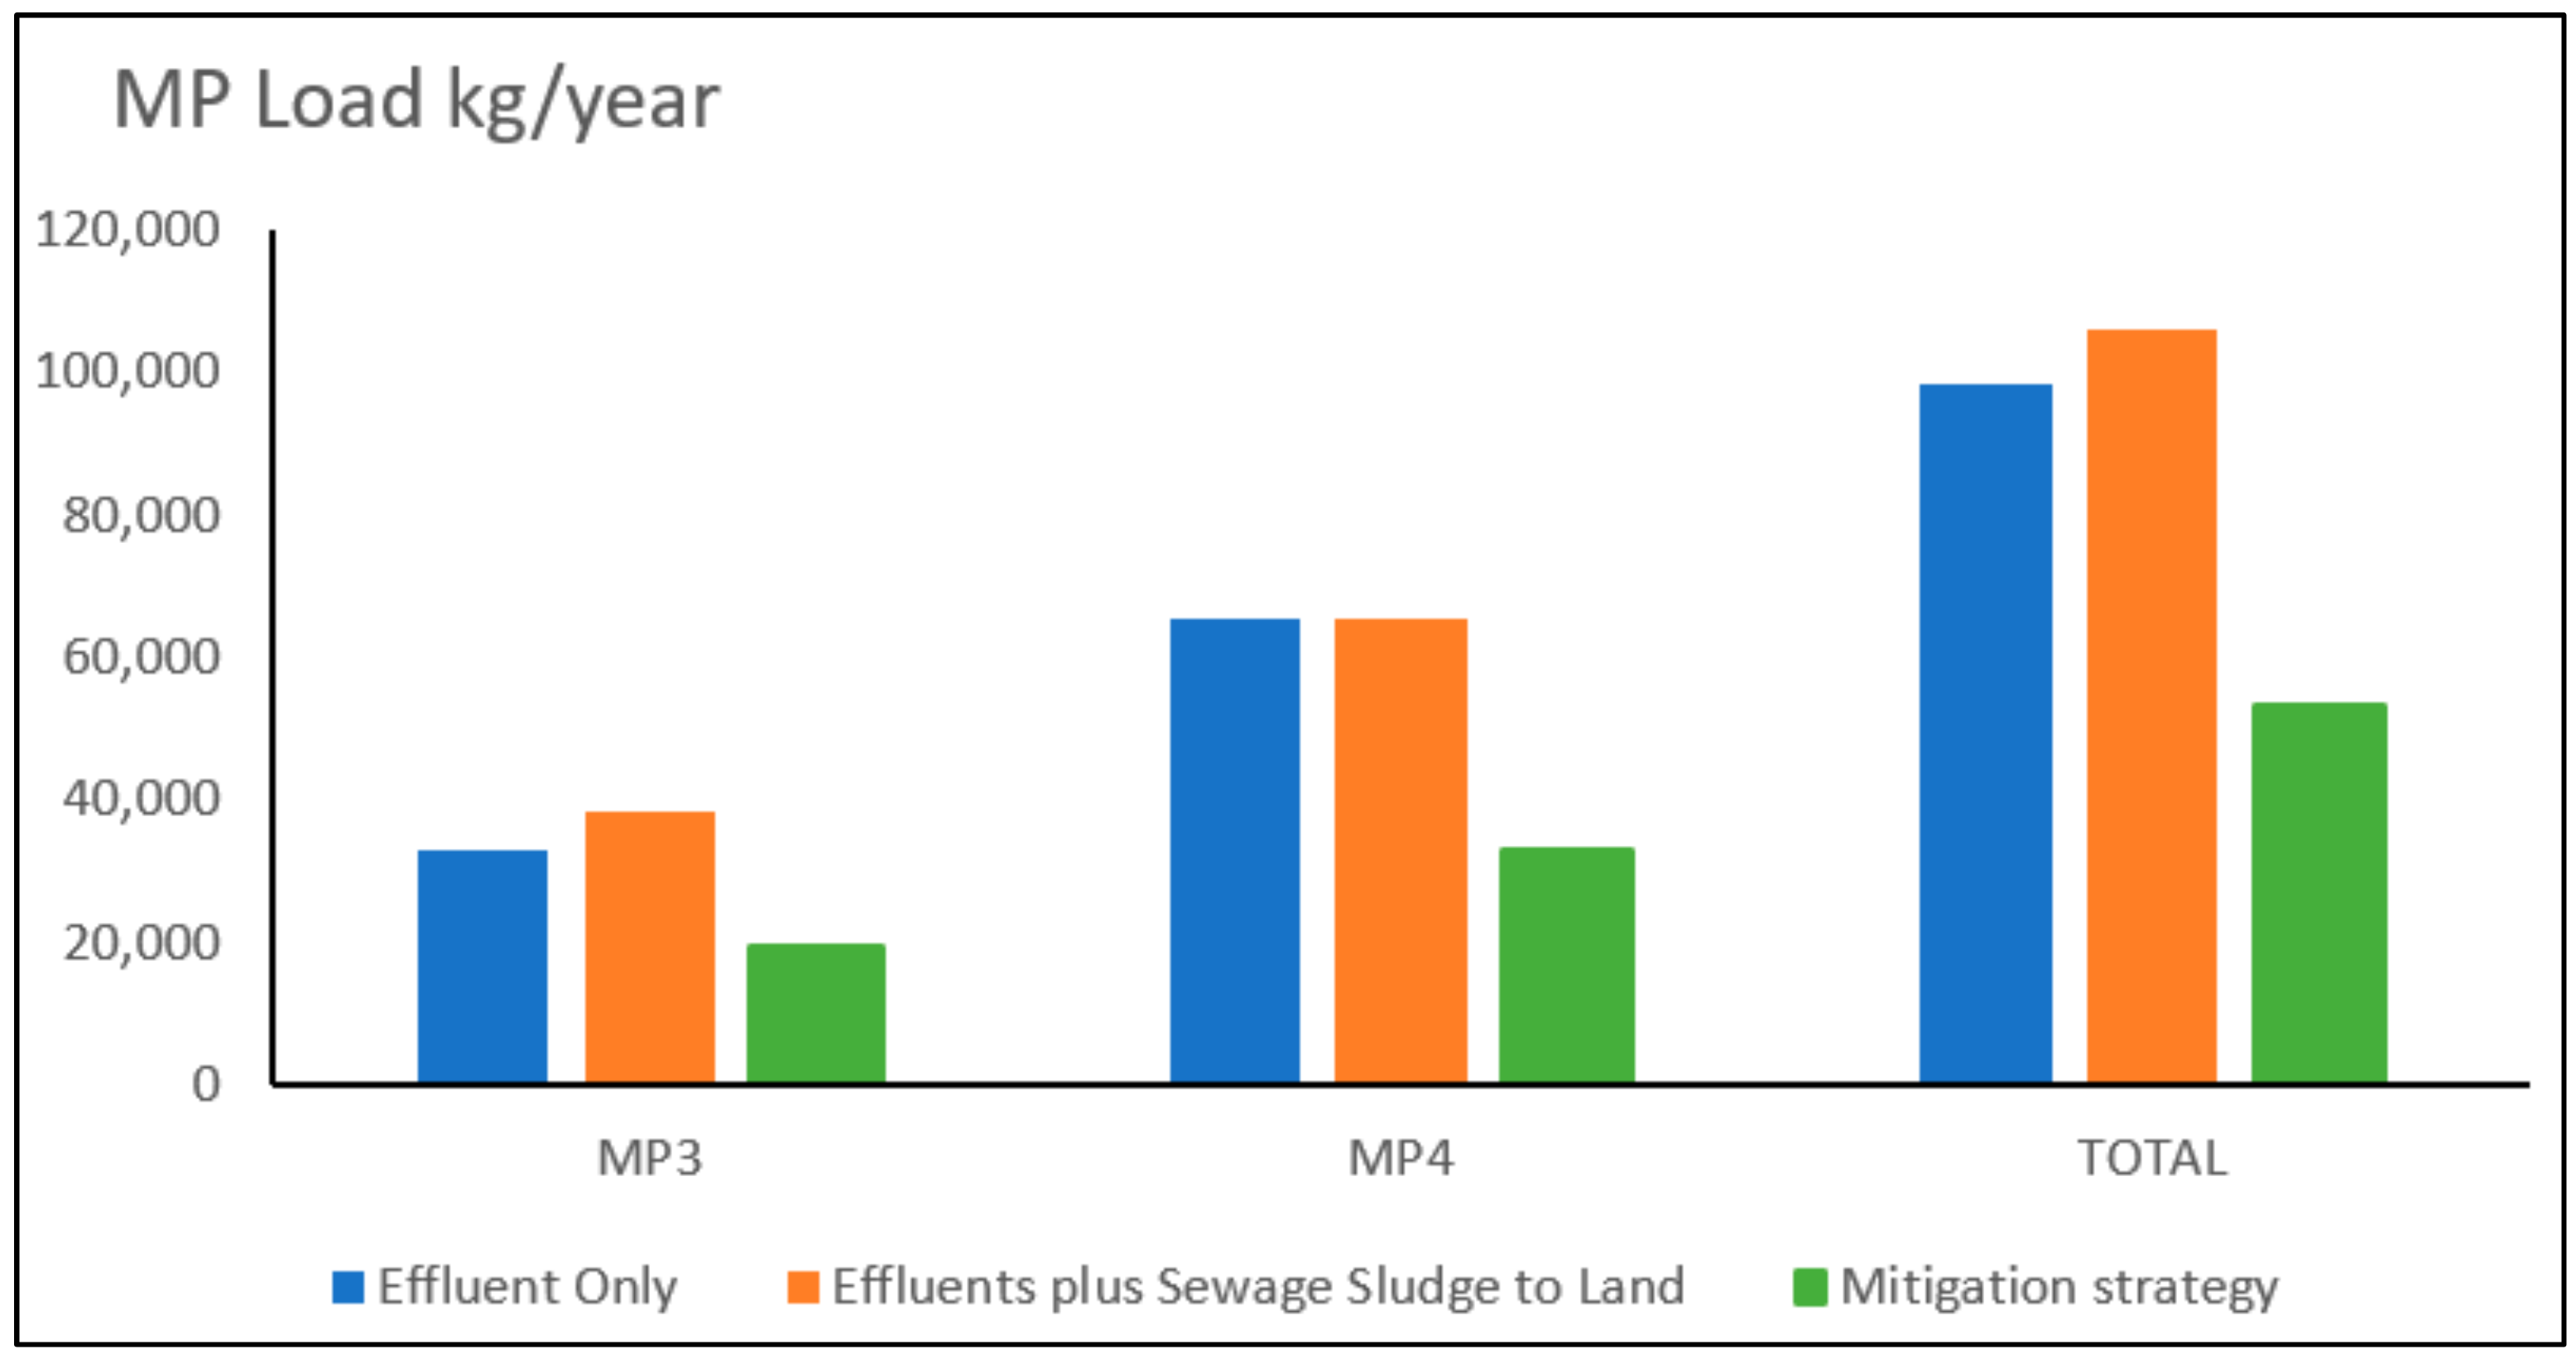
  • Scenario 1: Microplastics input from wastewater effluent
The first scenario analysis of this study considers effluent discharges as the only microplastics entering the river. As mentioned above, the concentrations of microplastics entering the river system from the effluents were estimated based on [18]. The river system was simulated for 10 years of daily hydrology and microplastics and Table 2 shows the average annual suspended microplastics mass load (in kg/year) computed by the model for every reach of the River Thames and Figure 3 shows this as a bar chart for the different MP particle sizes and the different reaches. Note that at the downstream Teddington Weir at Kingston, there is 98,578 kg/year of microplastics moving into the estuary system, as estimated by the model. Figure 4 shows the load profile along the river system and indicates the rapid build-up of microplastics in the lower reaches of the river for the different microplastics size fractions. The build-up reflects the increasing population levels and hence effluent discharges in the downstream reaches.
  • Scenario 2: Microplastics input from wastewater effluent and sludges application in agriculture
The second scenario analysis considers the combined effects of effluent discharges and sewage sludge from agricultural diffuse runoff as the microplastics inputs to the river. As mentioned above, the load of microplastics entering the river system from sewage sludge was estimated based on [18]. Table 3 shows the average annual suspended microplastics mass load (in kg/year) computed by the model for every reach of the River Thames. Figure 3 shows this as a bar chart for the different microplastics particle sizes and the different reaches, showing a significant increase under this sewage sludge application scenario. Fluxes to the estuary have now gone up to 106,114 kgs/year. Note the higher flux at Walton reflecting the large sewage discharges from Staines and Slough. The drop to Kingston indicates that there is a significant deposition onto the riverbed in the lower reaches of the river. This sediment load will build up over the years and could be flushed out during flood events. Figure 4 shows the added microplastics loads at different reaches along the river system.
  • Scenario 3: Mitigation
The third scenario analysis of this study considers effluent water and wastewater sludges as the microplastics inputs to the river but considers mitigation of microplastics inputs in the river system by technical means such as finer screening of effluents or use of wetlands to control discharges from the agricultural diffuse sources into the river system. For example, if we were able to halve the microplastics loads for sewage works then Table 4 shows the average annual microplastics mass load (in kg/year) computed by the model for every reach of the River Thames and displayed in Figure 3 as a bar chart for the different microplastics particle sizes and the different reaches, showing a significant decrease in microplastics under the mitigation strategy. This is interesting from a policy perspective as the model can clearly be used to assess alternative management or policy options and could be applied on a catchment-by-catchment basis to develop an optimal strategy or policy. In this mitigation scenario the flux to the estuary drops to 53,056 kg/year.
In Figure 4, the lower plot shows the comparison of the three scenarios for the Oxford Reach and illustrates the main sources of the microplastics from the effluents with the sludge component adding to the total load at Oxford. The mitigation measure significantly reduces the total load in the river system. Finally, Figure 5 compares the loads at Kingston for the microplastics fractions and the total load. The loads vary with the different scenarios as expected and illustrate the large total loads of microplastics leaving the freshwater river system and moving into the estuary.

4. Discussion

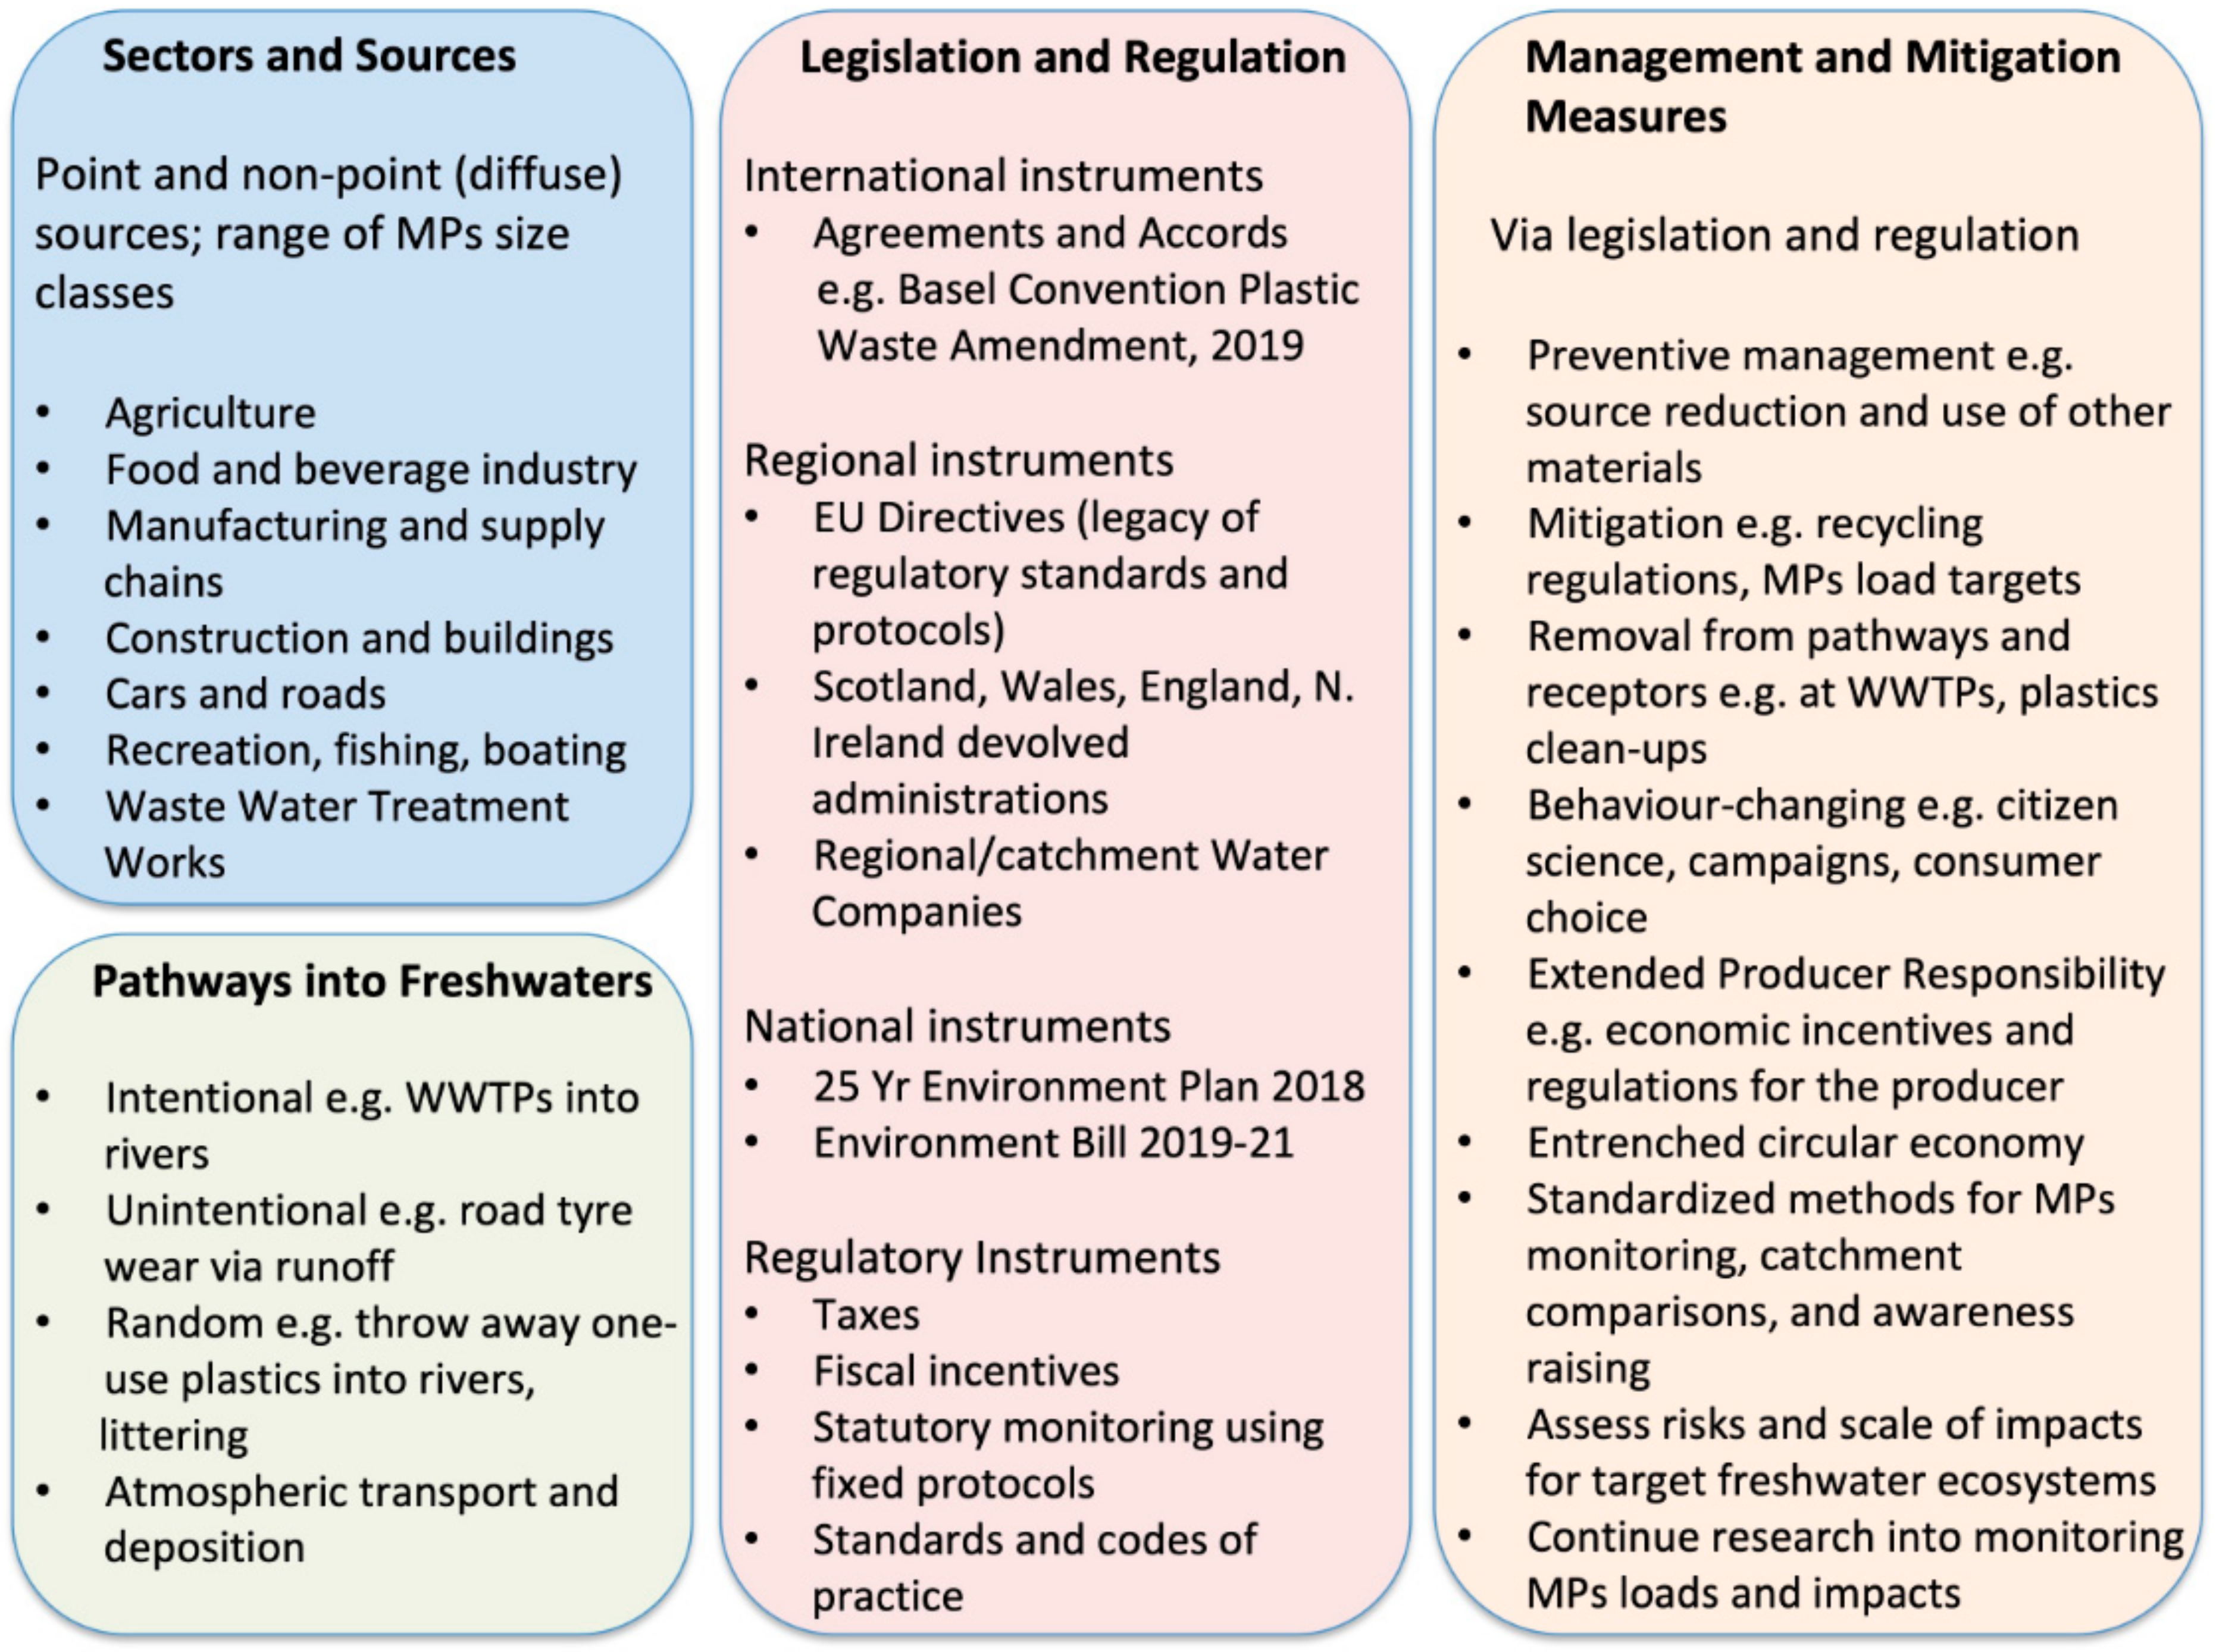
4.1. Approaches to Microplastics Mitigation through Policy, Regulation and Management

The River Thames case study above illustrates that it is possible to simulate the fluxes of microplastics moving down river systems and also consider point and diffuse sources, as well as mitigation strategies. How, then, do these proposals for controlling microplastics relate to local or national policy on microplastics in the case study catchment?
The source–pathway–receptor model provides a framework to identify the key areas, gaps and policy/regulatory instruments that could be applied, as shown in Figure 6. The main types (primary, secondary, intentional, unintentional), sizes, sources (point, diffuse) and pathways of microplastics to freshwaters (receptors) are summarised in Figure 6. Two ‘sources to pathways’ examples were used in the INCA model simulations, namely microplastics loadings from wastewater treatment plants (WWTPs) and sewage sludge applications to agricultural fields. The INCA microplastics model results demonstrate that mitigation strategies can significantly lower microplastics loadings in the River Thames. Mitigation can either be at the source, e.g., plastics are removed through financial incentives for recycling; or along pathways, e.g., application of policy or regulations to oblige stakeholders to reduce microplastics to agreed, standardized loads.

4.2. Mitigation Approaches at the Source

Mitigation and elimination at the source of intentional and unintentional release of microplastics is the most effective way of preventing microplastics from reaching rivers and watercourses. There are different approaches to, and recent examples of, mitigation at the source including effective legislation and enforcement focusing on plastics and microplastics; enhancement and regulation of the circular economy; incentivising the development of non-plastic, alternative materials, as long as they do not cause unintended consequences such as introducing new pollutants into the environment; revaluing recycled plastic through incentivising and monetizing the demand and supply chain; adopting behaviour and voluntary changes by individuals, businesses, industry, for the use and disposal of plastics; promoting awareness campaigns on the sources and impacts of microplastics; improving labelling and certification of products for recycling; mandating recycled content of products; and outright banning of plastic products for certain uses, e.g., microplastic beads in cosmetics. Some of these approaches will be reviewed below.

4.3. Impacts of BREXIT and the UK Leaving the EU

The UK left the European Union (EU) at the end of 2020 and there is now an active and on-going debate surrounding the new proposed Environment Bill 2019–21 and the plastic waste review [44]. There is a period of transition for the UK where EU Directives and legislation still apply, but in the case of microplastics mitigation, opportunities for the provision of new targets, plans and policies for improving and protecting the natural environment have arisen. The UK Government, via the 25 Year Environment Plan, has laid legislation to reach net-zero carbon emissions by 2050, and has committed to working towards zero avoidable waste by 2050, eliminating avoidable plastic waste by 2042, meeting all existing waste targets including for reuse and recycling, and, significantly, reducing all kinds of marine plastic pollution including that originating from land. The Environment Bill 2019-21 is establishing a new public body—the Office for Environmental Protection (OEP)—as the UK’s independent, domestic watchdog, thereby replacing the role of the European Commission on 1 January 2021. Once fully established (there is currently an Interim Environmental Governance Secretariat), with its scrutiny and advice functions, the OEP will monitor progress in improving the natural environment in accordance with plans and targets; through complaints and enforcement mechanisms, it will manage compliance issues relating to environmental law. Further relevant legislation is in progress or has been approved as a UK statutory instrument and came into force on EU exit day. In this context there is the detailed Floods and Water (Amendment, etc.) and (EU Exit) Regulations 2019 which contains a number of amendments of primary legislation e.g., Water Act 2014, and secondary legislation, e.g., Water Environment Regulations, and Sludge (Use in Agriculture) Regulations. The new Environment Bill 2019–21 is still in progress through the UK Parliament and delayed by the pandemic crisis; it is unclear when it will complete its passage and, therefore, when the OEP will be fully functional, but together with the various Amendments it does provide opportunity to influence the microplastics legislative agenda.

4.4. Legal Controls on Plastic Transport

At the international level, there are several instruments relevant to the mitigation of transboundary plastics pollution including the Commonwealth Clean Oceans Alliance, and the Basel Convention Plastic Waste Amendment adopted at COP-14 in 2019. Other legal frameworks relevant to microplastics mitigation at the source in the UK are the Climate Change Act 2008 and the Climate Change (Scotland) Act 2009 (www.legislation.gov.uk accessed 10 November 2020), both of which provided the legal powers to enable UK national authorities to introduce secondary legislation on charges for single-use plastic bags, reducing usage by 90%. In 2018 the UK (England and Scotland) imposed a ban on the use of rinse-off microplastic beads in cosmetics e.g., in shaving foam, toothpaste, shower gel, exfoliants, but a ban, we suggest, should be extended to include other significant categories and sources of intentional microplastics pollution such as in synthetic polymer-based paints used for road markings, and many domestic and industrial cleaning abrasives. Bans are not always straightforward to achieve, however, and the example of the metaldehyde (slug pellets) ban approved by the UK government in 2018 and then overturned in the High Court in 2019 is a case in point.
Various new European rules are worth highlighting. An obligatory new rule on single-use plastics came into force in May 2019 for all EU states by 2021—Single-Use Plastics Directive. This is part of the EU Plastics Strategy (www.ec.europe.eu accessed 10 November 2020; [44]) to reduce plastics pollution while fostering growth and innovation. The focus of the Directive is to ban single-use products such as cotton buds, plastic cutlery, etc; instigate measures to reduce usage of plastic beverage and food containers; initiate Extended Producer Responsibility schemes (see below); and a suite of recycling targets for plastic bottles (such as collecting 77% of plastic bottles by 2025 via a deposit return scheme, and 90% of bottles by 2029). It also restricts the addition of polymer microplastics to fertilizers (used for slow release of nutrients and to prevent lumping) and obliges a switch to biodegradable polymers in fertilizers by 2026. In December 2019, the European Commission launched the European Green Deal, an action plan for a clean, circular economy, restoring biodiversity, and cutting pollution. The UK needs to ensure that the detail of these instruments and plans are embedded in post-Brexit legislation and targets, e.g., deposit return schemes, producer responsibility schemes, consistent plastic recycling and clear labelling.

4.5. Taxation Controls

Of further significance for reducing single-use plastics at the source is the Plastic Packaging Tax due to take effect from April 2022. This is a new tax that applies to plastic packaging produced in, or imported into the UK that does not contain at least 30% recycled plastic (www.gov.uk accessed 10 November 2020; UK Government 2018). The tax will provide a strong economic incentive for businesses to use recycled material in the production of plastic packaging, creating greater demand for this material and stimulating increased recycling and collection of plastic waste. The government is due to publish draft legislation for consultation in 2020, which will set out the key features of the tax e.g., an anticipated £200 per tonne tax for packaging with less than 30% recycled plastic. Complementing the Plastics Tax is the launch of the Commons Select Committee on Plastic Food and Drink Packaging in September 2019 and the UK Plastics Pact (the Pact) in 2018 by WRAP. The Pact is a coalition of more than 120 businesses, government, local authorities and organisations collectively making or selling 85% of the plastic packaging used in UK supermarkets. The Pact has four targets, to be achieved by 2025: Eliminate problematic or unnecessary single-use plastic packaging through redesign, innovation or alternative (re-use) delivery models; 100% of plastic packaging to be reusable, recyclable or compostable; 70% of plastic packaging effectively recycled or composted; and 30% average recycled content across all plastic packaging. We suggest that it is vital to monitor the effects of the tax and pact on the mitigation of microplastics loads via systematic sampling and modelling to inform future legislation and regulation.

4.6. Other Diffuse Sources

Discarded plastic items into the environment and car tyre wear are the two greatest sources of microplastic pollution [1,45] and reducing these two sources alone would significantly decrease microplastics pollutants in freshwaters and freshwater sediments in the UK. In The Netherlands, proposed mitigation measures for reducing microplastics from car tyre wear include raising the legal threshold for car tyre abrasion and alignment, systematic road cleaning in urban areas, reducing abrasion from road surfaces via use of mandatory non-porous asphalt, and further developing fiscal incentives to reduce car use in general. The stemming of discarded plastics into the environment is a continuing effort by civil society, through public engagement and raising awareness of the issue—plastics pollution has certainly hit the public consciousness. There are numerous existing public engagement initiatives and partner projects, e.g., Great Global Nurdle Hunt, Earthwatch ‘Plastic Rivers’ project, River Trust ‘Preventing Plastics Pollution’ project, and there are opportunities for the public to influence plastics pollution via consumer choices, education, and support for research and development into alternative plastics materials. Furthermore, established freshwater citizen science projects and organisations should expand their sampling to include microplastics monitoring and awareness raising, e.g., Riverfly Partnership, Global Water Blitz.
The need to find alternative environment-friendly materials to plastics has spurred many technology and innovation initiatives. For example, a French think tank, Atelier Luma, is investigating whether treated algae can be used as an alternative material to plastic based on petrochemicals (BBC, 24 January 2020); and Tournier et al. (2020) [46] have engineered an enzyme that breaks down poly(ethylene terephthalate) (PET) polyester plastic (90% of 200 g of PET in 10 h) and used the terephthalate and ethylene glycol generated by the enzyme to produce new PET plastic bottles that are as strong as those made from conventional plastics, thereby significantly contributing to the circular economy. Investment into research and development of alternative materials and recycling technology, with a focus on chemical recycling rather than mechanical recycling, is a vital part of microplastics mitigation at the source.

4.7. Mitigation Approaches along Pathways

Microplastics mitigation along pathways may be more diffuse than at the source. The reduction of microplastics in rivers can be achieved by better controls on the disposal of microplastics in waste, entering river systems from either sewage effluent discharges or via sludge disposal to agricultural land. The modelling suggests that the loads can be reduced by 50% by adopting fairly conventional controls but that improvements beyond this will require better technologies for MP removal. Improving the technology is a challenge for industry and research, but new technologies should be available in future years.
Based on the modelling conducted in this research, mitigation instruments, via legislation and regulation, could be applied to the River Thames, other catchments or, in the case of the UK, to private water company regions to control microplastics loadings. Eleven water companies in England and Wales manage Water Supply and Wastewater Treatment and, if incentivised, could adopt the technologies to significantly reduce microplastics from discharges into rivers or from agricultural sludge. For example, disc filters were successfully used to remove microplastics in Denmark at the Grindsted WWTPs [47]. Talvitie et al. (2017) [48] evaluated large conventional WWTPs in Finland and concluded that commonly used, and efficiently working, primary and secondary treatments removed up to 99% of particles sized 20 μm–5 mm. Further removal of microplastics was achieved using several additional technical solutions such as a membrane bioreactor (efficiency up to 99.9%), sand filtration (97%), dissolved air flotation (95%) and a disc filtration system (40–98.5%).
Nizzetto et al. (2016b) [41] estimate that 125–850 tons of microplastics per million inhabitants are added annually to European agricultural soils either as direct sewage sludge or as processed biosolids, and the technologies needed to eliminate microplastics from sludges in WWTPs are reviewed by [11,49]. The evidence demonstrates that agricultural sludge application creates a significantly greater source of microplastics into watercourses than direct effluent from large WWTPs.
Currently in the UK, European Union and North America sludge applications are routinely applied to agricultural land. No regulation of microplastics loads is in place, mainly due to the lack of agreed and standardised testing methods. Introducing legislation to regulate permitted levels of microplastics in WWTPs sludge and using, for example, pyrolysis technologies [11] to remove microplastics pollutants, would potentially reduce microplastics from this pathway. In the Sewage Sludge in Agriculture: Code of Practice for England, Wales and Northern Ireland (2018) for final treated effluent, there is mandatory testing by the producer (e.g., water companies) and the user (e.g., farmers) using a published list of Potentially Toxic Elements (PTE) that focuses on metals and pathogens (www.gov.uk accessed 11 December 2020). If the list of PTEs included microplastics it would put the responsibility of treating the sludge before application onto the producer (in this case the water companies).
EurEau (2019) [49] and the EU recommend the principle of extended producer responsibility (EPR) to tackle microplastics pollution, if measures to control at the source are insufficient. Applying this principle, manufacturers that affect the water environment through their products, would have to finance mitigating measures at other life cycle stages or along pathways. It would put the cost on the producer rather than the consumer. Applying EPR principles to the UK could be undertaken by the new Office for Environmental Protection. The OEP could impose measures such as introducing compulsory environmental risk assessment for all products containing plastics with exposure to freshwater; devising regulations for washing machine and dishwasher producers; devising or implementing standards and regulations for textile manufacturers and tyre manufacturers; devising or implementing standards for WWTPs and sewage sludge; and obliging plastics producers to contribute to the upgrade of waste water infrastructure and, in particular, WWTPs. However, success is entirely dependent on having robust, standardised methods for measuring and monitoring microplastics, as outlined below.

4.8. Mitigation Approaches through Standardization of Measurement

The most significant microplastics were found to be in the range MP3 (100–350 µm) and MP4 (350–1000 µm) and the modelling shows that the mitigation measures that could have significant effects on microplastics concentrations and loads in rivers. One clear shortcoming in microplastics research is the lack of standardisation of protocols for measuring, quantifying and comparing MP loads. The success of policy or regulation aimed at mitigating microplastics at the source and along pathways is entirely dependent on having robust, standardised methods for measuring and monitoring the outcomes, and we urgently support the initiatives to produce international guidelines and standards of measurement. However, the strategy utilized in the UKWIR study [18,19] offers a new standardised protocol. Freshwater aquatic organisms, during their life cycles are likely to be continuously exposed to the most harmful microplastics size range (>100 nm and <100 µm) which correspond to MP1 and MP2 in the INCA model, and NPs (0.1–100 nm) of a mixed quality (chemical adsorption and microbial biofilms) of weathered fibres and fragments [50].
A review on the human health impacts of microplastics [50] concluded that data to assess the exact exposure of humans to micro- and nanoplastics through diet cannot be produced until standardised methods and definitions are available. We have highlighted the lack of standard methods in relation to freshwaters, and we conclude that the success of legislation and regulation of microplastics in freshwaters cannot be evaluated without robust techniques for monitoring and classification. It is encouraging to see that the European Commission’s Joint Research Centre launched in February 2020 a global study (130 laboratories included) with the aim of standardising methods for measuring microplastics in water; and the International Organization for Standardization (ISO) is working on different work programmes towards standardisation of methods for numerous plastics and microplastics types in different environments (ISO 2020).
The New EU Rules on Drinking Water (2018) empowers the European Commission to develop a standard methodology to measure microplastics with a view to including microplastics on the watch list of emerging pollutants, and, in this case, the assessment and enforcement of drinking water quality. In its Evaluation of the Urban Wastewater Treatment Directive (2019), the Commission advocates standard methods to measure microplastics in the influent and effluent of WWTPs with the aim of assessing the effects of removing microplastics from wastewater on sludge composition. We strongly support the move towards standardised techniques, without which it is not possible to assess either the risks and impacts of MP pollution on freshwater ecosystems, or the impacts of mitigation instruments.

5. Concluding Remarks

This study has provided considerable insight into the movement of microplastics along the River Thames, the build-up of microplastics along the river system and the fluxes of MP being transported along the river system. The total load of microplastics of 100,000 kg/year or 100 Tonnes/year is an enormous flux of microplastics being flushed down the river system and out into the Thames estuary. With the large loads and concentrations of MP in the Thames, the impacts on aquatic life are likely to be significant, as will the impacts on marine aquatic ecosystems.
We recommend that the focus of new policy and regulatory instruments should be on reducing or progressively eliminating microplastics from entering identifiable pathways. The new Environment Bill 2019–21 is progressing through the UK Parliament and provides an opportunity to influence the microplastics legislative agenda. However, the UK needs to ensure that the detail of existing EU instruments and plans are embedded in post-Brexit legislation and targets, e.g., deposit return schemes, producer responsibility schemes, consistent plastic recycling within the circular economy, and clear recycling labelling. The ban of microplastic beads in wash-off products is to be applauded but it should be extended to include other significant categories and sources of intentional microplastics pollution such as many domestic and industrial cleaning abrasives. We suggest that it is vital to monitor the effects of the new UK Plastics Tax, and the Plastic Pact, on the mitigation of microplastics loads in freshwaters via systematic sampling to inform future legislation and regulation. Furthermore, investment into research and development of alternative materials and recycling technology is a vital part of microplastics mitigation at the source. There are many opportunities for the public to influence plastics pollution via consumer choices, education and freshwater citizen science projects and there is scope to develop public engagement further.
More regulation could be achieved via the designation of microplastics on the list of Potential Toxic Elements, which would put the responsibility of treating the sludge before application onto the producer (in this case the water companies). Applying Extended Producer Responsibility principles to the UK could be undertaken by the new Office for Environmental Protection. We suggest that the OEP could impose measures such as introducing compulsory environmental risk assessment for all products containing plastics with exposure to freshwater; devising regulations for washing machine and dishwasher producers; devising standards and regulations for textile manufacturers and tyre manufacturers; devising standards for all WWTPs and sewage sludge; and obliging plastics producers to contribute to the upgrade of waste water infrastructure, and in particular WWTP technologies for microplastics mitigation.

Author Contributions

P.G.W. writing, management of project, modelling; G.B. data collection, modelling, writing; J.M.R.H. Policy, writing and aquatic ecology; A.T.C.-C. writing, aquatic ecology; M.D.N.—software development; E.S.J. management funding and writing; C.P.N.R. writing; D.S.R. data provision and comments, A.A.H. interpretation, writing. All authors have read and agreed to the published version of the manuscript.

Funding

This research was supported by Oxford University Internal Research Funds.

Institutional Review Board Statement

Not relevant.

Informed Consent Statement

Not relevant.

Data Availability Statement

Not applicable.

Acknowledgments

The authors are very grateful to the University of Oxford for funding this research and to UKWIR for permission to quote the MP data from their recent report Ref. 19/EQ/01/18 (see Ball et al., 2020 [18]). We also thank the UK Government Department DEFRA for excellent feedback, especially on the policy aspects. The views in this paper however represent those of the authors.

Conflicts of Interest

The authors declare no conflict of interest.

References

  1. The Royal Society. Microplastics in Freshwater and Soil. In An Evidence Synthesis; Publication of the Royal Society of London: London, UK, 2019. [Google Scholar]
  2. Liu, Y.; Wang, Z.; Wang, S.; Fang, H.; Ye, N.; Wang, D. Ecotoxicological effects on Scenedesmus obliquus and Danio rerio Co-exposed to polystyrene nano-plastic particles and natural acidic organic polymer. Environ. Toxicol. Pharmacol. 2019, 67, 21–28. [Google Scholar] [CrossRef]
  3. Plastics Europe Plastics—The Facts 2018. In An Analysis of European Plastics Production, Demand and Waste Data; Plastics Europe: Wemmel, Belgium, 2018.
  4. Horton, A.A.; Walton, A.; Spurgeon, D.J.; Lahive, E.; Svendsen, C. Microplastics in freshwater and terrestrial environments: Evaluating the current understanding to identify the knowledge gaps and future research priorities. Sci. Total Environ. 2017, 586, 127–141. [Google Scholar] [CrossRef] [Green Version]
  5. Allen, S.; Allen, D.; Phoenix, V.R.; Le Roux, G.; Jiménez, P.D.; Simonneau, A.; Binet, S.; Galop, D. Atmospheric transport and deposition of microplastics in a remote mountain catchment. Nat. Geosci. 2019, 12, 339–344. [Google Scholar] [CrossRef]
  6. Thompson, R.C.; Olsen, Y.; Mitchell, R.P.; Davis, A.; Rowland, S.J.; John, A.W.G.; McGonigle, D.; Russell, A.E. Lost at Sea: Where Is All the Plastic? Science 2004, 304, 838. [Google Scholar] [CrossRef] [PubMed]
  7. Xu, S.; Ma, J.; Ji, R.; Pan, K.; Miao, A.-J. Microplastics in aquatic environments: Occurrence, accumulation, and biological effects. Sci. Total Environ. 2020, 703, 134699. [Google Scholar] [CrossRef]
  8. Wagner, M.; Scherer, C.; Alvarez-Muñoz, D.; Brennholt, N.; Bourrain, X.; Buchinger, S.; Fries, E.; Grosbois, C.; Klasmeier, J.; Marti, T.; et al. Microplastics in freshwater ecosystems: What we know and what we need to know. Environ. Sci. Eur. 2014, 26, 1–9. [Google Scholar] [CrossRef] [PubMed] [Green Version]
  9. Waldschläger, K.; Lechthaler, S.; Stauch, G.; Schüttrumpf, H. The way of microplastic through the environment—Application of the source-pathway-receptor model (review). Sci. Total Environ. 2020, 713, 136584. [Google Scholar] [CrossRef] [PubMed]
  10. Müller, A.; Österlund, H.; Marsalek, J.; Viklander, M. The pollution conveyed by urban runoff: A review of sources. Sci. Total Environ. 2020, 709, 136125. [Google Scholar] [CrossRef] [PubMed]
  11. Zhang, Z.; Chen, Y. Effects of microplastics on wastewater and sewage sludge treatment and their removal: A review. Chem. Eng. J. 2020, 382, 122955. [Google Scholar] [CrossRef]
  12. Wu, P.; Huang, J.; Zheng, Y.; Yang, Y.; Zhang, Y.; He, F.; Chen, H.; Quan, G.; Yan, J.; Li, T.; et al. Environmental occurrences, fate, and impacts of microplastics. Ecotoxicol. Environ. Saf. 2019, 184, 109612. [Google Scholar] [CrossRef] [PubMed]
  13. Horton, A.A.; Svendsen, C.; Williams, R.J.; Spurgeon, D.J.; Lahive, E. Large microplastic particles in sediments of tributaries of the River Thames, UK—Abundance, sources and methods for effective quantification. Mar. Pollut. Bull. 2017, 114, 218–226. [Google Scholar] [CrossRef] [Green Version]
  14. Turner, S.; Horton, A.A.; Rose, N.L.; Hall, C. A temporal sediment record of microplastics in an urban lake, London, UK. J. Paleolimnol. 2019, 61, 449–462. [Google Scholar] [CrossRef]
  15. Brahney, J.; Hallerud, M.; Heim, E.; Hahnenberger, M.; Sukumaran, S. Plastic rain in protected areas of the United States. Science 2020, 368, 1257–1260. [Google Scholar] [CrossRef] [PubMed]
  16. Dunn, C.; Owens, J.; Fears, L.; Nunnerley, L.; Kirby, J.; Armstrong, O.L.; Thomas, P.J.; Aberg, D.; Gilder, W.; Green, D.; et al. An affordable methodology for quantifying waterborne microplastic—An emerging contaminant in inland-waters. J. Limnol. 2019, 79. [Google Scholar] [CrossRef]
  17. Horton, A.A.; Vijver, M.G.; Lahive, E.; Spurgeon, D.J.; Svendsen, C.; Heutink, R.; van Bodegom, P.M.; Baas, J. Acute toxicity of organic pesticides to Daphnia magna is unchanged by co-exposure to polystyrene microplastics. Ecotoxicol. Environ. Saf. 2018, 166, 26–34. [Google Scholar] [CrossRef] [PubMed] [Green Version]
  18. Ball, H.; Cross, R.; Grove, E.; Horton, A.; Johnson, A.; Jürgens, M.; Read, D.; Svendsen, C. Sink to River—River to Tap. In A Review of Potential Risks from Nanoparticles and Microplastics; UKWIR: London, UK, 2020. [Google Scholar]
  19. Horton, A.A.; Cross, R.K.; Read, D.S.; Jürgens, M.D.; Ball, H.L.; Svendsen, C.; Vollertsen, J.; Johnson, A.C. Semi-automated analysis of microplastics in complex wastewater samples. Environ. Pollut. 2021, 268, 115841. [Google Scholar] [CrossRef]
  20. Whitehead, P.G. Water Quality Modeling; Wiley: Hoboken, NJ, USA, 2016; pp. 1–21. [Google Scholar]
  21. Mai, L.; Bao, L.-J.; Shi, L.; Wong, C.S.; Zeng, E.Y. A review of methods for measuring microplastics in aquatic environments. Environ. Sci. Pollut. Res. 2018, 25, 11319–11332. [Google Scholar] [CrossRef]
  22. Nizzetto, L.; Bussi, G.; Futter, M.N.; Butterfield, D.; Whitehead, P.G. A theoretical assessment of microplastic transport in river catchments and their retention by soils and river sediments. Environ. Sci. Process. Impacts 2016, 18, 1050–1059. [Google Scholar] [CrossRef]
  23. Frias, J.; Nash, R. Microplastics: Finding a consensus on the definition. Mar. Pollut. Bull. 2019, 138, 145–147. [Google Scholar] [CrossRef]
  24. Koelmans, A.A.; Nor, N.H.M.; Hermsen, E.; Kooi, M.; Mintenig, S.M.; De France, J. Microplastics in freshwaters and drinking water: Critical review and assessment of data quality. Water Res. 2019, 155, 410–422. [Google Scholar] [CrossRef]
  25. Alvim, C.B.; Mendoza-Roca, J.; Bes-Piá, A. Wastewater treatment plant as microplastics release source—Quantification and identification techniques. J. Environ. Manag. 2020, 255, 109739. [Google Scholar] [CrossRef]
  26. Araújo, A.P.D.C.; de Melo, N.F.S.; Junior, A.G.D.O.; Rodrigues, F.P.; Fernandes, T.; Vieira, J.E.D.A.; Rocha, T.L.; Malafaia, G. How much are microplastics harmful to the health of amphibians? A study with pristine polyethylene microplastics and Physalaemus cuvieri. J. Hazard. Mater. 2020, 382, 121066. [Google Scholar] [CrossRef]
  27. Whitehead, P.G.; Wilson, E.; Butterfield, D.; Seed, K. A semi-distributed integrated flow and nitrogen model for multiple source assessment in catchments (INCA): Part II—application to large river basins in south Wales and eastern England. Sci. Total Environ. 1998, 210–211, 559–583. [Google Scholar] [CrossRef]
  28. Wade, A.J.; Durand, P.; Beaujouan, V.; Wessel, W.; Raat, K.J.; Whitehead, P.G.; Butterfield, D.; Rankinen, K.; Lepisto, A. A nitrogen model for European catchments: INCA, new model structure and equations. Hydrol. Earth Syst. Sci. 2002, 6, 559–582. [Google Scholar] [CrossRef]
  29. Wade, A.J.; Whitehead, P.G.; Butterfield, D. The Integrated Catchments model of Phosphorus dynamics (INCA-P), a new approach for multiple source assessment in heterogeneous river systems: Model structure and equations. Hydrol. Earth Syst. Sci. 2002, 6, 583–606. [Google Scholar] [CrossRef] [Green Version]
  30. Lazar, A.N.; Butterfield, D.; Futter, M.N.; Rankinen, K.; Thouvenot-Korppoo, M.; Jarritt, N.; Lawrence, D.S.; Wade, A.J.; Whitehead, P.G. An assessment of the fine sediment dynamics in an upland river system: INCA-Sed modifications and implications for fisheries. Sci. Total Environ. 2010, 408, 2555–2566. [Google Scholar] [CrossRef]
  31. Crossman, J.; Whitehead, P.; Futter, M.; Jin, L.; Shahgedanova, M.; Castellazzi, M.; Wade, A. The interactive responses of water quality and hydrology to changes in multiple stressors, and implications for the long-term effective management of phosphorus. Sci. Total Environ. 2013, 454–455, 230–244. [Google Scholar] [CrossRef]
  32. Jin, L.; Whitehead, P.G.; Futter, M.N.; Lu, Z. Modelling the impacts of climate change on flow and nitrate in the River Thames: Assessing potential adaptation strategies. Hydrol. Res. 2012, 43, 902–916. [Google Scholar] [CrossRef]
  33. Whitehead, P.G.; Crossman, J.; Balana, B.B.; Futter, M.N.; Comber, S.D.W.; Jin, L.; Skuras, D.; Wade, A.J.; Bowes, M.J.; Read, D.S. A cost-effectiveness analysis of water security and water quality: Impacts of climate and land-use change on the River Thames system. Philos. Trans. R. Soc. A Math. Phys. Eng. Sci. 2013, 371, 20120413. [Google Scholar] [CrossRef] [Green Version]
  34. Whitehead, P.; Leckie, H.; Rankinen, K.; Butterfield, D.; Futter, M.; Bussi, G. An INCA model for pathogens in rivers and catchments: Model structure, sensitivity analysis and application to the River Thames catchment, UK. Sci. Total Environ. 2016, 572, 1601–1610. [Google Scholar] [CrossRef] [PubMed]
  35. Bussi, G.; Whitehead, P.G.; Bowes, M.J.; Read, D.S.; Prudhomme, C.; Dadson, S.J. Impacts of climate change, land-use change and phosphorus reduction on phytoplankton in the River Thames (UK). Sci. Total Environ. 2016, 572, 1507–1519. [Google Scholar] [CrossRef] [Green Version]
  36. Lu, Q.; Futter, M.; Nizzetto, L.; Bussi, G.; Juergens, M.; Whitehead, P. Fate and transport of polychlorinated biphenyls (PCBs) in the River Thames catchment—Insights from a coupled multimedia fate and hydrobiogeochemical transport model. Sci. Total Environ. 2016, 572, 1461–1470. [Google Scholar] [CrossRef] [Green Version]
  37. Bussi, G.; Dadson, S.J.; Prudhomme, C.; Whitehead, P.G. Modelling the future impacts of climate and land-use change on suspended sediment transport in the River Thames (UK). J. Hydrol. 2016, 542, 357–372. [Google Scholar] [CrossRef] [Green Version]
  38. Bussi, G.; Janes, V.; Whitehead, P.G.; Dadson, S.J.; Holman, I.P. Dynamic response of land use and river nutrient concentration to long-term climatic changes. Sci. Total Environ. 2017, 590, 818–831. [Google Scholar] [CrossRef]
  39. Futter, M.N.; Erlandsson, M.A.; Butterfield, D.; Whitehead, P.G.; Oni, S.K.; Wade, A.J. PERSiST: A flexible rainfall-runoff modelling toolkit for use with the INCA family of models. Hydrol. Earth Syst. Sci. 2014, 18, 855–873. [Google Scholar] [CrossRef] [Green Version]
  40. Whitehead, P.G.; Costigan, P.A.; Bridges, E.M.; Powlson, D.S.; Goss, M.J.; Goulding, K. Modelling nitrate from agriculture into public water supplies. Philos. Trans. R. Soc. B Biol. Sci. 1990, 329, 403–410. [Google Scholar] [CrossRef]
  41. Nizzetto, L.; Futter, M.; Langaas, S. Are Agricultural Soils Dumps for Microplastics of Urban Origin? Environ. Sci. Technol. 2016, 50, 10777–10779. [Google Scholar] [CrossRef] [PubMed]
  42. Horton, A.A.; Dixon, S.J. Microplastics: An introduction to environmental transport processes. Wiley Interdiscip. Rev. Water 2018, 5, e1268. [Google Scholar] [CrossRef] [Green Version]
  43. Gupta, H.V.; Kling, H.; Yilmaz, K.K.; Martinez, G.F. Decomposition of the mean squared error and NSE performance criteria: Implications for improving hydrological modelling. J. Hydrol. 2009, 377, 80–91. [Google Scholar] [CrossRef] [Green Version]
  44. Smith, L. Plastic Waste. House of Commons Briefing Paper, Number 08515, 31 March 2020. Available online: www.commonslibrary.parliament.uk/research-briefings (accessed on 17 November 2020).
  45. Verschoor, A.J.; de Valk, E.; Potential Measures against Microplastic Emissions to Water. National Institute for Public Health and Environment, NL. Report 2017-0193. Available online: www.rivm.nl (accessed on 21 July 2020).
  46. Tournier, V.; Topham, C.M.; Gilles, A.; David, B.; Folgoas, C.; Moya-Leclair, E.; Kamionka, E.; Desrousseaux, M.-L.; Texier, H.; Gavalda, S.; et al. An engineered PET depolymerase to break down and recycle plastic bottles. Nat. Cell Biol. 2020, 580, 216–219. [Google Scholar] [CrossRef]
  47. Simon, M.; Vianello, A.; Vollertsen, J. Removal of >10 µm Microplastic Particles from Treated Wastewater by a Disc Filter. Water 2019, 11, 1935. [Google Scholar] [CrossRef] [Green Version]
  48. Talvitie, J.; Mikola, A.; Koistinen, A.; Setälä, O. Solutions to microplastic pollution—Removal of microplastics from wastewater effluent with advanced wastewater treatment technologies. Water Res. 2017, 123, 401–407. [Google Scholar] [CrossRef] [PubMed] [Green Version]
  49. Eur Eau Microplastics and the Water Sector—Current Knowledge, Challenges and Possible Solutions. Briefing Note, 6 August 2019. Available online: www.eureau.org (accessed on 15 November 2020).
  50. Toussaint, B.; Raffael, B.; Angers-Loustau, A.; Gilliland, D.; Kestens, V.; Petrillo, M.; Rio-Echevarria, I.M.; Eede, G.V.D. Review of micro- and nanoplastic contamination in the food chain. Food Addit. Contam. Part A 2019, 36, 639–673. [Google Scholar] [CrossRef] [PubMed]
Figure 1. The non-tidal part of the Thames River catchment used in the simulations showing reach endpoints and sub-catchment structure.
Water 13 00861 g001
Figure 2. Calibration (2008–2012) and validation (2013–2018) results of the INCA microplastics model in the River Thames at two stations (Days Weir and Kingston), in terms of flow (upper plots) and sediment mass (lower plots). Black: observed, red: simulated.
Water 13 00861 g002
Figure 3. Comparison of the three scenarios in terms of average annual suspended mass load (kg/year) per microplastics class and per reach.
Water 13 00861 g003
Figure 4. Model results showing microplastic loads (kg/year) at reach locations down the River Thames (top) and loads at Oxford for the different microplastics classes and for the three scenarios (bottom).
Water 13 00861 g004
Figure 5. Microplastic Loads at Kingston moving from freshwater River Thames to the estuary system.
Water 13 00861 g005
Figure 6. Microplastic sources, pathways, legislation and mitigation measures.
Water 13 00861 g006
Table 1. INCA model reaches characteristics.
ReachDownstream SectionCatchment Area (km2)Reach Length (m)Effluent Flow (m3/s)Mean Slope %
Arable
%
Pasture
%
Forest
%
Urban
1Eynsham160954,1000.500.000574.316.52.86.4
2Oxford52612,4200.140.00041860.216.3518.5
3Sutton Courtenay128818,9600.700.00037472.415.32.210
4Days Weir5893200.060.00012878.802.818.3
5Reading115435,1500.430.00027372.810.38.28.6
6Staines363270,4103.850.00040643.912.215.128.7
7Walton110295400.810.000138.813.125.322.7
8Kingston58977400.960.000330.515.417.736.3
Table 2. Average annual suspended Microplastic mass load (kg/year) by microplastics particle size and by river reach (scenario 1).
ClassMP1MP2MP3MP4Total
Eynsham7124514892713,460
Oxford36233547957139
Sutton Courtenay714591311,98917,923
Days Weir7134848899213,860
Reading305116,11433,88650,081
Staines320616288,816640,622930,374
Walton468737,82774,177112,137
Kingston407733,05665,40598,578
Table 3. Average annual suspended microplastics mass load (kg/year) by microplastic particle size and by river reach (scenario 2).
ClassMP1MP2MP3MP4Total
Eynsham711387394897017,509
Oxford3559380948179188
Sutton Courtenay7984863012,03021,651
Days Weir79267013902316,969
Reading30376423,79034,01061,594
Staines32021,131342,260641,5431,005,254
Walton46285044,68474,288121,868
Kingston40225238,33065,491106,113
Table 4. Average annual suspended microplastics mass load (kg/year) by microplastic particle size and by river reach (scenario 3).
ClassMP1MP2MP3MP4Total
Eynsham3569369744858754
Oxford2280190424094594
Sutton Courtenay44924315601510,826
Days Weir4463350745128485
Reading15188211,89517,00530,797
Staines16010,565171,130320,771502,627
Walton23142522,34237,14460,934
Kingston20112619,16532,74553,056
Publisher’s Note: MDPI stays neutral with regard to jurisdictional claims in published maps and institutional affiliations.

