
Groundwater Monitoring Systems to Understand Sea Water Intrusion Dynamics in the Mediterranean: The Neretva Valley and the Southern Venice Coastal Aquifers Case Studies

 ,
,  , , ,
, , ,
Abstract
1. Introduction
2. Areas of Interest
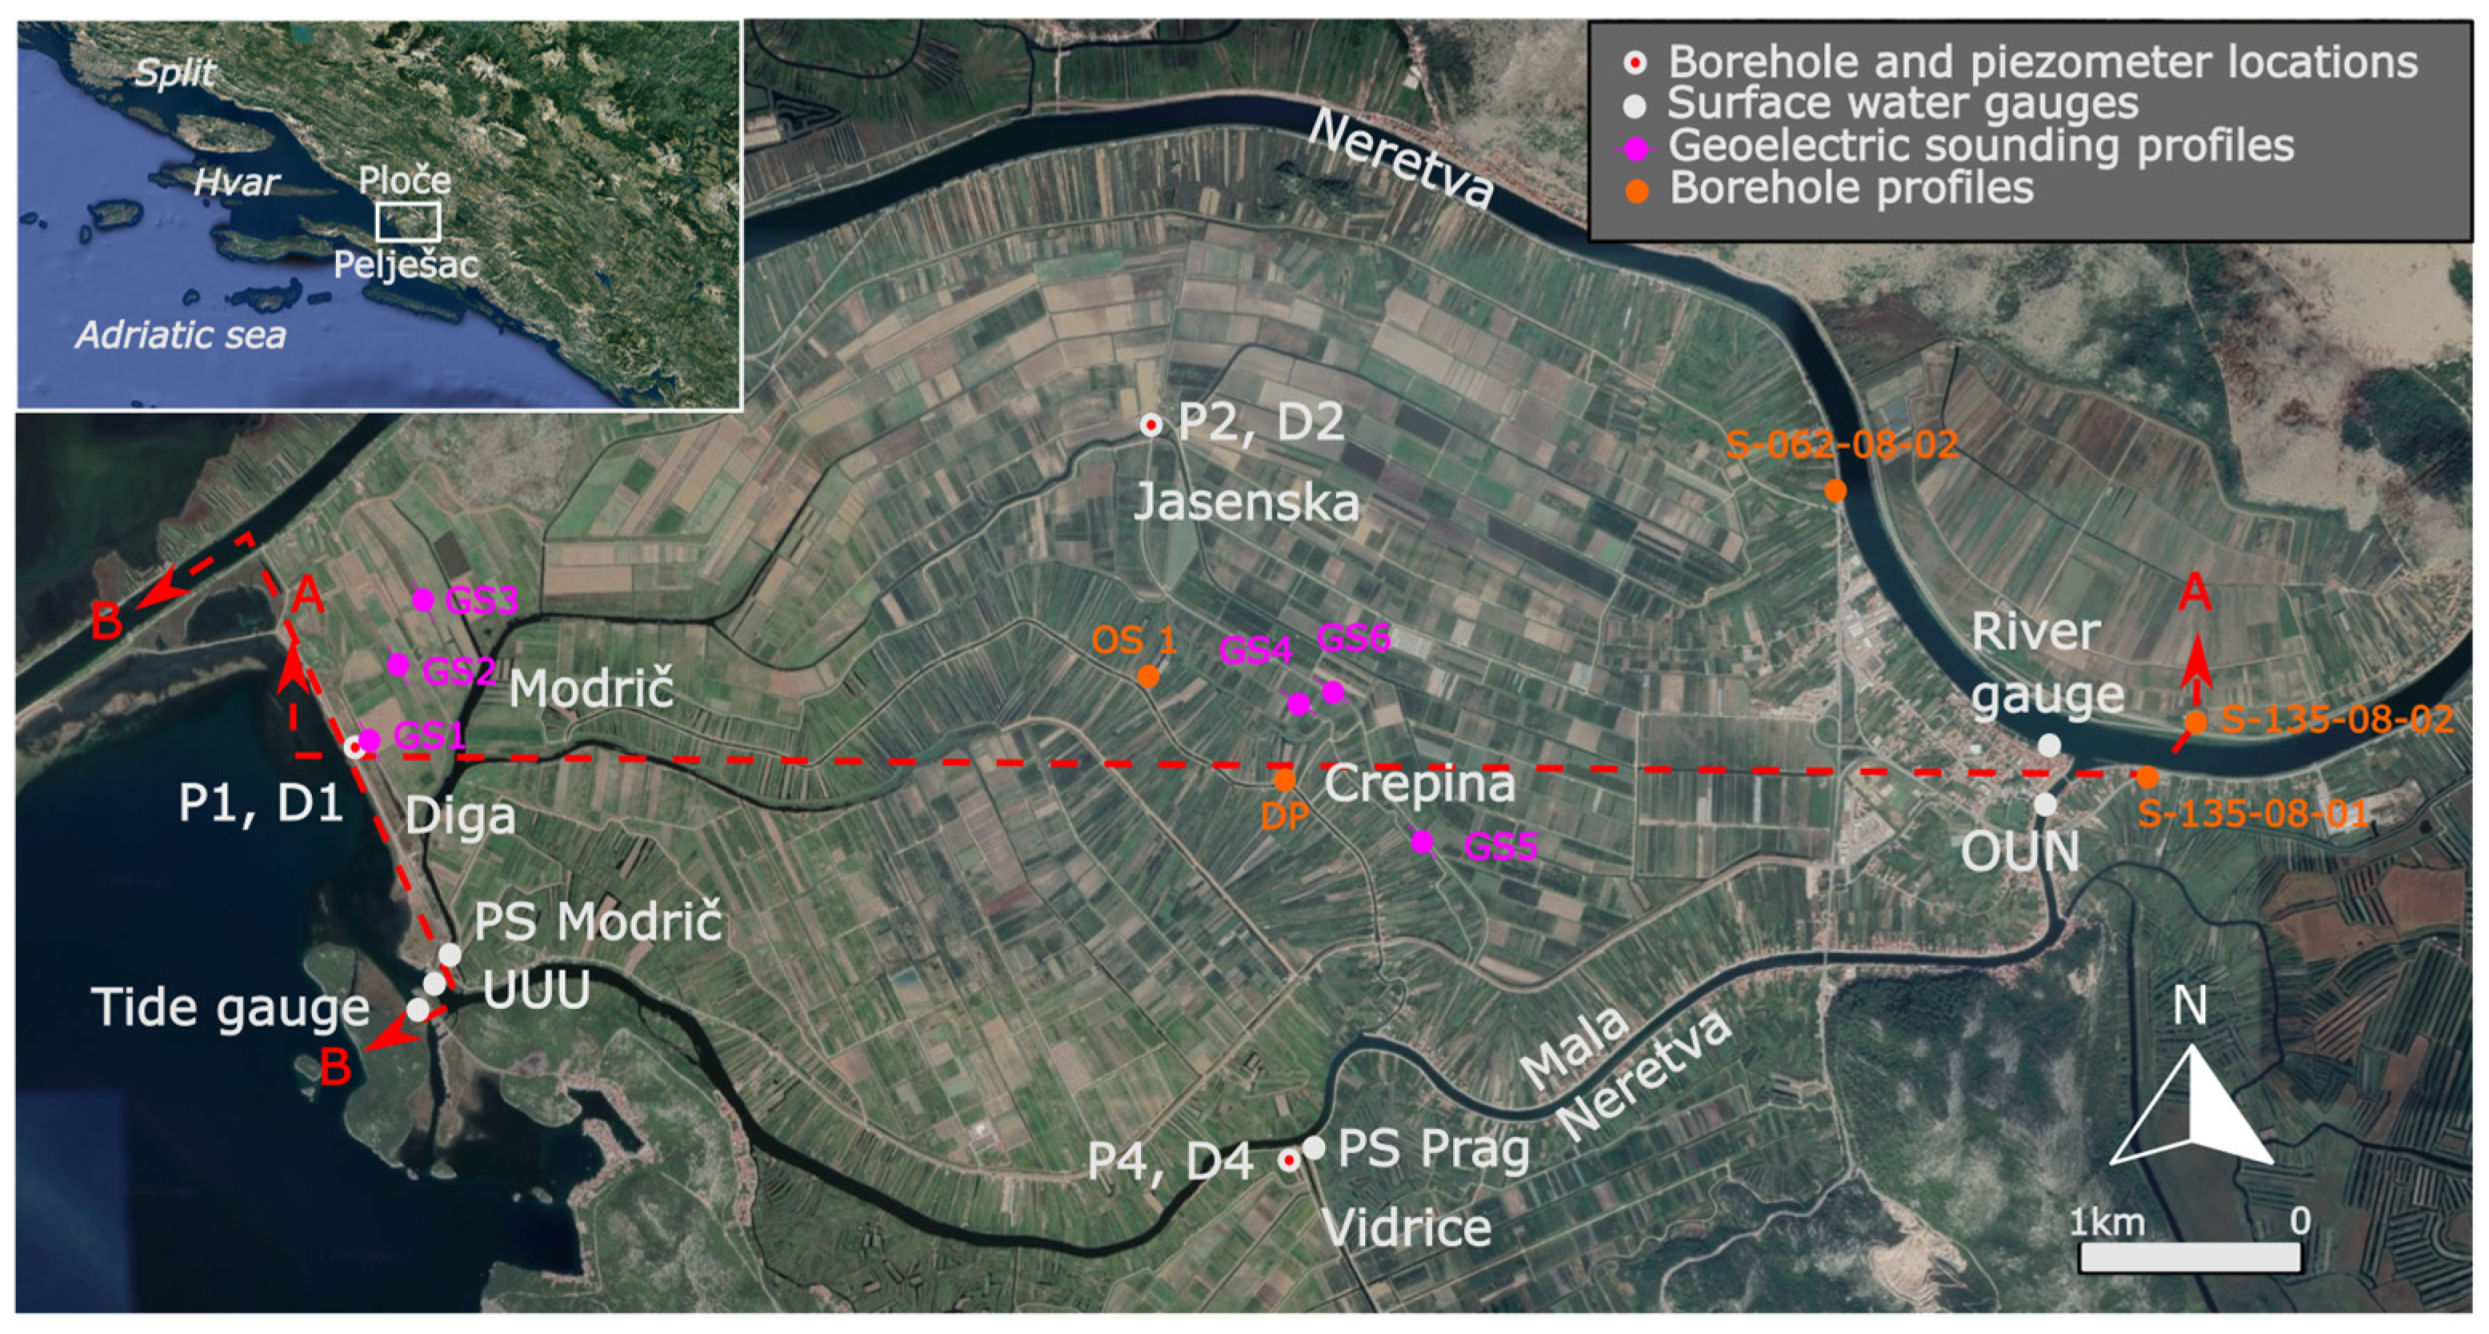
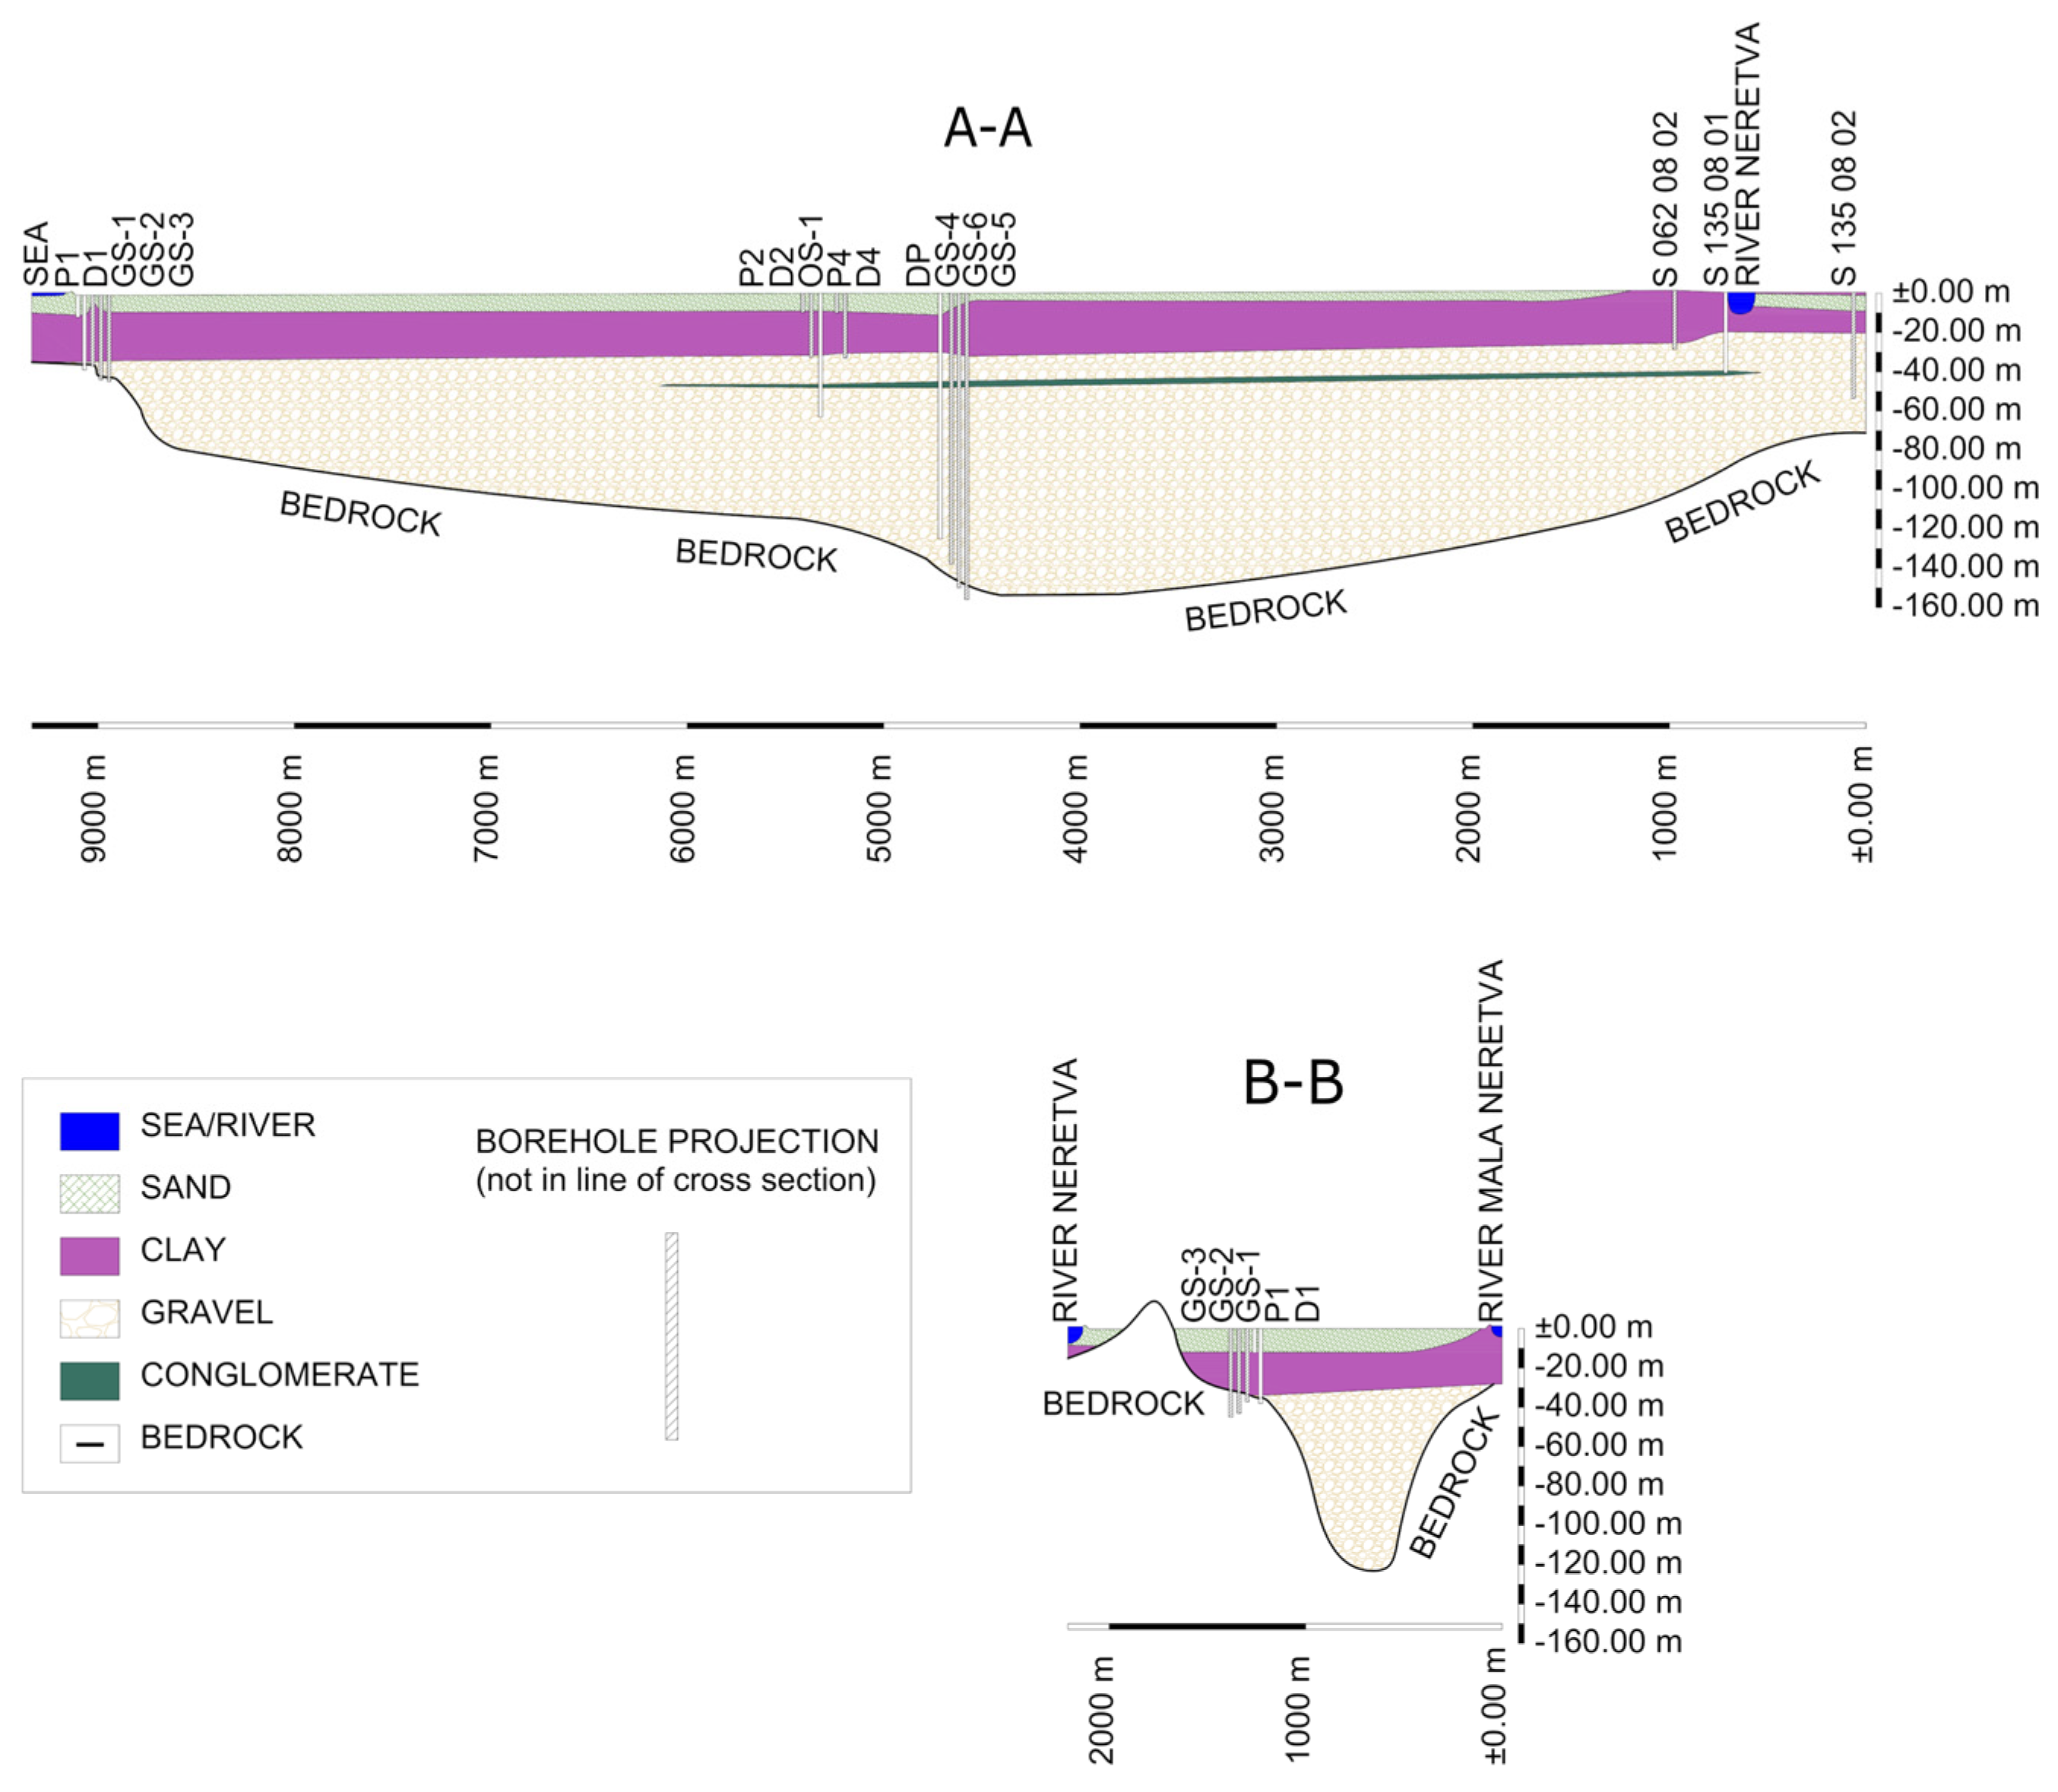
2.1. Neretva Coastal Aquifer
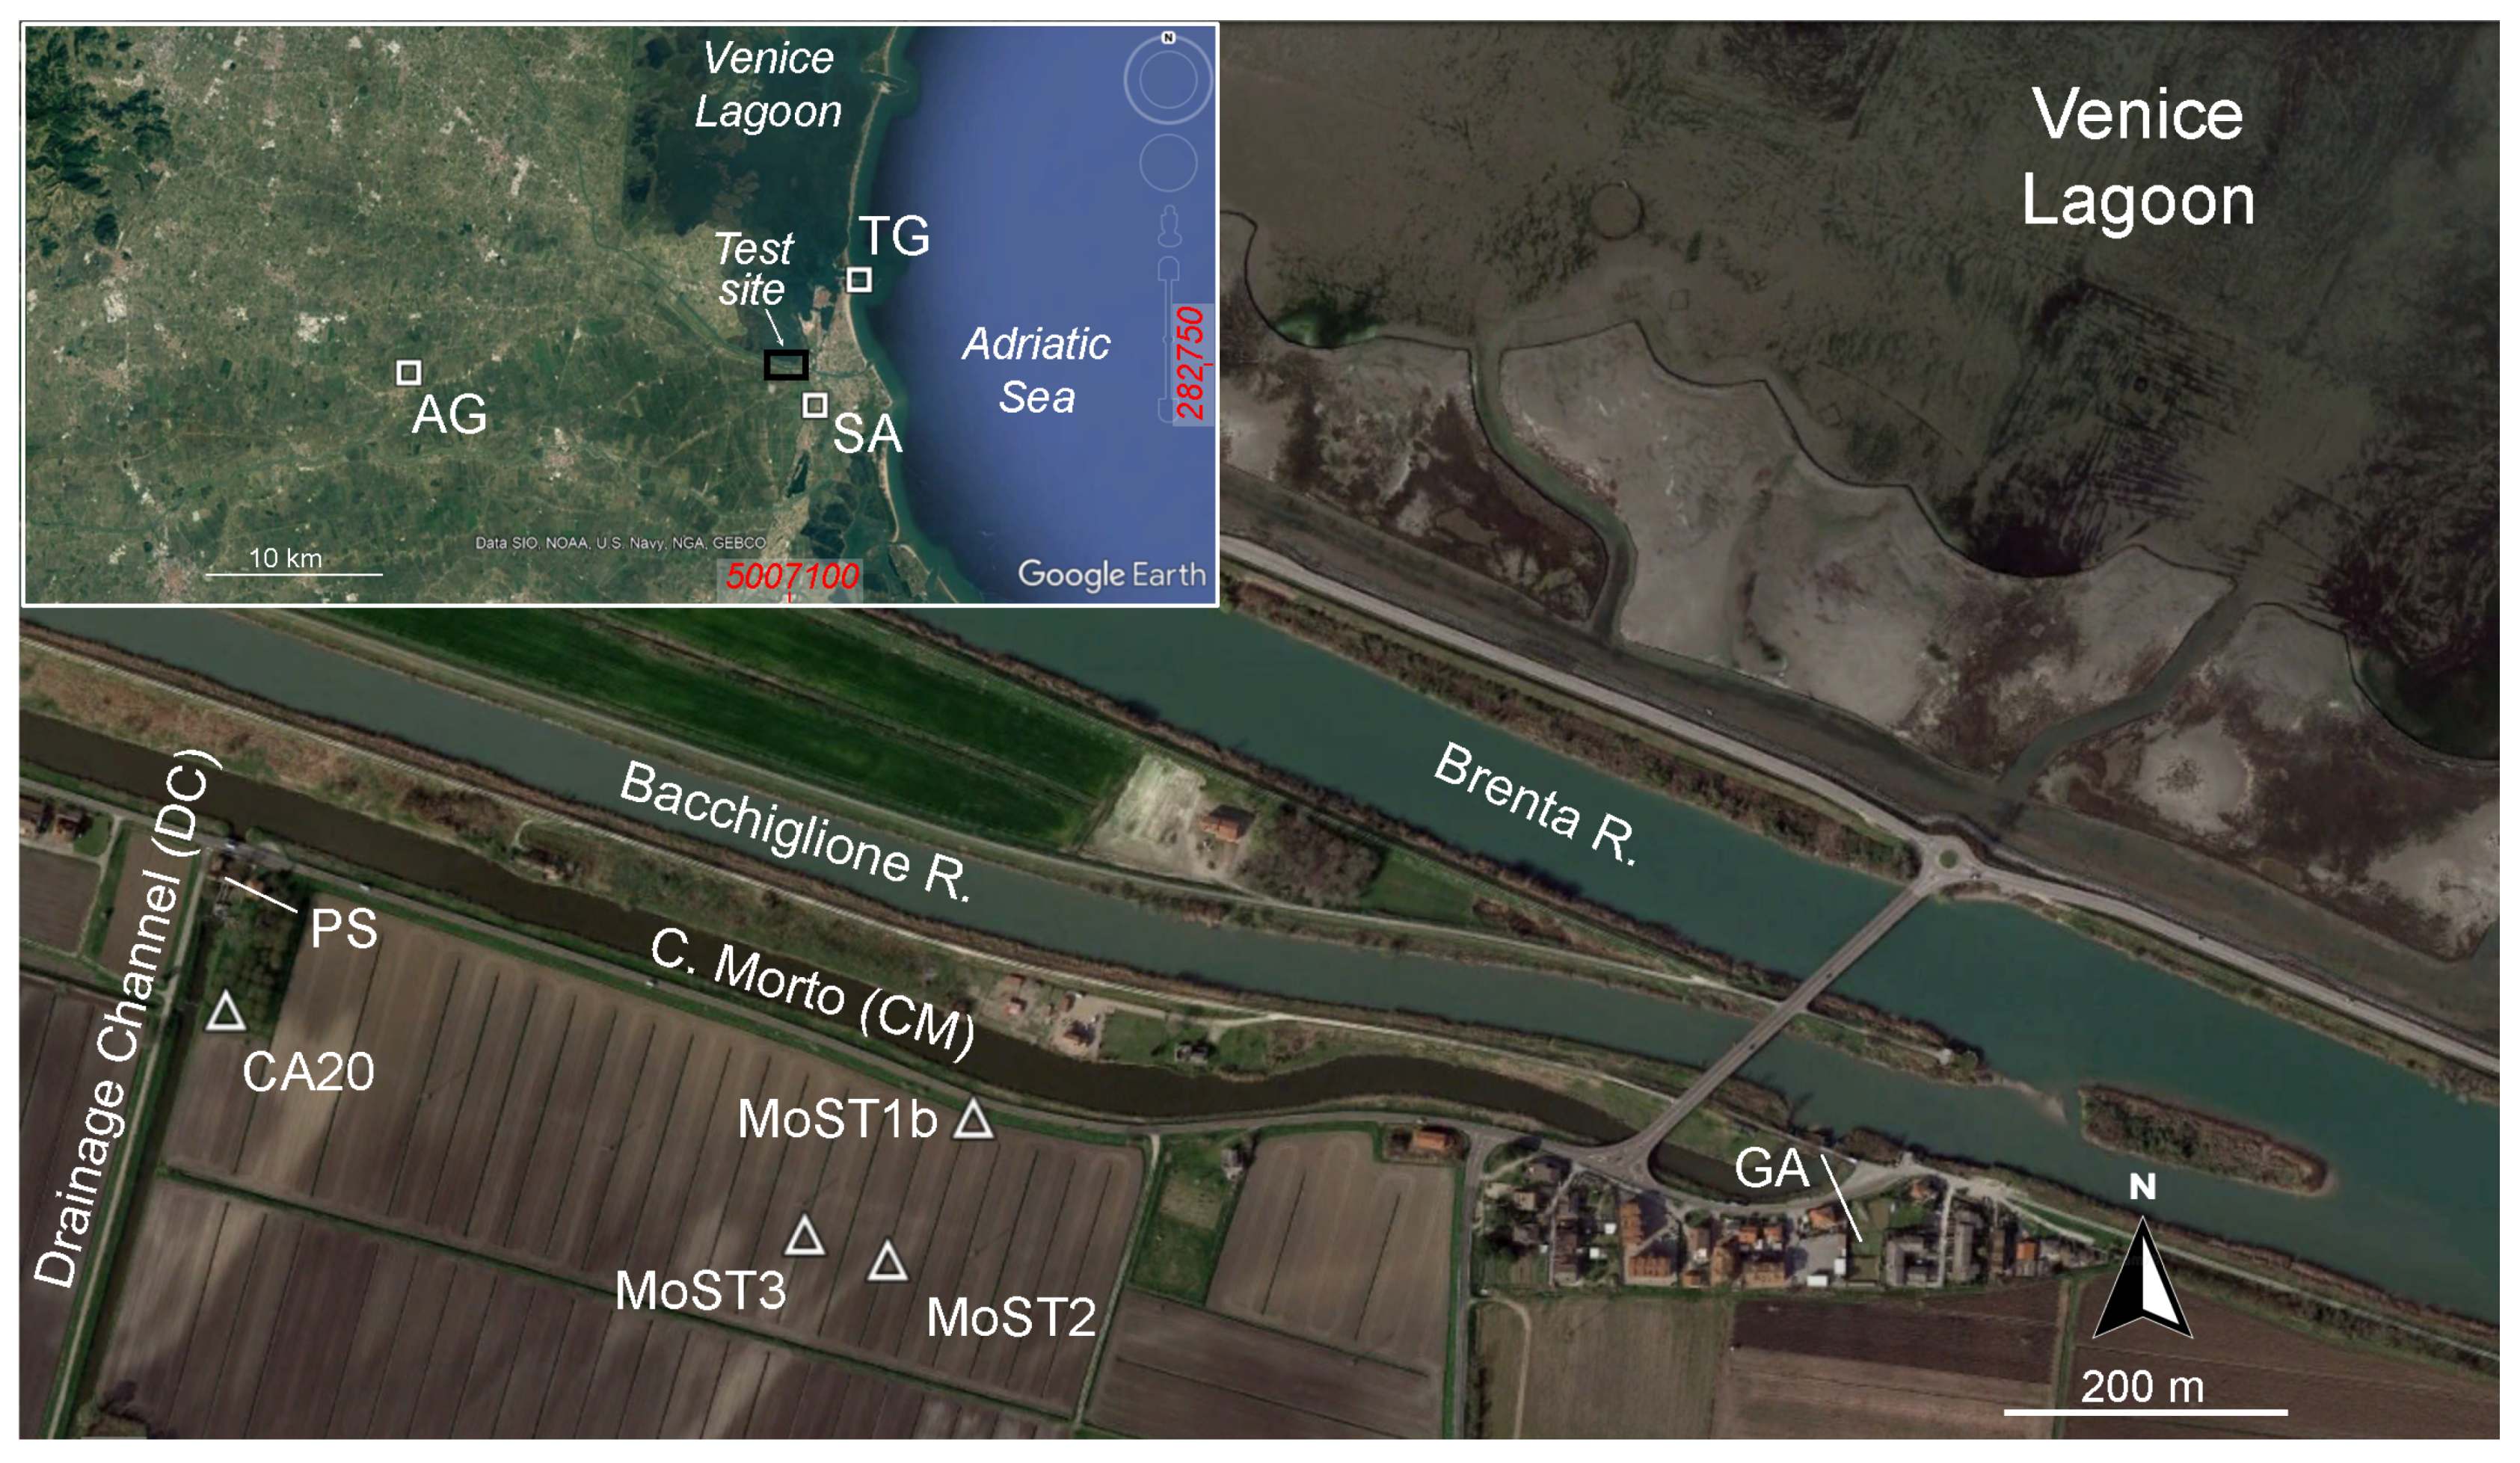
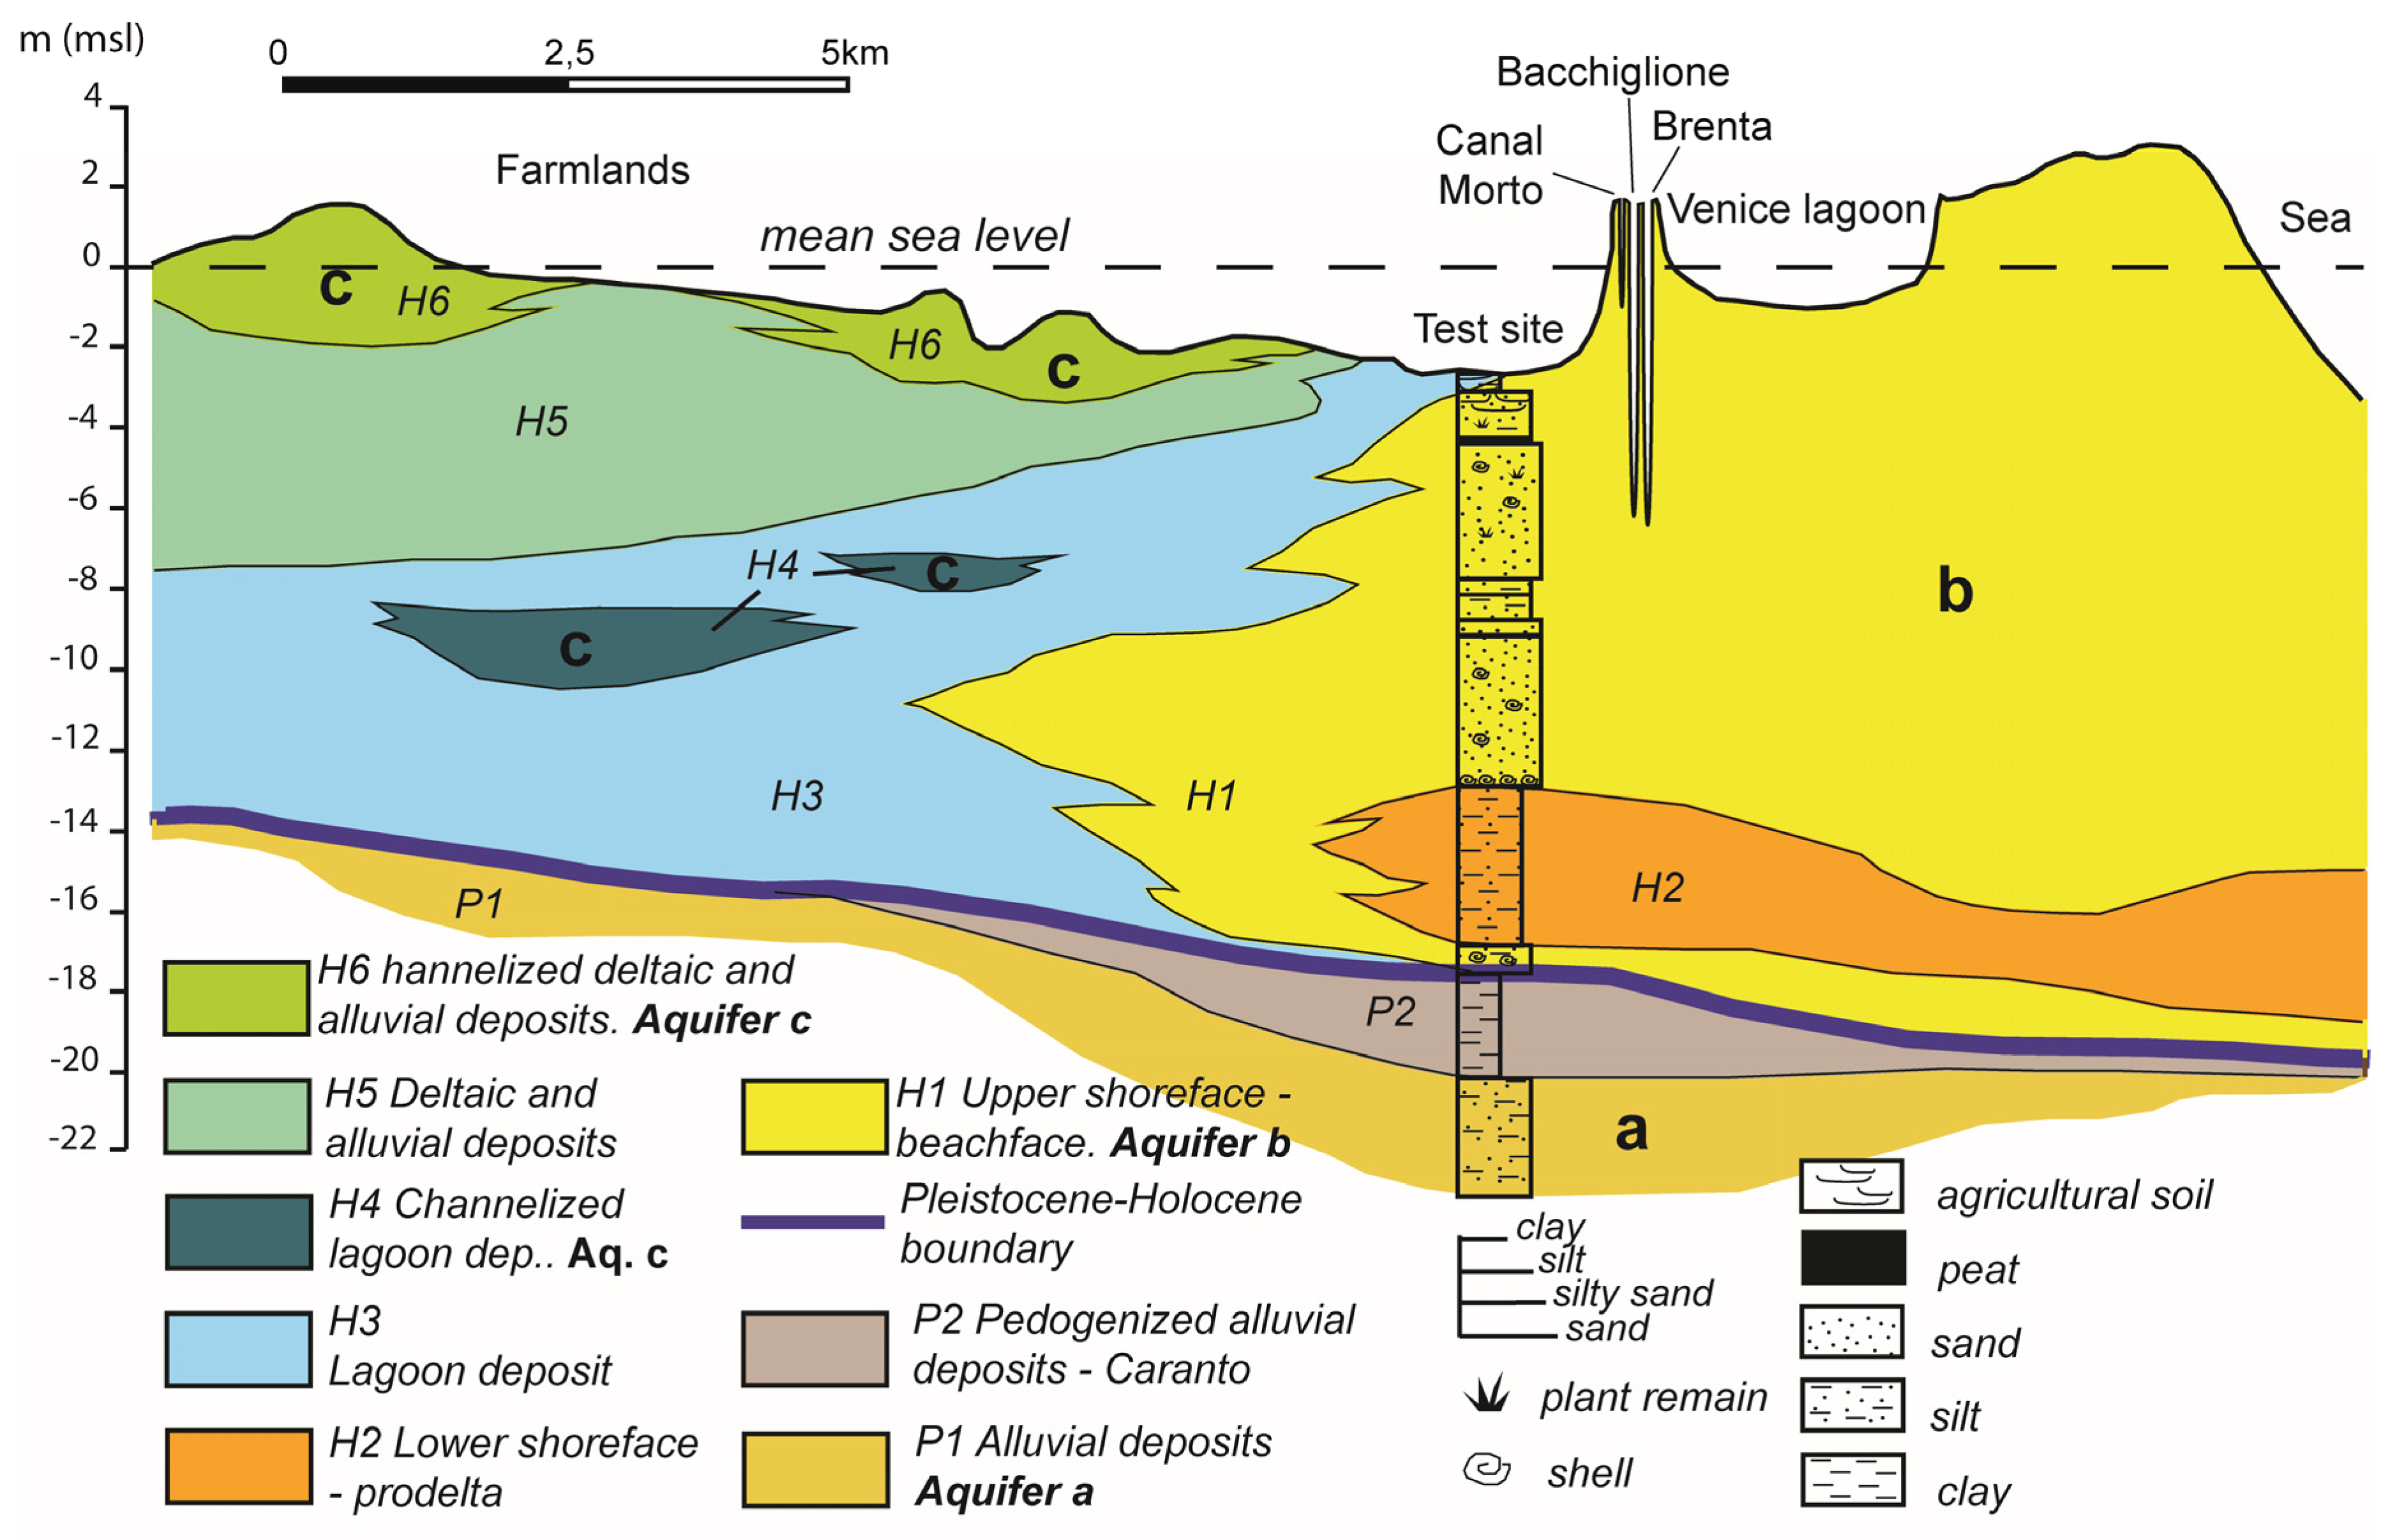
2.2. Venice Coastal Aquifer
3. Methodology
3.1. Monitoring Systems
3.1.1. Neretva Valley Aquifer System
3.1.2. Venice Aquifer System
3.2. Time Series Analysis
3.2.1. Cross-Correlation Analysis
3.2.2. Spectral Domain Analysis
4. Results
4.1. Neretva Valley Aquifer System
4.2. Venice Coastal System
4.2.1. Forcings
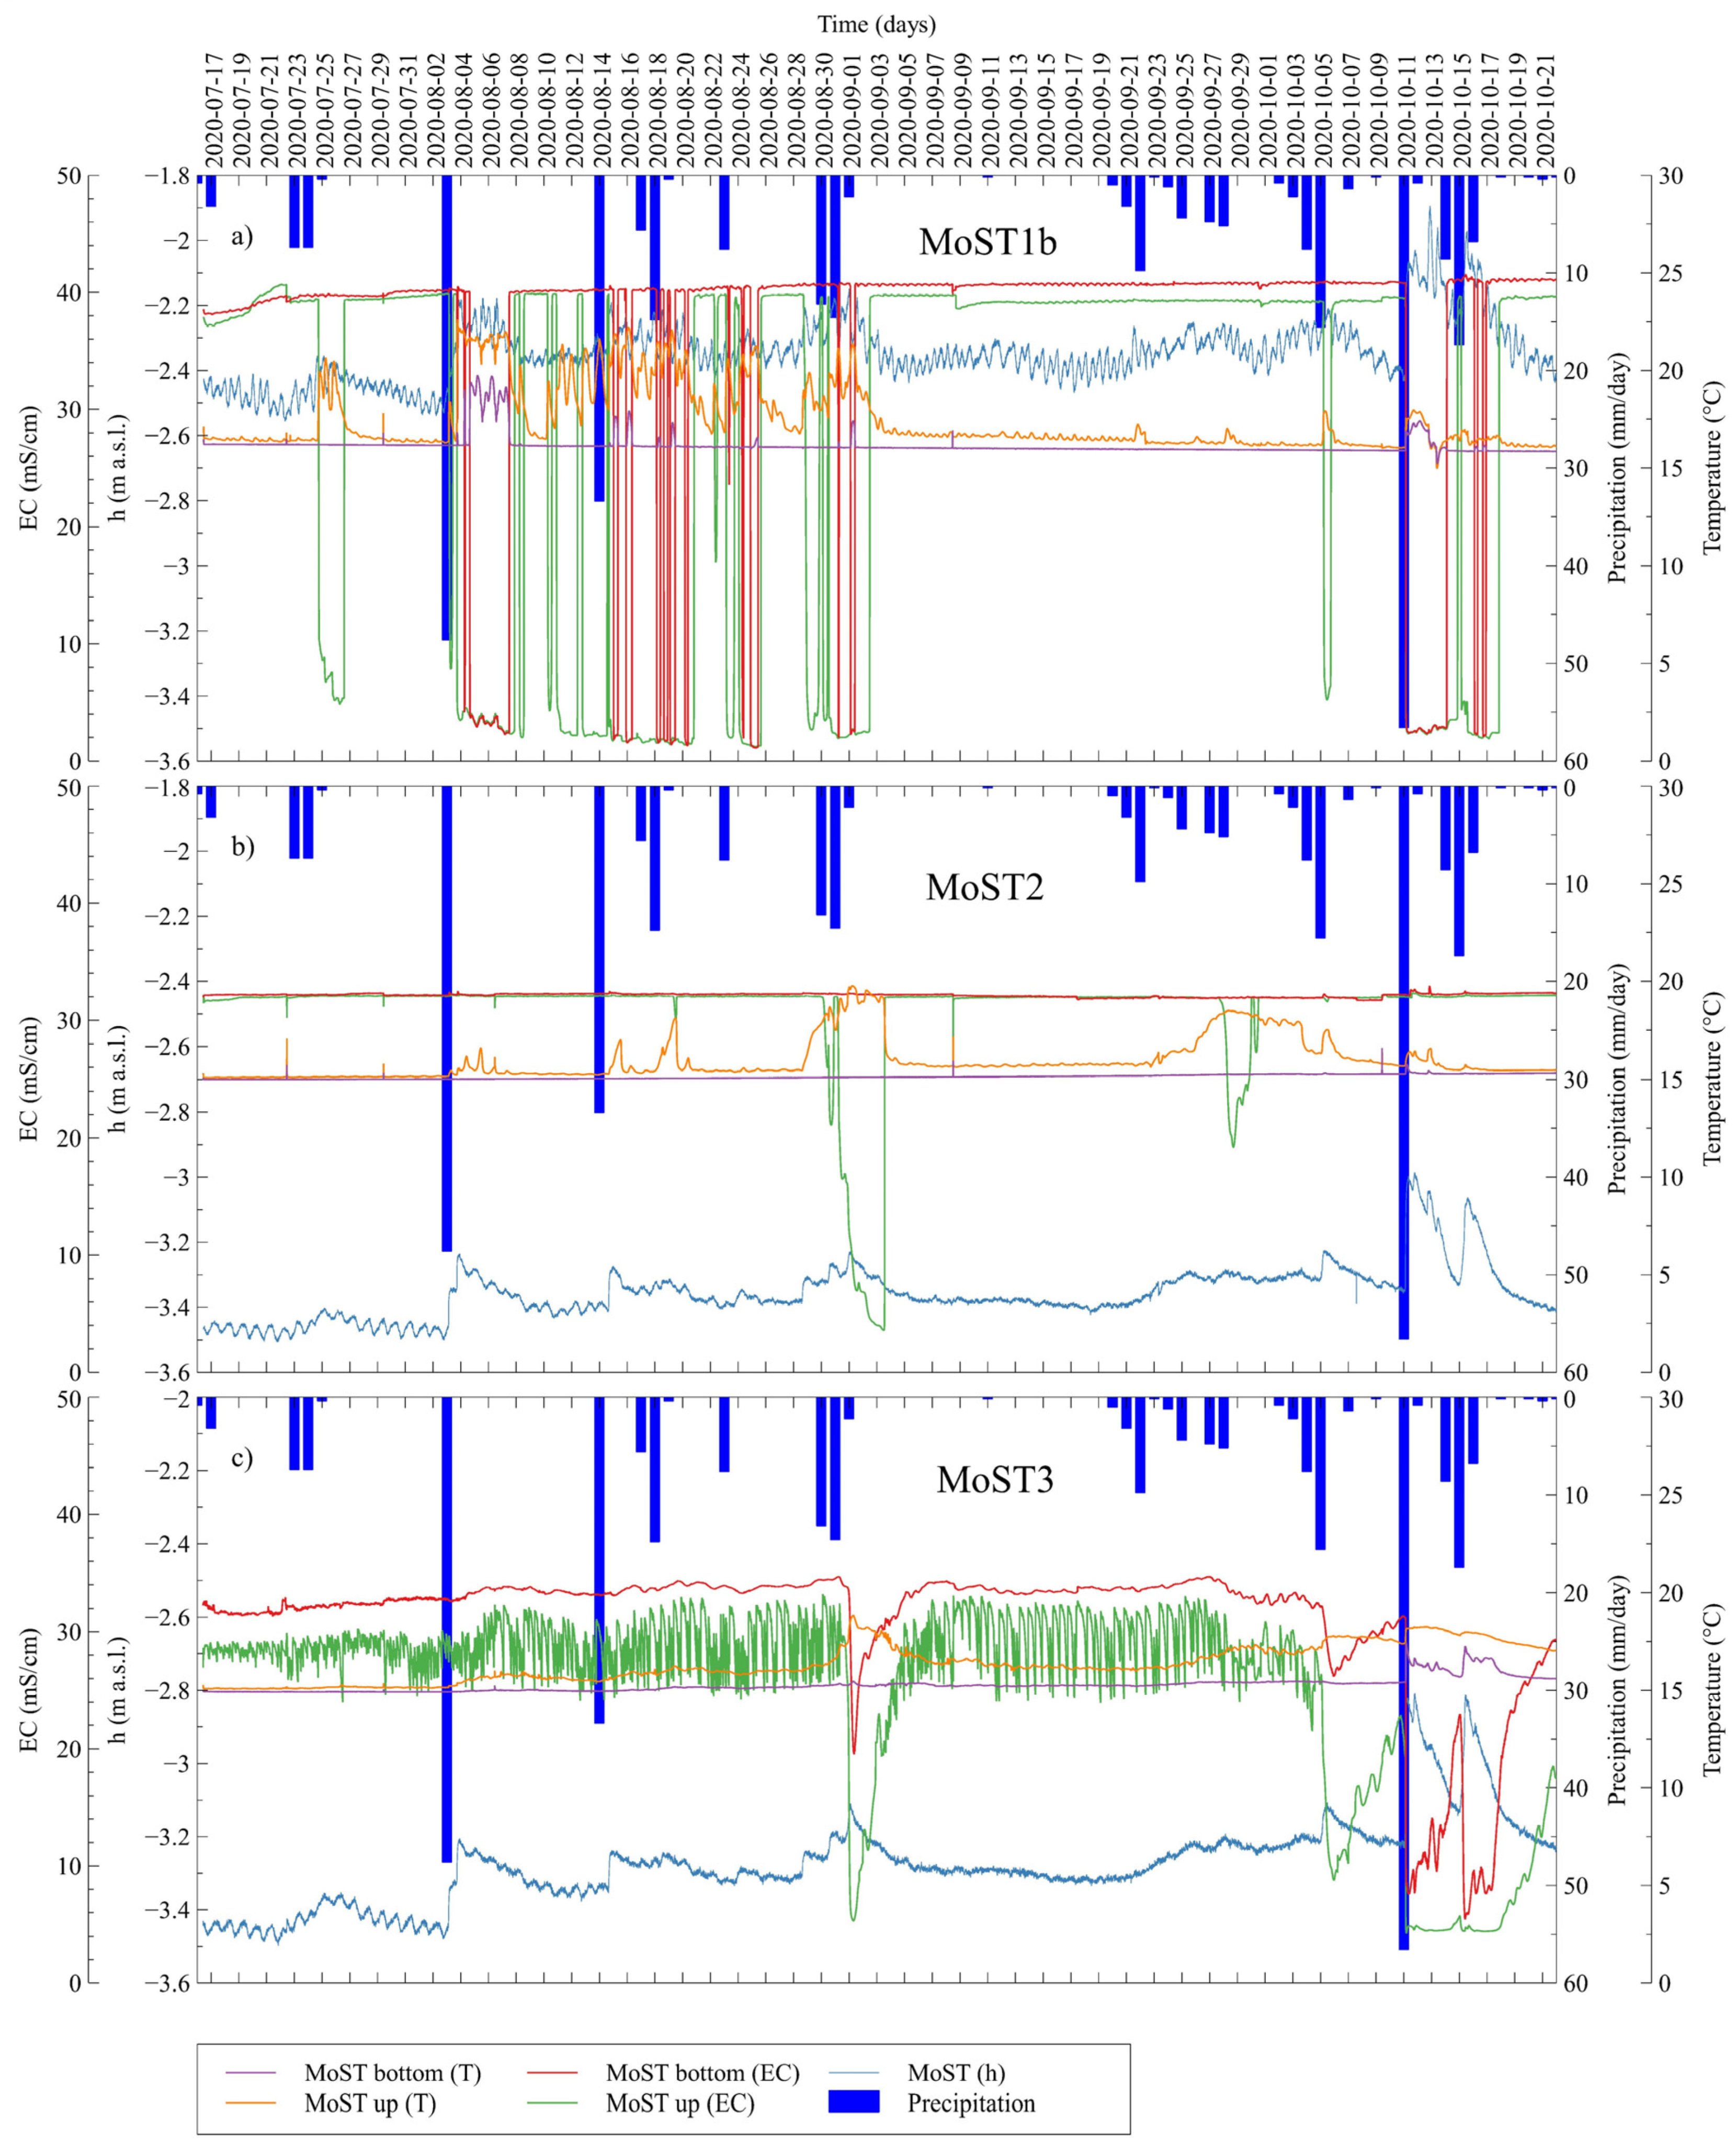
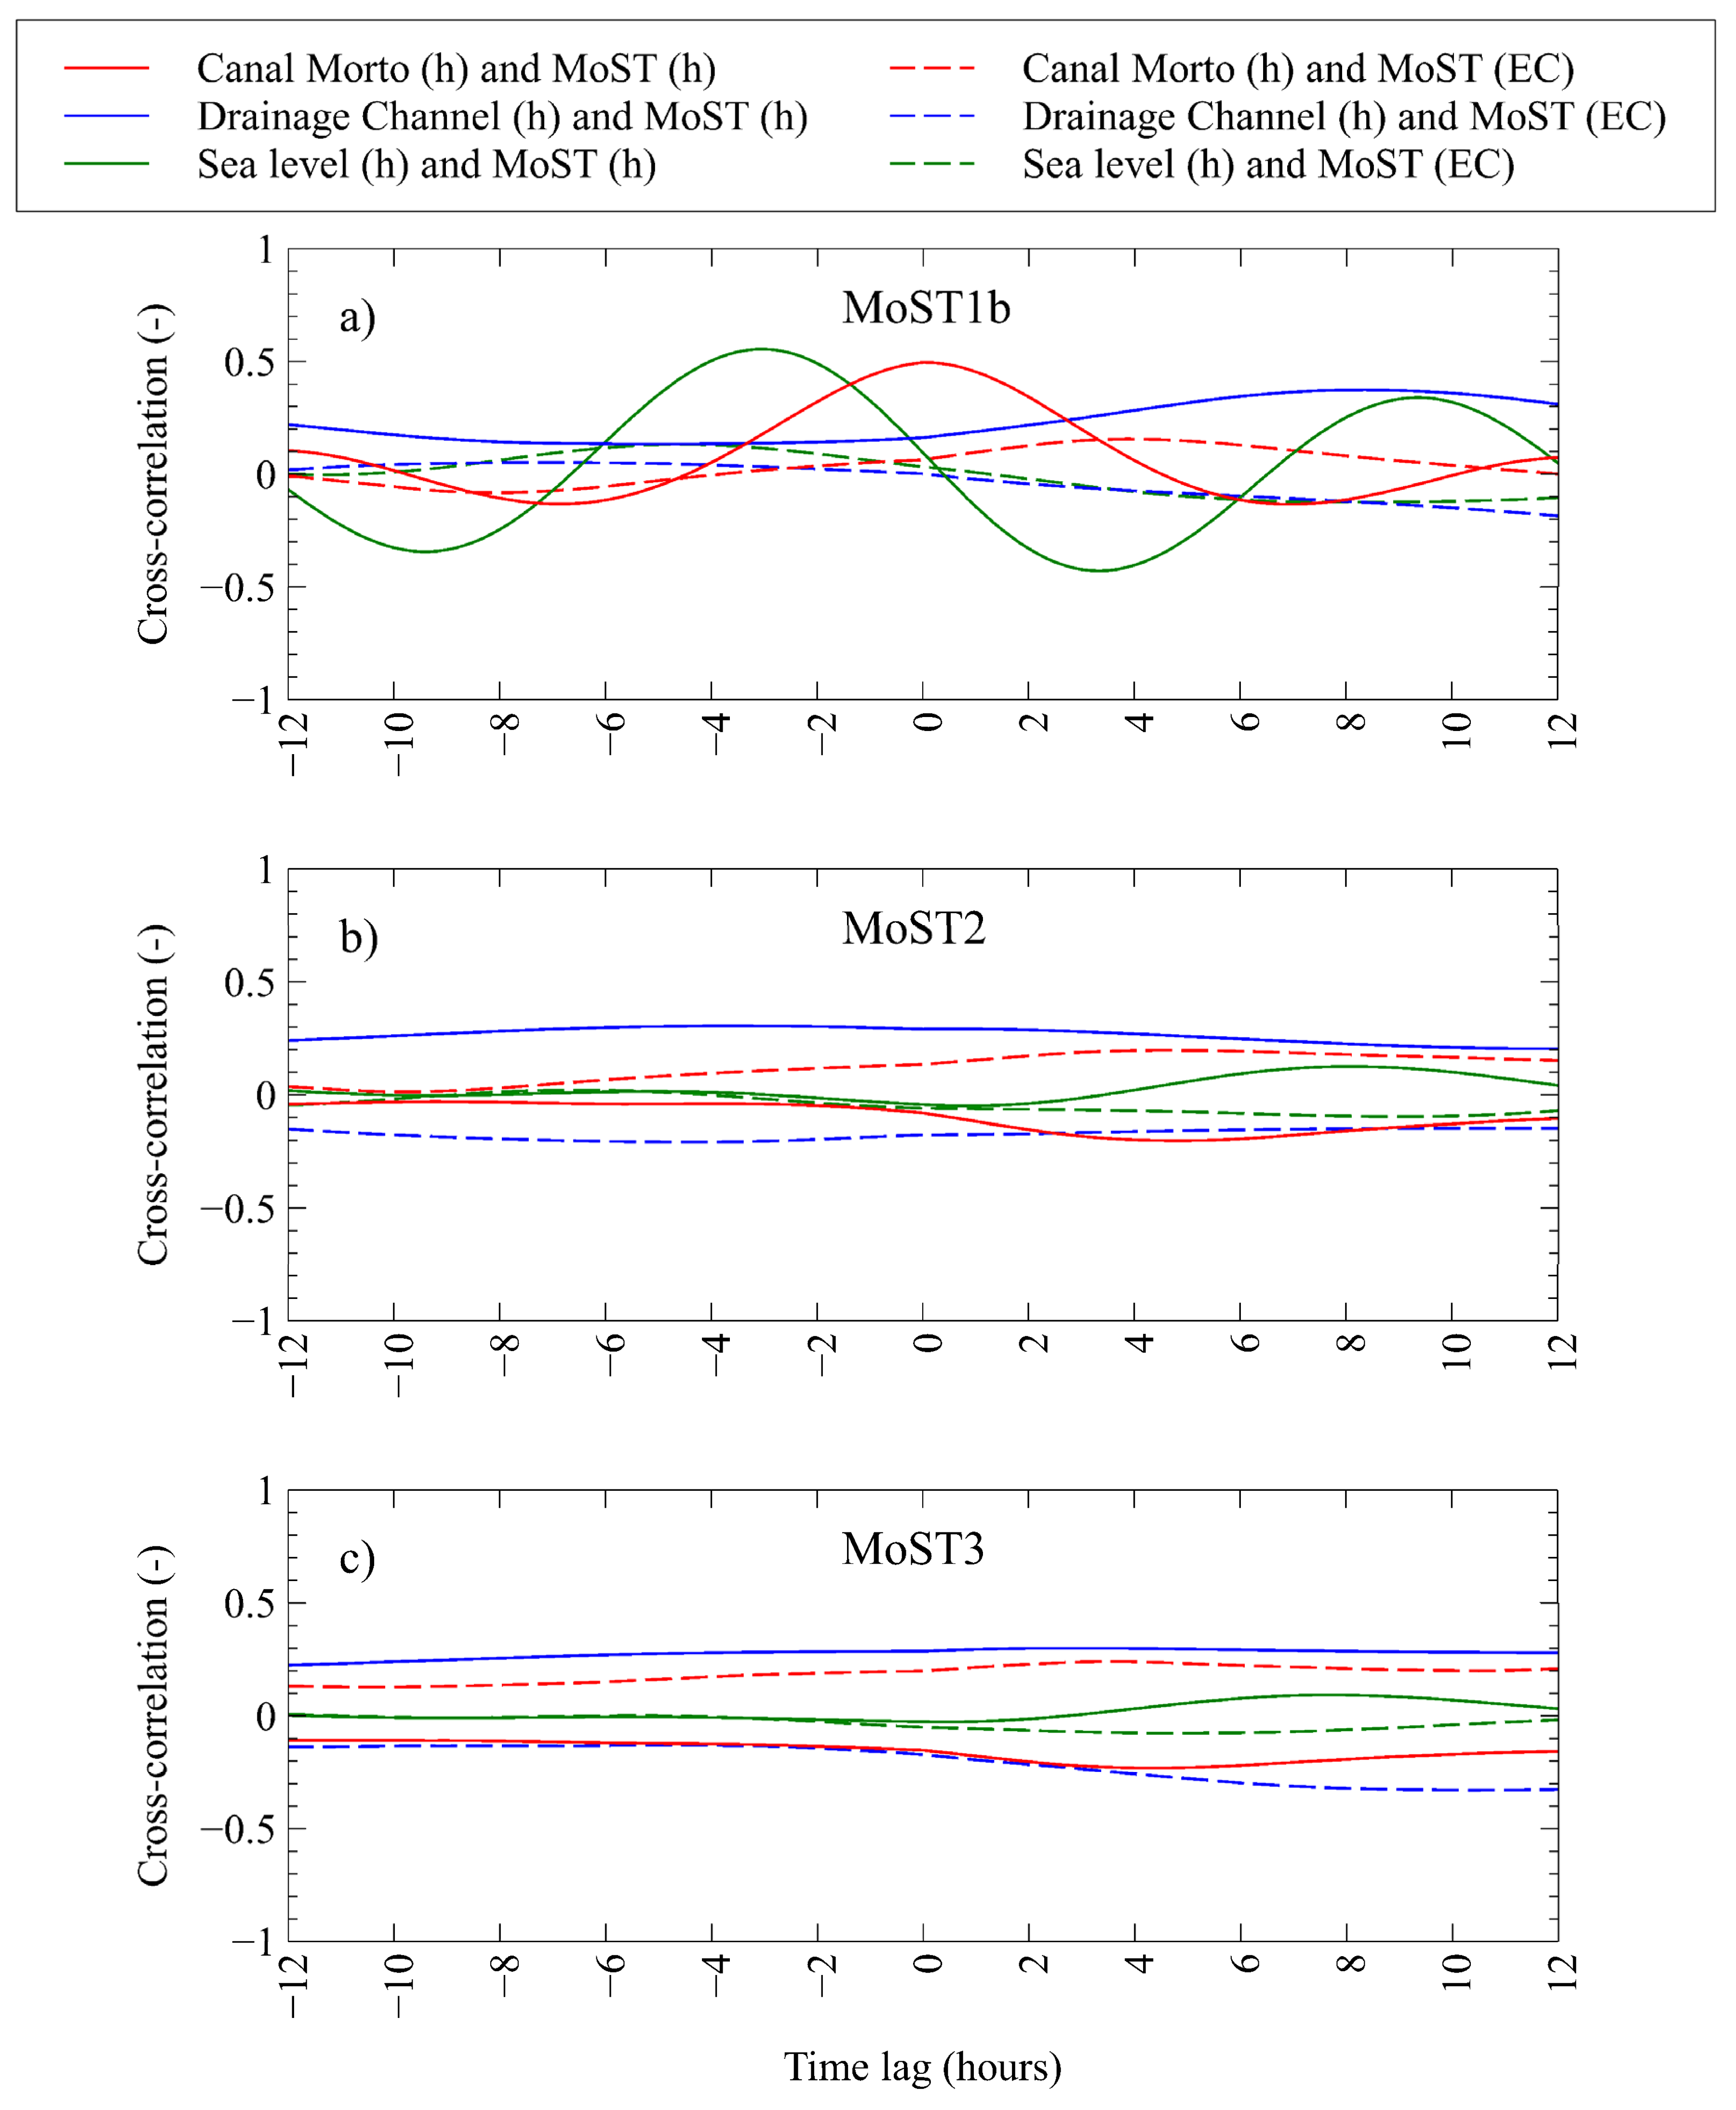
4.2.2. Phreatic Aquifer
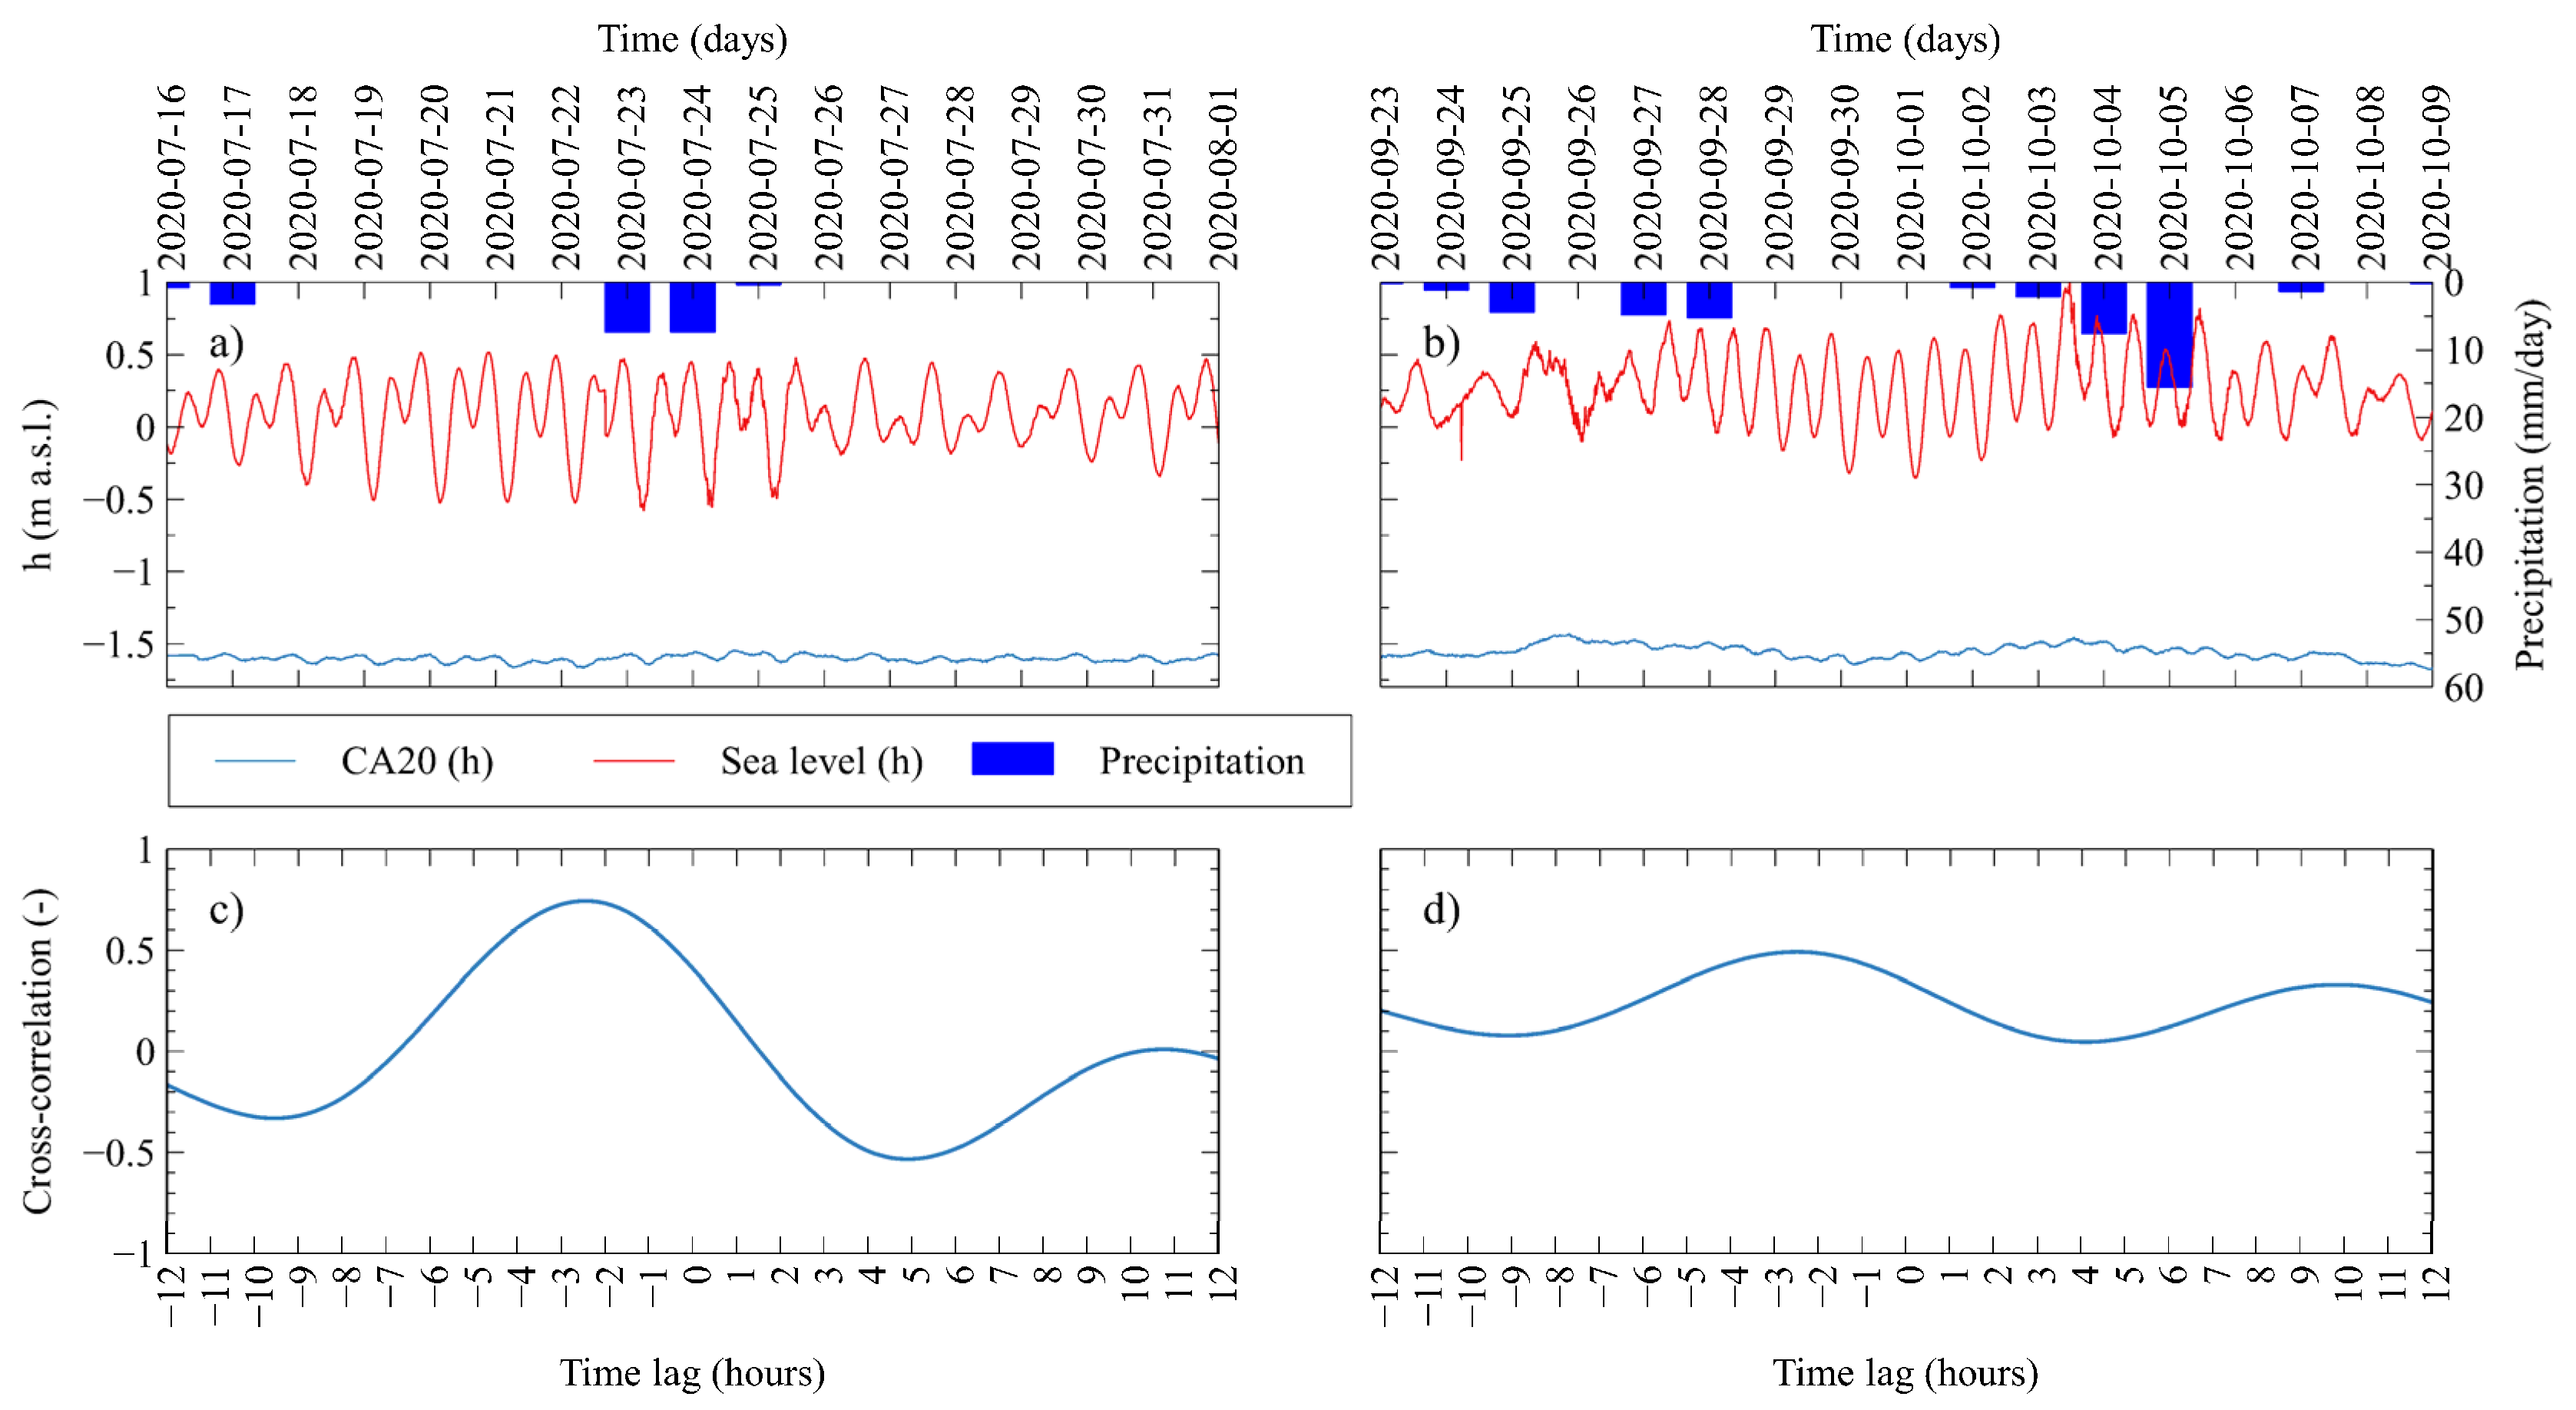
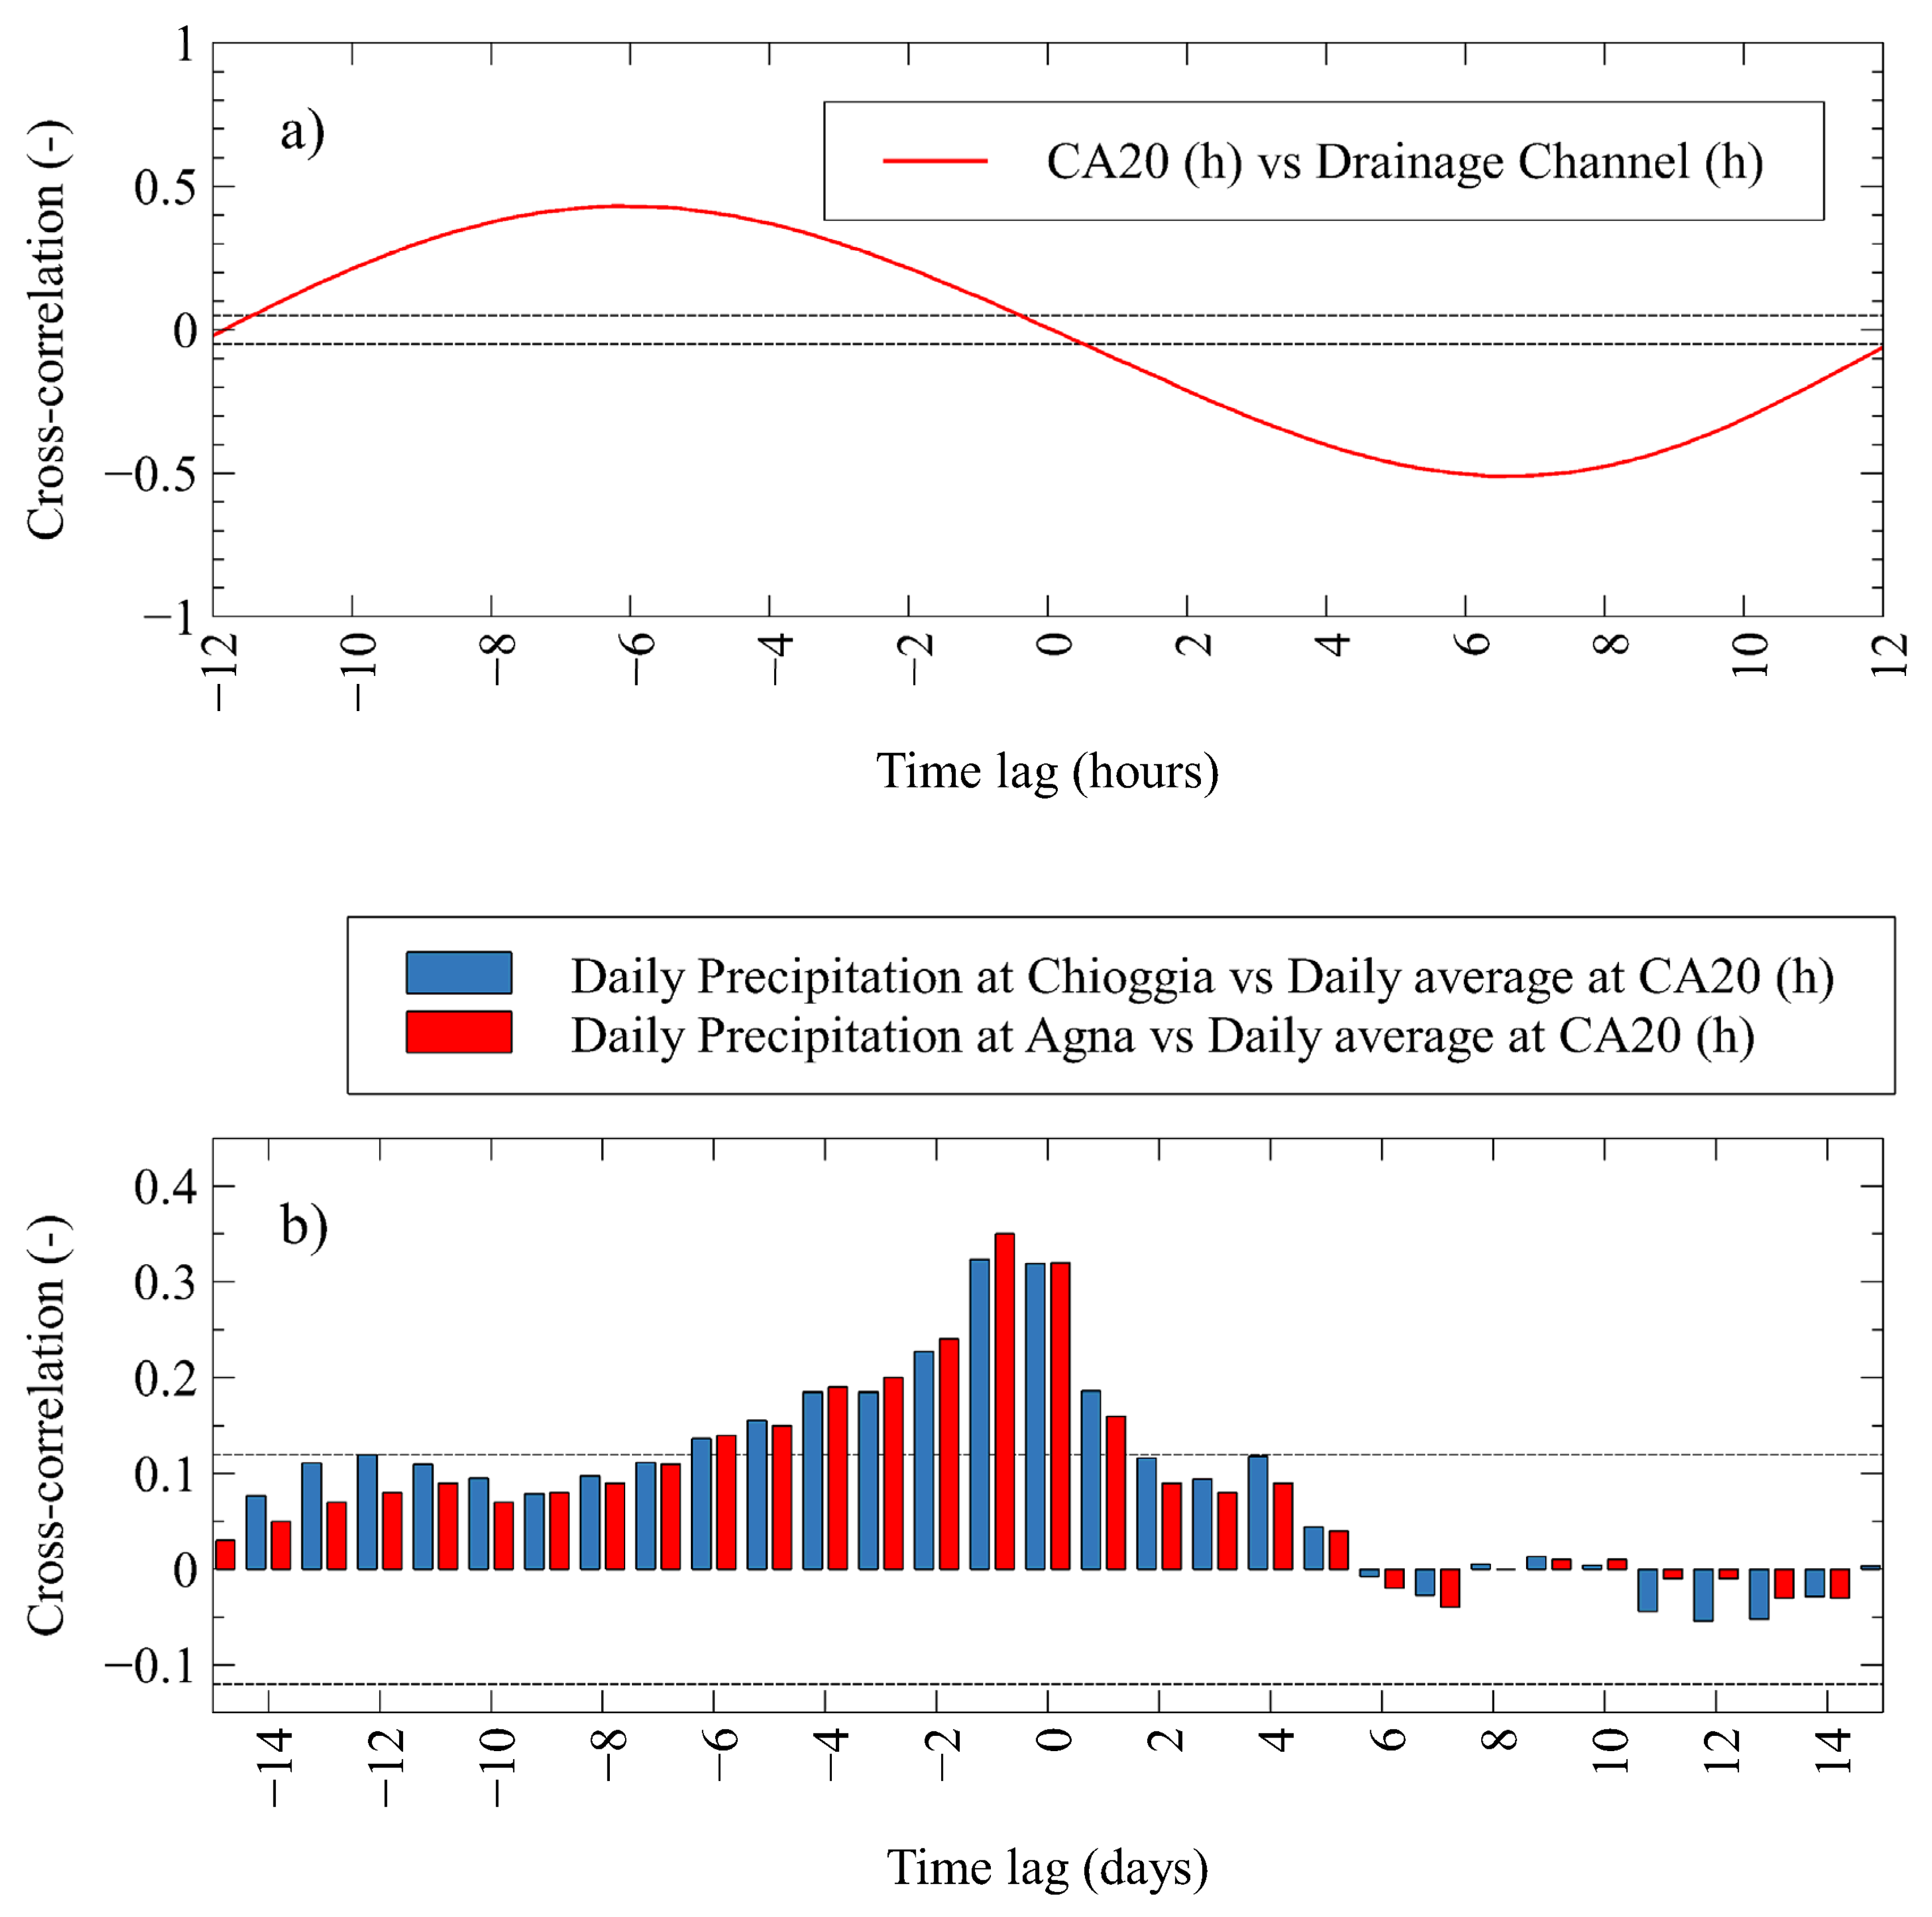
4.2.3. Confined Aquifer
5. Discussion
5.1. Neretva Valley Aquifer System
5.2. Venice Aquifer System
5.2.1. Phreatic Aquifer
5.2.2. Confined Aquifer
6. Conclusions
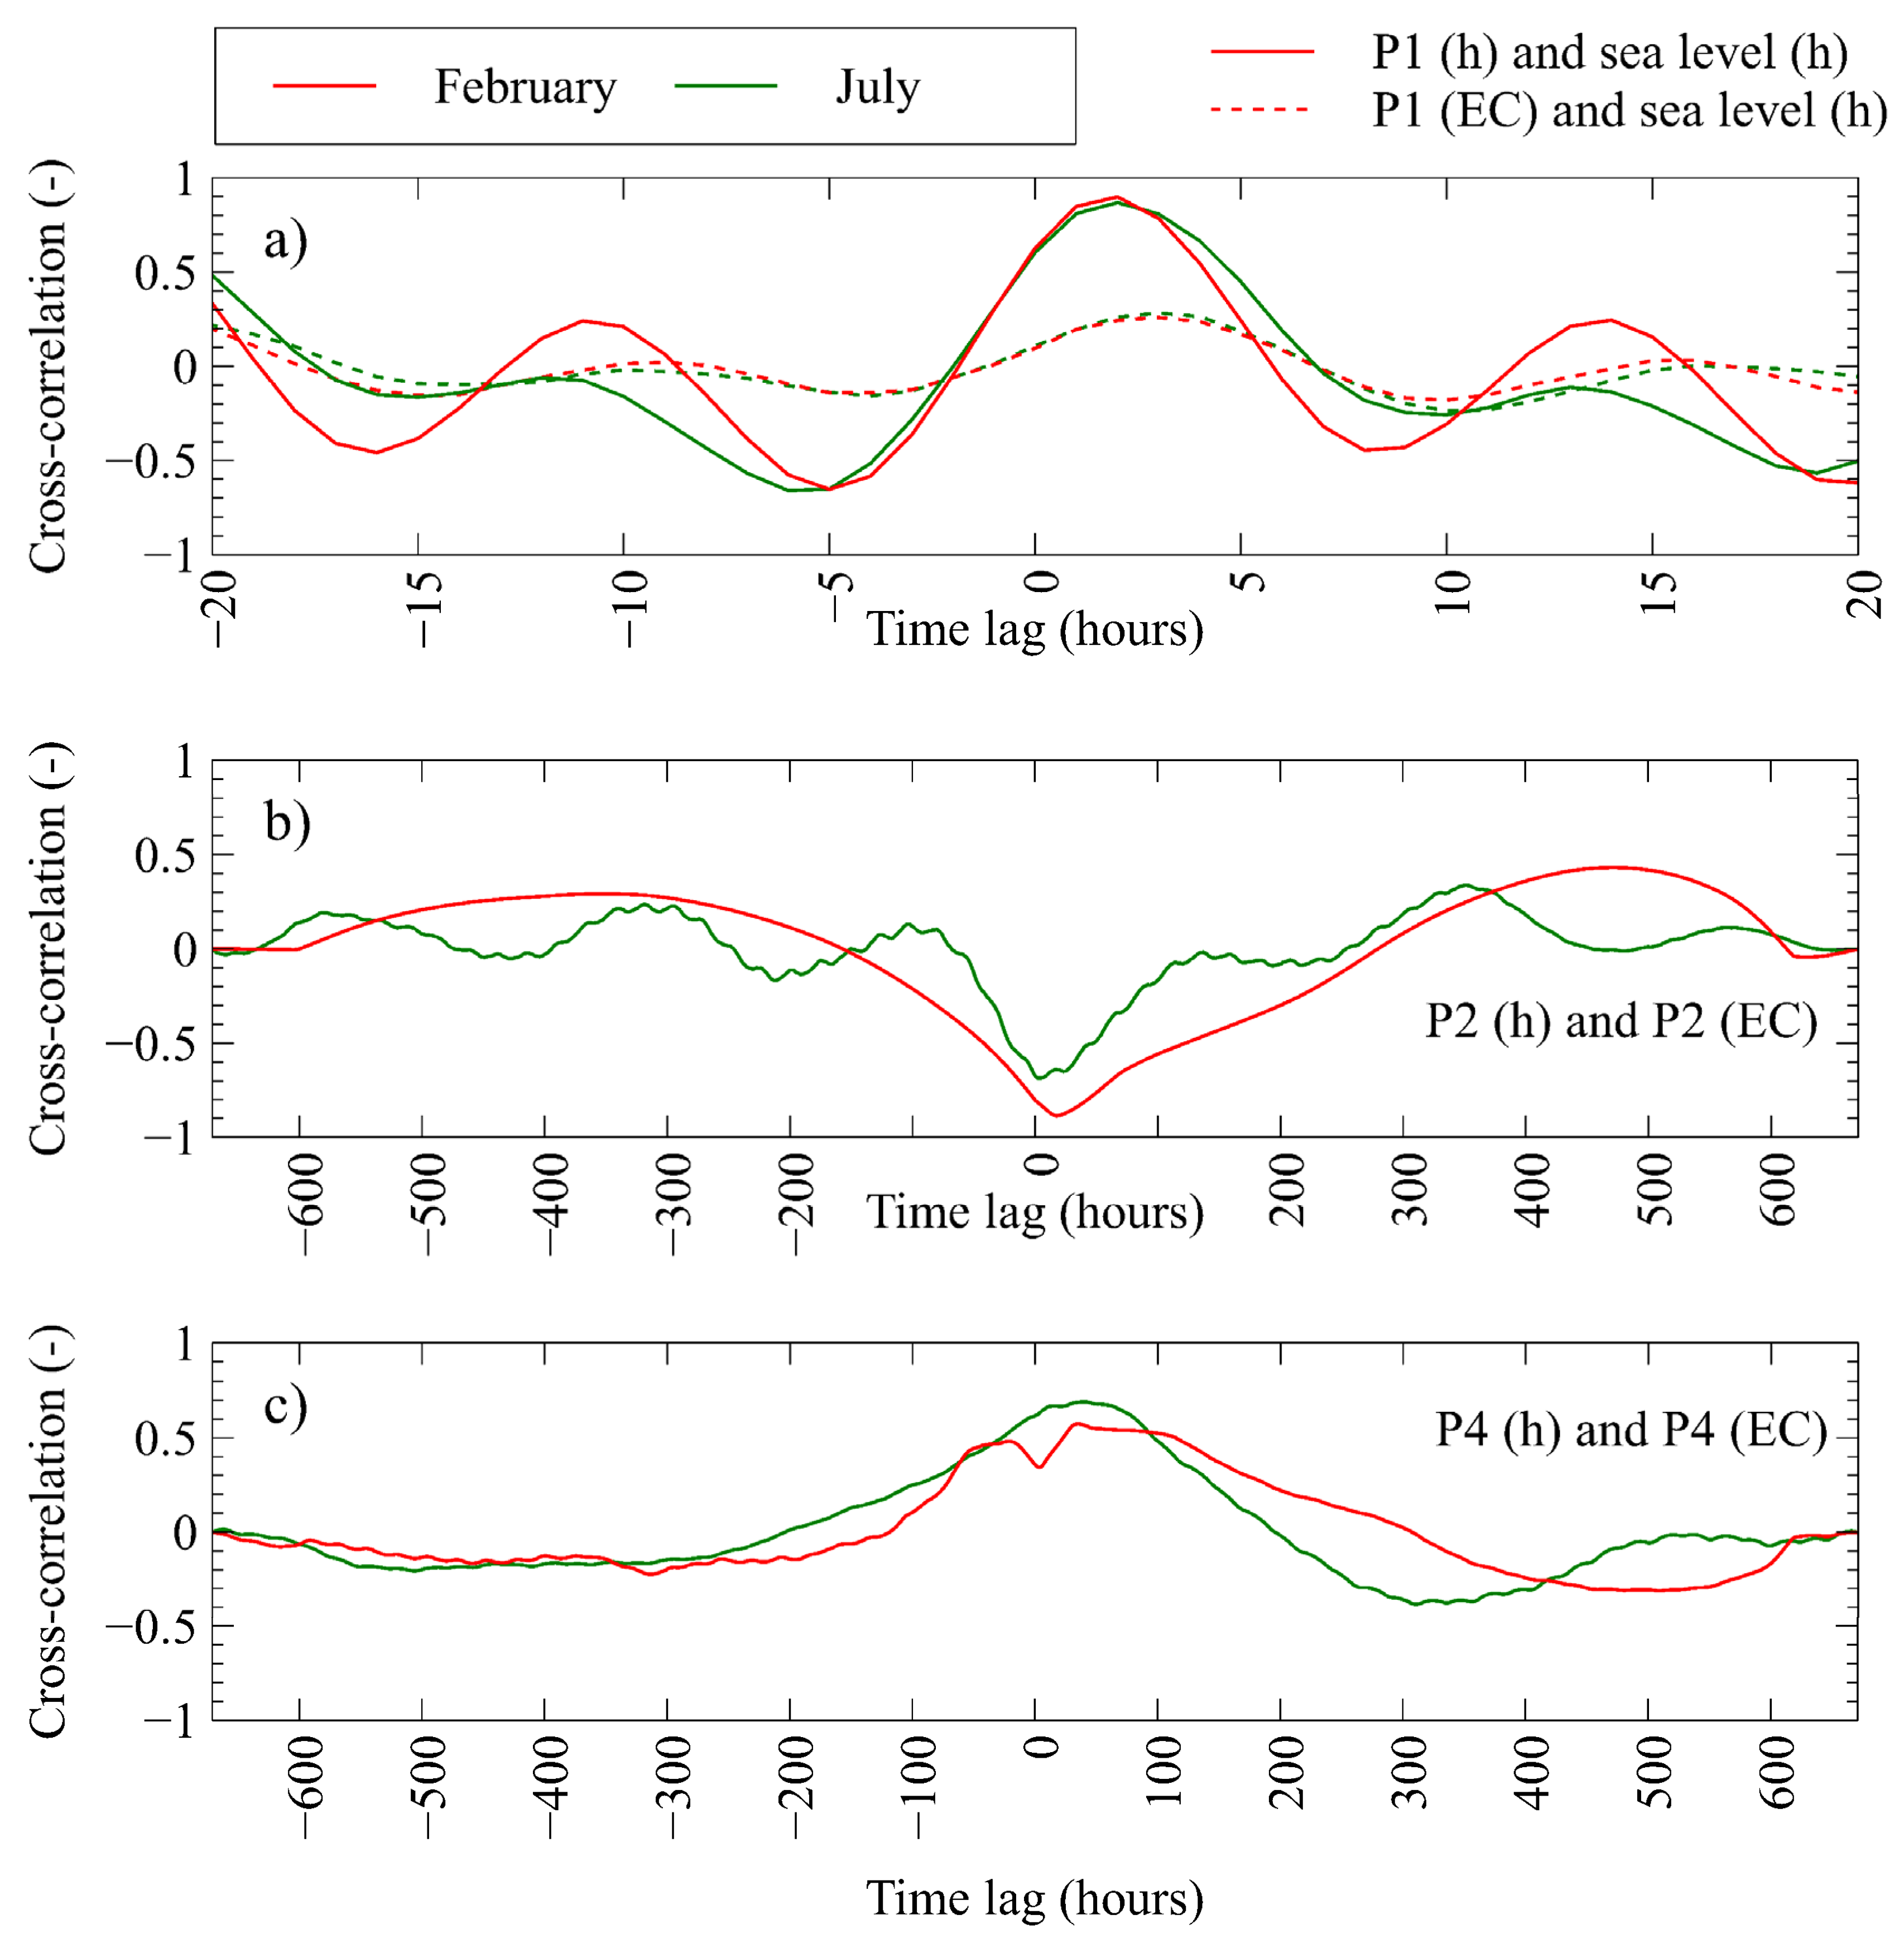
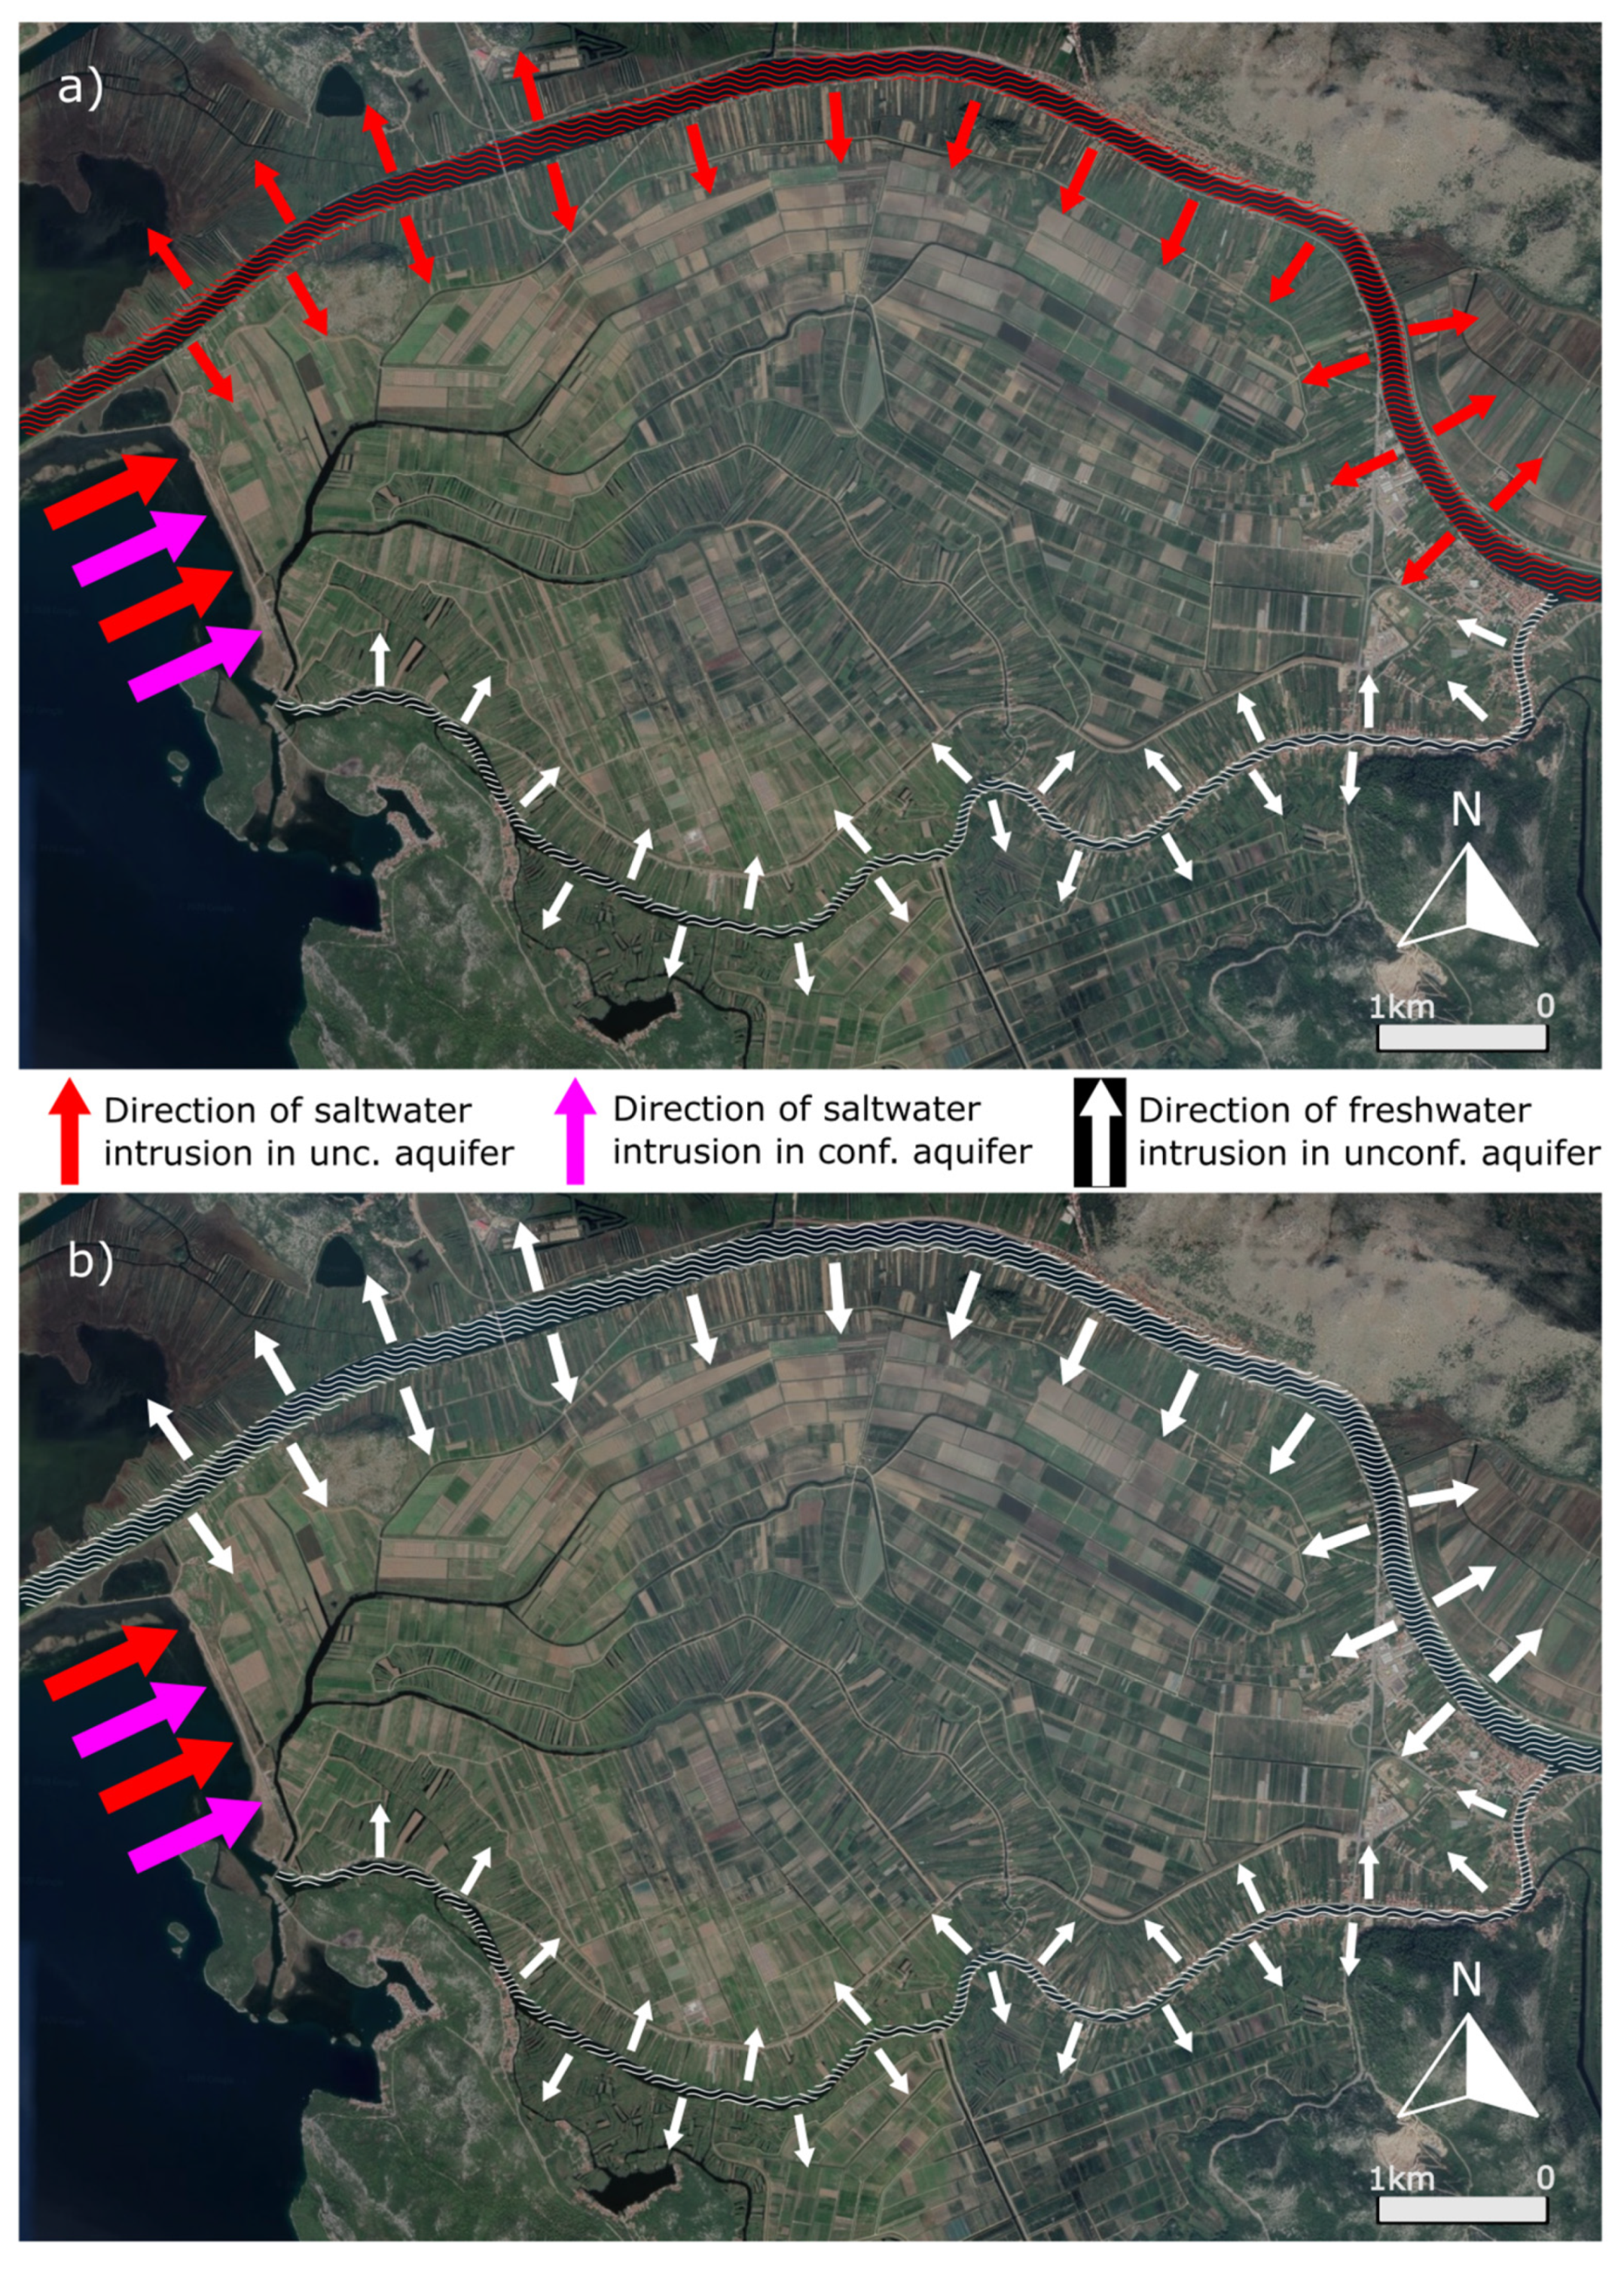
- The Neretva Valley coastal system is shown to be dominantly influenced by the sea when dealing with salinity dynamics along the coastal area. The main saltwater inflow direction is from the sea. The confined aquifer seems to keep the salinity regime independently of the upper, unconfined aquifer. Contrarily to confined aquifer, an unconfined one is shown to be affected by the sea, artificial drainage, and external loadings.
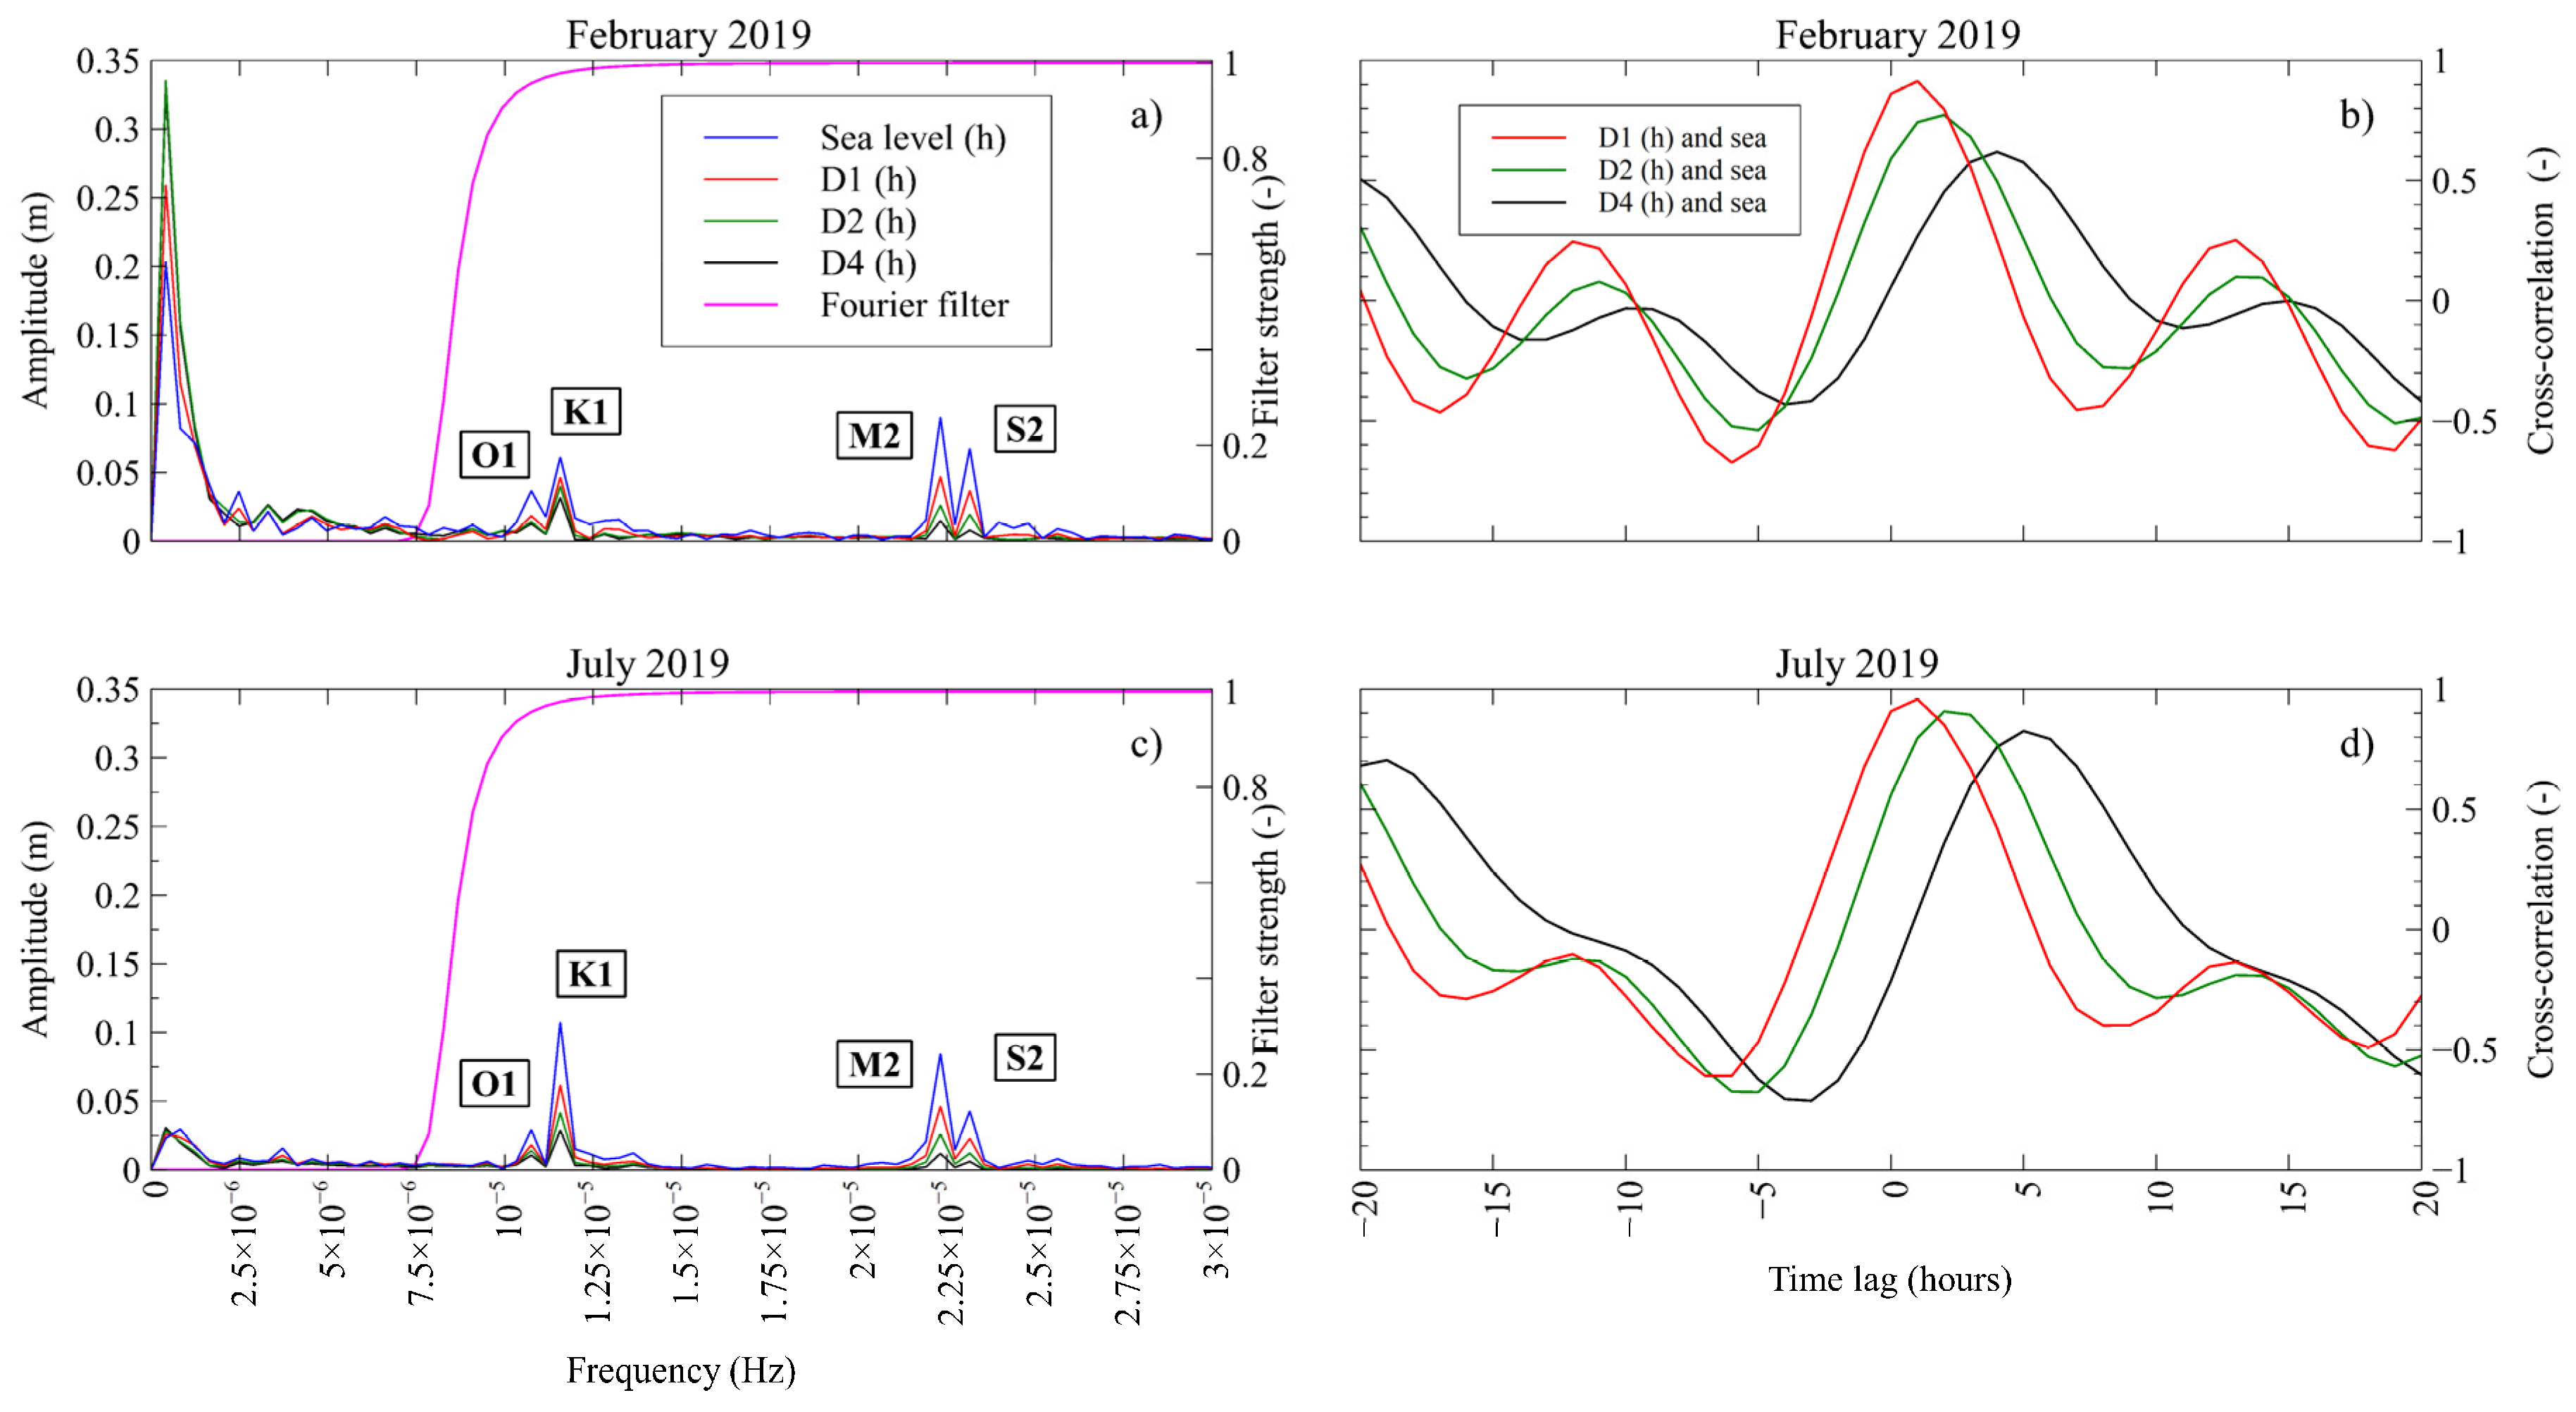
- During both rain and dry periods, confined aquifers keep constant EC values at all monitoring locations covered by the study, with almost negligible variations. This leads to a conclusion about the significant connection between this geological unit and the sea. Besides the EC, piezometric regime is shown to keep a frequency signature similar to that of the sea level.
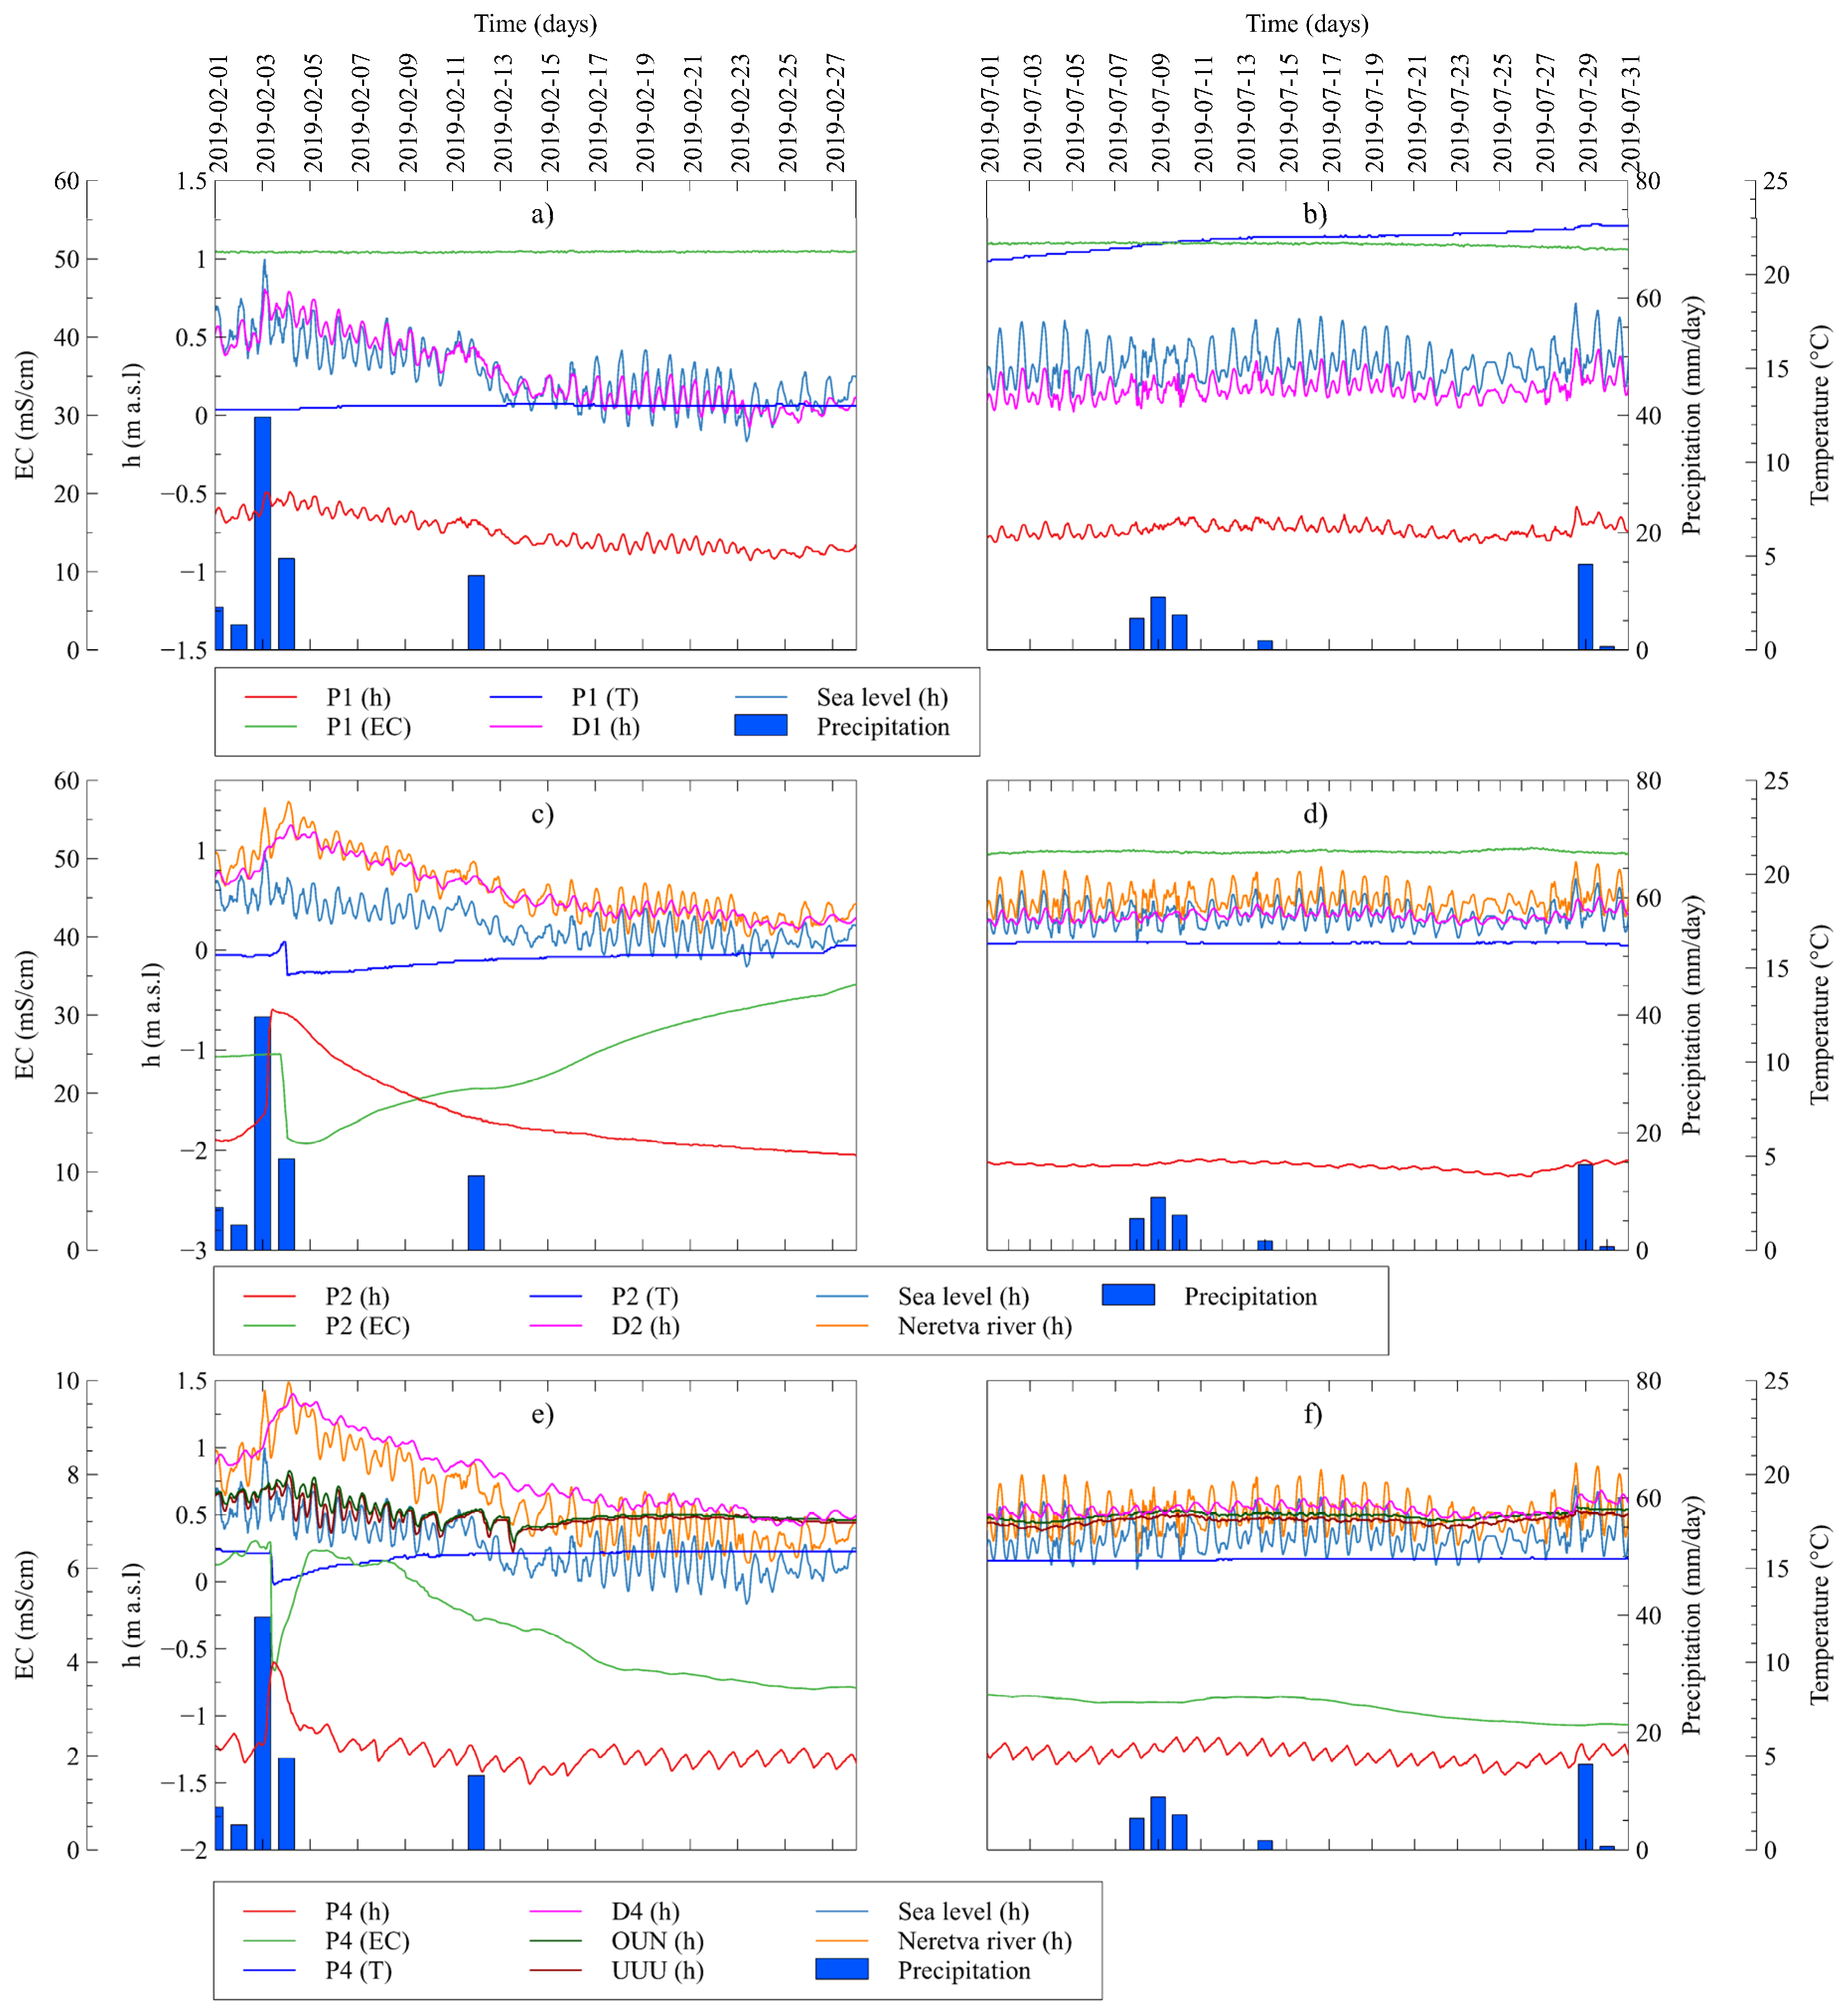
- Monitoring locations installed in the unconfined aquifer demonstrate fundamentally different behavior of groundwater features. The coastal area is dominantly controlled by the interplay of the sea and pumping station Modrič operative regime keeping the EC level around 50 mS cm−1 due to the active SWI. The central Valley area shows the influence of the river Neretva regime since the distance from P2 to river Neretva is approximately four times smaller than the sea distance from P2. This area is characterized by high EC values during the dry period while during the rain period, especially after the occurrence of intensive precipitation rates, EC is drastically decreased to approximately 10–15 mS cm−1. Vidrice area is a unique subsystem whose EC characteristic is increased during precipitation events. In the case of precipitation depths greater than 40 mm day−1, strict EC decrease is identified. To elaborate this in a comprehensive way, additional in situ observations, either the extension of the existing monitoring system has to be done.
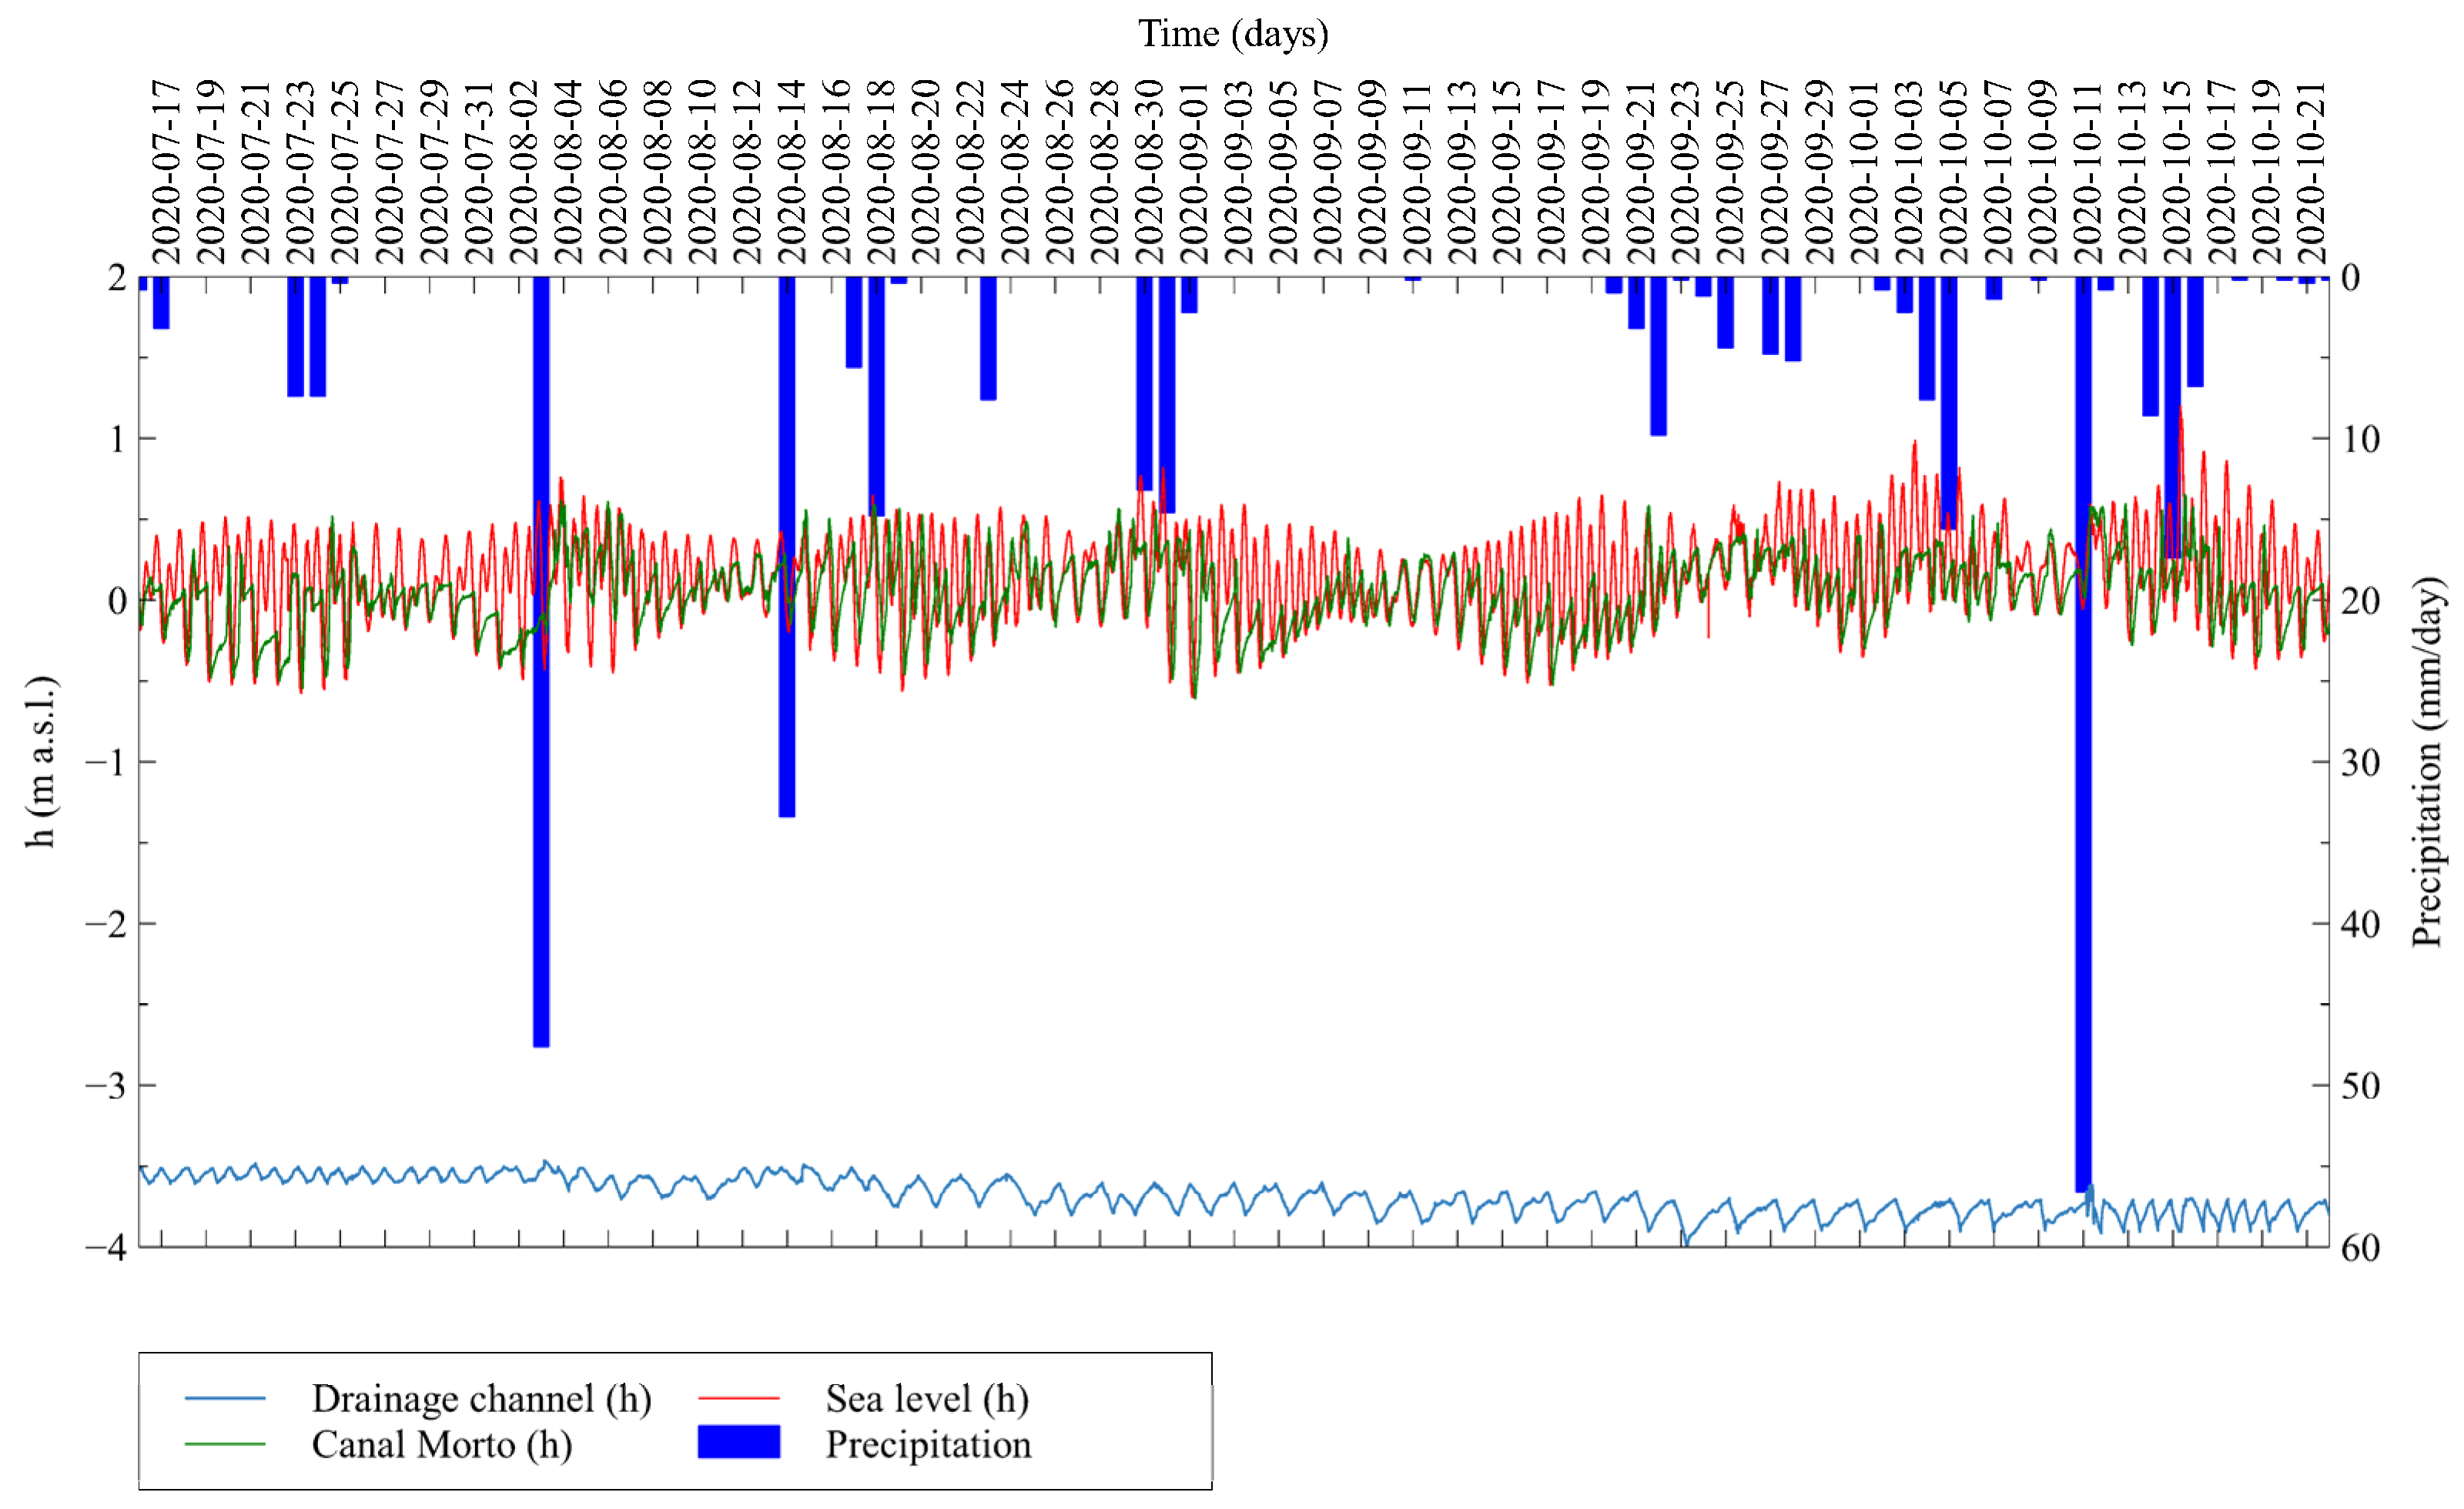
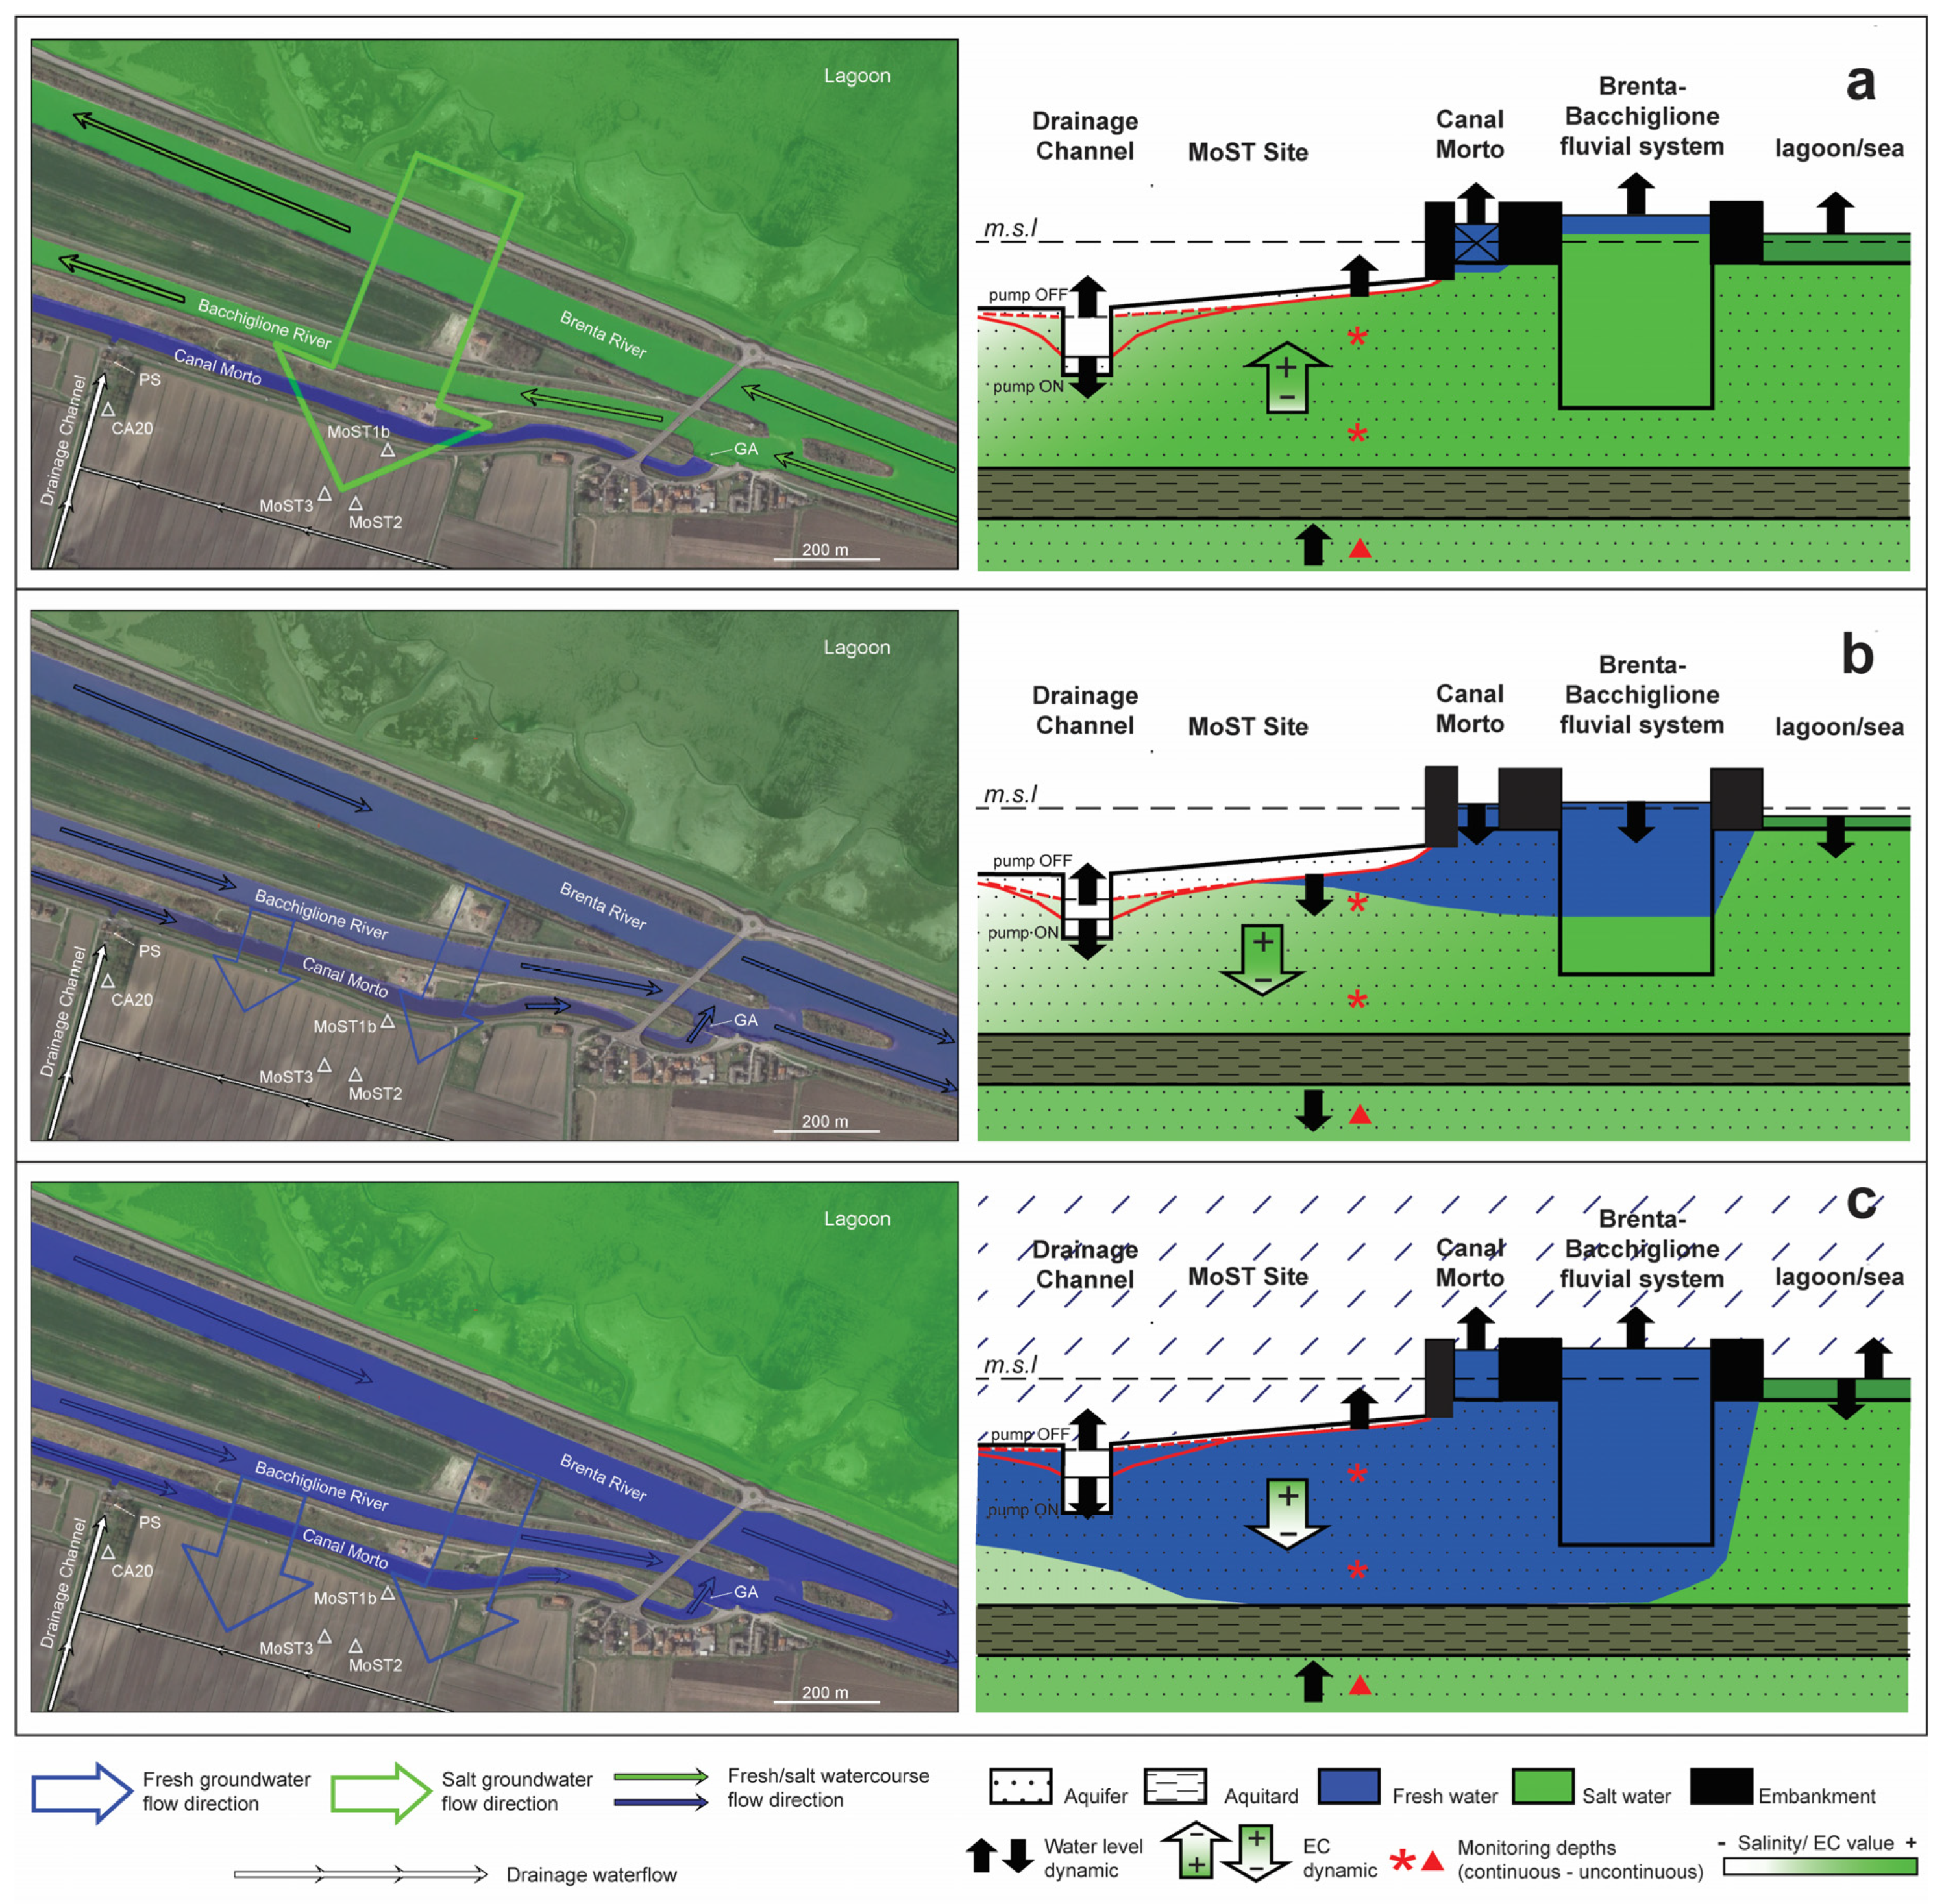
- In the Venice site, the artificial drainage seasonally constrains the water table levels on the basis of the farmland activities. The rainfall events significantly mitigate the relevant high background of saltwater contamination in the aquifers. Since the almost constant high salinity background, the salinity intake from the Brenta and Bacchiglione river beds during the encroachment phase has been much more important than the dilution effect given by their freshwater outflows during low tides. As for the CM, the tidal regulation gates hamper the seawater encroachment during high sea levels and keep freshwater storage in the last stretch of the watercourse. However, the dispersion of the freshwater from the CM does not seem enough to significantly mitigate the salt background in the aquifer system;
- Different locations show specific nature of the SWI parameters like temperature and EC;
- The established monitoring systems enable the identification of processes influencing SWI.
Author Contributions
Funding
Institutional Review Board Statement
Informed Consent Statement
Data Availability Statement
Acknowledgments
Conflicts of Interest
References
- Racetin, I.; Krtalic, A.; Srzic, V.; Zovko, M. Characterization of short-term salinity fluctuations in the Neretva River Delta situated in the southern Adriatic Croatia using Landsat-5 TM. Ecol. Indic. 2020, 110, 105924. [Google Scholar] [CrossRef]
- Sherif, M.M.; Singh, V.P. Effect of climate change on sea water intrusion in coastal aquifers. Hydrol. Process. 1999, 13, 1277–1287. [Google Scholar] [CrossRef]
- Sithara, S.; Pramada, S.K.; Thampi, S.G. Impact of projected climate change on seawater intrusion on a regional coastal aquifer. J. Earth Syst. Sci. 2020, 129. [Google Scholar] [CrossRef]
- van Engelen, J.; Verkaik, J.; King, J.; Nofal, E.R.; Bierkens, M.F.P.; Oude Essink, G.H.P. A three-dimensional palaeohydrogeological reconstruction of the groundwater salinity distribution in the Nile Delta Aquifer. Hydrol. Earth Syst. Sci. 2019, 23, 5175–5198. [Google Scholar] [CrossRef]
- Paldor, A.; Shalev, E.; Katz, O.; Aharonov, E. Dynamics of saltwater intrusion and submarine groundwater discharge in confined coastal aquifers: A case study in northern Israel. Hydrogeol. J. 2019, 27, 1611–1625. [Google Scholar] [CrossRef]
- Stein, S.; Yechieli, Y.; Shalev, E.; Kasher, R.; Sivan, O. The effect of pumping saline groundwater for desalination on the fresh-saline water interface dynamics. Water Res. 2019, 156, 46–57. [Google Scholar] [CrossRef] [PubMed]
- Goswami, R.R.; Clement, T.P. Laboratory-scale investigation of saltwater intrusion dynamics. Water Resour. Res. 2007, 43. [Google Scholar] [CrossRef]
- Memari, S.S.; Bedekar, V.S.; Clement, T.P. Laboratory and Numerical Investigation of Saltwater Intrusion Processes in a Circular Island Aquifer. Water Resour. Res. 2020, 56. [Google Scholar] [CrossRef]
- Nguyen, T.T.M.; Yu, X.; Pu, L.; Xin, P.; Zhang, C.; Barry, D.A.; Li, L. Effects of Temperature on Tidally Influenced Coastal Unconfined Aquifers. Water Resour. Res. 2020, 56, e2019WR026660. [Google Scholar] [CrossRef]
- Nepal, C.M.; Vijay, P.S.; Somvir, S.; Vijay, S.S. Hydrochemical characteristic of coastal aquifer from Tuticorin, Tamil Nadu, India. Environ. Monit. Assess. 2011, 175, 531–550. [Google Scholar] [CrossRef]
- Fadili, A.; Najib, S.; Mehdi, K.; Riss, J.; Malaurent, P.; Makan, A. Geoelectrical and hydrochemical study for the assessment of seawater intrusion evolution in coastal aquifers of Oualidia, Morocco. J. Appl. Geophys. 2017, 146, 178–187. [Google Scholar] [CrossRef]
- Levanon, E.; Yechieli, Y.; Shalev, E.; Friedman, V.; Gvirtzman, H. Reliable monitoring of the transition zone between fresh and saline waters in coastal aquifers. Groundw. Monit. Remediat. 2013, 33, 101–110. [Google Scholar] [CrossRef]
- Kim, J.H.; Lee, J.; Cheong, T.J.; Kim, R.H.; Koh, D.C.; Ryu, J.S.; Chang, H.W. Use of time series analysis for the identification of tidal effect on groundwater in the coastal area of Kimje, Korea. J. Hydrol. 2005, 300, 188–198. [Google Scholar] [CrossRef]
- Kim, K.Y.; Park, Y.S.; Kim, G.P.; Park, K.H. Dynamic freshwater-saline water interaction in the coastal zone of Jeju Island, South Korea. Hydrogeol. J. 2009, 17, 617–629. [Google Scholar] [CrossRef]
- Kim, K.Y.; Chon, C.M.; Park, K.H. A simple method for locating the fresh water-salt water interface using pressure data. Ground Water 2007, 45, 723–728. [Google Scholar] [CrossRef] [PubMed]
- Kue-Young, K.; Chul-Min, C.; Ki-Hwa, P.; Yun-Seok, P.; Nam-Chil, W. Multi-depth monitoring of electrical conductivity and temperature of groundwater at a multilayered coastal aquifer: Jeju Island, Korea. Hydrol. Process. 2008, 22, 3724–3733. [Google Scholar] [CrossRef]
- Yang, H.; Shimada, J.; Shibata, T.; Okumura, A.; Pinti, D.L. Freshwater lens oscillation induced by sea tides and variable rainfall at the uplifted atoll island of Minami-Daito, Japan. Hydrogeol. J. 2020, 28, 2105–2114. [Google Scholar] [CrossRef]
- Srzić, V.; Lovrinović, I.; Racetin, I.; Pletikosić, F. Hydrogeological Characterization of Coastal Aquifer on the Basis of Observed Sea Level and Groundwater Level Fluctuations: Neretva Valley Aquifer, Croatia. Water 2020, 12, 348. [Google Scholar] [CrossRef]
- Krvavica, N.; Ružić, I. Estuarine, Coastal and Shelf Science Assessment of sea-level rise impacts on salt-wedge intrusion in idealized and Neretva River Estuary. Estuar. Coast. Shelf Sci. 2020, 234, 106638. [Google Scholar] [CrossRef]
- Romić, D.; Castrignanò, A.; Romić, M.; Buttafuoco, G.; Bubalo Kovačić, M.; Ondrašek, G.; Zovko, M. Modelling spatial and temporal variability of water quality from different monitoring stations using mixed effects model theory. Sci. Total Environ. 2020, 704, 135875. [Google Scholar] [CrossRef] [PubMed]
- Zovko, M.; Romi, D.; Colombo, C.; Di, E.; Romi, M.; Buttafuoco, G.; Castrignanò, A. Geoderma A geostatistical Vis-NIR spectroscopy index to assess the incipient soil salinization in the Neretva River valley, Croatia. Geoderma 2018, 332, 60–72. [Google Scholar] [CrossRef]
- Carbognin, L.; Tosi, L. Interaction between Climate Changes, Eustacy and Land Subsidence in the North Adriatic Region, Italy. Mar. Ecol. 2002, 23, 38–50. [Google Scholar] [CrossRef]
- Tosi, L.; Da Lio, C.; Strozzi, T.; Teatini, P. Combining L- and X-Band SAR Interferometry to Assess Ground Displacements in Heterogeneous Coastal Environments: The Po River Delta and Venice Lagoon, Italy. Remote Sens. 2016, 8. [Google Scholar] [CrossRef]
- Benvenuti, G.; Norinelli, A.; Zambrano, R. Contributo alla conoscenza del sottosuolo dell’area circumlagunare veneta mediante sondaggi elettrici verticali. Boll. Geofis. Teor. Appl. 1973, 15, 23–38. [Google Scholar]
- Di Sipio, E.; Galgaro, A.; Zuppi, G.M. New geophysical knowledge of groundwater systems in Venice estuarine environment. Estuar. Coast. Shelf Sci. 2006, 66, 6–12. [Google Scholar] [CrossRef]
- Rapaglia, J. Submarine groundwater discharge into Venice Lagoon, Italy. Estuaries 2005, 28, 705–713. [Google Scholar] [CrossRef]
- Gattacceca, J.C.; Vallet-Coulomb, C.; Mayer, A.; Claude, C.; Radakovitch, O.; Conchetto, E.; Hamelin, B. Isotopic and geochemical characterization of salinization in the shallow aquifers of a reclaimed subsiding zone: The southern Venice Lagoon coastland. J. Hydrol. 2009, 378, 46–61. [Google Scholar] [CrossRef]
- Teatini, P.; Tosi, L.; Viezzoli, A.; Baradello, L.; Zecchin, M.; Silvestri, S. Understanding the hydrogeology of the Venice Lagoon subsurface with airborne electromagnetics. J. Hydrol. 2011, 411, 342–354. [Google Scholar] [CrossRef]
- Viezzoli, A.; Tosi, L.; Teatini, P.; Silvestri, S. Surface water-groundwater exchange in transitional coastal environments by airborne electromagnetics: The Venice Lagoon example. Geophys. Res. Lett. 2010, 37. [Google Scholar] [CrossRef]
- De Franco, R.; Biella, G.; Tosi, L.; Teatini, P.; Lozej, A.; Chiozzotto, B.; Giada, M.; Rizzetto, F. Monitoring the saltwater intrusion by time lapse electrical resistivity tomography: The Chioggia test site (Venice Lagoon, Italy). J. Appl. Geophys. 2009, 69, 117–130. [Google Scholar] [CrossRef]
- Da Lio, C.; Carol, E.; Kruse, E.; Teatini, P.; Tosi, L. Saltwater contamination in the managed low-lying farmland of the Venice coast, Italy: An assessment of vulnerability. Sci. Total Environ. 2015, 533, 356–369. [Google Scholar] [CrossRef] [PubMed]
- Faculty of Civil Engineering. Water Management Solution and Arrangement of the Lower Neretva Basin; Faculty of Civil Engineering: Split, Croatia, 1996. [Google Scholar]
- Hrvatske Vode. Provedbeni Plan Obrane od Poplava Branjenog Područja Sektor F—Južni Jadran Branjeno Područje 32: Područja Malih Slivova Neretva—Korčula i Dubrovačko Primorje i Otoci; Hrvatske Vode: Zagreb, Croatia, 2014. [Google Scholar]
- Geoid-Beroš Ltd. Piezometer Drilling for Purpose of Groundwater Monitoring System; Geoid-Beroš Ltd.: Jalkovec, Croatia, 2014. [Google Scholar]
- Institute IGH PLC. Monitoring Sea-Water Intrusion in Coastal Aquifers and Testing Pilot Projects for Its Mitigation; Geophysical Investigation Report; Institute IGH PLC: Zagreb, Croatia, 2019. [Google Scholar]
- Elektrosond. Hydrogeological Investigation Works Opuzen—Mouth of Neretva; Elektrosond: Zagreb, Croatia, 1963. [Google Scholar]
- Geofizika. Geophysical Investigations/Geoelectrical and Seismic/at Opuzen—Mouth of Neretva; Geofizika: Zagreb, Croatia, 1962. [Google Scholar]
- GEOKON. Drilling Report of Two Pairs of Piezometers Downstream of the Neretva River; GEOKON: Zagreb, Croatia, 2005. [Google Scholar]
- GEOKON. Geotechnical Investigation Works for Irrigation System Conceptual Design Downstream of the Neretva River; GEOKON: Zagreb, Croatia, 2008. [Google Scholar]
- GEOKON. No Geotechnical Investigation Works for Siphon below Mala Neretva at the Pumping Station Prag (Vidrice); GEOKON: Zagreb, Croatia, 2013. [Google Scholar]
- Geofizika. Water Investigation Works at Opuzen—Šetka; Geofizika: Zagreb, Croatia, 1966. [Google Scholar]
- Institute IGH PLC. Geotechnical Study for Irrigation System Subsystem Opuzen (Phases A and J); Institute IGH PLC: Zagreb, Croatia, 2013. [Google Scholar]
- Tosi, L.; Teatini, P.; Brancolini, G.; Zecchin, M.; Carbognin, L.; Affatato, A.; Baradello, L. Three-dimensional analysis of the Plio-Pleistocene seismic sequences in the Venice Lagoon (Italy). J. Geol. Soc. 2012, 169, 507–510. [Google Scholar] [CrossRef]
- Zecchin, M.; Tosi, L. Multi-sourced depositional sequences in the Neogene to Quaternary succession of the Venice area (northern Italy). Mar. Pet. Geol. 2014, 56, 1–15. [Google Scholar] [CrossRef]
- Donnici, S.; Serandrei-Barbero, R.; Bini, C.; Bonardi, M.; Lezziero, A. The Caranto Paleosol and Its Role in the Early Urbanization of Venice. Geoarchaeology 2011, 26, 514–543. [Google Scholar] [CrossRef]
- Gasparetto-Stori, G.; Strozzi, T.; Teatini, P.; Tosi, L.; Vianello, A.; Wegmüller, U. Dem of the Veneto Plain by Ers2-Envisat Cross-Interferometry. In Proceedings of the 7th EUREGEO European Congress on Regional Geoscientific Cartography and Information Systems, Bologna, Italy, 12–15 June 2012. [Google Scholar]
- Tosi, L.; Rizzetto, F.; Bonardi, M.; Donnici, S.; Serandrei Barbero, R.T. Chioggia-Malamocco. In Note Illustrative della Carta Geologica d’Italia alla Scala 1:50.000; SystemCart: Rome, Italy, 2007; pp. 148–149. [Google Scholar]
- Tosi, L.; Rizzetto, F.; Zecchin, M.; Brancolini, G.; Baradello, L. Morphostratigraphic framework of the Venice Lagoon (Italy) by very shallow water VHRS surveys: Evidence of radical changes triggered by human-induced river diversions. Geophys. Res. Lett. 2009, 36. [Google Scholar] [CrossRef]
- Zecchin, M.; Brancolini, G.; Tosi, L.; Rizzetto, F.; Caffau, M.; Baradello, L. Anatomy of the Holocene succession of the southern Venice lagoon revealed by very high-resolution seismic data. Cont. Shelf Res. 2009, 29, 1343–1359. [Google Scholar] [CrossRef]
- Vallejos, A.; Sola, F.; Pulido-Bosch, A. Processes Influencing Groundwater Level and the Freshwater-Saltwater Interface in a Coastal Aquifer. Water Resour. Manag. 2014, 29, 679–697. [Google Scholar] [CrossRef]
- Proakis, J.G.; Manolakis, D.G. Digital Signal Processing, 4th ed.; Prentice-Hall, Inc.: Upper Saddle River, NJ, USA, 2006; ISBN 9788578110796. [Google Scholar]
- Cerna, M.; Harvey, A.F. The Fundamentals of FFT-Based Signal Analysis and Measurement; Application Note 041; National Instruments: Austin, TX, USA, 2000. [Google Scholar]
- Turnadge, C.; Crosbie, R.S.; Barron, O.; Rau, G.C. Comparing Methods of Barometric Efficiency Characterization for Specific Storage Estimation. Groundwater 2019, 57, 844–859. [Google Scholar] [CrossRef]
- Fuentes-Arreazola, M.A.; Ramírez-Hernández, J.; Vázquez-González, R. Hydrogeological properties estimation from groundwater level natural fluctuations analysis as a low-cost tool for the Mexicali Valley Aquifer. Water 2018, 10. [Google Scholar] [CrossRef]
- Dong, L.; Shimada, J.; Kagabu, M.; Yang, H. Barometric and tidal-induced aquifer water level fluctuation near the Ariake Sea. Environ. Monit. Assess. 2015, 187. [Google Scholar] [CrossRef]
- Merritt, M.L. Estimating Hydraulic Properties of the Floridan Aquifer System by Analysis of Earth-Tide, Ocean-Tide, and Barometric Effects, Collier and Hendry Counties, Florida; U.S. Geological Survey: Reston, VA, USA, 2004. [Google Scholar]
- Levanon, E.; Yechieli, Y.; Gvirtzman, H.; Shalev, E. Tide-induced fluctuations of salinity and groundwater level in unconfined aquifers—Field measurements and numerical model. J. Hydrol. 2017, 551, 665–675. [Google Scholar] [CrossRef]
- Jiao, J.J.; Tang, Z. An analytical solution of groundwater response to tidal fluctuation in a leaky confined aquifer. Water Resour. Res. 1999, 35, 747–751. [Google Scholar] [CrossRef]
- Dong, L.; Chen, J.; Fu, C.; Jiang, H. Analysis of groundwater-level fluctuation in a coastal confined aquifer induced by sea-level variation. Hydrogeol. J. 2012, 20, 719–726. [Google Scholar] [CrossRef]
- Kim, K.Y.; Seong, H.; Kim, T.; Park, K.H.; Woo, N.C.; Park, Y.S.; Koh, G.W.; Park, W.B. Tidal effects on variations of fresh-saltwater interface and groundwater flow in a multilayered coastal aquifer on a volcanic island (Jeju Island, Korea). J. Hydrol. 2006, 330, 525–542. [Google Scholar] [CrossRef]
- Ferla, M.; Cordella, M.; Michielli, L.; Rusconi, A. Long-term variations on sea level and tidal regime in the lagoon of Venice. Estuar. Coast. Shelf Sci. 2007, 75, 214–222. [Google Scholar] [CrossRef]
- Lovrinović, I.; Srzić, V.; Vranješ, M.; Džaja, M. Coastal aquifer characteristics determination based on in-situ observations: River Neretva Valley Aquifer. In Proceedings of the European Water Resources Association (EWRA), General Assembly, Madrid, Spain, 25–29 June 2019. [Google Scholar]
- Lovrinović, I.; Srzić, V.; Matić, I.; Krnić, P. Multi component analysis of processes controlling seawater intrusion dynamics in Neretva delta area. In Proceedings of the AGU—American Geoscience Union, New Orleans, LA, USA, 1–17 December 2020. [Google Scholar]
- McMillan, T.C.; Rau, G.C.; Timms, W.A.; Andersen, M.S. Utilizing the Impact of Earth and Atmospheric Tides on Groundwater Systems: A Review Reveals the Future Potential. Rev. Geophys. 2019, 57, 281–315. [Google Scholar] [CrossRef]
- Rahi, K.A.; Halihan, T. Identifying aquifer type in fractured rock aquifers using harmonic analysis. Groundwater 2013, 51, 76–82. [Google Scholar] [CrossRef]
- Faculty of Civil Engineering, Geodesy and Architecture, University of Split. Salinity Monitoring at Lower Neretva Area—Report for the Year 2020; Faculty of Civil Engineering, Geodesy and Architecture, University of Split: Split, Croatia, 2020. [Google Scholar]
- Badaruddin, S.; Werner, A.D.; Morgan, L.K. Water table salinization due to seawater intrusion. Water Resour. Res. 2015, 51, 8397–8408. [Google Scholar] [CrossRef]


| Piezometer | Ground Level (m a.s.l.) | Screen Section (m a.s.l.) | Upper Sensor Depth (m a.s.l.) | Lower Sensor Depth (m a.s.l.) | Observed Variables |
|---|---|---|---|---|---|
| MoST1b | −1.73 | −2.73 to −11.73 | −3.94 | −6.48 | P, EC, T |
| MoST2 | −2.51 | −3.71 to −11.91 | −4.11 | −7.83 | P, EC, T |
| MoST3 | −2.35 | −3.55 to −12.05 | −4.03 | −10.52 | P, EC, T |
| CA20 | −1.94 | −16.94 to −21.94 | −2.89 | P | |
| 2019 | February | July | ||||||
|---|---|---|---|---|---|---|---|---|
| Sea Level | ||||||||
| Constituents | O1 | K1 | M2 | S2 | O1 | K1 | M2 | S2 |
| Amplitude (m) | 0.037 | 0.061 | 0.090 | 0.068 | 0.029 | 0.108 | 0.085 | 0.043 |
| Period (h) | 25.85 | 24.00 | 12.44 | 12.00 | 25.85 | 24.00 | 12.44 | 12.00 |
| Phase (°) | 24.54 | 1.49 | 20.43 | −113.46 | −167.61 | 149.93 | −32.46 | −103.00 |
| D1 | ||||||||
| Constituents | O1 | K1 | M2 | S2 | O1 | K1 | M2 | S2 |
| Amplitude (m) | 0.018 | 0.047 | 0.047 | 0.037 | 0.018 | 0.062 | 0.046 | 0.023 |
| Period (h) | 25.85 | 24.00 | 12.44 | 12.00 | 25.85 | 24.00 | 12.44 | 12.00 |
| Phase (°) | −7.84 | −32.23 | −5.80 | −128.43 | 160.36 | 127.32 | −55.51 | −124.96 |
| D2 | ||||||||
| Constituents | O1 | K1 | M2 | S2 | O1 | K1 | M2 | S2 |
| Amplitude (m) | 0.014 | 0.040 | 0.026 | 0.019 | 0.014 | 0.042 | 0.027 | 0.012 |
| Period (h) | 25.85 | 24.00 | 12.44 | 12.00 | 25.85 | 24.00 | 12.44 | 12.00 |
| Phase (°) | −40.10 | −41.67 | −32.33 | −148.18 | 129.66 | 98.92 | −92.03 | −158.43 |
| D4 | ||||||||
| Constituents | O1 | K1 | M2 | S2 | O1 | K1 | M2 | S2 |
| Amplitude (m) | 0.013 | 0.032 | 0.015 | 0.008 | 0.011 | 0.029 | 0.012 | 0.006 |
| Period (h) | 25.85 | 24.00 | 12.44 | 12.00 | 25.85 | 24.00 | 12.44 | 12.00 |
| Phase (°) | −68.10 | −79.93 | −85.65 | 154.66 | 91.64 | 53.48 | −158.64 | 138.56 |
Publisher’s Note: MDPI stays neutral with regard to jurisdictional claims in published maps and institutional affiliations. |
© 2021 by the authors. Licensee MDPI, Basel, Switzerland. This article is an open access article distributed under the terms and conditions of the Creative Commons Attribution (CC BY) license (http://creativecommons.org/licenses/by/4.0/).
Share and Cite
Lovrinović, I.; Bergamasco, A.; Srzić, V.; Cavallina, C.; Holjević, D.; Donnici, S.; Erceg, J.; Zaggia, L.; Tosi, L. Groundwater Monitoring Systems to Understand Sea Water Intrusion Dynamics in the Mediterranean: The Neretva Valley and the Southern Venice Coastal Aquifers Case Studies. Water 2021, 13, 561. https://doi.org/10.3390/w13040561
Lovrinović I, Bergamasco A, Srzić V, Cavallina C, Holjević D, Donnici S, Erceg J, Zaggia L, Tosi L. Groundwater Monitoring Systems to Understand Sea Water Intrusion Dynamics in the Mediterranean: The Neretva Valley and the Southern Venice Coastal Aquifers Case Studies. Water. 2021; 13(4):561. https://doi.org/10.3390/w13040561
Chicago/Turabian StyleLovrinović, Ivan, Alessandro Bergamasco, Veljko Srzić, Chiara Cavallina, Danko Holjević, Sandra Donnici, Joško Erceg, Luca Zaggia, and Luigi Tosi. 2021. "Groundwater Monitoring Systems to Understand Sea Water Intrusion Dynamics in the Mediterranean: The Neretva Valley and the Southern Venice Coastal Aquifers Case Studies" Water 13, no. 4: 561. https://doi.org/10.3390/w13040561
APA StyleLovrinović, I., Bergamasco, A., Srzić, V., Cavallina, C., Holjević, D., Donnici, S., Erceg, J., Zaggia, L., & Tosi, L. (2021). Groundwater Monitoring Systems to Understand Sea Water Intrusion Dynamics in the Mediterranean: The Neretva Valley and the Southern Venice Coastal Aquifers Case Studies. Water, 13(4), 561. https://doi.org/10.3390/w13040561