Article

Impacts of Irrigation Water on the Hydrodynamics and Saline Behavior of the Shallow Alluvial Aquifer in the Senegal River Delta

1
Geology Department, Faculty of Sciences and Techniques, University Cheikh Anta Diop, Dakar 10700, Senegal
2
Hydrogeology and Environmental Geology, Urban and Environmental Engineering Research Unit, University of Liège, 4000 Liège-1, Belgium
3
Department of Environmental Sciences and Management, University of Liège, 6700 Arlon, Belgium
4
Public Service of Wallonia, Department of Environment and Water, Groundwater Direction, 5100 Jambes, Belgium
*
Authors to whom correspondence should be addressed.
Water 2021, 13(3), 311; https://doi.org/10.3390/w13030311
Submission received: 17 December 2020 / Revised: 18 January 2021 / Accepted: 19 January 2021 / Published: 27 January 2021
(This article belongs to the Section Hydrology)

Abstract

:
The Senegal River Delta located in north-western Senegal is a strategic region for the development of irrigated rice cultivation for achieving rice self-sufficiency. The presence of a shallow salty water table is often considered as a brake to the development of irrigation, by causing salinization of the soil, although the mechanisms of operation are not well known. An experimental study was carried out in a rice paddy located in the village of Ndiaye, 35 km north from Saint Louis, to characterize the water and solute flux processes below the irrigated plots. The objective was to better understand the irrigation-driven dynamics of soil salinization processes. An experimental monitoring network was installed for monitoring the transit of water at the plot level, in the unsaturated zone and in the aquifer. The results show that the supply of water by irrigation contributes to significantly recharging the water table, as shown by the rise in piezometric level, with a concomitant dilution of the water salinity in the soil zone and in the shallow groundwater. However, when irrigation is stopped, the groundwater level and salinity return within a month to their initial level and salinity status because of the evaporative recovery, which strongly governs these processes. Thus, water flow and solute transfers operate in the delta following a recharge–discharge and dilution–concentration cycle controlled by the water balance, and we do not expect to observe in the short- to middle-term any significant reduction in soil salinization processes by drainage.

1. Introduction

With an estimated irrigable land potential of 150,000 ha and significant water availability thanks to the river, the Senegal River Delta (SRD) is an agro-ecological area of strategic importance for the development of irrigated agriculture in the north of Senegal. Irrigated farming, initiated in the colonial period, has gradually taken over from the seasonal rain-fed agriculture traditionally practiced there. The installation of dams has enabled the development of irrigated fields thanks to a better control of the Senegal River regime, but also thanks to the emergence and diversification of production chains [1]. This is the reason why the SRD is today the headquarters of many agricultural development programs, such as the PNAR (National Rice Self-Sufficiency Programme) or the GOANA (Great Agricultural Offensive for Food and Abundance). The main objective of these programs is to achieve food self-sufficiency and they result in an intensification of agricultural activity, and an increase in the areas sown and the volumes of water used.
In the SRD, an anti-sea salt dam was erected in 1986 at Diama, 26 km upstream of Saint Louis, and the Manantali dam was erected in 1988 in the Malian territory, to store the surplus rainwater in the upper basin, by the OMVS interstate organization. This has enabled the development of irrigated agriculture, reflected in a significant increase in the cultivated plots. Nowadays, it is estimated that 85,000 ha are under irrigation on the Senegalese side of the river [2]. This makes it one of the largest irrigation areas in sub-Saharan Western Africa, with rice as the main crop grown in hydro-agricultural developments [3].
However, irrigation development is often accompanied by soil degradation processes due to salinization [4,5], particularly in arid climates. As a result, the sustainable practice of irrigated agriculture in the SRD is now seriously threatened by land salinization processes, which is leading to the abandonment of several developed perimeters [6]. Soil salinization is a major process of land degradation that reduces soil fertility and is a critical stage in the desertification of drylands [7,8]. It is a problem that affects most countries located in arid and semi-arid zones [9]. It is a very broad phenomenon, which is the subject of extensive literature. More details can be found in different works [4,10,11]. In Africa, we can also mention different works in Chad [12,13], in Mali [14,15], in Niger [16], in Senegal [17,18] and in Egypt [19].
In the SRD, rice growing occupies most of the irrigated areas and its practice requires considerable water consumption [20]. This inevitably leads to the percolation of water under the irrigated plots and the rising of the sub-surface water table. This leads to an almost permanent clogging of the soil, and vertical transfers of water and dissolved matters, especially when the water table is very salty [21]. The deep drainage of substances of agricultural origin, introduced by irrigation water, and the rising of salt from the groundwater table, seem to be the cause of the phenomenon of soil salinization. Salinization causes the concentration of the soil solution, which leads to the successive precipitation of minerals. This modifies the initial chemical composition of the soil solution and determines different soil evolution pathways depending on the relative abundance of the different ions [11]. A balanced management must be found between the need to increase the surface area of cultivated land, and therefore the volumes of water used for irrigation, and the need to limit the percolation of water to the salty groundwater table.
A hydrogeochemical study of the shallow SRD aquifer has confirmed its marine origin, and its hyper salty character at some places [21] due to over-concentration of salts by evaporation processes. However, the study of geochemical processes responsible for the evolution of the mineralization of the shallow groundwater did not allow us to identify in an unequivocal way a possible impact of irrigation on the salinity of the shallow groundwater table, nor to understand the dynamics of salts during the cycles of the irrigation and drainage of the plots.
In order to better understand the relationship between irrigation, groundwater dynamics and soil salinization, an experimental study was carried out to define the hydrogeological and hydrogeochemical behavior of the shallow groundwater table at the scale of an irrigated perimeter, in interaction with irrigation practices. The objective was to characterize the geochemistry and dynamics of water and dissolved chemicals in the soil, the unsaturated zone and in the shallow groundwater, during and outside of the irrigation periods, to highlight the ascending and descending water and solute fluxes. This study should also lead to the elaboration of a conceptual model of the functioning of this system, allowing us to make predictions for the rational management of water resources and a sustainable practice of irrigation in the SRD.

2. Materials and Methods

2.1. Description of the Experimental Site

To conduct this experimental study, an irrigated perimeter was selected at Ndiaye in the SRD. The choice of this site was made in consultation with SAED (Société d’Aménagement et d’Exploitation des Terres du Delta du Fleuve Sénégal) which is a public company in charge of the development and planning of irrigated agriculture in the SRD. This choice was based on the accessibility of the site, the possibility of securing the monitoring equipment and the cooperation of peasant populations. The village of Ndiaye is located 35 km from the city of Saint Louis (Figure 1) in a transition zone between the ocean-influenced climate of the city of Saint Louis and the desert climate of Richard Toll [22]. The umbro-thermal diagram, obtained thanks to climatic data collected at the AFRICARICE station (ex ADRAO) of Ndiaye, shows that only August and September can be considered as wet, with a maximum precipitation during September. The average monthly temperatures vary between 20 and 30 °C, and are higher during the rainy season.
Geomorphologically speaking, the agricultural perimeter is in a settling basin corresponding to a topographical depression with clay soils that a priori limit infiltration, thus favoring the practice of rice growing. This perimeter is managed by a Hydraulic Union to which SAED entrusts responsibility for the operation and maintenance of the facilities developed using public funds. This Hydraulic Union brings together economic interest groups (EIG), which are groups of villagers allowing better access to funds for agricultural development. The Hydraulic Union of Ndiaye comprises 05 EIG. In 2008, the perimeter was rehabilitated and its area was increased to 274 ha [23].
The farming calendar is made up of three seasons: (1) a hot dry season campaign which runs from February to the end of June, (2) a rainy season campaign from July to October and (3) a cold dry season campaign extending from October to January. Rice growing is the dominant activity and is generally practiced during the hot dry season and the rainy season. The cold dry season is generally devoted to market gardening, notably with the cultivation of vegetables such as tomatoes and onions.
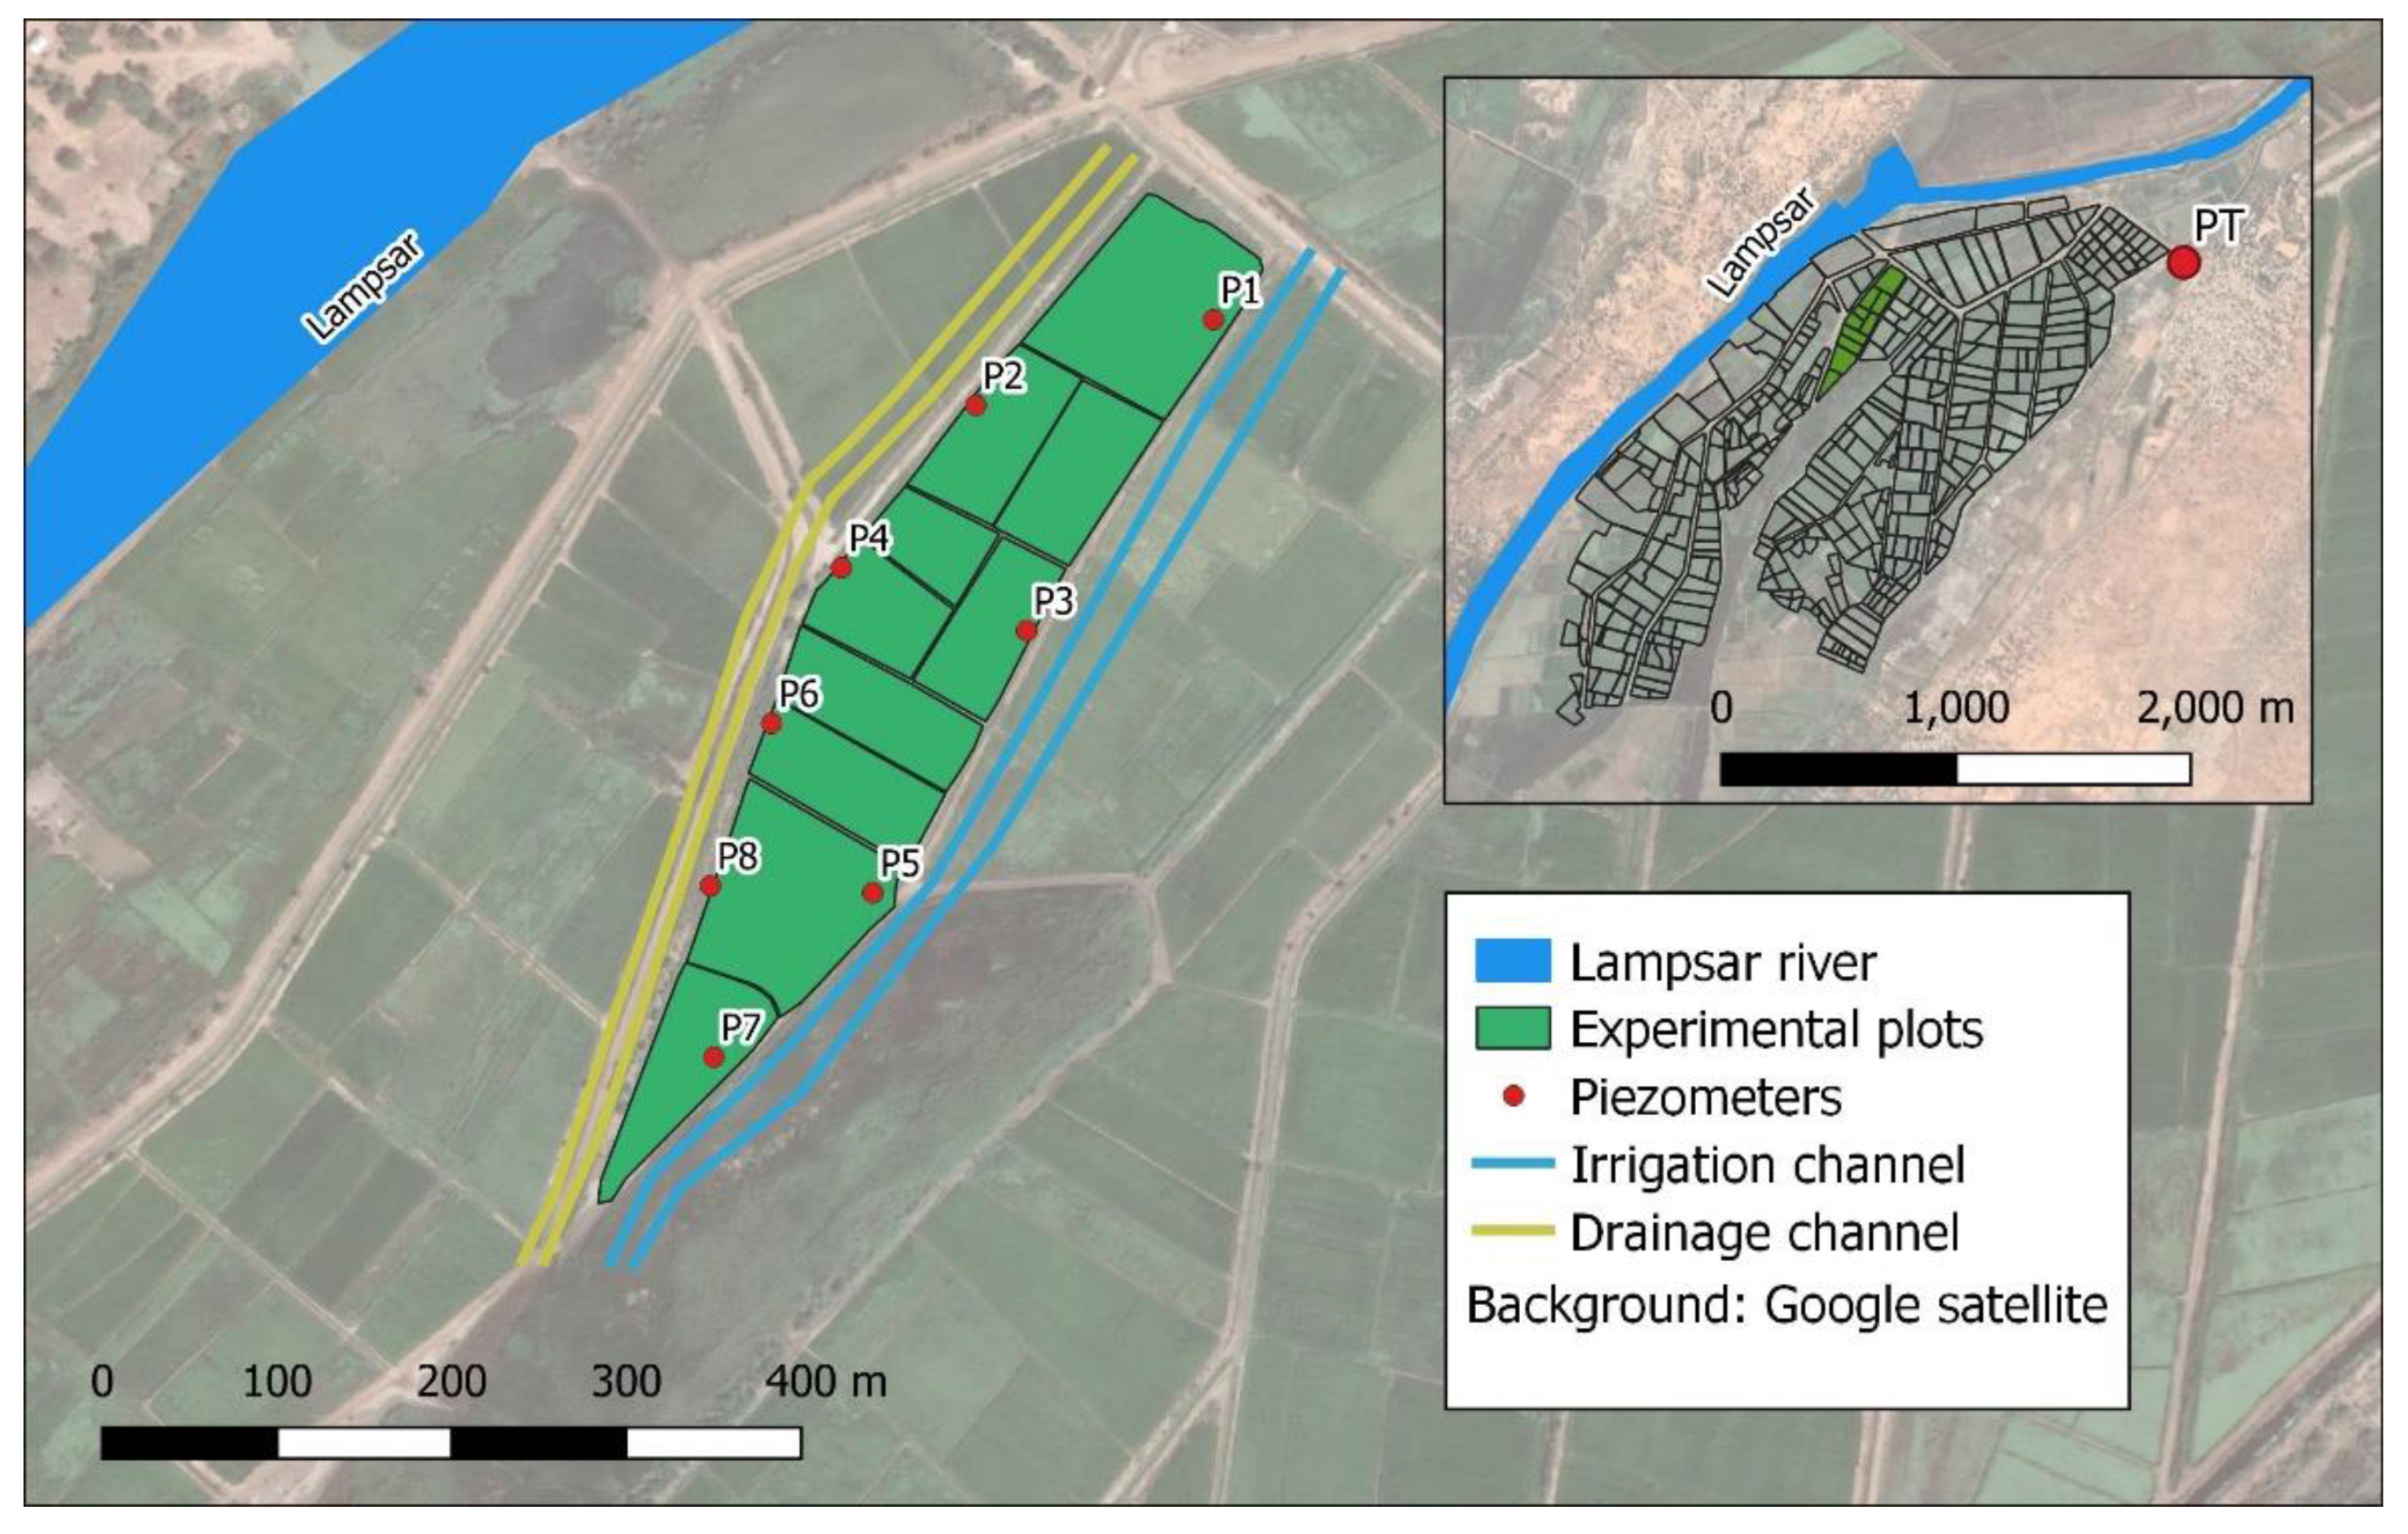
The Ndiaye site was equipped to monitor groundwater under rice cultivation, which constitutes by far the most important and above all the most water-consuming activity. Thus, a mesh of 07 plots was selected. The perimeter extends over 800 m by 100 m and the areas of the plots vary between 0.8 and 1 ha (Figure 2).

2.2. Experimental System and Protocol

The experimental protocol set up consists of a device for monitoring the water pounding depth in the irrigated plot (called afterwards a surface piezometer), and the monitoring of the soil and shallow groundwater using capacitive probes, suction cups and shallow piezometers. The different elements that make up the monitoring device as well as the different measurements carried out in the field are described below.
On the Ndiaye site, two lines of piezometers were installed (Figure 2): one line along the secondary irrigation channel (P1, P3, P5 and P7) and one along the secondary drainage channel (P2, P4, P6, and P8). The piezometers were 6 m deep and they were screened from the groundwater table to the bottom of the boreholes. A control piezometer (PT in Figure 2) was installed, outside any irrigated area, 2 km from the perimeter in the village. Piezometers were leveled using a differential GPS.
Manual piezometric level measurements were made three times a week. At the same time, two automatic CTD recorders were installed in piezometers P3 and P4. This allowed us to observe daily variations in the piezometric levels.
In addition to the piezometers installed for monitoring the groundwater table, a surface piezometer was installed in the middle of one of the plots. It consisted of a 63 mm diameter PVC pipe with a length of 1.5 m. This tube was sunk 50 cm into the soil and screened at the level of the surface water. A pressiometric probe (DIVER type) was placed inside the tube to monitor the variations in water pounding depth above the cultivated plots during the irrigation program. Capacitive probes of DECAGON 5TE type [24] were placed successively at 20, 40, 60 and 80 cm depths in the soil. They were set up for the daily recording of soil water content, temperature, and the apparent electrical conductivity of the soil.
Monitoring started in February 2013 with the hot counter-season rice campaign and continued until May 2014. After the rice campaign in the hot off-season (February to June 2013), the farmers observed a fallow during the rainy season before carrying out a market gardening campaign between December 2013 and April 2014.

3. Results and Discussions

3.1. Monitoring Water Dynamics in the Soil–Aquifer System

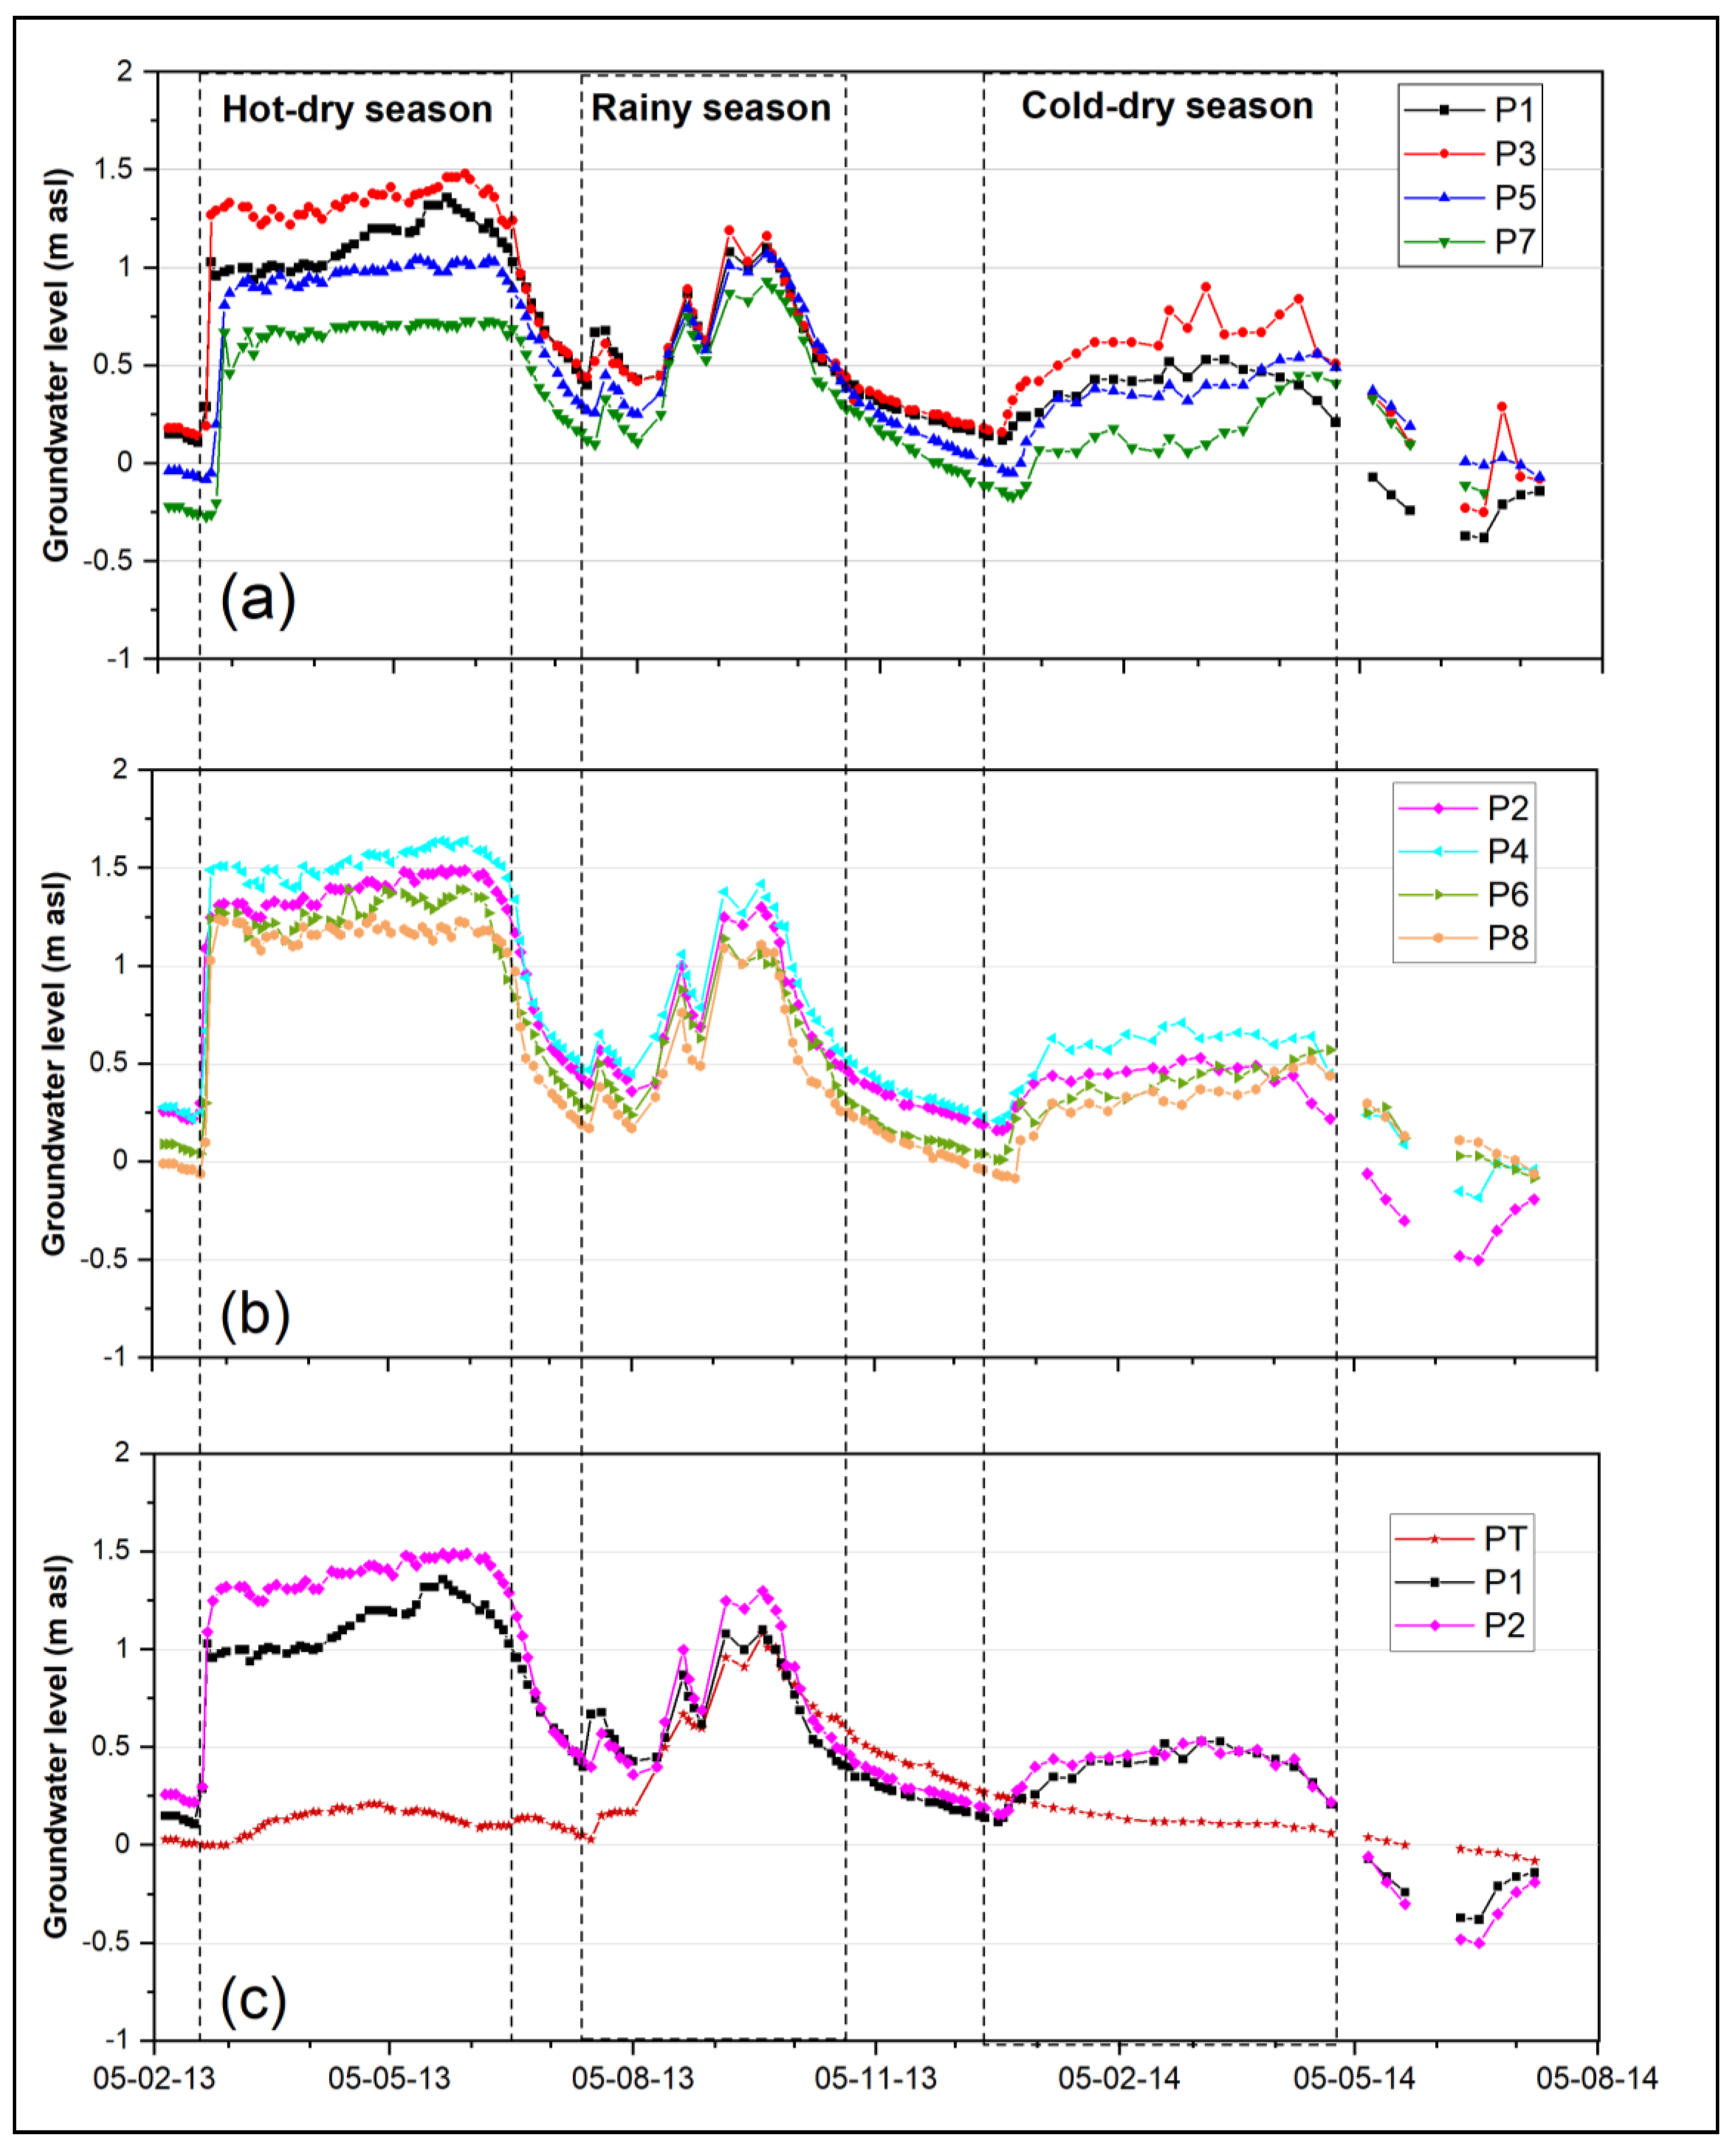
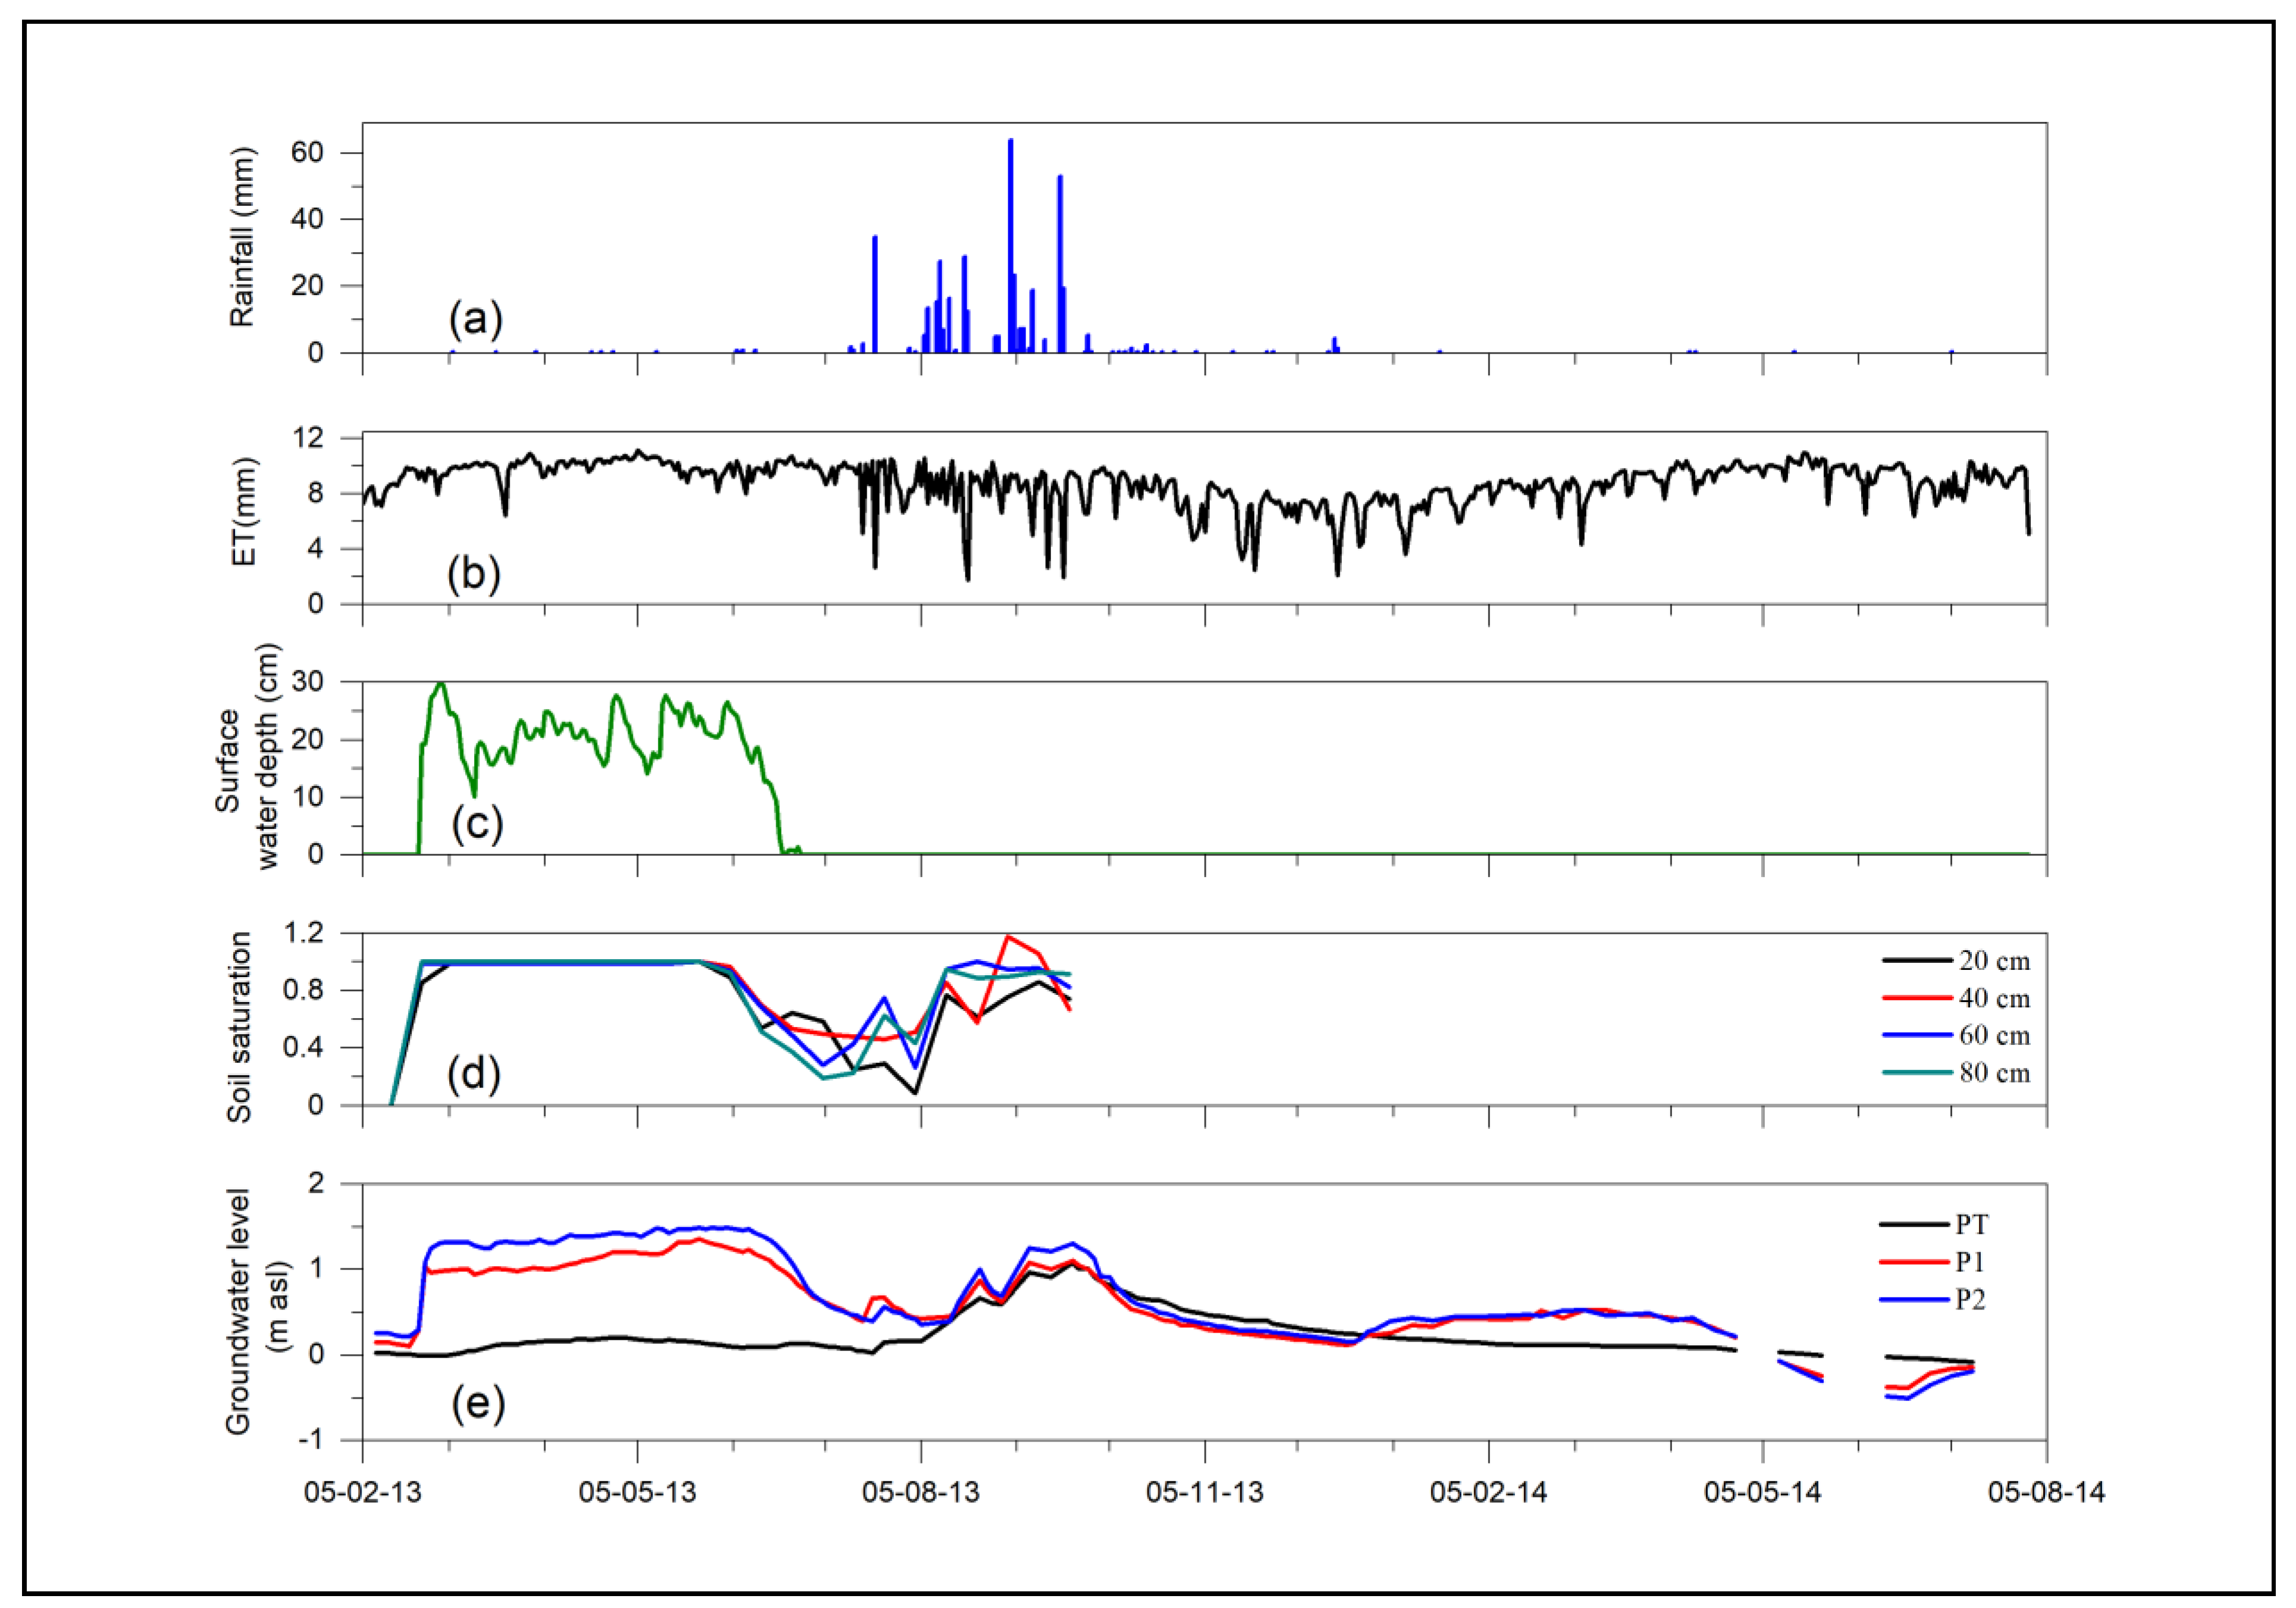
The dynamics of the aquifer were successively monitored during the hot dry season, the rainy season and the cold dry season. Figure 3 shows the evolution of groundwater levels for the piezometers located along the irrigation channel (Figure 3a), along the drainage channel (Figure 3b), and for the remote-control piezometer (Figure 3c). The dynamic of groundwater levels is also compared with the irrigation water pounding depth, the effective saturation of the soil, the daily rain and the daily evapotranspiration rates (ETR) (Figure 4).
The groundwater levels rose during the different periods of water supply with different amplitudes, and it dropped considerably in the dry cold season (Figure 3). During rice cultivation (irrigation during the hot dry season), there was a significant increase of at least 1 m in the groundwater level from the first water supplies. This rise was observed both in the piezometers located along the irrigation channel and in the piezometers located along the drainage channel, and it was correlated with the soil water saturation profile (Figure 4).
Groundwater levels remained almost constant throughout the irrigation period despite high evapotranspiration. At the end of irrigation, water was gradually drained from the soil and the aquifer gradually returned to its groundwater level as before irrigation. This decline seems to be linked to the evaporative demand, which remained significant.
During the same period, the control piezometer, located 1500 m from the plots, indicated a slight increase in groundwater level (around 20 cm) and a delayed response from the start of the irrigation campaign (Figure 3c). This is most likely due to lateral groundwater flow from the irrigated plots, reflecting a regional influence of irrigation which does not seem to be limited to a vertical flow at the level of the irrigated plots.
During the rainy season, aquifer recharge is regional and was observed in all piezometers. The piezometric surface showed a similar trend to the soil water content, with a fast reaction to rainy events. Each recharge event was almost immediately followed by a decrease in the piezometric level, which can be attributed to the evaporative demand.
During the dry cold season, when market gardening is undertaken, the recharge observed was limited, but slightly more observed at the piezometers located along the irrigation canal (Figure 3a). This can be explained by the fact that even if the irrigation canal is used, the quantity of water delivered to the plots is significantly lower, without any immersion as for rice growing. Water requirements for onion (main speculation during the monitored market gardening campaign) are estimated to be between 6 and 9 mm/day depending on the stage of development. This of course contributes somehow to aquifer recharge, as well as the water percolating from the irrigation canals. Unlike rice growing, wherein irrigation prevails, during market gardening, groundwater recharge seems very local and does not affect the control piezometer.
Outside periods when water is supplied to agricultural plots, groundwater levels drop rapidly and can reach levels as low as −0.5 m, below sea level, which further indicates the importance of evaporative processes in the area.

3.2. Calculation of Water Balance

To estimate the quantities of water supplied to the aquifer, water balances were calculated for the hot dry season wherein rice irrigation is carried out, and for the rainy season.

3.2.1. Water Balance at the Scale of the Irrigated Plot

A plot-scale water balance was calculated over the rice-growing period using Equation (1) [25]:
W a t s u p p l   =   E T R + Δ S S o i l + Δ S G W + D r a i n L o s s
The quantity of water supplied during irrigation ( W a t s u p p l ) was estimated using the surface piezometer. The rice ETR was calculated using the Penman–Monteith FAO method. Variations in soil water stock ( Δ S S o i l ) were estimated using the results of the capacitive probes. The soil maximum storage capacity was estimated at 328 mm based on the maximum value measured by the capacitive probes. Soil water storage reached its maximum in the first days of irrigation, and it hardly changed until irrigation stopped [26]. Variations in groundwater reserves ( Δ S G W ) are estimated from piezometric fluctuations. As indicated by the data, rice growing induces an aquifer rise of 1.5 m. Considering a free groundwater table and assuming an effective porosity of 25%, Δ S G W can be estimated as 375 mm. Drainage losses ( D r a i n L o s s ) are estimated from the balance equation.
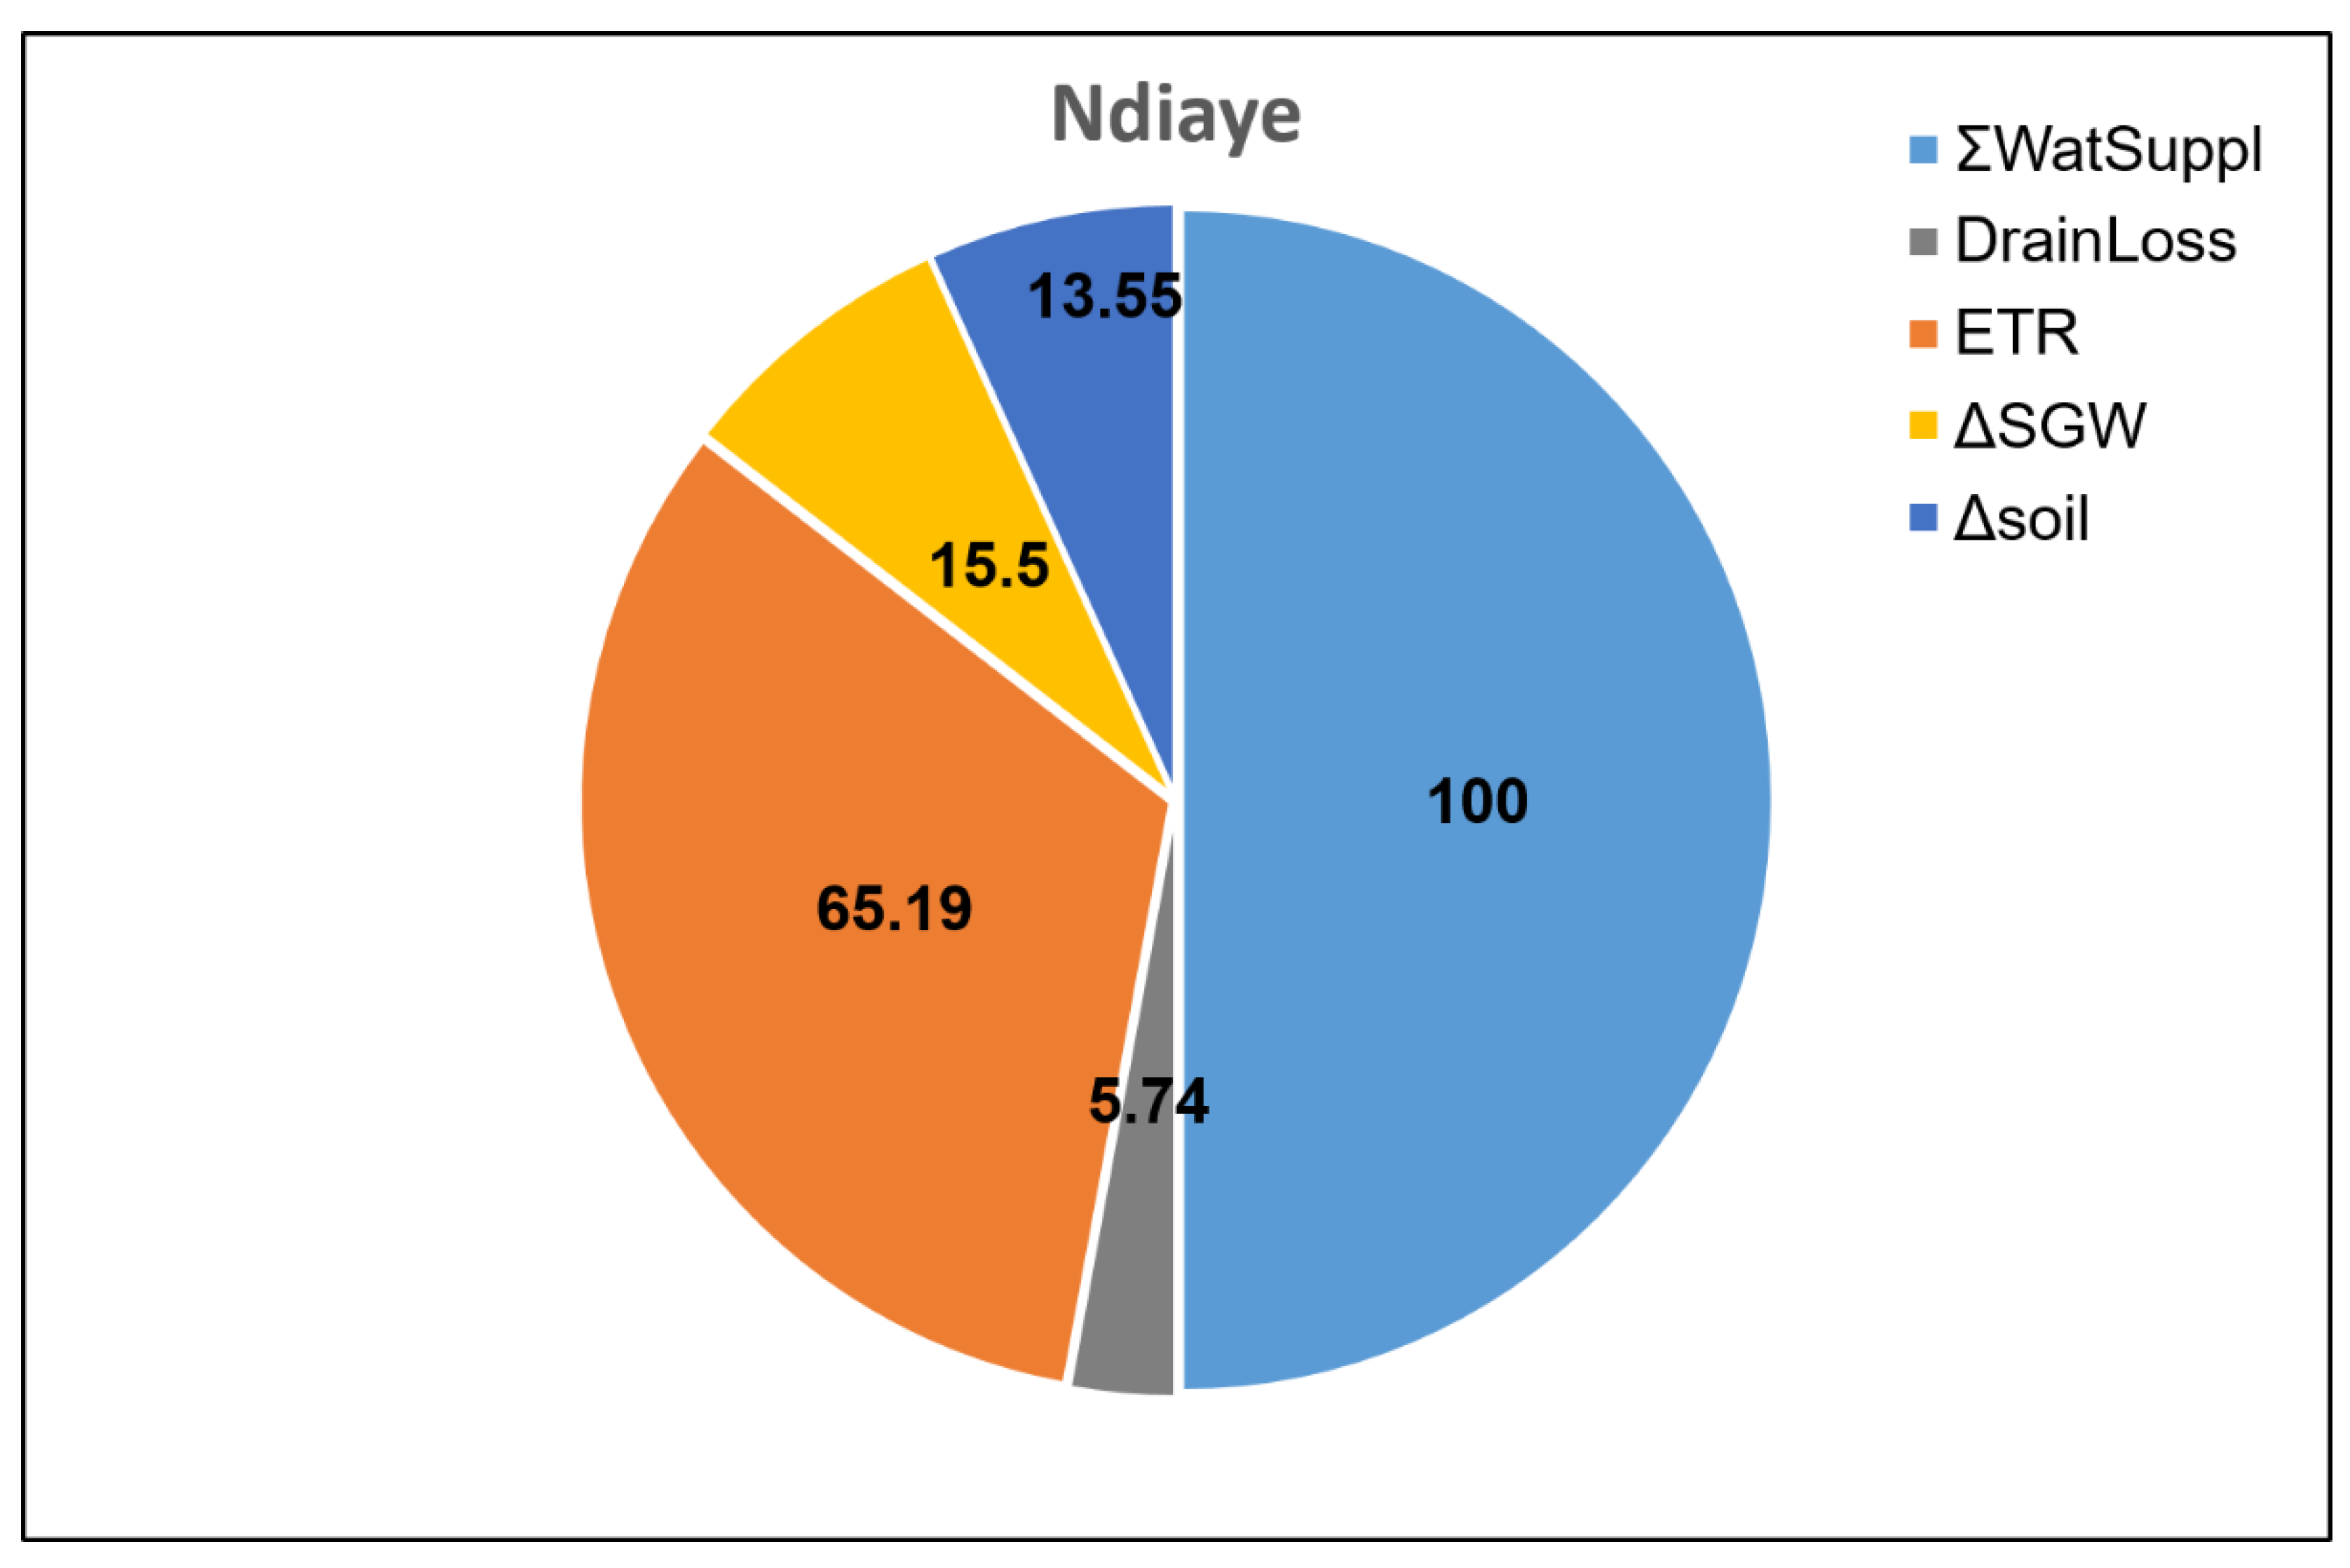
The results (Figure 5) show that most of the irrigation water supply is taken up by evapotranspiration, which represents more than 65% of the water consumption supplied by irrigation. The rice-growing water demand is ensured with an efficiency of 65%. This efficiency may be lower than these values due to the difficulty in quantifying the losses. The variations in groundwater reserves represent 15.5% of the irrigation water, with a corresponding aquifer rise.

3.2.2. Hydro-Climatic Water Balance

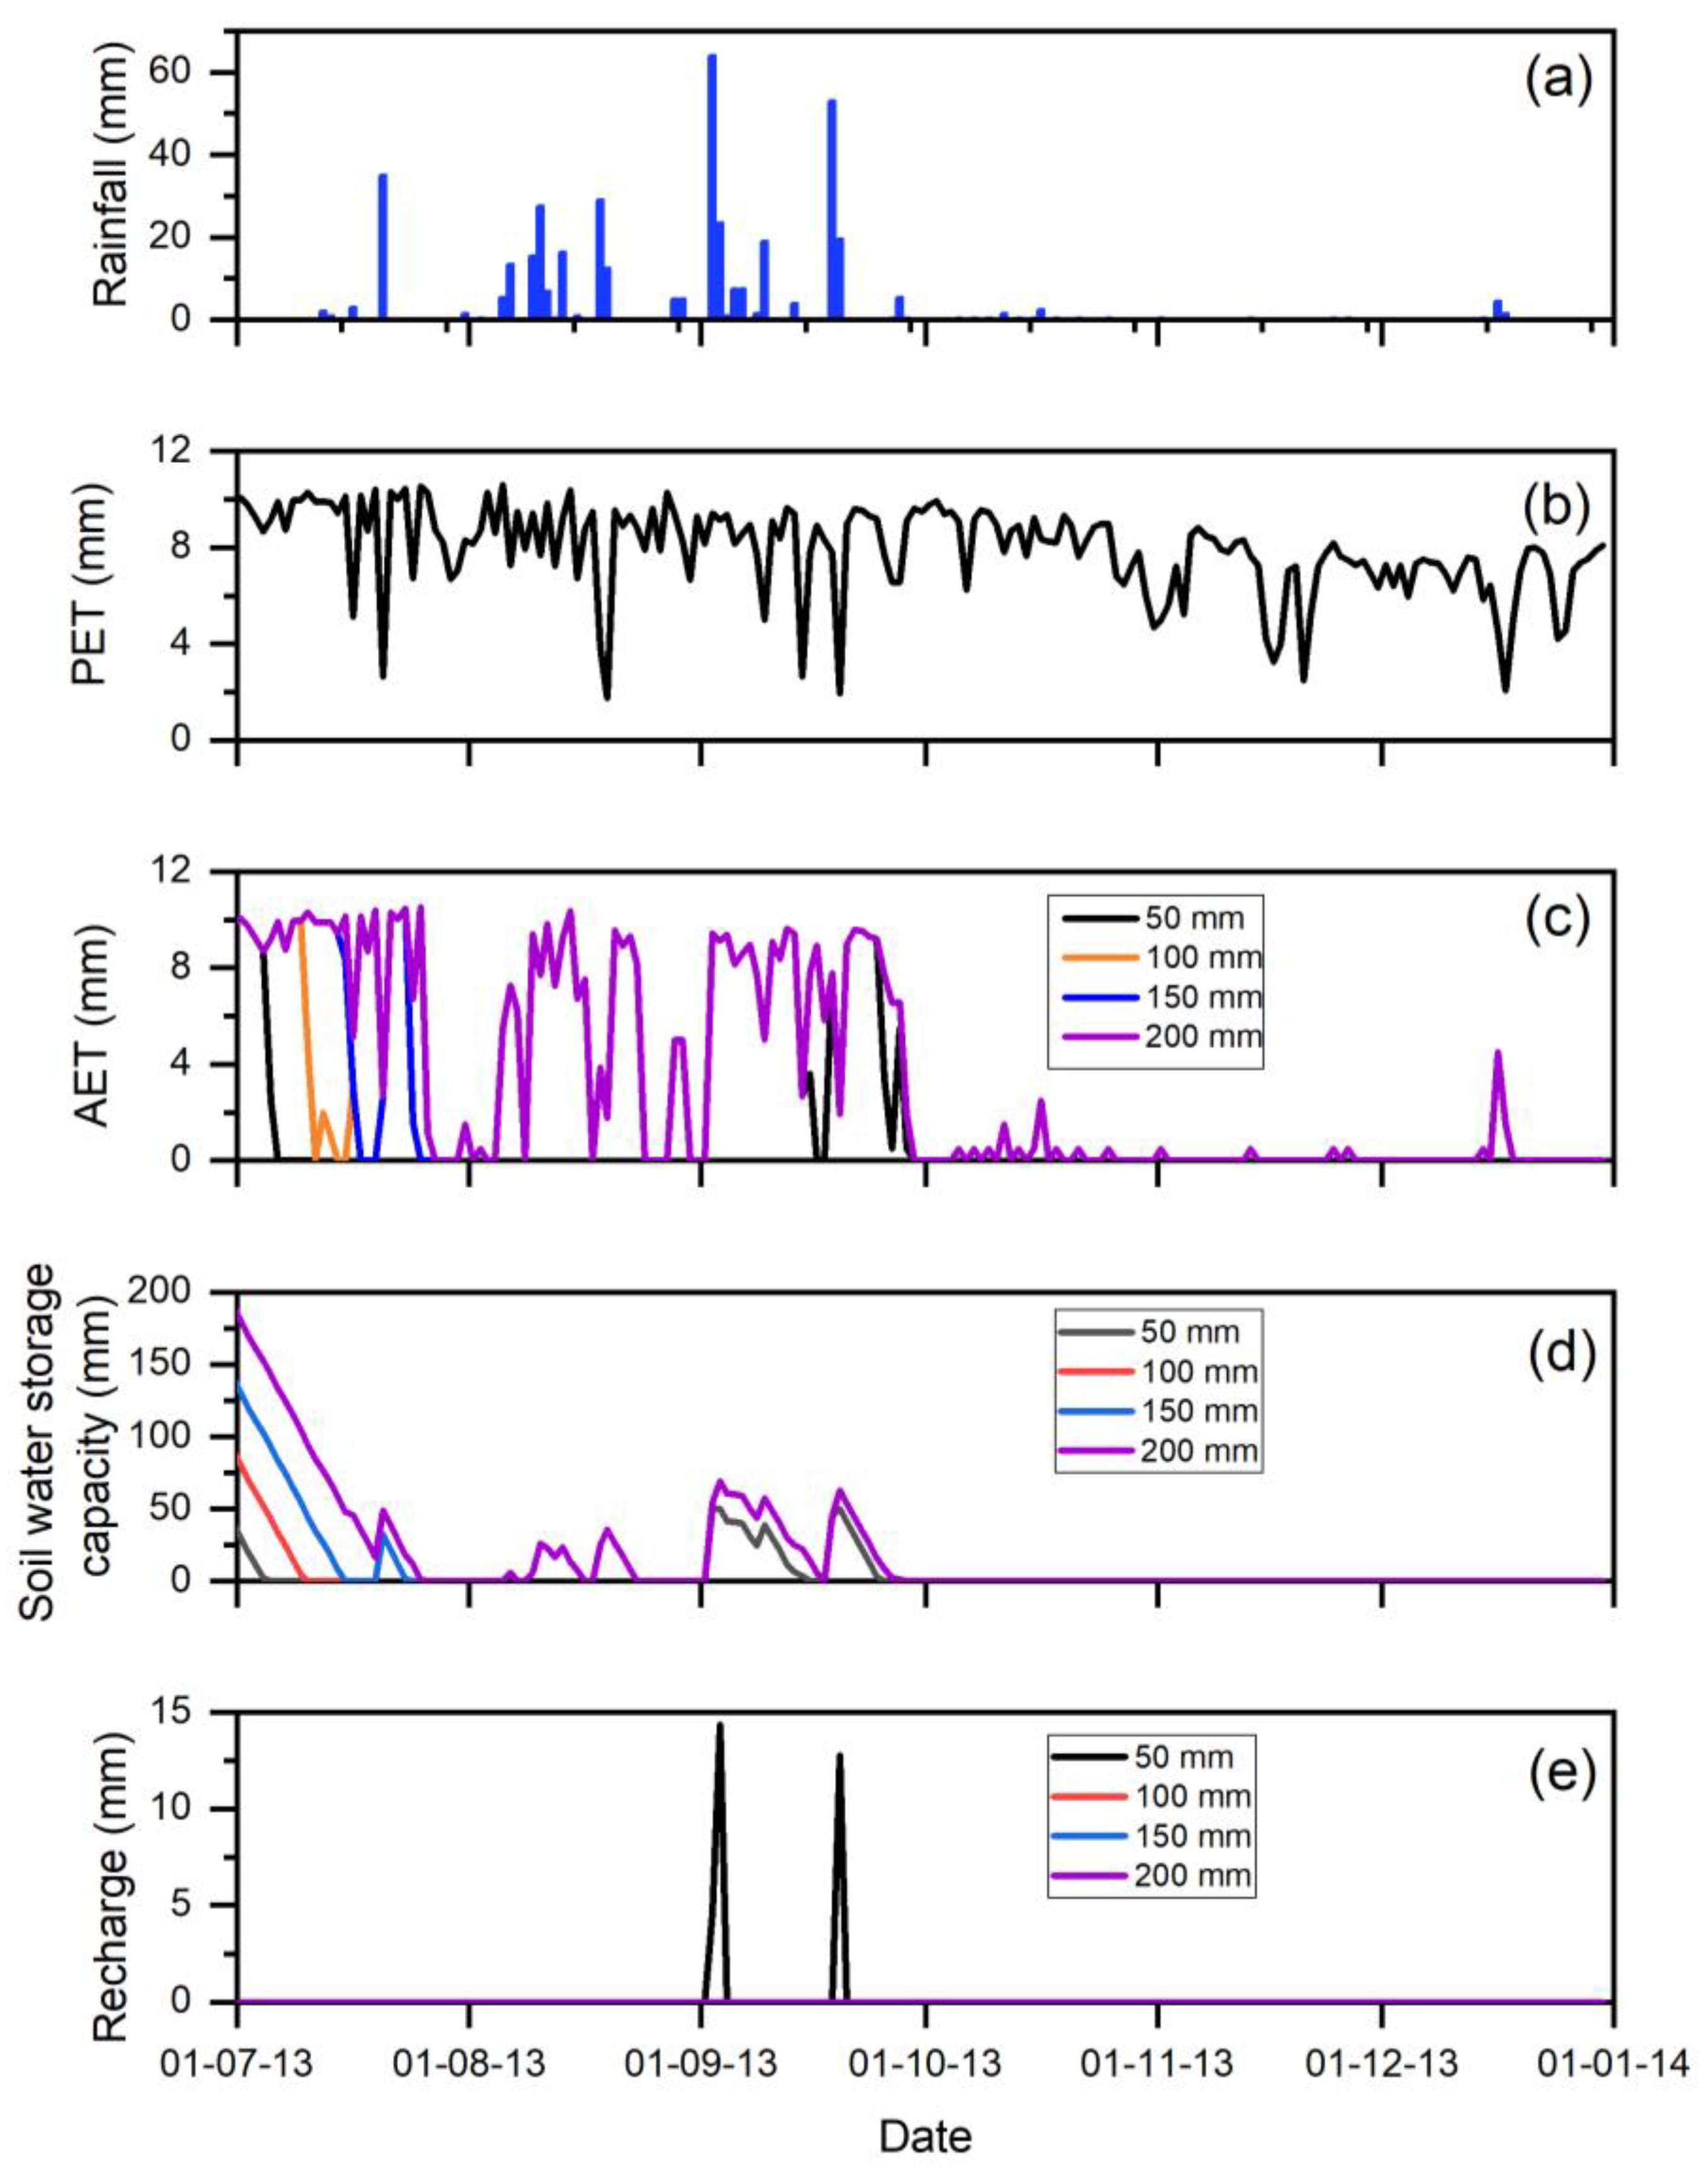
The hydro-climatic balance calculation aims to verify the hypothesis of aquifer recharge by rain. This water balance was calculated for the period from July to December 2013. The calculation of infiltration is based on the Thornthwaite water balance model [27]. Daily weather data from 2013 at the Ndiaye station were used. ET values were calculated using the Penman–Monteith formula. Four maximum soil water storage capacity values (Smax) were considered (50, 100, 150 and 200 mm). The assumption was made that the soil water storage is maximum in July, just after irrigation. The calculations imply a non-zero effective water value of 31 mm in September only, under the assumption of a maximum soil water storage capacity of 50 mm (Table 1). For the other Smax values, no water surplus is available.
To better understand these values, an analysis of the comparative evolution of the different parameters is shown in Figure 6. It shows that the soil water storage is completely consumed before the start of the rainy season because of the strong evaporation. The first rainy events in July are not significant enough to allow for reaching again the maximum storage capacity. Only the September successive rain events allow the soil water storage capacity to be filled up again (in the case of a Smax of 50 mm) to allow infiltration towards the aquifer. However, the piezometric surveys clearly indicate a recharge of the aquifer following rainy events of intensity greater than 20 mm. This gap can be explained by several factors. In particular, the fact that the calculated ET does not correspond to the evapotranspirated water, or that the aquifer is recharged following rainy events, not by direct impluvium but by the river effect. However, the fact that the aquifer reaction is even observed at the level of the control piezometer does not act in favor of this last hypothesis.

3.3. Monitoring of Salt Dynamics in the Soil-Aquifer System

The salinity of shallow groundwater was monitored from February 2013 until June 2014 using CTD DIVER probes installed in the piezometers P3 and P4, to record the daily piezometric levels, temperatures and EC of groundwater (Figure 7). In general, the aquifer electrical conductivity changes in opposition to changes in groundwater levels. During the early stage of the hot dry season and of the rice cultivation, which considerably raises groundwater levels, the electrical conductivity of groundwater is the lowest because it is recharged by the irrigation water, which has a lower mineralization. However, the results show that this dilution does not occur throughout the rice cultivation period. A few days after the start of irrigation, the electrical conductivity of groundwater starts to increase again. During the rainy season, the evolution of EC is more contrasted. At P3, a continuous increase is still observed during the rainy season. In a contrasting way, at P4, the electrical conductivity decreases rapidly during this rainy period, with some short episodes when it increases again in relation with rises in groundwater levels in response to rainy events. During the dry cold season, when groundwater levels are low, the electrical conductivity reaches values higher than 10 mS/cm. The water supply linked to the start of the market gardening campaign creates again a dilution which is better observed at P3. As for piezometric levels, this can be explained by the fact that P3 is located along the irrigation channel from which water percolates and dilutes the shallow groundwater.

4. Global Synthesis and Conceptual Model

The processes of water and solute transfers in the SRD irrigated plots were monitored for more than two years in Ndiaye. This regular monitoring made it possible to collect important information on the dynamics of the groundwater table and on the fluxes of water and salts through the soil and groundwater. A global synthesis of these results is proposed in the following, and a conceptual diagram of the operating mode of the soil-aquifer set is proposed.

4.1. Dynamics of Water and Solutes at the Scale of Irrigated Plots

The SRD region is characterized by low and unevenly time-distributed rainfall. Only August and September are rainy. This comes with a high evaporative demand characterized by an average daily PET of 10 mm/day. Water availability in the SRD is therefore mainly due to the presence of the Senegal River, which has many tributaries, including the Gorom–Lampsar axis used to feed the numerous agricultural plots and parcels in the region. The artificial control of the river regime, with an almost constant flow, clearly justifies the practice of irrigated cultivation throughout the year, despite the harsh climatic conditions.
Rice cultivation, the dominant activity of the irrigated crops in the SRD, is practiced by submersion, and lasts around 100 days/year [28]. It can be practiced twice in the same year and on the same plot. However, such agricultural practices consume a lot of water, particularly because they are undertaken at the same time on most of the cultivated plots. Monitoring performed in the Ndiaye area has revealed that, throughout the rice cultivation period, the water pounding imposed on the surface of the plots is on average 15 to 20 cm, values confirmed by several previous studies [22,25,29]. The consequence of maintaining this large quantity of water on the ground level is the complete saturation of the soil profile and even water clogging. This has been confirmed here with the monitoring of water contents using the capacitive probes, showing a complete saturation during the rice cultivation period. In fact, agricultural perimeters are preferentially developed (in 90% of cases) in settling basins where soils of the hollaldé type prevail. Such soils are classified as heavy with a high percentage of clay, greater than 40%. Such clay minerals are made up of 60% smectite, which explains the swelling/shrinking behavior in contact with water. These soils are also characterized by low permeability, on the order of 1 mm/day [25]. However, these soils likely show significant overgrowth by saturation during irrigation, and pronounced shrinkage when they dry out after irrigation, causing their structure to subside [30].
Thus, the soils of the basins behave according to a moistening–drying cycle. Cracking appears slowly as soon as the soil begins to dry (around 15% moisture). Such cracking during the dry state promotes the infiltration of water and the recharge of the soil profile. This structural collapse effect does not exceed 40 cm in depth. Indeed, from 50 cm the clayey soils become compact and dry out only very slowly. The same soil cracking mechanism could explain the fact that, during the rainy season, there is an increase in the water content over the entire soil profile. The soil can even reach the saturation condition when successive rain events or heavy rain happen (>50 mm).
Market gardening constitutes an agricultural substitution and diversification activity in the DFS undertaken once during the year. The main speculations are onion and tomato, for which the required quantity of water is much less, for example between 6 and 12 mm for onions. Such a quantity of irrigation water is probably enough to create a recharge of the soil profile, although no monitoring of the water content could be carried out in market gardening.
Rice cultivation causes an increase in the piezometric levels with an amplitude of 1 to 1.5 m. This is observed locally in all piezometers located in the irrigated plots, but also regionally. This increase in aquifer levels was already reported in previous works, and some consider rice cultivation as the main factor in recharging the aquifer in the SRD. On the other hand, the local component of this recharge is predominant compared to its regional effect, although there are many agricultural perimeters where rice cultivation is practiced in the same period. The fact is that, even if the monitoring data at the control piezometer installed at Ndiaye show an increase in the groundwater level at this location of about 20 cm, no recharge is observed during the irrigation period in piezometers located further away from the agricultural developments [21]. Moreover, as soon as irrigation stops, the groundwater level drops instantly, and gradually returns to its initial level.
During the rainy season, all available piezometric data indicate an aquifer recharge. The same observation is made on the scale of the DFS, where the piezometers, far from the influence of the river and irrigation, show a recharge only during the rainy season. However, calculations made with the Thornthwaite water balance model indicate that such a recharge occurs only with a low value of 50 mm for the maximum soil water storage capacity. Higher values between 100 and 150 mm would fit better to clay soil, but calculations performed considering such values result in the absence of aquifer recharge. A first explanation can be provided by the state of cracking of the soil in dry conditions, as described by Ref. [30], which promotes the infiltration of rainwater. The second explanation comes from the fact that uncultivated soils are characterized by very high runoff coefficients [31]. Thus, rainwater would tend to accumulate in depressions and recharge the aquifer. Aquifer recharge during the rainy season has a more regional effect, since it is felt in all piezometers except near the river, where the effect of dam management plays a role. However, the effect of this recharge by rain, which leads to a rise in piezometric levels, is quickly wiped out by the strong evaporative recovery, with a further rapid decrease in the groundwater table. Market gardening has the same effect as rice farming, except that the amplitude of the groundwater table rise does not exceed 50 cm because the quantity of water used for irrigation is much lower.
In short, the water functioning of the soil–aquifer in the DFS can be summed up as a wetting–drying cycle for the soil and an ascent–discharge cycle for the aquifer. In fact, the bare uncultivated soil is dry and cracked due to the collapse of clays. A large water supply creates the recharge of the soil profile and the recharge of groundwater, the amplitude and duration of which depend on the quantities of water supplied (irrigation, surplus water from rain). When water supply stops, there is a gradual return to a dry state of the soil and the aquifer to its basic level.

4.2. Conceptual Model

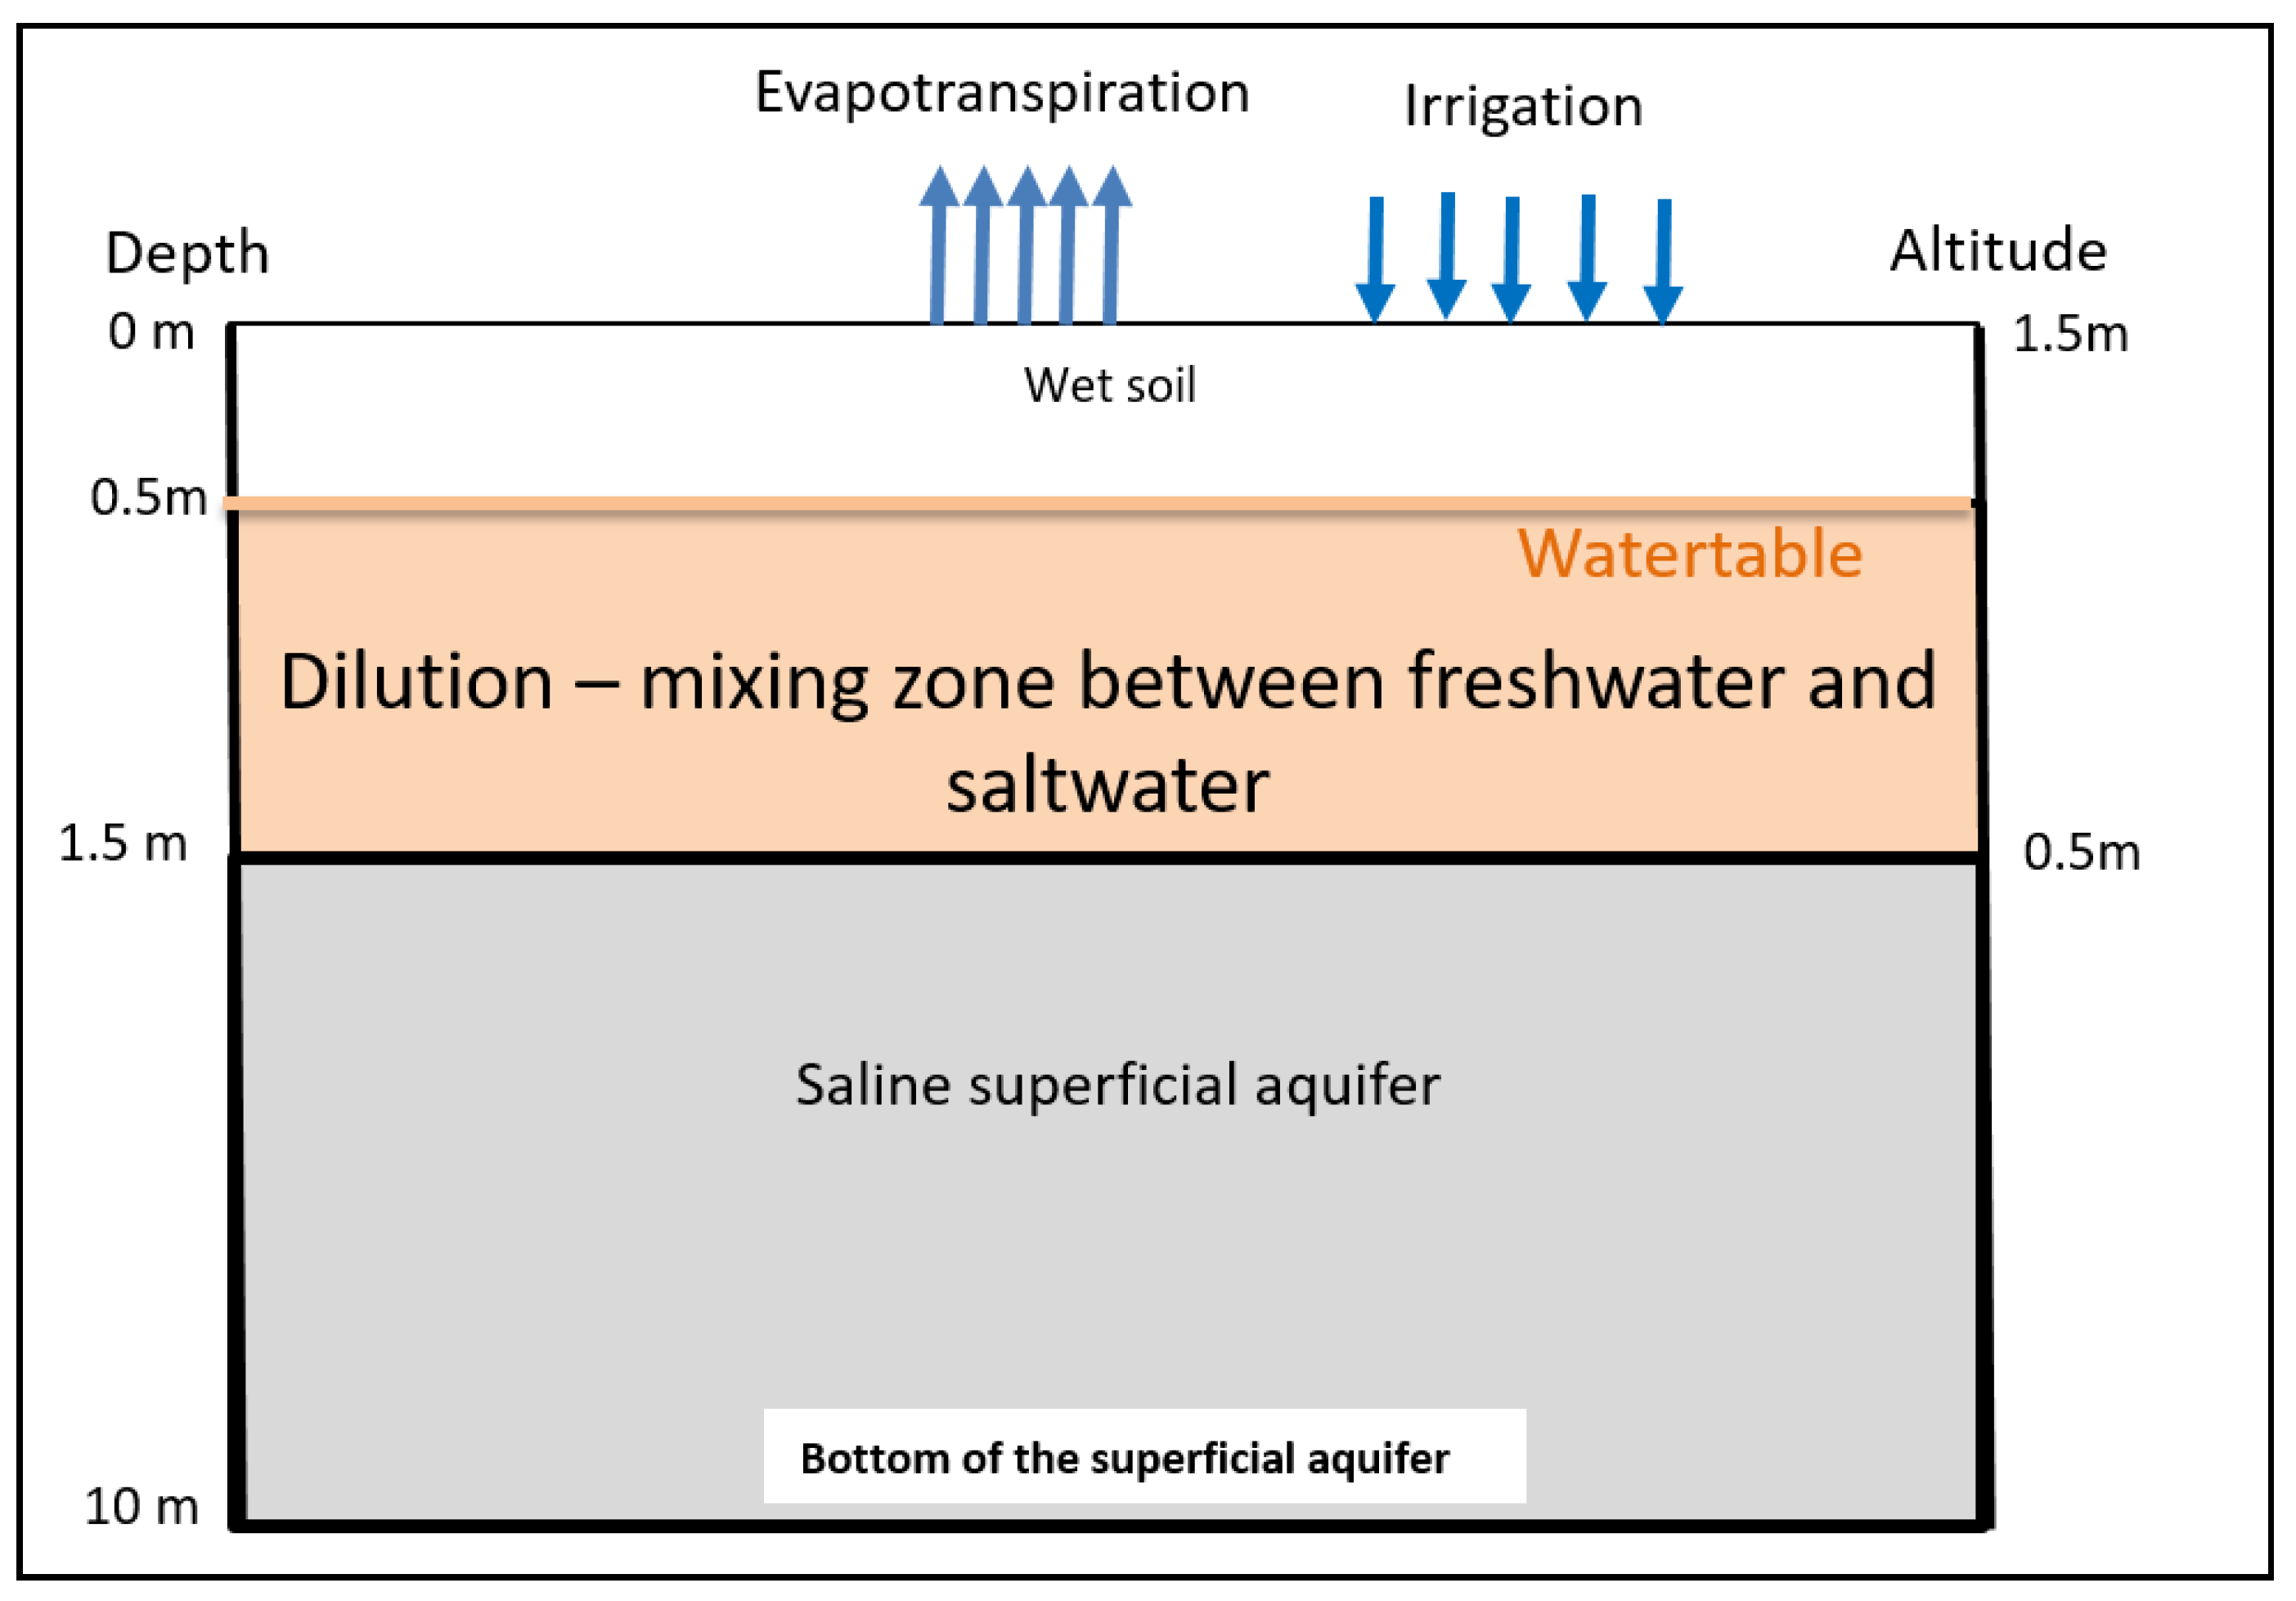
From all these observations made in the field, a conceptual model of the dynamics of water and solute transfers can be proposed at the scale of the irrigated plots in the SRD (Figure 8 and Figure 9).
During dry periods (excluding irrigation periods and rainy season), soils of clay type are subject to strong evaporative processes which cause desiccation and clay collapse, causing in turn cracks at the soil surface. The soil profile contains salty water, trapped in the sediments, with increasing concentrations of solutes with depth. Evaporation further increases the salinity of the soil solution. The aquifer is at its lowest level, at an average depth of 1.5 m. It is characterized by a very high salinity, corresponding to an electrical conductivity around 20 mS/cm. During rice growing, the large quantity of fresh water supplied during irrigation events causes soil saturation over the entire profile. This induces a rise in groundwater levels, which becomes close to the ground surface, or even, in certain plots, can be in equilibrium with the irrigation water level. This creates a mixing zone below the surface of the soil where the water from the saltwater table can be diluted.
When irrigation stops, because of the high evaporative demand, the soils desaturate gradually and groundwater levels decrease and return to their starting levels. At the same time, there is an increase in the EC of the soil solution and groundwater, most probably due to the effect of evapotranspiration, which concentrates the solution, but also to the capillary rise from the aquifer, which delivers concentrated dissolved solutes into the unsaturated zone.
During the rainy and dry cold seasons, when water supplies are much lower than during rice growing periods, brief periods of soil moistening and groundwater rise occur, with little effect on the water status and salinity of the ground and the aquifer, since effects are quickly masked by evapotranspiration.

5. Conclusions

In the Senegal River Delta (DFS), the availability of water following the commissioning of the dams has allowed for the development of irrigated agriculture, resulting in a significant increase in the areas under development. Rice cultivation occupies most of this area, and its practice requires considerable water consumption. This inevitably leads to a percolation process towards the subsurface shallow aquifer. Following this recharge, a rise in the groundwater table causes upward vertical flows of water and salts that clog agricultural soils and produce excessive salinization, further accentuated by evaporation processes. The degradation of soils, after a few years of exploitation, is undoubtedly linked to this transfer of salts between groundwater and the soil. Sustainable management between the need for an increase in cultivated areas, and therefore the volumes of water used, and the need for a limitation of water percolation becomes the new challenge. A former hydrogeochemical study of shallow groundwater in the DFS [21] has confirmed its marine origin and, locally, its hyper-salty character due to overconcentration by evaporation. This explains the risks of soil degradation, particularly in sectors where groundwater is at a very shallow depth beneath the soil surface. However, the study of the geochemical processes responsible for the evolution of the mineralization of the aquifer does not allow us to uniquely identify the impact of irrigation on the salinity of the surface water table.
The experimental study allowed us to characterize the water and salt transfer processes in irrigated plots. Irrigation water contributes to recharging groundwater and to diluting the salinity of the soil and groundwater. However, when irrigation operations are stopped, groundwater levels decrease to their initial levels, and salinity increases again, in particular because of the evaporative recovery that appears to be the main driver of these processes. Thus, the transfer of water and solutes in the subsurface of the delta follows charging–discharging and dilution–concentration cycles controlled by the global water balance. From the perspective of the evolution of the quality of land, the results obtained here clearly indicate that, unfortunately, one cannot expect to observe, in the short- to middle-term, any significant reduction in soil salinization processes resulting from irrigation and the surface drainage of the cultivated parcels.

Author Contributions

Conceptualization, A.A.G., P.O., J.D., R.M., S.B.; methodology, A.A.G., P.O., J.W., J.D. and S.B.; formal analysis, A.A.G., J.W., P.O., S.B.; investigation, A.A.G., M.G.; data curation, A.A.G., P.O., S.B.; writing—original draft preparation, A.A.G.; writing—review and editing, A.A.G., P.O., S.B.; supervision, P.O., R.M., S.B.; project administration, A.A.G., P.O., J.D.; funding acquisition, A.A.G., R.M., P.O., J.D., S.B. All authors have read and agreed to the published version of the manuscript.

Funding

This research was funded by Wallonie-Bruxelles International (Belgium) in the framework of the bilateral cooperation with Senegal. Field surveys were also supported by the SAED (Senegal).

Institutional Review Board Statement

Not applicable.

Informed Consent Statement

Not applicable.

Acknowledgments

The research project was funded by WBI (Wallonie Bruxelles International, Belgium) in the framework of the bilateral cooperation with Senegal. Field surveys were also supported by the SAED (Senegal).

Conflicts of Interest

The authors declare no conflict of interest.

References

  1. Kamara, S. Développements Hydrauliques et Gestion d’un Hydrosystème Largement Anthropisé; Le delta du fleuve Sénégal. Ph.D. Thesis, Université d’Avignon et des Pays du Vaucluse, Avignon, France, Université Gaston Berger, Saint-Louis, Senegal, 2013; 447p. [Google Scholar]
  2. Fraval, P.; Bader, J.-C.; Mané, L.K.; David-Benz, H.; Lamagat, J.-P.; Diop Diagne, O. The quest for integrated and sustainable water management in the Senegal River Valley. In Proceedings of the 5th Conférence Inter-Régionale sur l’Environnement et l’Eau (ENVIROWATER 2002), EIER-ETSHER, Ouagadougou, Burkina Faso, 5–8 November 2002. [Google Scholar]
  3. Wopereis, M.; Ceuppens, J.; Boivin, P.; Ndiaye, A.; Kane, A. Preserving soil quality under irrigation in the Senegal River Valley. Neth. J. Agric. Sci. 1998, 46, 97–107. [Google Scholar] [CrossRef]
  4. Ghassemi, F.; Jakeman, A.J.; Nix, H.A. Salinization of Lands and Water Ressources; University of New South Wales Press Ltd.: Canberra, Australia, 1995. [Google Scholar]
  5. Marlet, S. Evolution des systèmes d’irrigation et gestion de la salinité des terres irriguées. In Proceedings of the Séminaire de Modernisation de L’agriculture Irriguée, Rabat, Maroc, 19–23 April 2004. [Google Scholar]
  6. Barbiéro, L.; Laperrousaz, C. Cartographie de la salinité dans la vallée du Sénégal. Succès d’une démarche ascendante. Pangea Inf. 1999, 31/32, 5–7, Société Géologique de France <insu-00957979>. [Google Scholar]
  7. Thomas, D.; Middleton, N. Salinization: New perspectives on a major desertification issue. J. Arid. Environ. 1993, 24, 95–105. [Google Scholar] [CrossRef]
  8. Food and Agriculture Organization of the United Nations (FAO). Water for Sustainable Food and Agriculture a Report Produced for the G20 Presidency of Germany; FAO: Rome, Italy, 2017. [Google Scholar]
  9. Saysel, A.K.; Barlas, Y. A dynamic model of salinization on irrigated lands. Ecol. Model. 2001, 139, 177–199. [Google Scholar] [CrossRef]
  10. Pitman, M.G.; et Läuchli, A. Global impact of salinity and agricultural ecosystems. In Salinity: Environment-Plants-Molecules; Läuchli, A., Lüttge, U., Eds.; Springer: Dordrecht, The Netherlands, 2001; pp. 3–20. [Google Scholar] [CrossRef]
  11. Marlet, S.; Job, J.-O. Processus et gestion de la salinité des sols. In Traité D’irrigation; Tiercelin, J.R., Vidal, A., Tardieu, H., Eds.; Tec& Doc—Lavoisier: Paris, France, 2006; pp. 797–822, 836–850. ISBN 978-2-7430-0910-6. [Google Scholar]
  12. Cheverry Claude. Contribution à L’étude Pédologique des Polders du lac Tchad: Dynamique des sels en Milieu Continental Subaride dans des Sédiments Argileux et Organiques; ORSTOM: Paris, France; Université Louis Pasteur: Strasbourg, France, 1974; 280p. [Google Scholar]
  13. Droubi, A. Géochimie des Sels et des Solutions Concentrées par Évaporation. Ph.D. Thesis, CNRS Université Louis Pasteur, Strasbourg, Germany, 1976; 175p. [Google Scholar]
  14. Ndiaye, M.K. Evaluation de la Fertilité des sols de l’office du Niger (Mali); Contribution à la recherche des causes et origines de la Dégradation des Sols dans le Kouroumari. Ph.D. Thesis, INP, Toulouse, France, 1987; 134p. [Google Scholar]
  15. Vallés, V.; Bourgeat, F. Geochemical determination of the gypsum requirement of cultivated sodic soils. Development of the therrnodynamic model «Gypsol» simulating the irrigation water-soil chemical interactions. Arid Soil Res. Rehabil. 1988, 2, 165–177. [Google Scholar] [CrossRef]
  16. Barbièro, L. Les sols alcalinisés sur socle dans la Vallée du fleuve Niger. Origines de l’alcalinisation et évolution des sols sous irrigation. Ph.D. Thesis, ENSA, Rennes, France, 1994; 210p. [Google Scholar]
  17. Montoroi, J.P.; Bellier, G.; et Delarivière, J.L. Détermination de la relation résistivité électrique—Teneur en eau au laboratoire. Application aux sols de Tunisie centrale. In Proceedings of the Colloque GEOFCAN Géophysique des sols et des Formations Superficielles, Bondy, France, 11–12 September 1997. [Google Scholar]
  18. Gueye, M.; Gning, A.A.; Ndiaye, M.; Ngom, F.D.; Malou, R.; Sow, E.H.; Sarr, R. Contribution of Electric Tomography, Chemical and Isotopic Tools to the Understanding of the Resilience and Salinization of Wetlands along the Northern Coast of the Cape-Verde Peninsula: The Case of the Retba Lake. J. Geosci. Environ. Prot. 2019, 7, 36–57. [Google Scholar] [CrossRef] [Green Version]
  19. Kotb, T.H.S.; Watanabeb, T.; Oginob, Y.; et Tanji, K.K. Soil salinization in the Nile Delta and related policy issues in Egypt. Agric. Water Manag. 2000, 43, 239–261. [Google Scholar] [CrossRef]
  20. Yao, F.; Xu, Y.; Lin, E.; Yokozawa, M.; Zhang, J. Assessing the impacts of climate change on rice yields in the main rice areas of China. Clim. Chang. 2007, 80, 395–409. [Google Scholar] [CrossRef]
  21. Gning, A.A.; Orban, P.; Gesels, J.; Ngom, F.D.; Dassargues, A.; Malou, R.; Brouyère, S. Factors controlling the evolution of groundwater dynamics and chemistry in the Senegal River Delta. J. Hydrol. Reg. Stud. 2017, 10, 133–144. [Google Scholar] [CrossRef]
  22. Diene, R.S. Riziculture et Dégradation des Sols en Vallée du fleuve Sénégal: Analyse Comparée des Fonctionnements hydro-Salins des Sols du Delta et de la Moyenne Vallée en Simple et Double Riziculture. Ph.D. Thesis, UCAD, Dakar, Senegal, 1998. [Google Scholar]
  23. SAED/DAIH/DHGE. Bilan de Prélèvements D’eau et D’énergie, Délégation de Dagana Campagnes SSF, SSC et HIV 2005; Technical Report; SAED: Saint-Louis, Sénégal, 2008; 22p. [Google Scholar]
  24. Decagon, 2010, 5TE, Water Content, EC and Temperature Sensors: Operator’s Manual. Version 7. Available online: https://www.ecotek.com.cn/uploads/6/download/Maunal-5TE-sensor-EN.pdf (accessed on 19 January 2021).
  25. Diaw, E.B. Modélisation du Transfert D’eau en Milieux Poreux non Saturé: Application à L’étude de la Recharge des Nappes D’eaux Souterraines en Région Soudano-Sahélienne. Ph.D. Thesis, Université Louis Pasteur, Strasbourg, France, 1996; 239p. [Google Scholar]
  26. Hammecker, C.; Van Asten, P.; Marlet, S.; Maeght, J.-L.; Poss, R. Simulating the evolution of soil solutions in irrigated rice soils in the Sahel. Geoderma 2009, 150, 129–140. [Google Scholar] [CrossRef] [Green Version]
  27. Allen, R.G.; Pereira, L.S.; Raes, D.; Et Smith, M. Crop Evapotranspiration. Guidelines for Computing Crop Requirements; FAO Irrigation and Drainage Paper; FAO: Rome, Italy, 1998; Volume 56, 15p. [Google Scholar]
  28. PGE (Plan de Gestion de l’Eau). Etude de la salinité des sols en riziculture non drainée dans le Delta du fleuve Sénégal. Zone du Gorm Aval: SAED/DPDR Technical bulletin n°13; KULeuven: Leuven, Belgium; SAED: Saint-Louis, Sénégal, 1997; 47p. [Google Scholar]
  29. Boivin, P.; Favre, F.; Hammecker, C.; Maeght, J.L.; Delarivière, J.; Poussin, J.C.; Wopereis, M.C.S. Processes driving soil solution chemistry in a flooded rice-cropped vertisol: Analysis of long-time monitoring data. Geoderma 2002, 110, 87–107. [Google Scholar] [CrossRef]
  30. Boivin, P.; Favre, F.; et Maeght, J.L. Les sols de la moyenne vallée du fleuve Sénégal: Caractéristiques et évolution sous irrigation. Etude Gest. Sols. 1998, 5, 235–246. [Google Scholar]
  31. Favre, F.; Boivin, P.; Wopereis, M.C.S. Water movement and soil swelling in a dry, cracked Vertisol. Geoderma 1997, 78, 113–123. [Google Scholar] [CrossRef]
Figure 1. Extension of irrigated plots and water courses in the Senegal River Delta.
Water 13 00311 g001
Figure 2. Location of piezometers in the Ndiaye site.
Water 13 00311 g002
Figure 3. Fluctuation of the groundwater level in the piezometers located along the irrigation channel (a), along the drainage channel (b) and in a control piezometer located 2000 m outside the irrigated plot (c).
Water 13 00311 g003
Figure 4. Comparative evolution of the different hydrological parameters: rainfall (a), actual evapotranspiration (b), the surface water level in the irrigated plot (c), soil saturation (d) and groundwater levels (e).
Water 13 00311 g004
Figure 5. Description in percentages of the different terms of the water balance at the plot scale during irrigation.
Water 13 00311 g005
Figure 6. Comparative evolution of recharge as a function of STOMAX values and comparison between the terms of the water balance: rainfall (a), potential evapotranspiration (b), actual evapotranspiration (c), soil water storage capacity (d) and recharge (e).
Water 13 00311 g006
Figure 7. Comparative evolution of the piezometric level and the EC of the shallow groundwater at the P4 (a) and P3 (b) piezometers.
Water 13 00311 g007
Figure 8. Conceptual diagram of the water and saline functioning of the soil–aquifer system in the irrigated plots of the DFS in dry periods.
Water 13 00311 g008
Figure 9. Conceptual model of the water and saline functioning of the soil–aquifer system in the irrigated plots of the DFS during rice growing.
Water 13 00311 g009
Table 1. Calculation results using the Thornthwaite method for year 2013.
Smax = 50 mmSmax = 100 mmSmax = 150 mmSmax = 200 mm
DateRainfall (mm)PET (mm)AET (mm)Water Surplus (mm)
13 Jul.41280.8241.00000
13 Aug.140.5260.2140.50000
13 Sept.207243.8207.031.7000
13 Oct.8262.88.00000
13 Nov.2202.42.00000
13 Dec.6.5206.26.50000
Publisher’s Note: MDPI stays neutral with regard to jurisdictional claims in published maps and institutional affiliations.