
Impacts of Agricultural Areas on Spatio-Temporal Variability of Daily Minimum Extreme Flows during the Transitional Seasons (Spring and Fall) in Southern Quebec


Abstract
1. Introduction
- Identify factors that influence spatial variability in daily minimum extreme flows in southern Quebec in spring (April to June) and fall (October to December). This objective is based on the hypothesis that, due to the differences in the mechanisms and processes affecting daily minimum extreme flows in the spring and fall, the factors affecting spatial variability also differ during these seasons in Quebec. It is important to remember that minimum extreme flows in spring are mainly associated with recession (surface runoff), whereas in fall they are generally associated with the direct recharge of bedrock aquifers during low-water events.
- Compare the temporal variability, or long-term trend (stationarity of hydrological series), of daily minimum extreme flows in spring and fall. This objective is based on the hypothesis that daily minimum extreme flows decrease in spring, due to a decrease in snowfall in winter and early snowmelt, and in fall, due to increased evapotranspiration caused by higher temperatures in summer and early fall.
- Finally, the 2010s is considered the wettest decade on record in North America. Given that this moisture caused several catastrophic floods in Quebec over the course of the decade, its impact on the evolution of daily minimum extreme flows during these seasons should be analyzed. We will test the hypothesis of whether this moisture caused a significant increase in daily minimum extreme flows in the spring and fall, in addition to flooding.
2. Materials and Methods
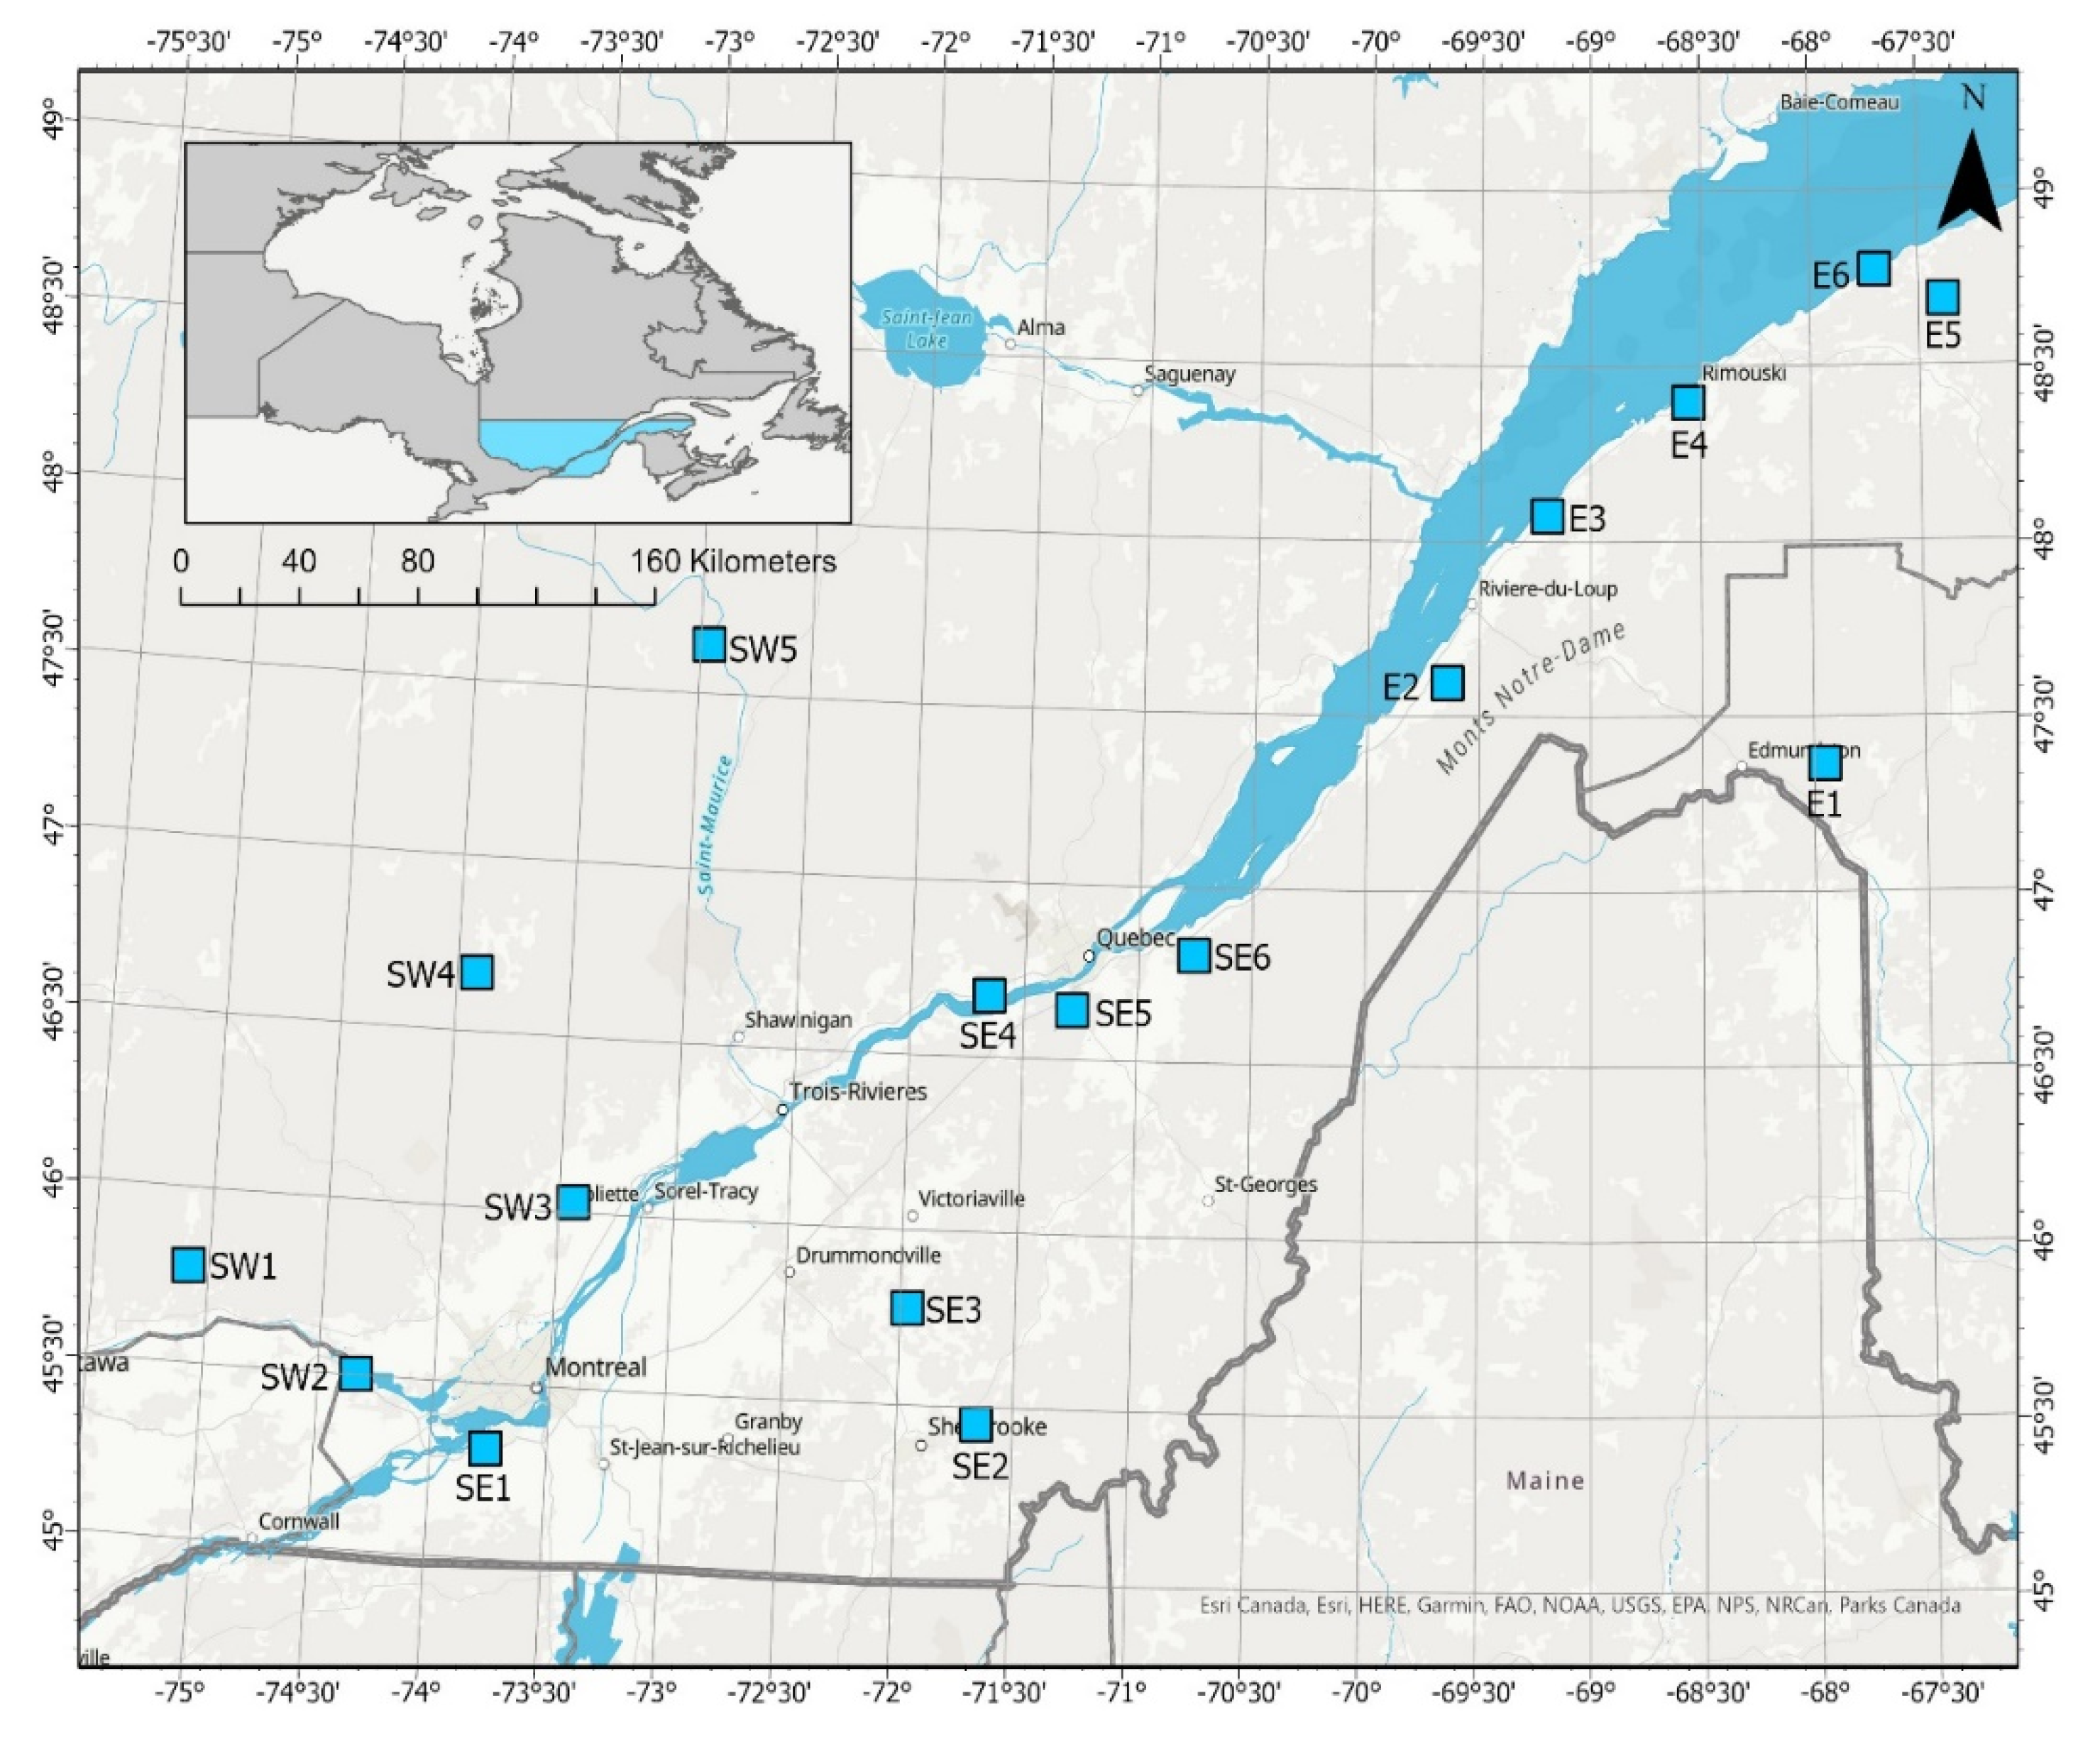
2.1. Description of the Watersheds and Data Sources
2.2. Statistical Analysis of the Hydrological Series
3. Results
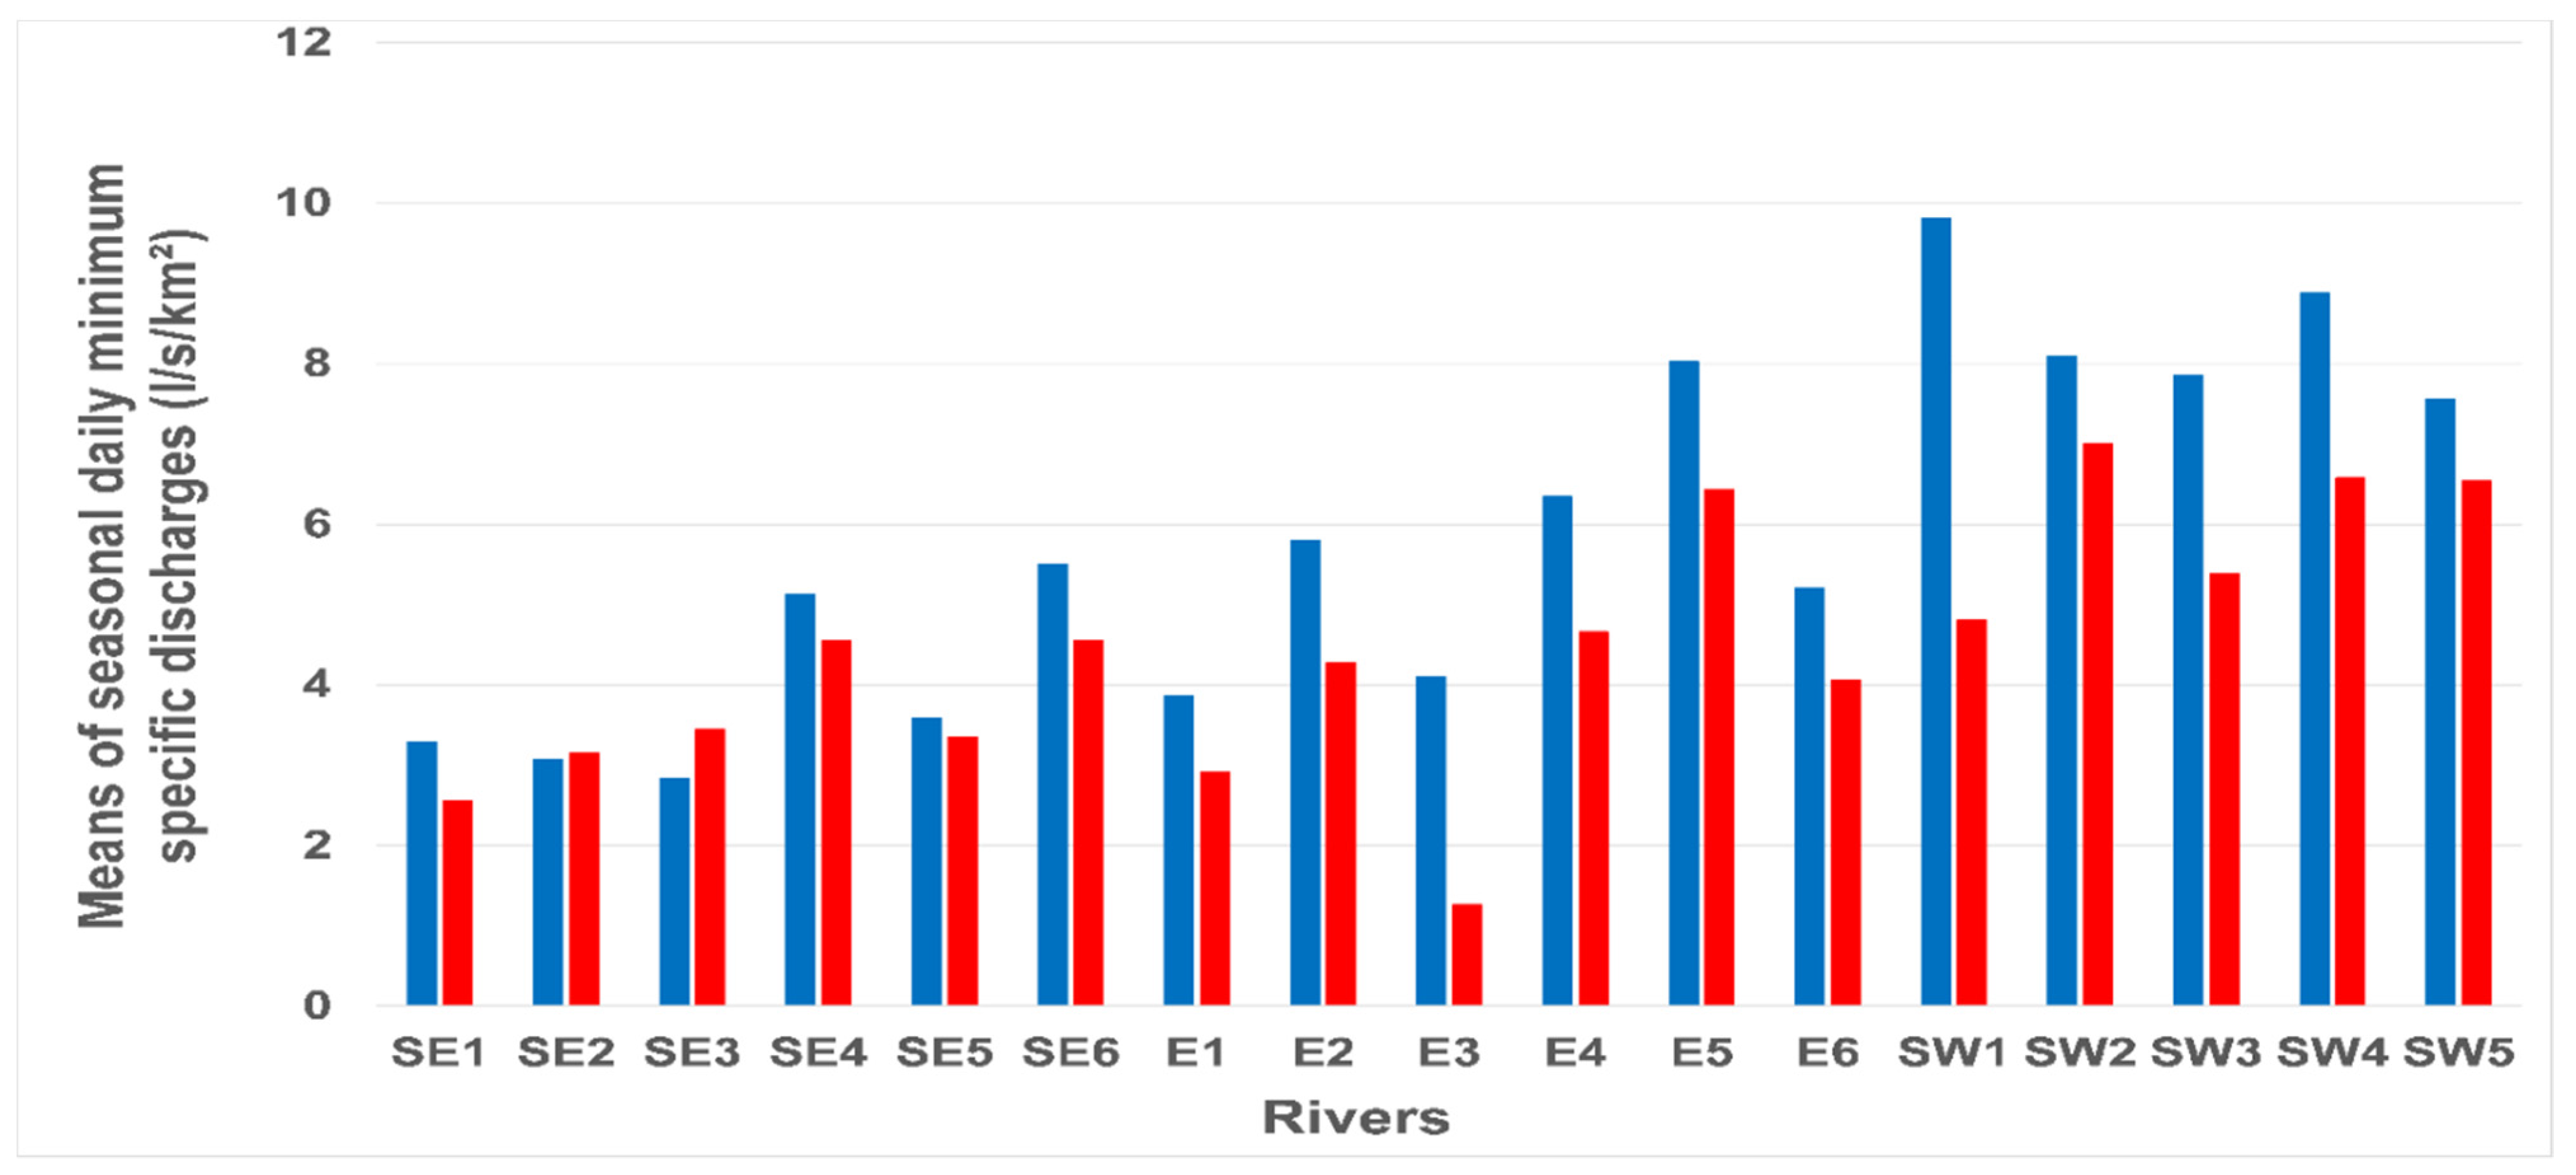
3.1. Comparison of Spatial Variability of Daily Minimum Extreme Flows in Spring and Fall
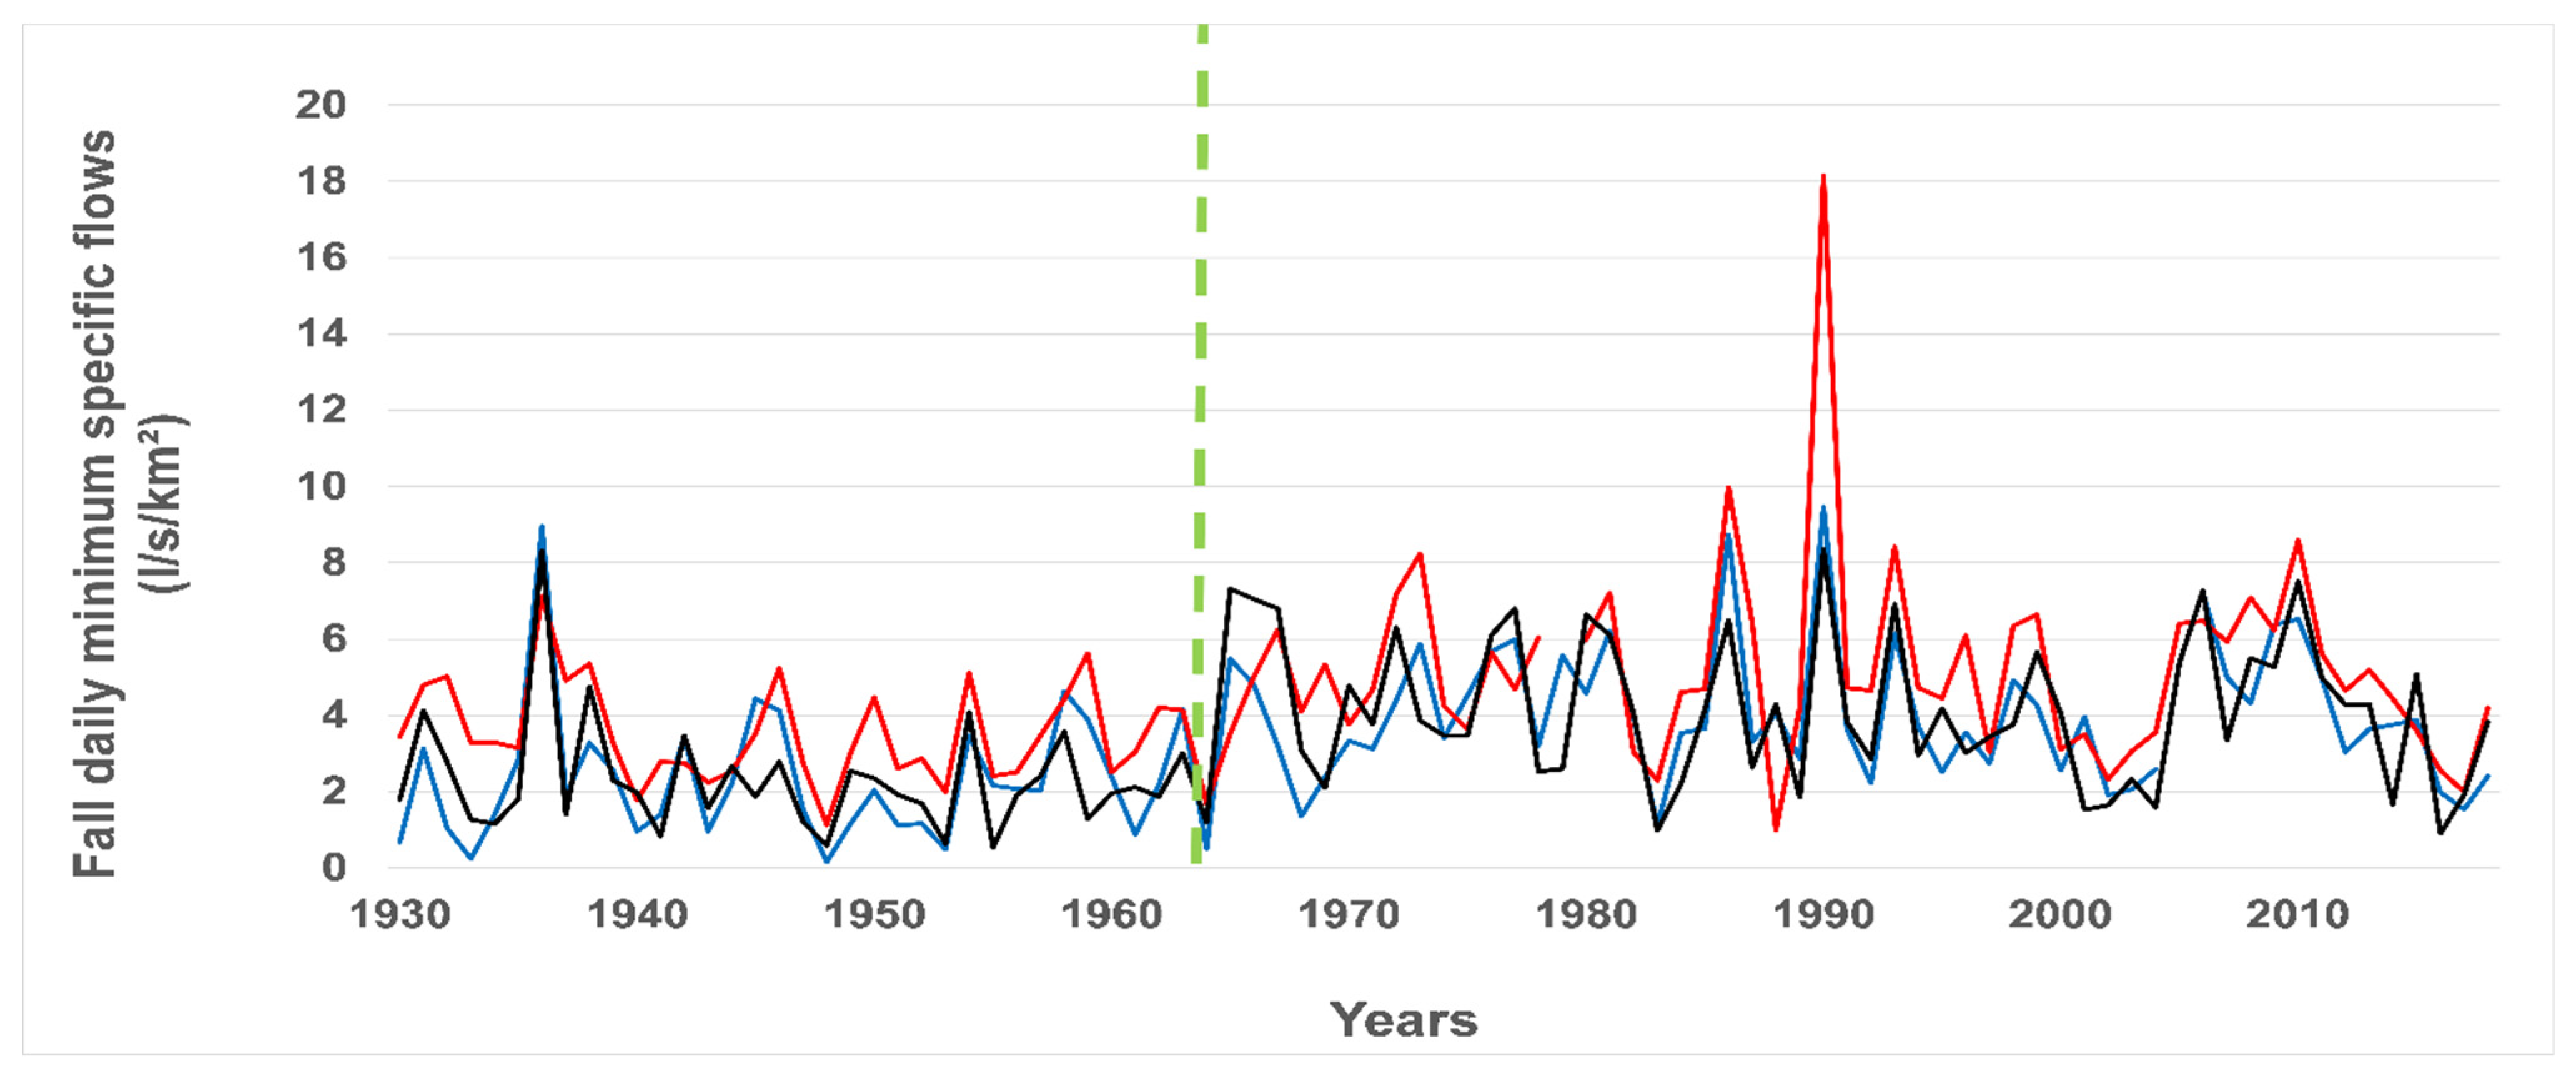
3.2. Comparison of Temporal Variability (Long-Term Trend) of Daily Extreme Flows in Spring and Fall
4. Discussion
- The modernization of agricultural practices in southern Quebec since 1950, which led to a significant reduction of cultivated land. Cultivated land was left uncropped or reforested, the amount of which nearly tripled in area between 1950 and 1981 [60]. From a hydrological perspective, this type of land use change would promote the infiltration of water into the soil, increasing fall minimum extreme flows supplied primarily by groundwater. In addition to reduction in the cultivated area, the type of the crop has also changed. As a result, forage crop acreage was reduced by over half to make room for oats, corn, and soybeans, particularly between 1950 and 2011 [60]. This change in crop type could change the conditions for runoff and infiltration of snowmelt and rainwater to varying degrees. The increase in minimum flows resulting from changes in agricultural practices has been observed in many watersheds in agricultural regions of the United States [27].
- Increased rainfall in summer and fall in the northeastern part of North America. Several studies have noted a significant increase in rainfall, particularly in fall, in the northeastern part of North America north of 44° N [13,17,22,25], and on the south shore of Quebec south of 47° N [61,62]. This increase occurred during the 1960s and early 1970s.
5. Conclusions
Author Contributions
Funding
Data Availability Statement
Conflicts of Interest
References
- Danco, J.F.; DEAngilils, A.; Raney, B.K.; Broccoli, A.J. Effects of a warming climate on daily snowfall events in the Northern Hemisphere. J. Clim. 2016, 29, 6295–6318. [Google Scholar] [CrossRef]
- Kapnick, S.B.; Delworth, T.L. Controls of global snow under a changed climate. J. Clim. 2013, 26, 5537–5562. [Google Scholar] [CrossRef]
- Krasting, J.P.; Broccoli, A.J.; Dixon, K.W.; Lanzante, J.R. Future changes in Northern Hemisphere snowfall. J. Clim. 2013, 26, 7813–7828. [Google Scholar] [CrossRef]
- O’Gorman, P. Contrasting responses of mean and extreme snowfall to climate change. Nature 2014, 512, 416–418. [Google Scholar] [CrossRef] [PubMed]
- Janoski, T.P.; Broccoli, A.J.; Kapnick, S.B.; Johnson, N. Effects of climate change on wind-driven heavy-snowfall events over Eastern North America. J. Clim. 2018, 31, 9037–9054. [Google Scholar] [CrossRef]
- Ingram, W. Extreme precipitation: Increases all round. Nat. Clim. Chang. 2016, 6, 443–444. [Google Scholar] [CrossRef]
- Tabari, H. Climate change impact on flood and extreme precipitation increase with water availibility. Nat. Sci. Rep. 2020, 10, 13768. [Google Scholar] [CrossRef] [PubMed]
- Marx, A.; Kumar, R.; Thober, S.; Zink, M.; Wanders, N.; Wood, E.F.; Pan, M.; Sheffield, J.; Samaniogo, L. Climate change alters low flows in Europe under a 1.5, 2, and 3 degree global warming. Hydrol. Earth. Syst. Sci. Discuss. 2017, 1–24. [Google Scholar] [CrossRef]
- Assefa, K.; Moges, M.A. Low Flow Trends and Frequency Analysis in the Blue Nile Basin, Ethiopia. J. Water Res. Protec. 2018, 10, 182–203. [Google Scholar] [CrossRef]
- Blum, A.G.; Archfield, S.A.; Hirsch, R.M.; Vogel, R.M.; Kiang, J.E.; Dudley, W. Updating estimates of low-streamflow statistics to account for possible trends. Hydrol. Sci. J. 2019, 64, 1404–1414. [Google Scholar] [CrossRef]
- Ehsanzadeh, E.; Adamowski, K. Trends in timing of low stream flows in Canada: Impact of autocorrelation and long-term persistence. Hydrol. Process. 2010, 24, 970–980. [Google Scholar] [CrossRef]
- Déry, S.J.; Hernández-Henríquez, M.A.; Owens, P.N.; Parkes, M.W.; Petticrew, E.L. A century of hydrological variability and trends in the Fraser Rive basin. Environ. Res. Lett. 2012, 7, 024019. [Google Scholar] [CrossRef]
- Dudley, R.W.; Hirsh, R.M.; Archfiled, S.A.; Blum, A.G.; Renard, B. Low trends at human-impacted and reference basins in the United States. J. Hydrol. 2020, 580, 124254. [Google Scholar] [CrossRef]
- Gain, A.K.; Immerzeel, W.W.; Sperna-Weiland, F.C.; Bierkens, M.F.P. Impact of climate change on the stream flow of lower Brahmaputra: Trends in high and low flows based on discharge-weighted ensemble modelling. Hydrol. Earth Syst. Sci. 2011, 8, 365–390. [Google Scholar] [CrossRef]
- Hammond, J.C.; Fleming, B.J. Evaluating low flow patterns, drivers and trends in the Delaware river basin. J. Hydrol. 2021, 598, 126246. [Google Scholar] [CrossRef]
- Hannaford, J. Climate-driven changes in UK river flows: A review of the evidence. Progr. Phys. Geogr. 2015, 39, 29–48. [Google Scholar] [CrossRef]
- Hodgkins, G.A.; Dudley, R.W. Historical summer base flow and stromflow trends for New England rivers. Water Resourc. Res. 2011, 47, W07528. [Google Scholar] [CrossRef]
- Khaliq, M.N.; Ouarda, T.B.M.J.; Gachon, P. Identification of temporal trends in annual and seasonal low flows occuring in Canadian rivers: The effect of short- and long-term persistence. J. Hydrol. 2009, 369, 183–197. [Google Scholar] [CrossRef]
- Khaliq, M.N.; Ouarda, T.B.M.J.; Gachon, P.; Sushama, L. Temporal evolution of low-flow regimes in Canadian rivers. Water Resourc. Res. 2008, 44, W08436. [Google Scholar] [CrossRef]
- Kay, A.L.; Bell, V.A.; Guillod, B.P.; Jones, R.G. Rudd, A.C. National-scale analysis of low flow frequency: Historical trends and potential future changes. Clim. Chang. 2018, 147, 585–599. [Google Scholar] [CrossRef]
- Kormos, P.R.; Luce, C.H.; Wenger, S.J.; Berghuijs, W.R. Trends and sensitivities of low streamflow extremes to discharge timing and magnitude in Pacific Northwest mountain streams. Water Resour. Res. 2016, 52, 4990–5007. [Google Scholar] [CrossRef]
- Sadri, S.; Kam, J.; Sheffield, J. Nonstationarity of low flows and their timing in the eastern United States. Hydrol. Earth Syst. Sci. 2016, 20, 633–649. [Google Scholar] [CrossRef]
- Sahoo, B.B.; Jha, R. Assessment of low flow trends and change point detection in Mahanadi River basin, India. Sustain. Water Resour. Manag. 2020, 6, 81. [Google Scholar] [CrossRef]
- Sawaske, S.P.; Freyberg, D.L. An analysis of trends in baseflow recession and low-flows in rain-dominated coastal streams of the pacific coast. J. Hydrol. 2014, 519, 599–610. [Google Scholar] [CrossRef]
- Small, D.; Islam, S.; Vogel, R.M. Trends in precipitation and streamflow in the eastern U.S.: Paradox or perception? Geophys. Res. Lett. 2006, 13, L03403. [Google Scholar] [CrossRef]
- Vlach, V.; Ledvinka, O.; Matouskova, M. Changing low flow and streamflow drought seasonality in Central European headwaters. Water 2020, 12, 3575. [Google Scholar] [CrossRef]
- Zhang, Y.-K.; Schilling, K.E. Increasing streamflow and base flow in Mississippi River since the 1940s: Effect of land use change. J. Hydrol. 2006, 324, 412–422. [Google Scholar] [CrossRef]
- Brown, R.D. Analysis of snow cover variability and change in Québec, 1948–2005. Hydrol. Process. 2010, 24, 1929–1954. [Google Scholar] [CrossRef]
- Fortin, G.; Hétu, B. Estimating winter trends in climatic variables in the Chic-Chocs Mountains, Canada (1970–2009). Int. J. Climatol. 2013, 34, 3078–3088. [Google Scholar] [CrossRef]
- Yagouti, A.; Boulet, G.; Vincent, L.; Vescovi, L.; Mekis, E. Observed changes in daily temperature and precipitation indices for Southern Québec, 1960–2005. Atmos. Ocean. 2008, 46, 243–256. [Google Scholar] [CrossRef]
- Assani, A.A. Comparison of the temporal variability of maximum daily temperatures for summer months in relation to El Nino events in Southern Québec. In Exteme Weather; Sallis, P.J., Ed.; IntechOpen: London, UK, 2008. [Google Scholar] [CrossRef]
- Assani, A.A.; Maloney-Dumont, V.; Pothier-Champagne, A.; Kinnard, C.; Quéessy, J.-F. Comparison of the temporal variability of summer temperature and rainfall as it relates to climate indices in southern Quebec (Canada). Theor. Appl. Climatol. 2019, 137, 2425–2435. [Google Scholar] [CrossRef]
- Assani, A.A.; Landry, R.; Quessy, J.-F.; Clément, F. Temporal Variability of Rain-Induced Floods in Southern Quebec, Climate Change. In Geophysical Foundations and Ecological Effects; Blanco, J., Kheradmand, H., Eds.; IntechOpen: London, UK, 2011. [Google Scholar] [CrossRef][Green Version]
- Assani, A.A.; Landry, R.; Laurencelle, M. Comparison of interannual variability modes and trends of seasonal precipitation and streamflow in Southern Quebec (Canada). River Res. Appl. 2012, 28, 1740–1752. [Google Scholar] [CrossRef]
- Beauchamp, M.; Assani, A.A.; Landry, R.; Massicotte, P. Temporal variability of the magnitude and timing of winter maximum daily flows in southern Quebec (Canada). J. Hydrol. 2015, 520, 410–417. [Google Scholar] [CrossRef]
- Guerfi, N.; Assani, A.A.; Mesfioui, M.; Kinnard, C. Comparison of the temporal variability of winter daily extreme temperatures and precipitations in southern Quebec (Canada) using the Lombard and copula methods. Int. J. Climatol. 2015, 35, 4237–4246. [Google Scholar] [CrossRef]
- Assani, A.A.; Charron, S.; Matteau, M.; Mesfioui, M.; Quessy, J.F. Temporal variability modes of floods for catchments in the St. Lawrence Watershed (Quebec, Canada). J. Hydrol. 2010, 385, 292–299. [Google Scholar] [CrossRef]
- Mazouz, R.; Assani, A.A.; Quessy, J.-F.; Légaré, G. Comparison of the interannual variability of spring heavy floods characteristics of tributaries of St. Lawrence River in Quebec (Canada). Adv. Water Res. 2012, 35, 110–120. [Google Scholar] [CrossRef]
- Mazouz, R.; Assani, A.A.; Rodriguez, M. Application of redundancy analysis to hydroclimatology: A case study of spring heavy floods in southern Québec (Canada). J. Hydrol. 2013, 496, 187–194. [Google Scholar] [CrossRef]
- Smakhtin, V.U. Low flow hydrology: A review. J. Hydrol. 2001, 240, 147–186. [Google Scholar] [CrossRef]
- Rolls, R.J.; Leigh, C.; Sheldon, F. Mechanistic effects of low-flow hydrology on riverine ecosystems: Ecological principles and consequences of alteration. Freshw. Sci. 2012, 31, 1163–1186. [Google Scholar] [CrossRef]
- Belzile, L.; Bérubé, P.; Hoang, V.D.; Leclerc, M. Méthode Écohydrologique de Détermination des débits Réservés pour la Protection des Habitats du Poisson dans les Rivières du Québec. Rapport Présenté par l’INRS-Eau et le Groupe-Conseil Génivar inc. au Ministère de l’Environnement et de la Faune et à Pêches et Océans Canada. 1997; 83p. Available online: http://www.obvcapitale.org/plans-directeurs-de-leau-2/2e-generation/diagnostic/section-3-problematiques-associees-a-la-quantite-et-a-la-securite/3-4-debits-reserves (accessed on 20 December 2020).
- Sneyers, R. On the Statistical Analysis of Series of Observations; Technical Notes N°143; World Meteorological Organization: Geneva, Switzerland, 1990; 192p. [Google Scholar]
- Von Storch, H. Misuses of statistical analysis in climate research. In Analysis of Climate Variability; von Storch, H., Navarra, A., Eds.; Springer: Dordrecht, The Netherlands, 1995; pp. 11–26. [Google Scholar]
- Yue, S.; Pilon, P.; Cavadias, G. Power of the Mann-Kendall and Spearman’s rho tests for detecting monotonic trends in hydrological series. J. Hydrol. 2002, 259, 254–271. [Google Scholar] [CrossRef]
- Yue, S.; Wang, C.Y. The Mann-Kendall test modified by effective sample size to detect trend in serially correlated hydrological series. Water Resourc. Manag. 2004, 18, 201–218. [Google Scholar] [CrossRef]
- Hamed, K.H.; Rao, A.R. A modified Mann-Kendall trend test for autococorrelated data. J. Hydrol. 1998, 204, 182–196. [Google Scholar] [CrossRef]
- Hamed, K.H. Enhancing the effectiveness of prewhitening in trend analysis of hydrologic data. J. Hydrol. 2009, 368, 143–155. [Google Scholar] [CrossRef]
- Pettitt, A.N. A non-parametric approach to the change-point problem. J. R. Statist. Soc. Ser. C 1979, 28, 126–135. [Google Scholar] [CrossRef]
- Serinaldi, F.; Kilsby, C. The importance of prewhiting in change point analysis under persitence. Stoch. Environ. Res. Risk Assess. 2016, 30, 763–777. [Google Scholar] [CrossRef]
- Lombard, F. Rank tests for changepoint problems. Biometrika 1987, 74, 615–624. [Google Scholar] [CrossRef]
- Quessy, J.F.; Favre, A.C.; Saïd, M.; Champagne, M. Statistical inference in Lombard’S smooths-change model. Environmetrics 2011, 22, 882–893. [Google Scholar] [CrossRef]
- Mao, D.; Cherkauer, K.A. Impacts of land-use change on hydrologic responses in the Great Lakes region. J. Hydrol. 2009, 374, 71–82. [Google Scholar] [CrossRef]
- Tan, X.; Gan, T.Y. Contribution of human and climate change impacts to changes in streamflow of Canada. Sci. Rep. 2015, 5, 17767. [Google Scholar] [CrossRef]
- Assani, A.A.; Landry, R.; Kinnard, C.; Azouaoui, O.; Demers, C.; Lacasse, K. Comparison of the spatiotemporal variability of temperature, precipitation, and maximum daily spring flows in two watersheds in Quebec characterized by different land use. Adv. Meteorol. 2016, 2016, 3746460. [Google Scholar] [CrossRef][Green Version]
- Muma, M.; Assani, A.A.; Landry, R.; Quessy, J.-F.; Mesfioui, M. Effects of the change from forest to agriculture land use on the spatial variability of summer extreme daily flow charactersitics in southern Quebec (Canada). J. Hydrol. 2011, 407, 153–163. [Google Scholar] [CrossRef]
- Quilbé, R.; Rousseau, A.; Moquet, J.-S.; Savary, S.; Ricard, S.; Garbouj, M.S. Hydrological response of a watershed to historical land use evolution and future land use scenarios under climate change conditions. Hydrol. Earth Syst. Sci. 2008, 12, 101–110. [Google Scholar] [CrossRef]
- Landry, R.; Assani, A.A.; Biron, S.; Quessy, J.-F. The management modes of seasonal floods and their impact on the relatioship between climate and streamflow downstream from dams in Quebec (Canada). River Res. Appl. 2014, 30, 287–298. [Google Scholar] [CrossRef]
- Bullock, A.; Acreman, M.C. The role of wetlands in the hydrological cycle. Hydrol. Earth Syst. Sci. 2003, 7, 358–389. [Google Scholar] [CrossRef]
- Ruiz, J. Modernization agriculture and agricultural land cover in Quebec (1951–2011). Cahiers Géographie Québec 2019, 63. in press (In French) [Google Scholar]
- Perrault, L.; Haché, M.; Slivitzky, M.; Bobée, B. Detection of changes in precipitation and runoff over eastern Canada and U.S. using a Bayesian approach. Stoch. Environ. Res. Risk Assess. 1999, 13, 201–216. [Google Scholar] [CrossRef]
- Assani, A.A.; Lajoie, F.; Vadnais, M.-E.; Beauchamp, G. Influence of the Arctic oscillation on the interannual variability of precipitation in the Saint-François river watershed (Quebec, Canada) as determined by canonical correlation analysis. J. Water Sci. (Rev. Sci. Eau) 2008, 21, 21–33. (In French) [Google Scholar]


| Rivers | Code | Drainage Area (Km2) | Latitude (N) | Longitude (W) | Agricultural Area (%) |
|---|---|---|---|---|---|
| Southeastern Hydroclimatic Region (South Shore) | |||||
| Chateaugay | SE1 | 2492 | 45°19′49″ | 73°45′44″ | 41.9 |
| Eaton | SE2 | 646 | 45°28′05″ | 71°39′18″ | 10.7 |
| Nicolet SW | SE3 | 562 | 45°47′30″ | 71°58′05″ | 26.3 |
| Etchemin | SE4 | 1152 | 46°39′25″ | 71°39′18″ | 25.5 |
| Beaurivage | SE5 | 708 | 46°39′25″ | 71°17′20″ | 34.7 |
| Du Sud | SE6 | 821 | 46°49′22″ | 70°45′22″ | 10.4 |
| Eastern Hydroclimatic Region (South Shore) | |||||
| Ouelle | E1 | 796 | 47°22′52″ | 67°57′14″ | 2.8 |
| Du Loup | E2 | 1042 | 47°36′43″ | 69°38′41″ | 10.2 |
| Trois-Pistoles | E3 | 930 | 48°05′21″ | 69°11′43″ | 16.5 |
| Rimouski | E4 | 1615 | 48°24′46″ | 68°33′18″ | 8.8 |
| Matane | E5 | 1665 | 48°46′25″ | 67°32′25″ | 8.9 |
| Blanche | E6 | 223 | 48°47′20″ | 67°41′51″ | 30.2 |
| Southernwest Hydroclimatic Region (North Shore) | |||||
| Petite Nation | SW1 | 1331 | 45°47′27″ | 75°05′22″ | 0.7 |
| Du Nord | SW2 | 1163 | 45°31′08″ | 74°20′11″ | 0.4 |
| L’Assomption | SW3 | 1286 | 46°02′45″ | 73°26′19″ | 8.6 |
| Matawin | SW4 | 1387 | 46°40′50″ | 73°55′00″ | 0 |
| Vermillon | SW5 | 2662 | 47°39′20″ | 72°57′44″ | 0 |
| Name of the Test | Acronym | Purpose of the Test | References |
|---|---|---|---|
| Elimination of STP (Short Term Persistence) Effects | |||
| Original Mann–Kendall | MK | Detect the long-term trend (does not take STP or LTP into account). | [43] |
| Prewhitenning method | MMK-PW | Eliminate the influence of autocorrelation by prewhitenning data. | [44] |
| Trend Free Prewhitening Method | TFPW | Eliminate autocorrelation by prewhitening data. | [45] |
| Modified Mann–Kendall Test1 | MMKY | Eliminate autocorrelation by variance correction. | [46] |
| Modified Mann–Kendall Test2 | MMKH | Eliminate autocorrelation by variance correction. | [47] |
| Elimination of LTP (Long Term persistence) Effects | |||
| Long Term Persistence MK | LTP | Eliminate LTP effects. | [48] |
| Rivers | Spring | Fall | ||||
|---|---|---|---|---|---|---|
| Max | Mean | Min | Max | Mean | Min | |
| Southeastern Hydroclimatic Region | ||||||
| Chateaugay | 9.2 | 3.3 (1.61) | 0.56 | 9.3 | 2.6 (1.74) | 0.28 |
| Eaton | 7.0 | 3.1 (1.30) | 0.88 | 8.1 | 3.2 (1.62) | 0.78 |
| Nicolet SW | 10.8 | 2.8 (1.95) | 0.25 | 8.3 | 3.4 (1.98) | 0.53 |
| Etchemin | 14.1 | 3.6 (2.67) | 0.88 | 18.1 | 4.5 (2.30) | 1.00 |
| Beaurivage | 47.3 | 3.6 (4.98) | 0.56 | 9.5 | 3.3 (1.94) | 0.16 |
| Du Sud | 13.5 | 5.5 (2.52) | 0.30 | 13.0 | 4.6 (2.08) | 0.12 |
| Eastern Hydroclimatic Region | ||||||
| Ouelle | 16.1 | 3.9 (2.38) | 0.54 | 7.3 | 2.9 (1.74) | 0.35 |
| Du Loup | 13.1 | 5.8 (2.42) | 0.71 | 11.7 | 4.3 (2.43) | 0.27 |
| Trois-Pistoles | 11.4 | 4.1 (2.14) | 1.4 | 3.2 | 1.3 (0.59) | 0.37 |
| Rimouski | 25.4 | 6.3 (3.95) | 1.7 | 15.9 | 4.7 (2.76) | 0.70 |
| Matane | 21.4 | 8.0 (4.22) | 1.73 | 15.9 | 4.7 (2.77) | 0.70 |
| Blanche | 21.1 | 5.2 (3.43) | 2.0 | 18.3 | 4.1 (3.75) | 0.38 |
| Southernwest Hydroclimatic Region | ||||||
| Petite Nation | 24.3 | 9.8 (4.01) | 3.6 | 20.9 | 4.8 (3.26) | 1.2 |
| Du Nord | 16.5 | 8.1 (2.79) | 3.9 | 15.2 | 7.0 (2.56) | 2.7 |
| L’Assomption | 14.3 | 7.9 (2.83) | 2.5 | 12.9 | 5.4 (2.80) | 0.72 |
| Matawin | 27.2 | 8.9 (4.33) | 2.7 | 14.2 | 6.6 (2.45) | 2.0 |
| Vermillon | 15.6 | 7.6 (3.09) | 2.2 | 14.4 | 6.5 (2.64) | 1.7 |
| Variables | Spring | Fall | ||||
|---|---|---|---|---|---|---|
| Max | Mean | Min | Max | Mean | Min | |
| Physiographic Variables | ||||||
| Drainage density (km/km2) | 0.472 | −0.119 | −0.147 | −0.014 | −0.127 | −0.216 |
| Mean slope (m/km) | −0.030 | 0.671 ** | 0.550 ** | 0.469 | 0.669 ** | 0.549 ** |
| Forests surface area (%) | 0.002 | 0.484 ** | 0.388 | 0.150 | 0.463 | 0.381 |
| Agricultural surface area (%) | 0.081 | −0.687 ** | −0.648 ** | −0.231 | −0.580 ** | −0.572 ** |
| Wetlands surface area (%) | 0.266 | 0.666 ** | 0.789 ** | 0.447 | 0.426 | 0.528 ** |
| Climatic Variables | ||||||
| Seasonal (spring/fall) total rainfall (mm) | −0.082 | 0.161 | −0.082 | 0.094 | −0.146 | −0.088 |
| Seasonal (spring/fall) total snowfall (cm) | 0.253 | −0.271 | −0.407 | −0.052 | −0.399 | −0.370 |
| Seasonal (spring/fall) total precipitation (mm) | 0.015 | 0.071 | 0.138 | 0.007 | −0.399 | −0.351 |
| Winter-spring/ summer-fall total rainfall (mm) | −0.098 | 0.099 | 0.254 | 0.109 | −0.087 | −0.160 |
| Winter-spring/summer-fall snowfall (cm) | 0.058 | −0.139 | −0.282 | −0.052 | −0.399 | −0.369 |
| Winter-spring/summer-fall total precipitation (mm) | 0.001 | −0.018 | −0.039 | 0.052 | −0.284 | −0.321 |
| Seasonal (Winter/Spring) daily mean maximum temperature (°C) | −0.400 | 0.122 | 0.274 | −0.238 | −0.118 | −0.003 |
| Winter-Spring/Summer-Fall daily mean maximum temeperature (°C) | −0.423 | 0.056 | 0.252 | −0.084 | 0.088 | 0.121 |
| Rivers | MK | MMK-PW | TFPW | MMKY | MMKH | LTP | ||||||
|---|---|---|---|---|---|---|---|---|---|---|---|---|
| Z | p-Value | Z | p-Value | Z | p-Value | Z | p-Value | Z | p-Value | Z | p-Value | |
| Southeastern Hydroclimatic Region | ||||||||||||
| Chateaugay | 1.115 | 0.265 | 1.393 | 0.164 | 1.279 | 0.201 | 2.621 ** | 0.009 | 1.102 | 0.271 | 1.190 | 0.234 |
| Eaton | −0.317 | 0.751 | −0.594 | 0.553 | −0.565 | 0.572 | −0.966 | 0.334 | −0.351 | 0.726 | −0.441 | 0.667 |
| Nicolet SW | 2.266 | 0.023 | 1.488 | 0.116 | 1.386 | 0.666 | 2.884 ** | 0.004 | 1.708 ** | 0.088 | 1.700 * | 0.089 |
| Etchemin | 1.460 | 0.144 | 1.488 | 0.137 | 1.669 | 0.095 | 2.791 ** | 0.005 | 1.364 | 0.172 | 1.110 | 0.267 |
| Beaurivage | 5.309 | 0.000 | 5.142 | 0.000 | 5.589 | 0.000 | 9.559 ** | 0.000 | 4.723 ** | 0.000 | 4.737 ** | 0.000 |
| Du Sud | 0.220 | 0.826 | 0.620 | 0.534 | 0.641 | 0.521 | 0.502 | 0.615 | 0.179 | 0.858 | 0.183 | 0.855 |
| Eastern Hydroclimatic Region | ||||||||||||
| Ouelle | −4.392 ** | 0.000 | −3.81 ** | 0.000 | −4.4 ** | 0.000 | −11.9 ** | 0.000 | −4.15 ** | 0.000 | −4.32 ** | 0.000 |
| Du Loup | 0.540 | 0.589 | 1.024 | 0.306 | 1.152 | 0.249 | 0.992 | 0.321 | 0.523 | 0.601 | 0.284 | 0.777 |
| Trois-Pistoles | −2.18 ** | 0.029 | −1.92 * | 0.055 | −2.0 ** | 0.048 | −3.74 ** | 0.000 | −2.31 ** | 0.021 | −2.10 ** | 0.037 |
| Rimouski | −1.056 | 0.291 | −1.123 | 0.261 | −1.194 | 0.232 | −1.319 | 0.187 | −1.050 | 0.294 | −1.130 | 0.262 |
| Matane | −2.27 ** | 0.023 | −2.69 ** | 0.007 | −2.7 ** | 0.006 | −3.84 ** | 0.000 | −2.46 ** | 0.014 | −2.92 ** | 0.004 |
| Blanche | −0.384 | 0.701 | −0.049 | 0.961 | −0.118 | 0.906 | −0.596 | 0.551 | −0.450 | 0.653 | −0.219 | 0.830 |
| Southwestern Hydroclimatic Region | ||||||||||||
| Petite Nation | 1.063 | 0.288 | 1.414 | 0.157 | 1.265 | 0.206 | 2.401 | 0.016 | 1.063 | 0.288 | 1.257 | 0.209 |
| Du Nord | −0.393 | 0.694 | −0.458 | 0.647 | −0.407 | 0.684 | −0.876 | 0.381 | −0.761 | 0.447 | −0.612 | 0.548 |
| L’Assomption | −1.506 | 0.132 | −1.449 | 0.147 | −1.286 | 0.198 | −5.57 ** | 0.000 | −1.726 * | 0.084 | −2.97 ** | 0.003 |
| Matawin | −1.506 | 0.132 | −0.157 | 0.876 | −0.157 | 0.876 | −0.231 | 0.817 | −0.121 | 0.904 | −0.091 | 0.931 |
| Vermillon | 0.821 | 0.417 | 1.258 | 0.208 | 1.045 | 0.296 | 3.513 | 0.000 | 0.920 | 0.358 | 1.062 | 0.288 |
| Rivers | MK | MMK-PW | TFPW | MMKY | MMKH | LTP | ||||||
|---|---|---|---|---|---|---|---|---|---|---|---|---|
| Z | p-Value | Z | p-Value | Z | p-Value | Z | p-Value | Z | p-Value | Z | p-Value | |
| Southeastern Hydroclimatic Region | ||||||||||||
| Chateaugay | 1.362 | 0.173 | 0.173 | 3.399 | 3.694 ** | 0.000 | 8.468 ** | 0.000 | 3.831 ** | 0.000 | 2.947 ** | 0.003 |
| Eaton | 1.100 | 0.217 | 0.932 | 0.333 | 1.067 | 0.286 | 1.968 ** | 0.049 | 1.100 | 0.271 | 0.722 | 0.470 |
| Nicolet SW | 3.275 ** | 0.001 | 2.671 ** | 0.008 | 3.254 ** | 0.001 | 5.888 ** | 0.000 | 3.744** | 0.000 | 2.085 ** | 0.037 |
| Etchemin | 2.754 ** | 0.006 | 2.112 ** | 0.035 | 2.676 ** | 0.007 | 4.545 ** | 0.000 | 1.992** | 0.046 | 1.225 | 0.221 |
| Beaurivage | 3.820 ** | 0.000 | 2.662 ** | 0.008 | 3.600 ** | 0.000 | 6.502 ** | 0.000 | 3.574** | 0.000 | 1.948 * | 0.051 |
| Du Sud | 1.99 ** | 0.044 | 1.063 | 0.288 | 1.395 | 0.163 | 2.232 ** | 0.026 | 0.998 | 0.668 | 0.668 | 0.504 |
| Eastern Hydroclimatic Region | ||||||||||||
| Ouelle | −0.472 | 0.637 | −0.308 | 0.758 | −0.359 | 0.719 | −0.807 | 0.419 | −0.454 | 0.650 | −0.244 | 0.810 |
| Du Loup | −0.991 | 0.322 | −0.836 | 0.403 | −0.799 | 0.424 | −2.036 ** | 0.042 | −0.991 | 0.318 | −0.726 | 0.471 |
| Trois-Pistoles | −2.141 ** | 0.032 | −1.921 * | 0.055 | −1.957 * | 0.050 | −4.26 ** | 0.000 | −2.14 ** | 0.032 | −1.618 | 0.107 |
| Rimouski | −0.493 | 0.622 | −0.256 | 0.798 | −0.314 | 0.754 | −0.899 | 0.369 | −0.505 | 0.614 | −0.293 | 0.773 |
| Matane | −2.265 ** | 0.024 | −1.770 * | 0.077 | −2.05 ** | 0.040 | −6.46 ** | 0.000 | −2.27 ** | 0.024 | −1.687 * | 0.093 |
| Blanche | 0.752 | 0.452 | 0.537 | 0.591 | 0.583 | 0.560 | 1.504 | 0.133 | 0.752 | 0.452 | 0.498 | 0.620 |
| Southwestern Hydroclimatic Region | ||||||||||||
| Petite Nation | 1.362 | 0.173 | 1.503 | 0.133 | 1.532 | 0.125 | 2.995 ** | 0.003 | 1.046 | 0.163 | 1.531 | 0.126 |
| Du Nord | 0.872 | 0.383 | 0.968 | 0.333 | 0.792 | 0.428 | 2.881 ** | 0.004 | 1.156 | 0.248 | 1.860 * | 0.063 |
| L’Assomption | 0.911 | 0.362 | 0.918 | 0.358 | 0.782 | 0.434 | 2.455 ** | 0.014 | 0.869 | 0.385 | 1.085 | 0.278 |
| Matawin | 0.358 | 0.720 | 0.247 | 0.805 | 0.194 | 0.847 | 1.022 | 0.307 | 0.444 | 0.657 | 0.496 | 0.620 |
| Vermillon | 0.092 | 0.927 | 0.256 | 0.798 | 0.249 | 0.804 | 0.200 | 0.841 | 0.079 | 0.930 | 0.094 | 0z.925 |
| Pettitt Test | Modified Pettitt Test | Lombard Test | ||||||
|---|---|---|---|---|---|---|---|---|
| K | p-Value | T | K | p-Value | T | Sn | T1–T2 | |
| Southeastern Hydroclimatic Region | ||||||||
| Chateaugay | 545 | 0.178 | - | 580 | 0.129 | - | 0.017 | - |
| Eaton | 282 | 1.001 | - | 317 | 0.834 | - | 0.003 | - |
| Nicolet SW | 492 | 0.247 | - | 546 | 0.177 | - | 0.021 | - |
| Etchemin | 647 | 0.066 | - | 591 | 0.117 | - | 0.029 | - |
| Beaurivage | 1298 ** | 0.000 | 1968 | 1219 ** | 0.000 | 1968 | 0.258 ** | 1967–68 |
| Du Sud | 376 | 0.633 | - | 376 | 0.633 | - | 0.002 | - |
| Eastern Hydroclimatic Region | ||||||||
| Ouelle | 984 ** | 0.001 | 1986 | 889 ** | 0.003 | 1986 | 0.176 ** | 1930–99 |
| Du Loup | 530 | 0.203 | - | 536 | 0.193 | - | 0.006 | - |
| Trois-Pistoles | 593 | 0.114 | - | 606 | 0.101 | - | 0.0489 ** | 1951–52 |
| Rimouski | 363 | 0.684 | - | 341 | 0.776 | - | 0.010 | - |
| Matane | 765 ** | 0.017 | 1963 | 856 ** | 0.005 | 1963 | 0.061 ** | 1961–62 |
| Blanche | 389 | 0.488 | - | 297 | 0.879 | - | 0.003 | - |
| Southwestern Hydroclimatic Region | ||||||||
| Petite Nation | 525 | 0.212 | - | 608 | 0.099 | - | 0.014 | - |
| Du Nord | 269 | 1.088 | - | 238 | 1.242 | - | 0.005 | - |
| L’Assomption | 378 | 0.625 | - | 415 | 0.492 | - | 0.018 | - |
| Matawin | 482 | 0.247 | - | 502 | 0.207 | - | 0.002 | - |
| Vermillon | 387 | 0.591 | - | 497 | 0.268 | - | 0.008 | - |
| Pettitt Test | Modified Pettitt Test | Lombard Test | ||||||
|---|---|---|---|---|---|---|---|---|
| K | p-Value | T | K | p-Value | T | Sn | T1–T2 | |
| Southeastern Hydroclimatic Region | ||||||||
| Chateaugay | 1023 ** | 0.000 | 1964 | 930 ** | 0.001 | 1962 | 0.156 ** | 1961–62 |
| Eaton | 572 | 0.105 | - | 510 | 0.192 | - | 0.010 | - |
| Nicolet SW | 1137 ** | 0.000 | 1965 | 948 ** | 0.001 | 1964 | 0.107 ** | 1963–64 |
| Etchemin | 966 ** | 0.001 | 1965 | 784 ** | 0.009 | 1965 | 0.075 ** | 1964–65 |
| Beaurivage | 1114 ** | 0.000 | 1964 | 892 ** | 0.002 | 1964 | 0.121 ** | 1963–64 |
| Du Sud | 814 ** | 0.044 | 1970 | 752 ** | 0.011 | 1968 | 0.060 ** | 1966–68 |
| Eastern Hydroclimatic Region | ||||||||
| Ouelle | 431 | 0.397 | - | 373 | 0.596 | - | 0.003 | - |
| Du Loup | 456 | 0.327 | - | 430 | 0.400 | - | 0.013 | - |
| Trois-Pistoles | 656 * | 0.080 | 1988 | 660 * | 0.051 | 1988 | 0.049 ** | 1992–93 |
| Rimouski | 502 | 0.240 | - | 488 | 0.270 | - | 0.004 | - |
| Matane | 619 * | 0.080 | 1976 | 556 * | 0.148 | - | 0.055 ** | 1982–83 |
| Blanche | 308 | 0.800 | - | 302 | 0.829 | - | 0.004 | - |
| Southwestern Hydroclimatic Region | ||||||||
| Petite Nation | 425 | 0.415 | - | 469 | 0.295 | - | 0.010 | - |
| Du Nord | 298 | 0.923 | - | 385 | 0.550 | - | 0.004 | - |
| L’Assomption | 442 | 0.386 | - | 526 | 0.195 | - | 0.009 | - |
| Matawin | 314 | 0.798 | - | 409 | 0.420 | - | 0.002 | - |
| Vermillon | 376 | 0.632 | - | 432 | 0.416 | - | 0.002 | - |
Publisher’s Note: MDPI stays neutral with regard to jurisdictional claims in published maps and institutional affiliations. |
© 2021 by the authors. Licensee MDPI, Basel, Switzerland. This article is an open access article distributed under the terms and conditions of the Creative Commons Attribution (CC BY) license (https://creativecommons.org/licenses/by/4.0/).
Share and Cite
Assani, A.A.; Zeroual, A.; Roy, A.; Kinnard, C. Impacts of Agricultural Areas on Spatio-Temporal Variability of Daily Minimum Extreme Flows during the Transitional Seasons (Spring and Fall) in Southern Quebec. Water 2021, 13, 3487. https://doi.org/10.3390/w13243487
Assani AA, Zeroual A, Roy A, Kinnard C. Impacts of Agricultural Areas on Spatio-Temporal Variability of Daily Minimum Extreme Flows during the Transitional Seasons (Spring and Fall) in Southern Quebec. Water. 2021; 13(24):3487. https://doi.org/10.3390/w13243487
Chicago/Turabian StyleAssani, Ali Arkamose, Ayoub Zeroual, Alexandre Roy, and Christophe Kinnard. 2021. "Impacts of Agricultural Areas on Spatio-Temporal Variability of Daily Minimum Extreme Flows during the Transitional Seasons (Spring and Fall) in Southern Quebec" Water 13, no. 24: 3487. https://doi.org/10.3390/w13243487
APA StyleAssani, A. A., Zeroual, A., Roy, A., & Kinnard, C. (2021). Impacts of Agricultural Areas on Spatio-Temporal Variability of Daily Minimum Extreme Flows during the Transitional Seasons (Spring and Fall) in Southern Quebec. Water, 13(24), 3487. https://doi.org/10.3390/w13243487