Article

Analyzing the Impact of Climate Change and Human Activities on Surface Runoff in the Changbai Mountain Area, Northeast China

1
State Key Laboratory of Simulation and Regulation of Water Cycle in River Basin, China Institute of Water Resources and Hydropower Research, Beijing 100038, China
2
College of Hydrology and Water Resources, Hohai University, Nanjing 210098, China
3
School of Civil Engineering, Shandong University, Jinan 250061, China
*
Author to whom correspondence should be addressed.
Water 2021, 13(23), 3473; https://doi.org/10.3390/w13233473
Submission received: 15 September 2021 / Revised: 2 December 2021 / Accepted: 2 December 2021 / Published: 6 December 2021

Abstract

:
Climate change and human activities are two important factors affecting surface runoff. In water resource management and planning, it is generally important to separate the contribution of these factors when assessing runoff changes. The Changbai Mountain area is rich in water resources and is an important hydropower energy base for Northeast China. This study used Sen’s slope estimator to explore trends in runoff precipitation and evapotranspiration from 1960 to 2016, and the results showed a downward trend in runoff and an upward trend in precipitation and evaporation in most areas. The mutation point of the annual time series for the observed runoff was estimated, and the time series was divided into the base period (1960–1975) and impact period (1976–2016). Based on the Budyko framework, we performed attribution analysis of the runoff changes, and analyzed the difference between the mountainous region and the whole basin. We determined that the impacts of climate change and human activities, on average, accounted for decreases in the runoff by 60.15% and 39.85%, respectively, for the Second Songhua River Basin; 73.74% and 26.26%, respectively, for the Tumen River Basin; 84.76% and 15.24%, respectively, for the Yalu River Basin; human activities were the main causes of runoff changes in the Changbai Mountain area; climate change was the main cause of runoff changes in mountainous regions. The results of this study show that the reasons for the change in runoff in mountainous regions and the whole basin in the same area are different, which has some illuminating significance for water resources management of different elevation areas.

1. Introduction

Global climate change and human activities have changed the global water cycle [1,2,3,4], which has led to a marked decrease in runoff into many rivers worldwide and greatly threatens global water security [5,6,7]. Rising temperatures, due to climate change, have changed global climate patterns, transforming the spatial and temporal distributions of precipitation. This affects hydrological systems and changes the quantity and quality of available water resources [8]. Similarly, human activities, such as deforestation, urbanization, industrialization, dam construction, and irrigation, are likely to, directly and indirectly, affect hydrological processes [9,10] and, thus, redistribute water resources in space and time [11]. The change in runoff caused by climate change is produced under the background of global warming. Local measures cannot play a significant role in runoff attenuation. However, the impacts of human activities on runoff changes can be restored by corresponding measures. Attribution analysis of runoff changes can help us identify which activities have caused runoff changes so that appropriate water resource management measures can be taken to restore runoff. Additionally, we can calculate how much runoff can be restored by implementing measures through attribution analysis, providing a basis for future water resources planning. Therefore, quantifying the impact of climate change and human activities on the runoff could help contribute to the optimal management of water resources and provide scientific support for the designation of sustainable water strategies [12,13].
The Changbai Mountain area (CMA) is the birthplace of the Songhua, Yalu, and Tumen Rivers. It is an important freshwater resource reserve in Northeast China. Containing multiple ecological functions, it is an ecologically protected area, including water conservation and biodiversity protection. The Tumen and Yalu Rivers form boundaries between China, North Korea, and Russia. Many studies have shown that under the combined influence of climate change and human activities, the runoff into the CMA is showing an obvious downward trend [14,15], which is affecting local water and ecological security. Therefore, distinguishing the impacts of climate change and human activities on surface runoff in the CMA is of great significance for water resource management, ecological protection, and cooperation between China and North Korea for sustainable water use.
Quantifying the effects of climate change and human activities on runoff changes has become a hot topic for climate and hydrological research [6,7]. Currently, commonly used methods can be divided into statistical methods, hydrological modeling methods, and elastic-based methods. Statistical methods generally include regression analysis, time-trend analysis, and the double cumulative curve method [16,17,18], but such methods require long-term recordings of hydrological and meteorological data to establish a statistical relationship between the runoff and other variables. Hydrological modeling methods distinguish the impacts between climate change and human activities by simulating the water cycles. However, few process-based models can be directly used for this purpose because they lack a component for engineering measures [19]. Additionally, it is difficult for hydrological model parameters to quantify the uncertainty of human activities, and simulation results can be random. There is also a certain level of interaction effects between climate, LUCC, and runoff, which is hard to quantify using either hydrological model methods or statistical methods [20,21].
Some studies have shown that different modeling methods may produce different results. Methods based on elasticity include nonparametric methods and methods based on the Budyko hypothesis [22,23,24]. Methods based on the Budyko hypothesis provide a simple framework that is based on the long-term water–energy balance principle and uses elasticity coefficients to express the sensitivity of climatic and anthropogenic factors to runoff changes; thus, it is more widely used to distinguish the effects of climate change and human activities on runoff. Under the Budyko framework, Roderick and Farquhar used the Choudhury–Yang equation to assess the impact of precipitation, potential evapotranspiration, and land-use conditions on runoff [25,26,27]. The equation parameters include the characterization of soil type, topographical factors, and land use. The soil and topography usually do not change much over time, so it is believed that the change in runoff is mainly caused by land-use changes [28]. Additionally, the Budyko framework was employed to evaluate the impact of climate change, environmental change, and climate–environment interactions on surface runoff change in some studies, but there lacks an explanation of its physical mechanism [29]. The working assumption of the Budyko framework is that the hydrological system is in a stable state when considering a period of approximately 10 years [30,31]. Despite its simplicity, many studies have shown that the Budyko equation is reliable [32,33,34,35].
This study focused on distinguishing the impacts of climate change and human activities on the runoff changes in three CMA basins and their upper mountainous regions. The research roadmap with the main goals of each step is described as follows: (1) Sen’s slope analysis is used to explore changes to runoff trends and major climate factors from 1960 to 2016; (2) the Pettitt mutation point test is used to determine runoff change mutation points and divide the entire period into a baseline period and an impact period; (3) the Choudhury–Yang equation, based on the Budyko framework, is used to attribute the impact of climate change and human activities on runoff changes; and (4) the impact of human activities on runoff changes across the entire region and the upstream mountainous regions is explored. This work will provide a basis for runoff attribution analysis for river basins with mountainous regions in similar areas.

2. Materials and Methods
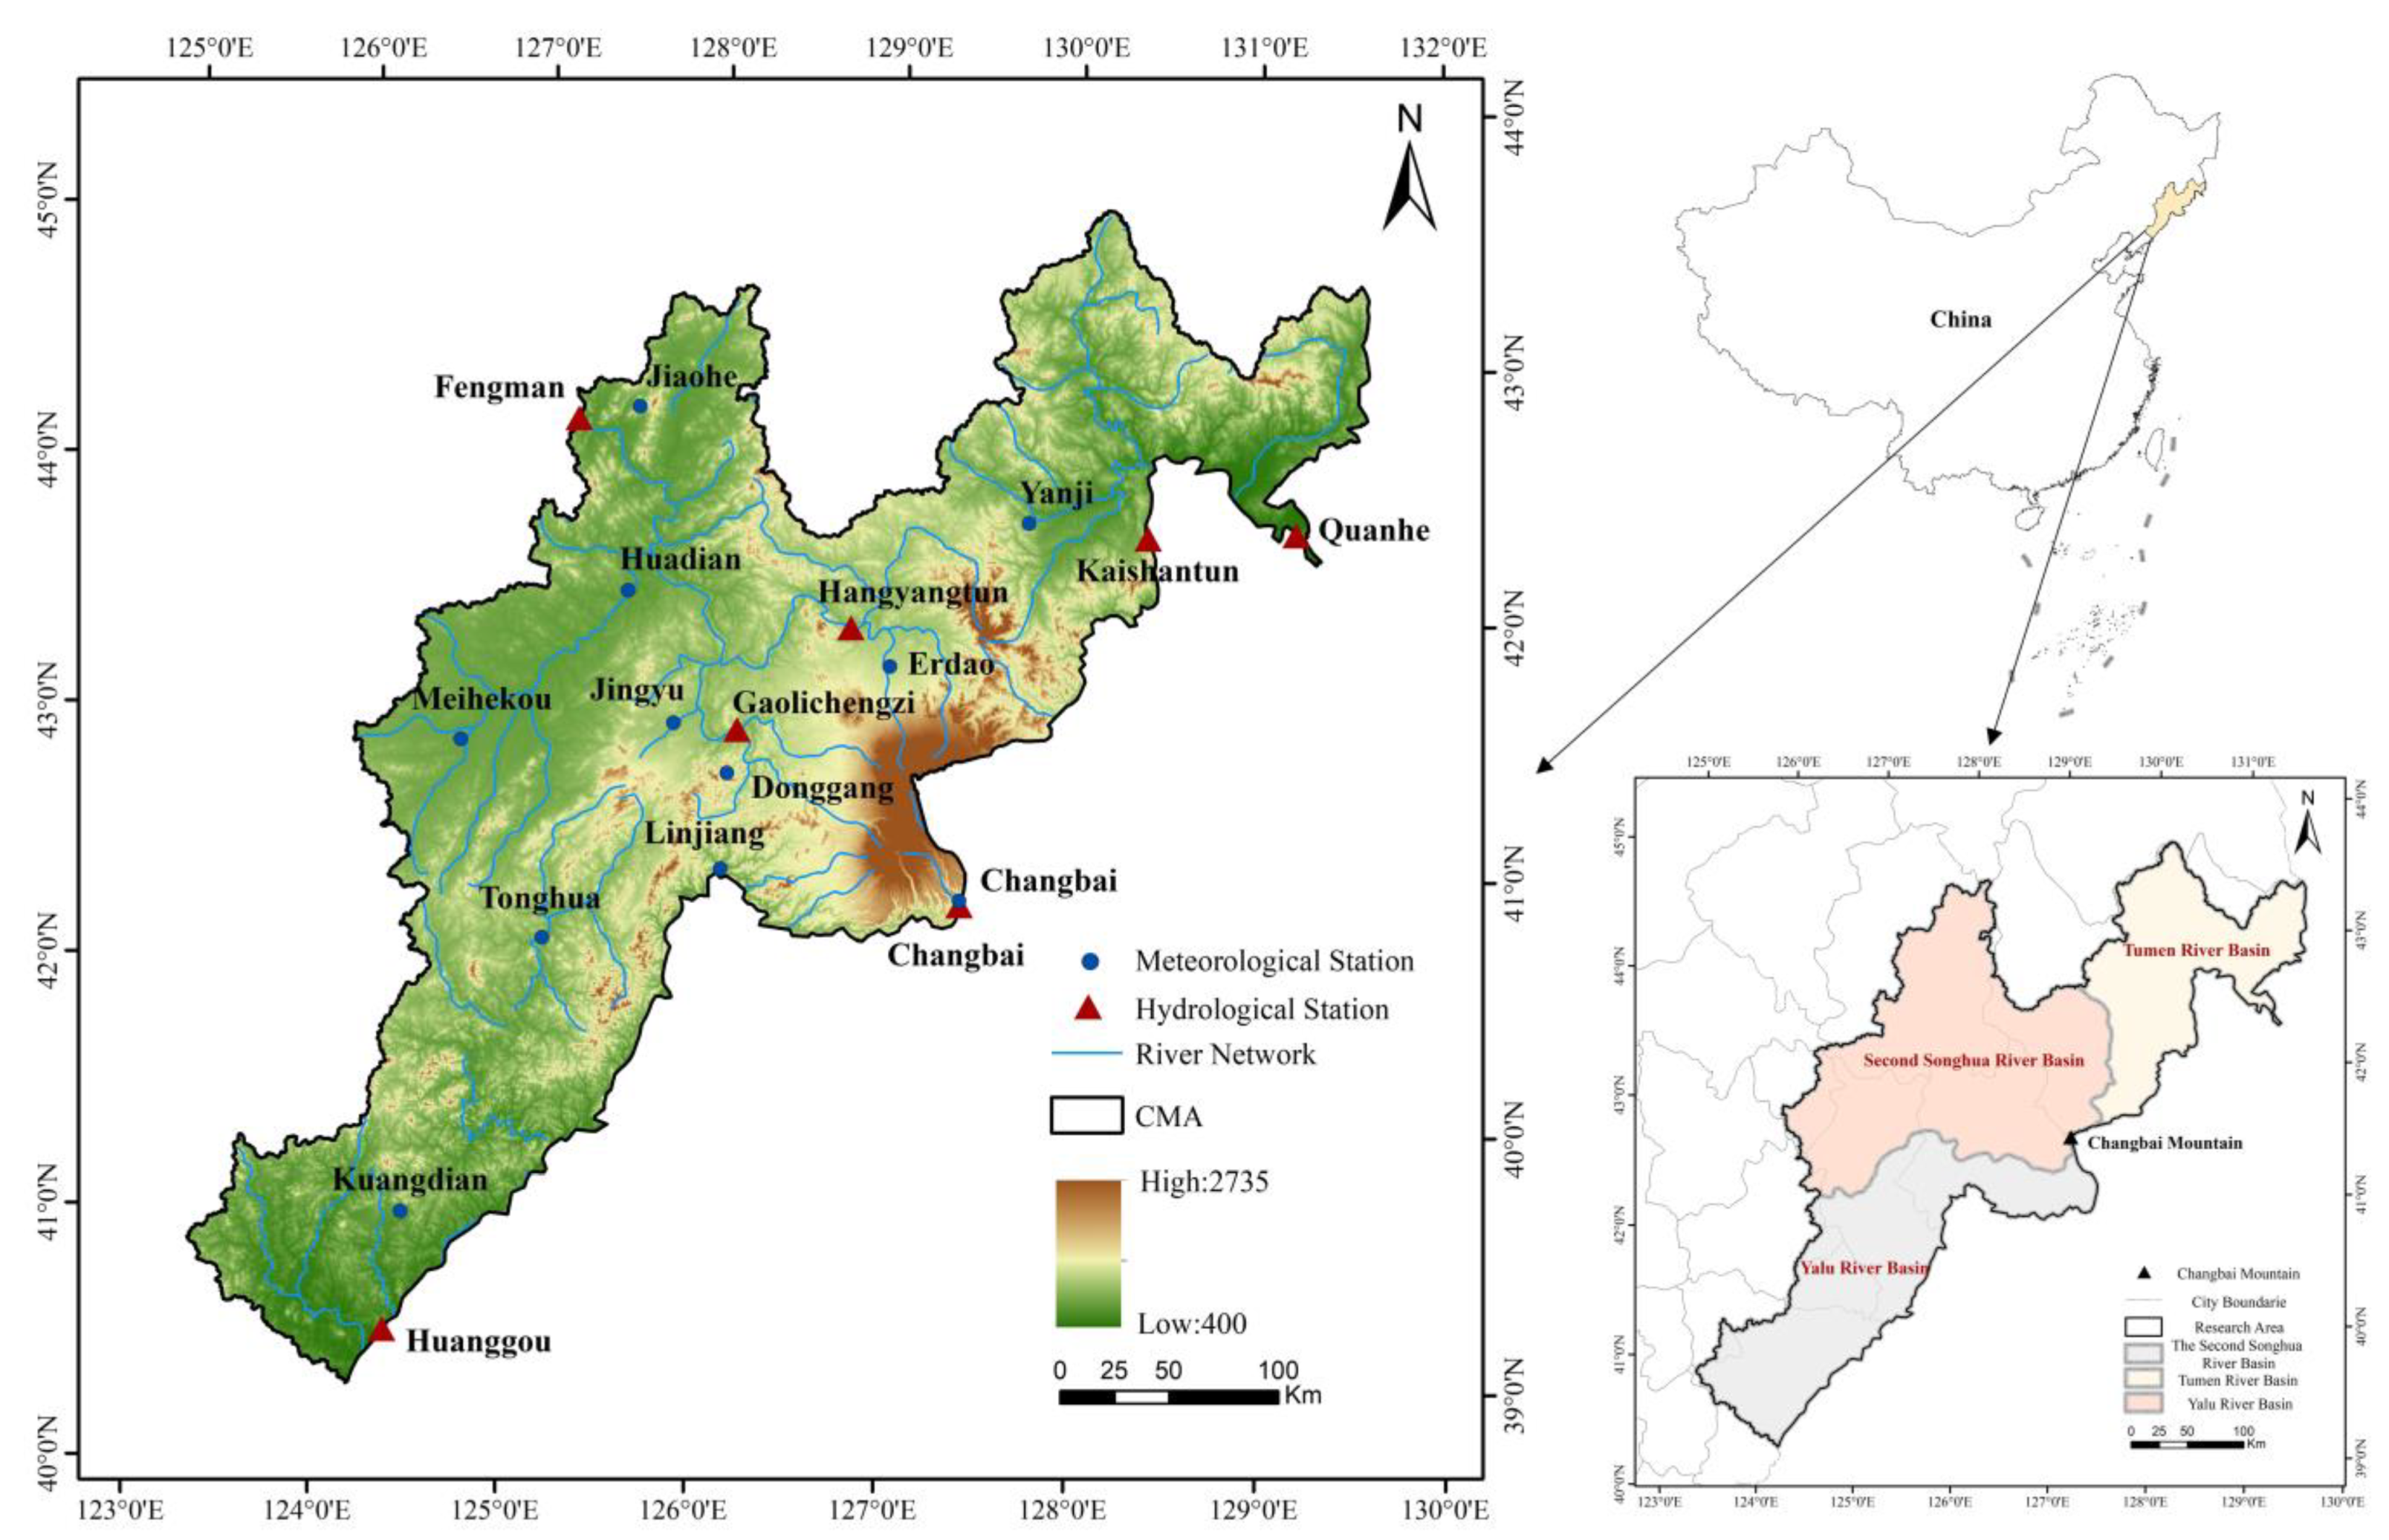
2.1. Study Area

The CMA (123°34′–131°14′ E and 40°4′–44°1′ N) is located in Northeast China, including the area above the Fengman reservoir in the Second Songhua River Basin (SSRB), the Tumen River Basin (TRB), and the Yalu River Basin (YRB), as shown in Figure 1. The CMA covers an area of 168,500 km2 and is elevated between 3400 and 2735 m above sea level. The annual average temperature and precipitation from 1960 to 2016 are 5.03 °C and 1103 mm, respectively. It is the birthplace of the Second Songhua, Tumen, and Yalu Rivers, which are rich in water and hydropower resources. The TRB and the YRB, which form borders between China, North Korea, and Russia, have important political status.

2.2. Data

In this study, the analysis used natural runoff data from seven selected hydrological stations. Among them, data from the Fengman (FM), Quanhe (QH), and Huanggou (HG) stations were used for the attribution analysis of runoff changes across the entire basin. The Gaolichengzi (GLCZ), Hanyangtun (HYT), Kaishantun (KST), and Changbai (CB) stations were selected to analyze the runoff changes in mountainous regions of the area. The natural runoff was obtained by reverting the measured runoff, and the annual average runoff (R) data came from the Songliao Water Resources Commission of the Ministry of Water Resources. Available online: http://www.slwr.gov.cn/ (accessed on 18 July 2020). Daily precipitation (P) records and other meteorological data were collected, including daily mean temperature (T), wind speed (WS), sunshine duration (SSD), vapor pressure (VP), and relative humidity (RH), from the National Meteorological Information Center of the China Meteorological Administration (CMA) at 10 meteorological stations. Available online: http://data.cma.cn/ (accessed on 11 October 2019). Additionally, the Kriging method was used to interpolate the data to obtain the meteorological data corresponding to hydrological stations. Based on meteorological data, potential evapotranspiration (ET0) was estimated using the Penman–Monteith equation recommended by the UN Food and Agriculture Organization (FAO). The Thiessen polygon method was used to calculate average precipitation and potential evapotranspiration (see Table 1 for details).

2.3. Methods

2.3.1. Sen’s Slope Estimator

Sen developed a nonparametric procedure for estimating the slope of a trend in long-term series data [36]. The equation for Sen’s trend slope is as follows:
S S = Median ( x j x i j i ) , j > i
where x j and x i   are the data values at times j and i ( j > i ). The variable S S   indicates the average rate of change and, thus, the trend of the time series. When S S > 0 , the sequence is increasing; when S S = 0 , there is no trend; and when S S < 0 , the sequence is decreasing.
The Kriging interpolation is used to interpolate the precipitation, potential evapotranspiration, and temperature data to obtain the annual rasterized spatial distribution data. Additionally, Sen’s Slope Estimator is used to analyze the data of each grid to obtain the trend of precipitation, potential evapotranspiration, and temperature in the entire study area.

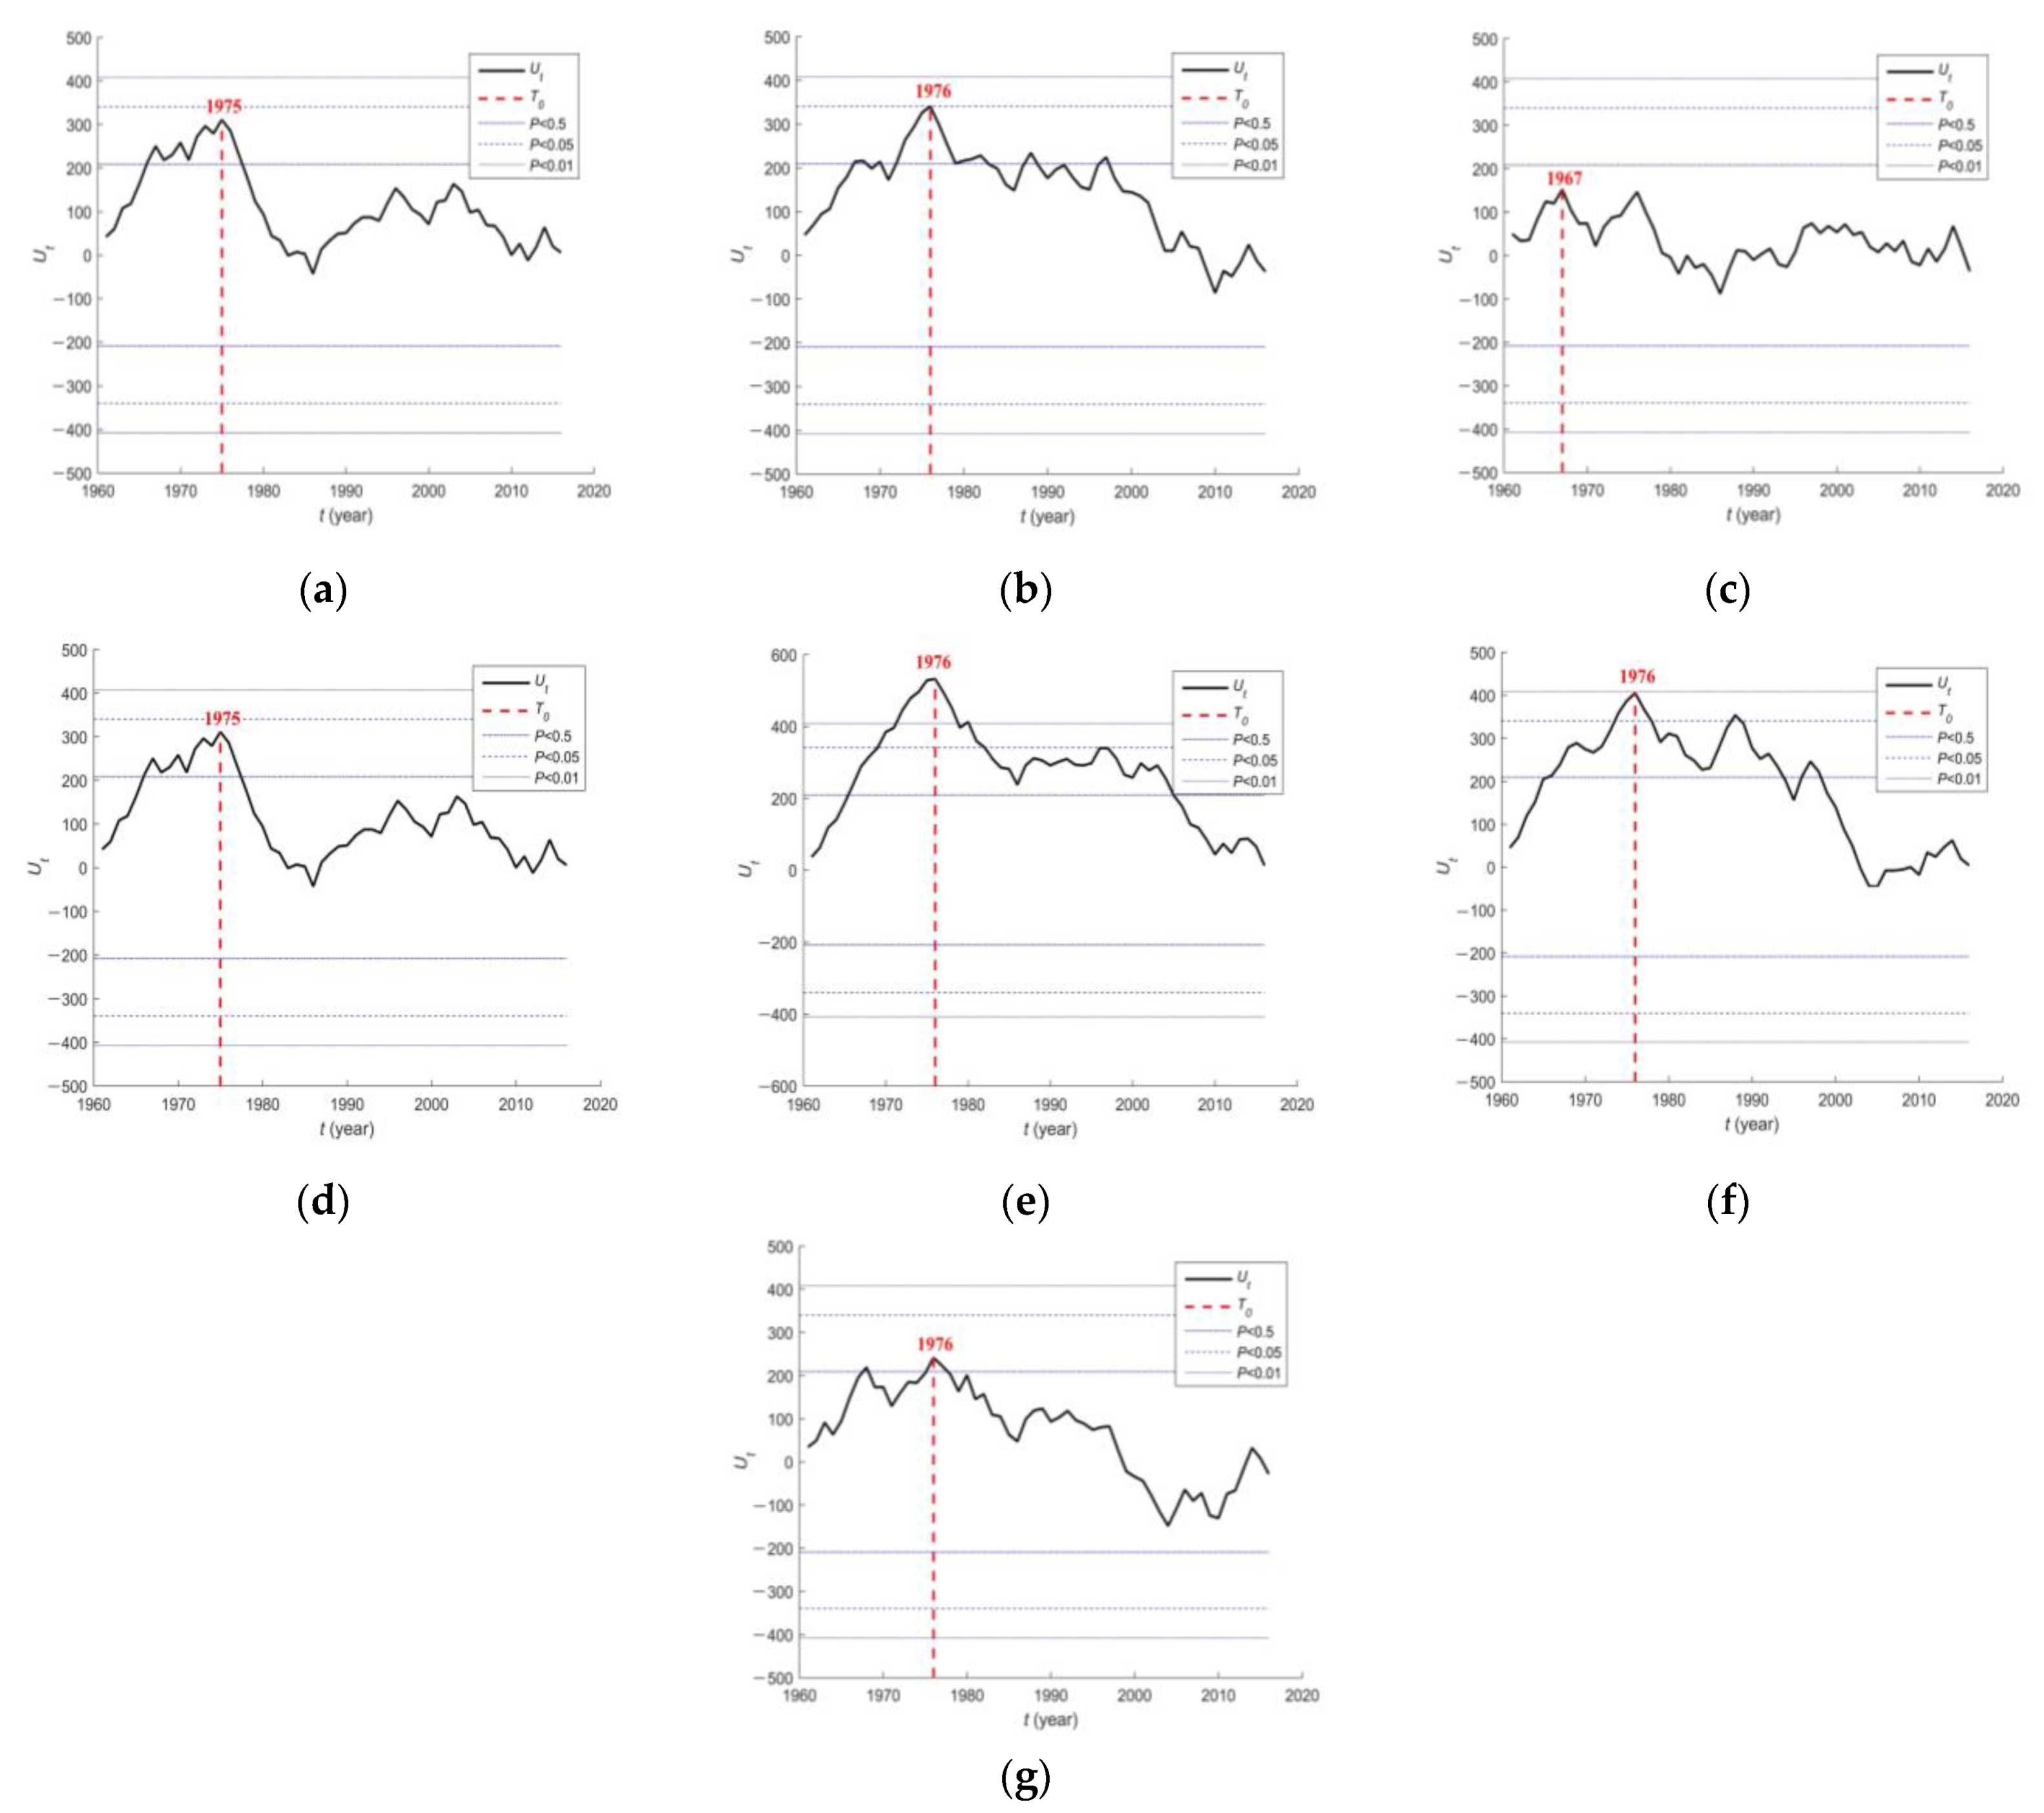
2.3.2. Pettitt Mutation Point Test

The Pettitt mutation point test assumes that a random hydrological sequence has a mutation in time t [37]. In this study, the Pettitt mutation point test was used to divide the runoff sequence of each hydrological station into two periods. The period before the mutation point was called the baseline period, and the period after the mutation point was the impact period. The mutation point statistical variable is defined as follows:
k t 0 = M a x | S k |  
where time j = 1 , 2 , , i , S k is the cumulative number when the value at time i is greater than or less than the value at time j .
The significance level of a mutation point is defined as follows:
P = 2 exp [ 6 k t 0 2 ( n 3 + n 2 ) ]
If P 0.05 , the mutation point was considered to be statistically significant.

2.3.3. Runoff Elasticity

The long-term water balance for a catchment can be described by the following equation:
R = P E T a Δ S  
where P , E T a , R , and Δ S represent the precipitation, actual evapotranspiration, runoff, and change in water storage, respectively. The values of E T a and Δ S cannot be directly observed at the catchment scale, so they must be indirectly estimated. The value of Δ S is usually assumed to be zero for the purposes of long-term analysis.
The Budyko framework is a powerful method for estimating actual evapotranspiration, E T a , that uses various empirical formulas. Many equations are used to estimate the E T a , such as the Fu equation [38], the Zhang equation [39], the Choudhury–Yang equation [26,27], and the Wang–Tang equation [40]. It has been showed that the two-parameter model is effective for calculating the impact of climate change [35], so this study used the Choudhury–Yang equation, which can be expressed as follows:
E T a = P × E T 0 ( P n + E T 0 n ) 1 / n  
where E T 0 is the potential evapotranspiration, and n is a parameter for the influence of human activity, which primarily represents the integrated effects of the catchment landscape characteristics on the water balance.
The water balance equation is therefore expressed as follows:
R = P P × E T 0 ( P n + E T 0 n ) 1 / n  
It is assumed that the climate impact can be decomposed into the separate effects of precipitation and evaporation, and the two climate factors are independent of each other. Then, the water balance equation can be rewritten as R = f ( P ,   E T 0 , n ) , and considering   P , E T 0 , and n as independent variables, the precipitation, potential evaporation, and landscape elasticities of runoff can be expressed as ε p , ε E T 0 , and ε n , which indicates the proportion of runoff change caused by changes in climatic factors and the catchment landscape per unit percentage. The elasticities are expressed as follows:
ε p = d R / R d P / P  
ε E T 0 = d R / R d E T 0 / E T 0  
ε n = d R / R d n / n  
According to Equation (9), and letting = E T 0 p , the precipitation, potential evaporation, and catchment landscape elasticities of runoff are given as follows:
ε p = ( 1 + n ) 1 / n + 1 n + 1 ( 1 + n ) [ ( 1 + n ) 1 / n ]  
ε E T 0 = 1 ( 1 + n ) [ 1 ( 1 + n ) 1 / n ]  
ε n = l n ( 1 + n ) + n l n ( 1 + n ) n [ ( 1 + n ) ( 1 + n ) 1 / n + 1 ]  
where is the aridity index that reflects the degree of drought in the climate.

2.3.4. Attribution Analysis of Runoff Changes

According to Equation (9), the total differential of R can be expressed as follows:
d R = R P d P + R E T 0 d E T 0 + R n d n  
The runoff change induced by a certain factor can be estimated as the product of the factor change and its partial derivative. The change in annual runoff from the baseline period ( R 1 ) to the impact period ( R 2 ) can be represented by the difference between the average runoff depths before and after the mutation point as follows:
Δ R = R 2 R 1  
In addition, changes in runoff depth can also be expressed as changes caused by climatic factors and human activities as follows:
Δ R = Δ R p + Δ R E T 0 + Δ R n  
where Δ R p , Δ R E T 0 , and Δ R n represent runoff changes caused by precipitation, potential evapotranspiration, and human activities.
According to Equation (16) and the runoff elasticities ( ε p ,   ε E T 0 and   ε n ), the change in runoff caused by each element can be expressed as follows:
  Δ R p = ε p R P Δ p  
Δ R E T 0 = ε E T 0 R E T 0 Δ E T 0  
Δ R n = ε n R n Δ n  
Therefore, the contribution rate of climate change ( P and E T 0 ) and human activities ( n ) to runoff change can be calculated as follows:
μ p = | Δ R p | | Δ R p | + | Δ R E T 0 | + | Δ R n | × 100 %  
μ E T 0 = | Δ R E T 0 | | Δ R p | + | Δ R E T 0 | + | Δ R n | × 100 %  
μ n = | Δ R n | | Δ R p | + | Δ R E T 0 | + | Δ R n | × 100 %  

3. Results

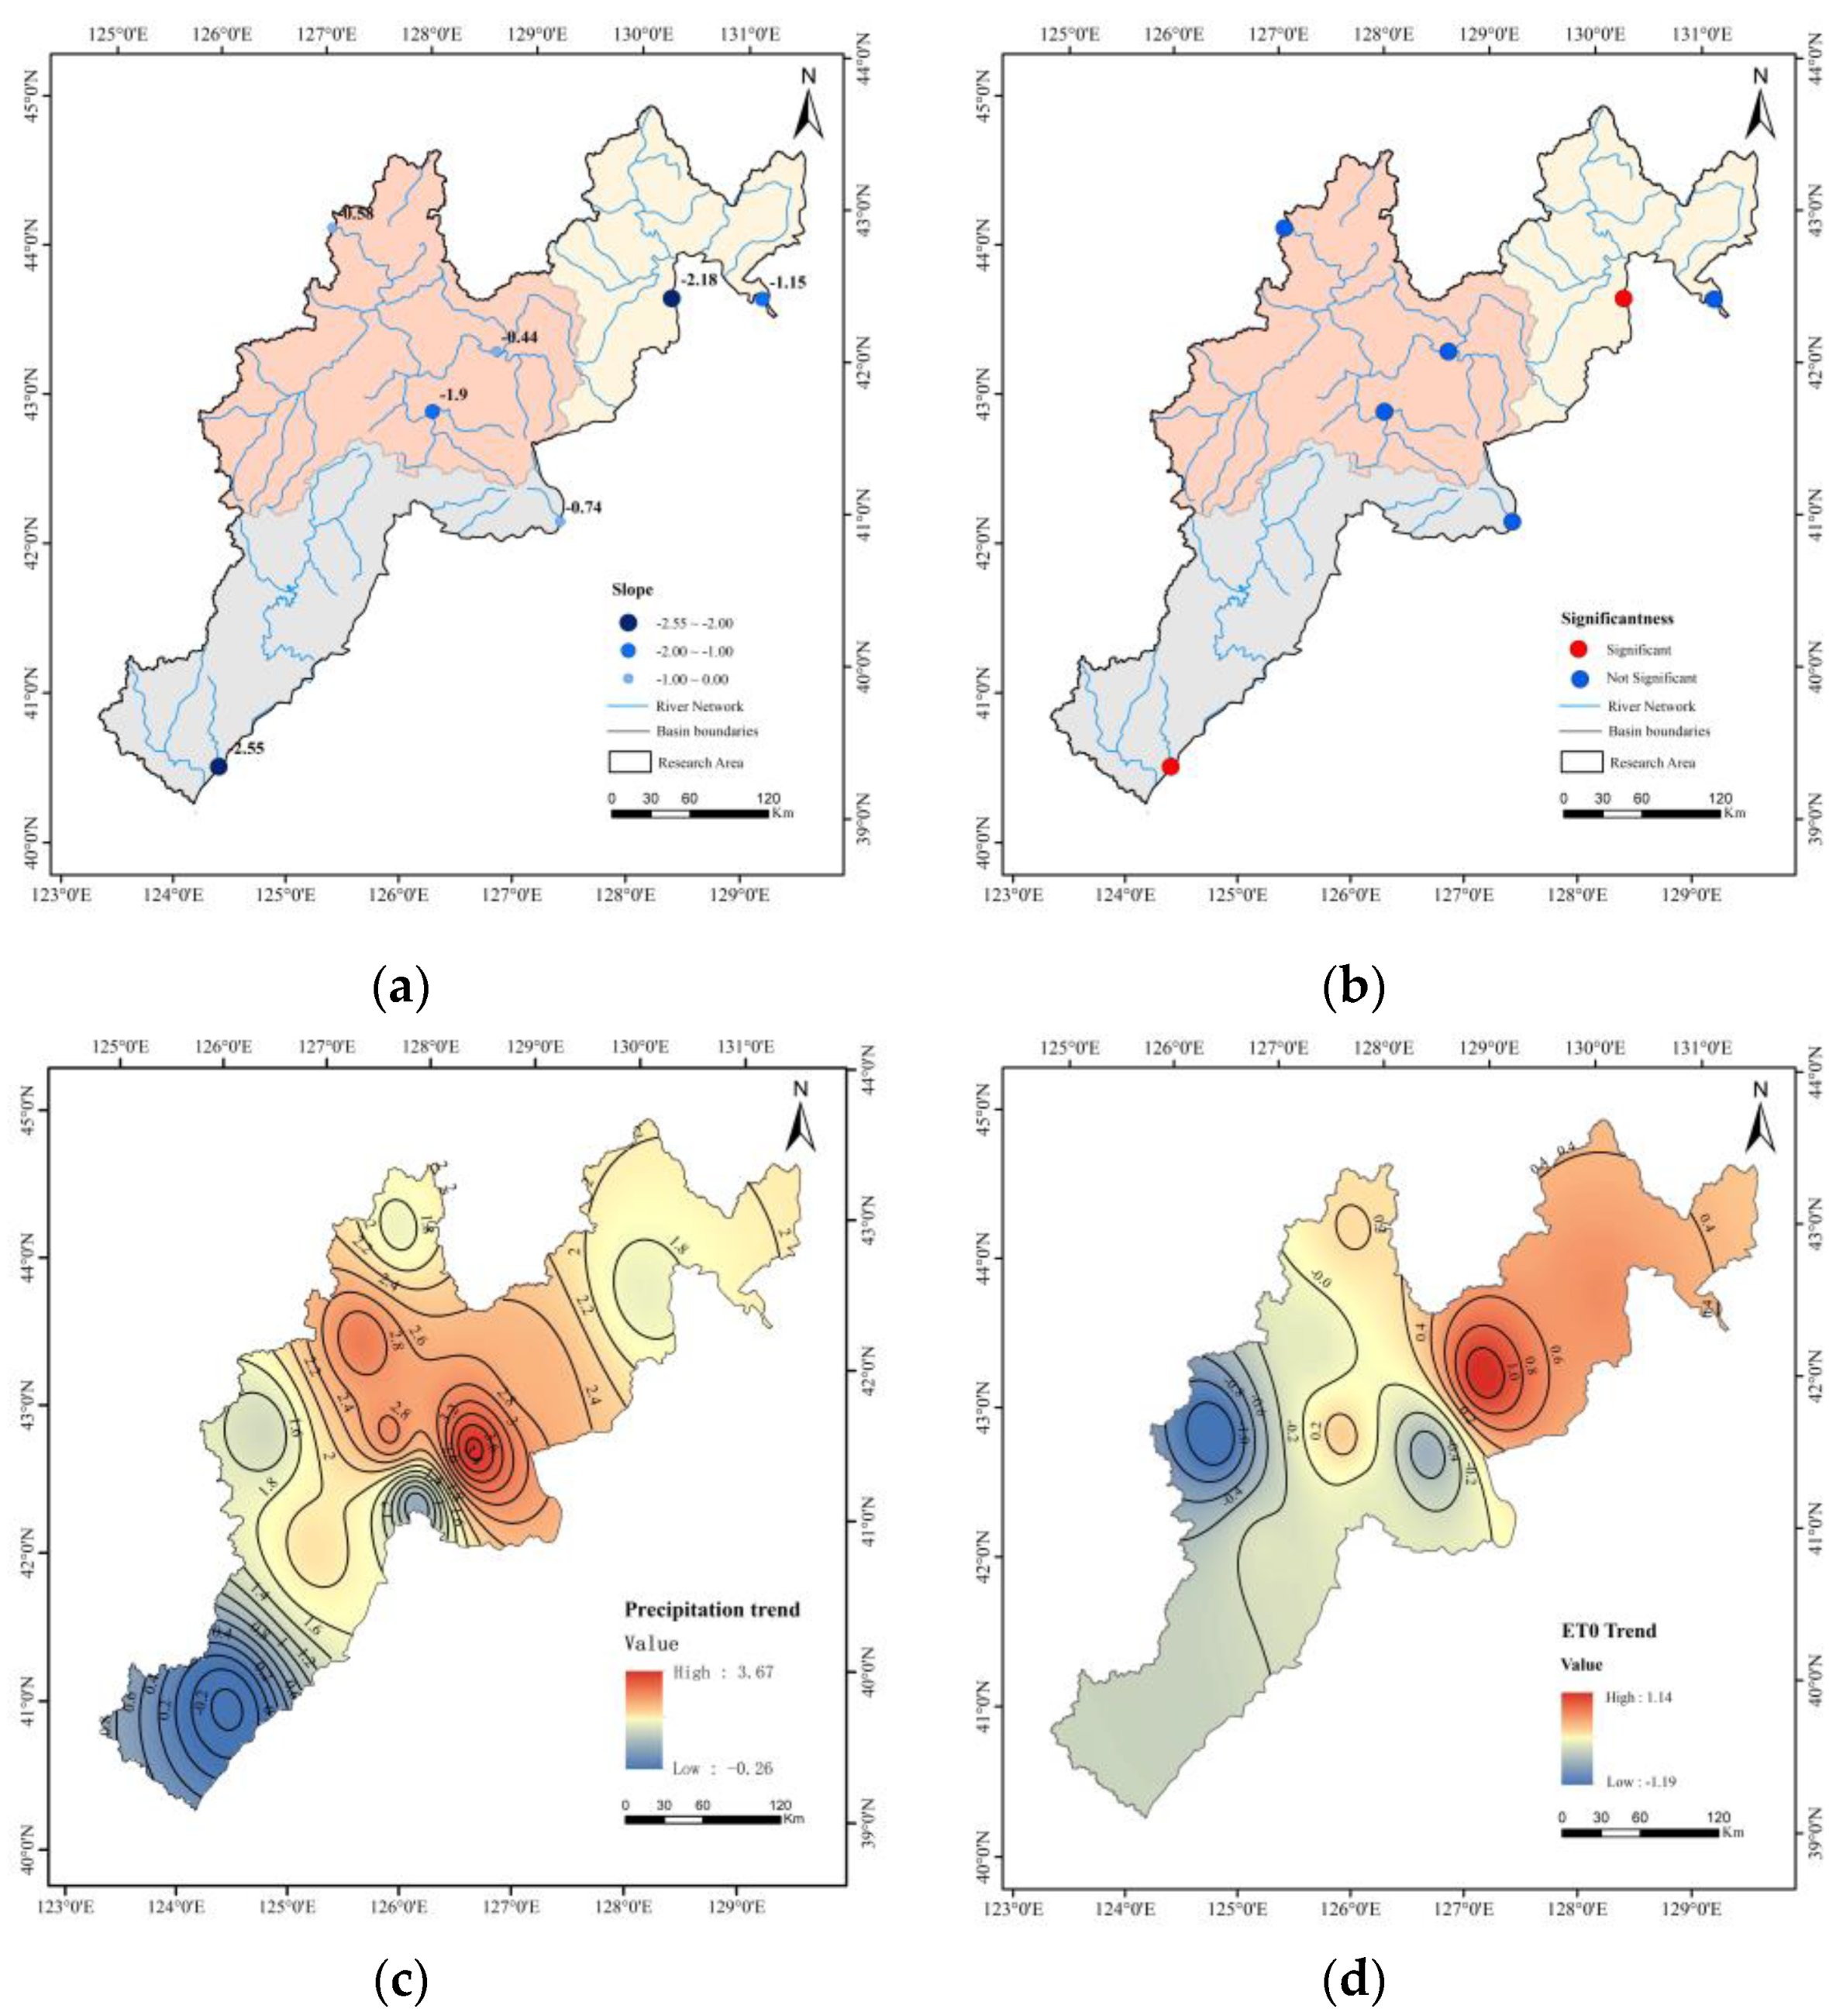
3.1. Changes in Runoff and Climate Factors

As shown in Figure 2a,b, from 1960 to 2016, the average annual runoff depth within the control areas of all the hydrological stations showed a downward trend. At the 95% significance level, only the KST and HG stations had a significant decline in the runoff. The rate of change of the SSRB, TRB, and YRB runoff were −0.58 mm/a, −1.15 mm/a, and −2.55 mm/a, respectively. For mountainous and cold regions, the TRB had the largest downward trend of −2.18 mm/a, and the YRB had the largest downward trend of −0.74 mm/a. During the same period, except for some areas in the lower reaches of the YRB, the precipitation showed an upward trend, and the rate of change ranged from −0.2 to 3.67 mm/a, as shown in Figure 2c. As shown in Figure 2d, the potential evapotranspiration in most areas of the TRB and the SSRB showed an upward trend, while the potential evapotranspiration of the YRB showed a downward trend.

3.2. Hydroclimatic Characteristics

Table 2 shows the hydrological and climatic characteristics of the three CMA basins. The average annual precipitation ranges from 558 to 780 mm, the annual potential evapotranspiration ranges from 767 to 834 mm, and the annual runoff depth ranges from 145 to 504 mm. The dryness index ( E T 0 / P ) is an indicator of the degree of drought in a region. In the three basins, the dryness index was higher than 0.9 and ranged from 0.94 to 1.56, which is typical of a semi-humid region. The runoff coefficients ( R / P ) were all higher than 0.2, and the annual runoff depth was greater than 100 mm, which are typical hydroclimatic features of mountainous regions. The large runoff coefficient (annual runoff) may be related to snowmelt runoff and the underlying surface conditions of the basins. In addition to the TRB, the mountainous regions of the other two basins had higher runoff coefficients, which indicated that the mountainous regions were more affected by snowmelt runoff. The n parameter characterizes the nature of the land-use/cover change (LUCC) of a basin. It is related to terrain, soil, vegetation, and other factors. Terrain and soil are relatively stable over a short time scale, so a larger n-value indicates a larger area of vegetation cover. In this study, the n values were derived from the Choudhury–Yang equation. The n parameter for the CMA was between 0.52 and 1.67. The n-value of the SSRB and the YRB in the mountainous regions was higher than that of the entire basin, which was caused by low vegetation coverage in the mountainous regions. The n-value was larger and the runoff coefficient was small in the mountainous region of the TRB basin, which was due to the relatively low altitude and high vegetation cover.
Changes in the Budyko curve ( E T 0 / P ~ E T a / P ), which reflects the state of the water–energy balance, for the water–energy balance over base and impact periods can reflect the impact of climate change and underlying surface conditions. Figure 3 shows the changes in the water–energy balance state from the baseline period before the mutation point to the impact period after the mutation point for each hydrological station in the CMA. Except for the CB station, the degree of drought at the other stations was reduced or unchanged (i.e., the dryness index became smaller or was unchanged), but the value of n at each station became larger, and the evaporation ratios ( E T a / P ) of the basins increased. This indicated that changes to the underlying surface conditions were the main factor disturbing the water–energy balance. While the n-value at the CB station has unchanged, the degree of drought increased, which may have been caused by the higher elevation of the basin.

3.3. Mutation Point of Annual Runoff

The Pettitt mutation point test can not only determine the time when the mutation point appears but also provide the meaning of the mutation point. Therefore, the Pettitt method was used to analyze the breaking point of the CMA station runoff data from 1960 to 2016. FM, QH, and HG were the control stations of the SSRB, TRB, and YRB basins, respectively, and their runoff data were used to diagnose the mutation points of the entire watershed. The GLCZ, HYT, KST, and CB stations were selected to diagnose the mutation points in the mountainous regions of the CMA. The maximum value of U t at most of the stations occurred around 1976, which indicated that the abrupt change point of the runoff in these basins occurred in 1976, as shown in Figure 4. Although the maximum U t value for the FM and HYT stations occurred in 1997 and 1968, respectively, in 1976, the second largest U t value occurred. For the convenience of the calculation, the mutation point of the surface runoff sequence was set as 1976, which is consistent with the change point of social and economic policies in China. With the implementation of the reform and opening-up policy in 1978, social and economic development has been rapid in China, and agricultural activities have increased dramatically. It has accelerated the proportion of urban construction land and vegetation coverage, and the impact of human activities on the water cycle in the basin is strengthened. Therefore, the period before the mutation point was defined as the base period (1960–1975), and the period after the mutation point was the impact period (1976–2016), which was used for the attribution analysis of the runoff changes.

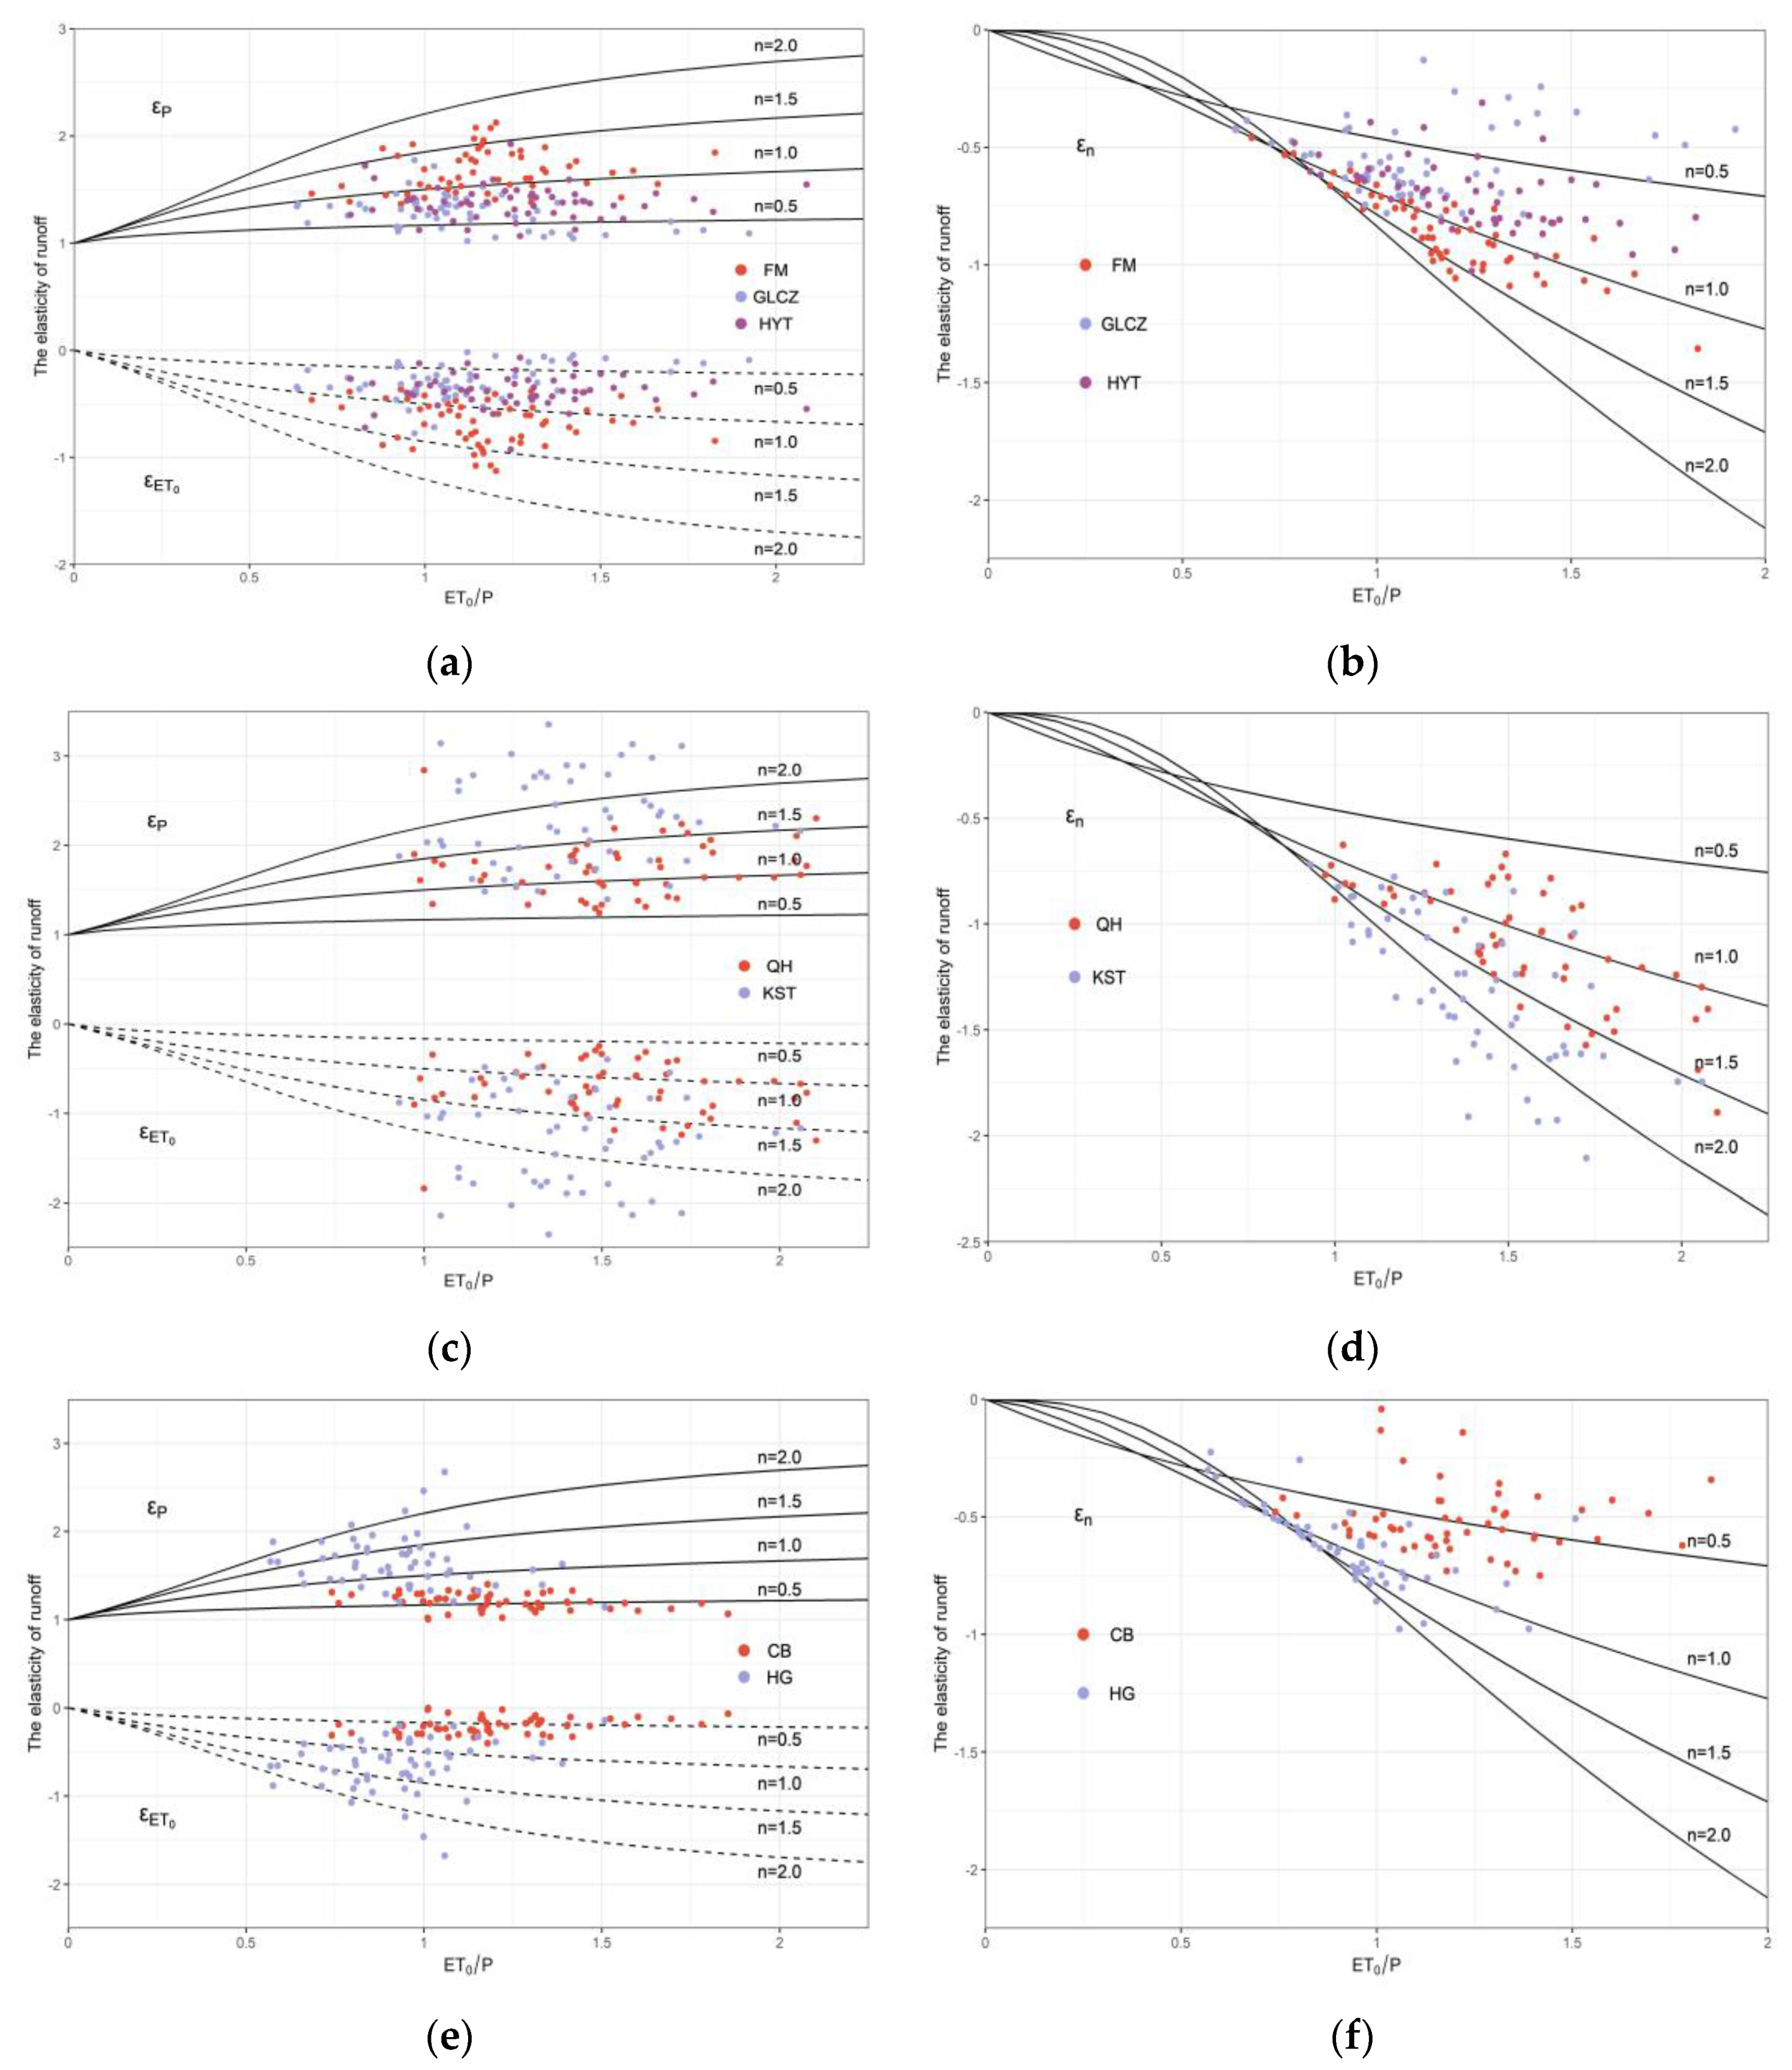
3.4. Runoff Elasticity

The theoretical curves for the runoff elasticity and the dryness index ( E T 0 / P ) under different land cover conditions ( n ) are depicted in Figure 5. As shown in Figure 5a, the land cover conditions ( n ) greatly affect the degree of change of the precipitation elasticity ( ε P ) and potential evapotranspiration elasticity ( ε E T 0 ) with the dryness index. The larger the n-value, the greater the degree of change in the elasticity of the runoff. Additionally, under the same underlying surface conditions, as the dryness index increases, the climatic elasticity of the runoff was less and less affected by climate change. When the dryness index was higher than 2, the climatic elasticity of runoff tended to stabilize. As shown in Figure 5b, when the dryness index is greater than 0.5, the absolute value of the land cover conditions’ elasticity ( ε n ) keeps increasing as the dryness index increases.
The runoff elasticity was defined as the degree of change in basin runoff caused by changes in unit climate elements. The points in Figure 5 show the precipitation elasticity ( ε P ), potential evapotranspiration ( ε E T 0 ), and land cover conditions ( ε n ) for runoff at each site. In the SSRB, the ε P varied from 1.36 to 2.12, with an average of 1.66, which meant that a 10% increase in P increases R by 16.6%. The mean values of the potential evapotranspiration elasticity ( ε E T 0 ; ranging from −1.12 to −0.36) and the land cover condition elasticity ( ε n ; ranging from −1.35 to −0.45) of the runoff were −0.20 and −0.51, respectively. This meant that a 10% increase in E T 0 (or parameter n) would decrease R by 2.0% (or 5.1%). In the TRB, the mean values for precipitation ( ε P ;   ranging from 1.24 to 2.84), potential evapotranspiration elasticity ( ε E T 0 ; ranging from −0.24 to −1.84), and land cover condition elasticity ( ε n ; ranging from −1.89 to −0.62) of runoff were 1.73, −0.73, and −1.09, respectively. This meant that a 10% increase in P ( E T 0 or n ) would decrease R by 17.3% (7.3% or 10.9%, respectively). In the YRB, the mean values of the precipitation elasticity ( ε P ; ranging from 1.14 to 3.83), potential evapotranspiration elasticity ( ε E T 0 ; ranging from −0.14 to −2.83), and the land cover conditions’ elasticity ( ε n ; ranging from −0.97 to −0.22) of the runoff were 1.69, −0.69, and −0.63, respectively, which meant that a 10% increase in P ( E T 0 or n ) would decrease R by 16.9% (6.9% or 6.3%, respectively).

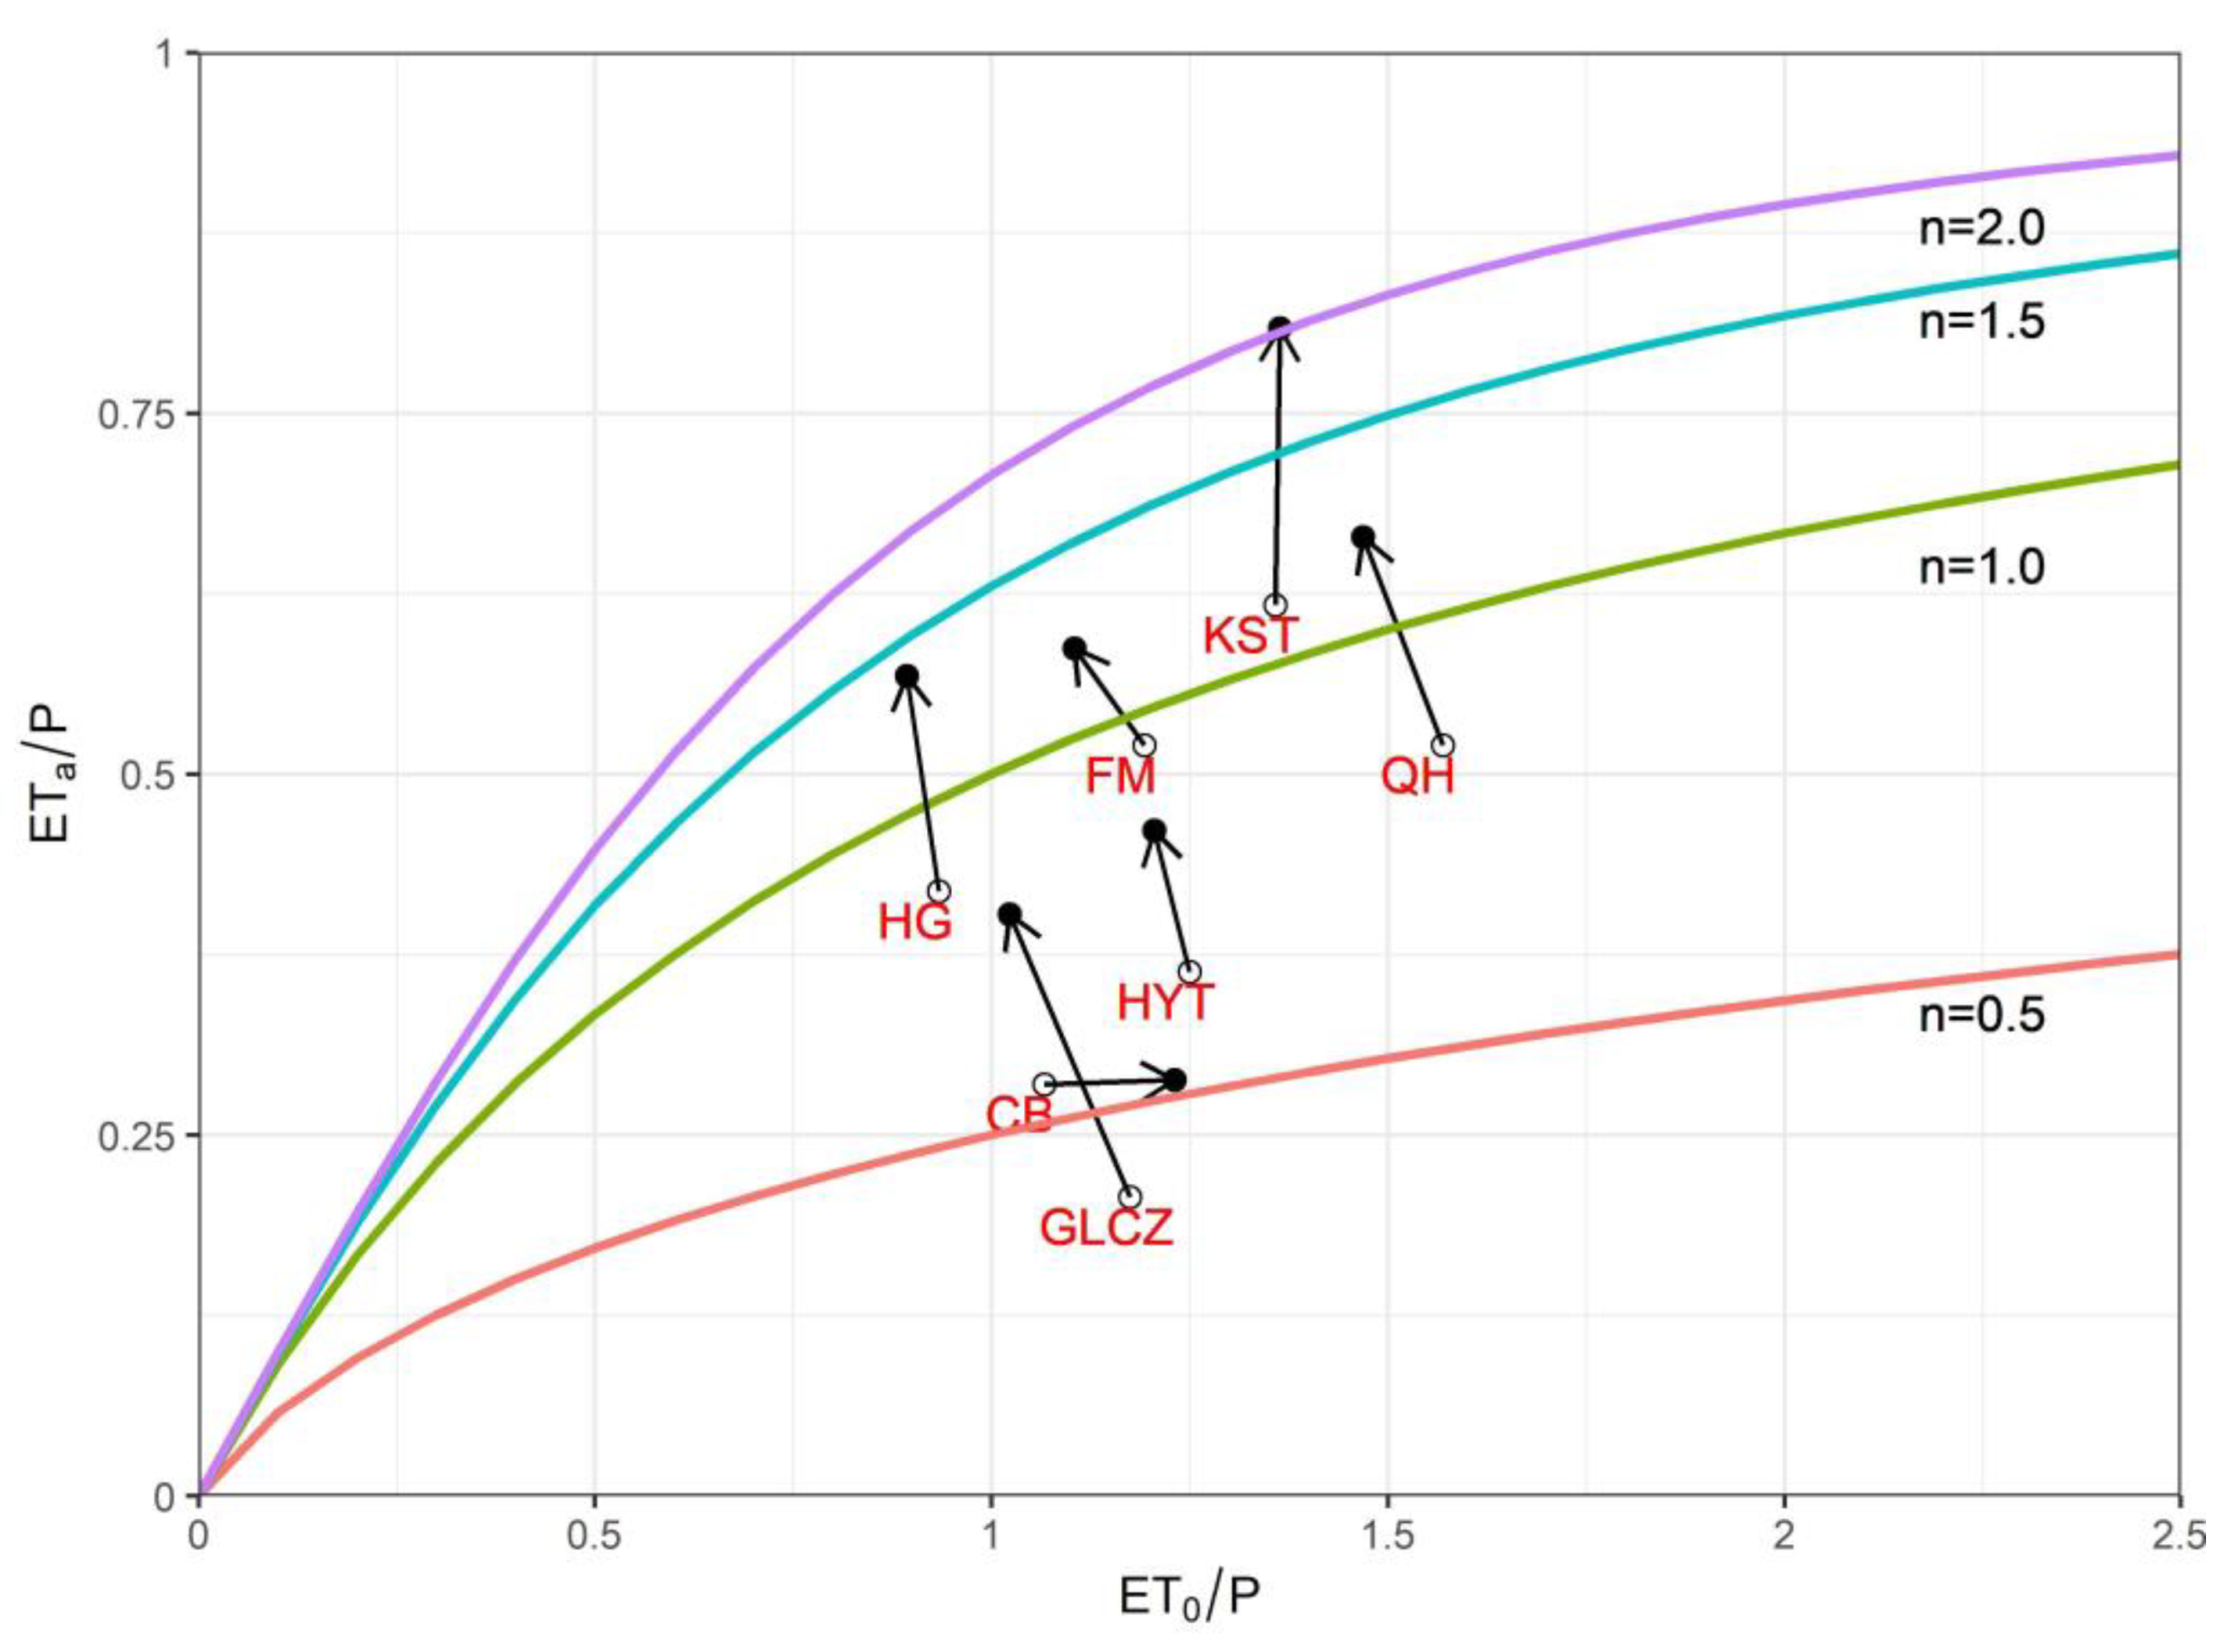
3.5. Attribution of Runoff Changes

The hydrometeorological characteristics and runoff elastic coefficients of the base and impact periods are shown in Table 3. In general, the elastic coefficient of the impact period was greater than the elastic coefficient of the base period, which indicated that the runoff after the mutation point was more sensitive to changes in precipitation, potential evapotranspiration, and underlying surface conditions. Using the Budyko hypothesis, the difference in the runoff between the two periods and the contribution of climate change and changes in the basin landscape to runoff were obtained. The contribution of climate change and human activities to runoff change is shown in Table 4. The contribution rate of climate change to runoff change ( μ c ) was the sum of the precipitation contribution rate and the potential evapotranspiration contribution rate ( μ c = μ P + μ E T 0 ). The contribution rate of the SSRB (TRB and YRB) climate change to runoff change was 39.85% (26.26% and 15.04%), and the contribution rate of human activities to runoff change was 60.15% (73.74% and 84.76%). In general, human activities had a greater impact on surface runoff changes. The different trends are shown in the attribution analysis results of runoff changes between the mountainous region and the entire basin. In the SSRB, the contribution rate of climate change and human activities in the mountainous region to surface runoff did not change as much as for the entire basin. In the TRB, the contribution rate of human activities to surface runoff in mountainous regions was greater than that of the entire basin. In the YRB, the contribution rate of human activities in the mountainous region to surface runoff was much smaller than that of the entire basin. This may have been related to the selection of site location.

4. Discussion

This study estimated the impact of climate change and human activities on annual basin runoff. We used Sen’s slope estimator and the Pettitt mutation point test to analyze trends in hydrometeorological changes and runoff mutation points based on the Budyko framework using the Choudhury–Yang water–energy coupling balance equation. Unlike previous studies, this study selected four hydrological stations in mountainous regions and three hydrological stations at the outlet of drainage basins to distinguish the difference between mountainous regions and the entire drainage basin. This study showed that in areas with frequent human activities, this was the main factor that had caused runoff reduction, while for mountainous regions, climate change was the main factor that had caused runoff reduction, which is consistent with previous research. Wang et al. used the Slope Change Ratio of Cumulative Quantity method (SCRCQ) to analyze images of climate change and human activities in the Songhua River Basin [15]. In the Dalai–Haerbin Basin, the impacts of precipitation, evapotranspiration, and human activities were 29.7%, −15.6%, and 85.8%, respectively. Cao et al., also exploring the impact of climate change and human activities on surface runoff in the SSRB based on the Budyko hypothesis, found that human activities had affected runoff changes in three periods, 1975~1989, 1990~1999, and 2000~2009, with the following contributions: 35%, 57%, and 66%, respectively [41].
Combined with the socioeconomic development of CMA, we found that the impact of human activities on runoff is mainly reflected in the changes of underlying surface conditions. Since China’s reform and opening up in 1978, the rapid development of agricultural activities has had a certain impact on the underlying surface conditions of the study area. Although natural runoff was used for calculation, part of agricultural water was not included in the statistical range, and the evaporation and infiltration of this water led to the reduction in runoff. At the same time, planting trees and grass contributes to ecological environment protection and water conservation, but it also intercepts precipitation and increases evaporation, thus reducing runoff. For mountainous regions, although climate change is the main cause of runoff change, the construction of small hydropower stations also contributes to the decrease in runoff.
The runoff elasticity showed the same distribution law in the SSRB and the YRB, and the absolute value of the elasticity coefficient for the entire basin was greater than that of the mountainous regions (Figure 5). This indicated that the hydrological process of the entire basin was more sensitive to climate change and human activities than the mountainous regions. The reason for the different results from the TRB was that the characteristics of the mountainous region in the control basin of the selected KST station were not obvious, and the area in the same mountainous region in the control basin of the QH station was large, which resulted in little difference in the average annual runoff depth, precipitation, and potential evapotranspiration. As shown in Figure 1, the mountainous area in Tumen River Basin has a large proportion, and there are several large cities in the upstream area of KST station, which will have a certain influence on the results. At the same time, due to the location of the border, we cannot study the river basin in North Korea, which may cause some errors in the results. The same result also appeared in the contribution of climate change and human activities to the surface runoff changes. The contribution of human activities to runoff changes in the SSRB and the YRB mountainous regions was close to or less than that of the entire basin. This result was the most obvious in the YRB, where the impact of human activities in the mountainous regions was only 17.2%. In this study, the impact of human activities was related to changes in the n-value. The increase in vegetation coverage caused by measures, such as farmland reclamation, soil and water conservation, and ecological restoration, was the main reason for the decrease in runoff caused by human activities. The control basins of the GLCZ, HYT and KST stations were greatly affected by these factors; therefore, the contribution of human activities were considerable. According to the results of the study, we found that the runoff elasticity and the attribution of runoff changes in mountainous regions are significantly different from the entire basin. Therefore, in the context of climate change, we need to adopt different water resources management measures in mountainous regions to ensure the sustainable use of water resources. This is of great significance to the formulation of sustainable water resources management and planning strategies.
According to the results of this study, the following suggestions are put forward for sustainable utilization and management of water resources in CMA. First, under the background of reduced runoff, water conservation is an important means to achieve sustainable development and utilization of water resources. To strengthen the management of water quantity and quota, the publicity of water-saving and environmental protection should be increased. Secondly, the rapid development of agriculture leads to an increase in water consumption, which in turn leads to a decrease in runoff. In view of this, it is suggested to optimize the allocation of water resources, vigorously develop water-saving irrigation, adjust the agricultural structure and improve the utilization efficiency of water resources. In addition, different management measures should be taken in mountainous regions to regulate the discharge of small hydropower stations to ensure a certain ecological discharge of the downstream river.
This study also has some limitations. Where possible, it is advisable to use longer-term data to capture variability and better represent average conditions [42]. Therefore, to ensure the accuracy of the results, it used a long data period, from 1960 to 2016, for the calculations. However, for this reason, it was impossible to use the same length of the snow cover data for the further analysis of runoff changes. Although studies have shown that the surface water reserves can be approximately approaching to zero on a long-term scale, the melting of snow in mountainous regions still has a significant impact on runoff changes, thus creating errors in analysis results. In this study, the underlying surface parameter n was used to calculate the impact of human activities, but it included the factor of melting snow, which might lead to an overestimation of the impact of human activities on the runoff changes. Meanwhile, the attribution analysis based on the Budyko framework and water balance lack physical mechanisms compared with the hydrological model method, so it cannot further decompose the impact of human activities on runoff.

5. Conclusions

This study used annual runoff data from seven hydrological stations and the annual precipitation and potential evapotranspiration data from 11 meteorological stations in the CMA from 1960 to 2016 to analyze the changes in runoff and several key hydroclimatic elements. The runoff in all regions had declined, but the decline in most regions was not significant. A sudden change in the runoff in most areas occurred in 1975, so the base period (1960–1975) and the impact period (1976–2016) were divided at this point. Additionally, the impact of climate change and human activities on runoff changes was quantified. For the SSRB (TRB and YRB), the contribution rate of climate change to runoff change was 39.85% (26.26% and 15.04%), and the contribution rate of human activities to runoff change was 60.15% (73.74% and 84.76%). Therefore, for most areas, human activities, such as farmland development, soil and water conservation, and ecological restoration, were the main causes of runoff changes. At the same time, the comparison of elastic coefficients shows that, compared with the entire basin, runoff changes in the mountainous regions were less sensitive to climate change and human activities. At the same time, unlike the entire basin, climate change was the main cause of runoff changes in the mountainous regions. This study distinguishes the different impacts of climate change and human activities on runoff in mountainous regions and the entire basin, which has guiding significance for different regions to formulate the corresponding refined management measures of water resources, improve the utilization efficiency of water resources and realize the sustainable utilization of water resources. Additionally, in the context of global warming, the research results can provide a basis for formulating adaptive strategies to cope with climate change.

Author Contributions

Writing—original draft preparation, S.Z.; writing—review and editing, J.L., C.L., F.Y., J.S.; data curation, L.J. All authors have read and agreed to the published version of the manuscript.

Funding

This research was funded by the National Key Research and Development Project (2019YFC0409104, 2017YFC1502405), and the National Natural Science Foundation of China (51822906).

Conflicts of Interest

The authors declare no conflict of interest.

References

  1. Allen, M.R.; Ingram, W.J. Constraints on future changes in climate and the hydrologic cycle. Nature 2002, 419, 228–232. [Google Scholar] [CrossRef] [PubMed]
  2. Amin, M.; Shaaban, A.; Ercan, A.; Ishida, K.; Kavvas, M.; Chen, Z.; Jang, S. Future climate change impact assessment of watershed scale hydrologic processes in Peninsular Malaysia by a regional climate model coupled with a physically-based hydrology modelo. Sci. Total. Environ. 2017, 575, 12–22. [Google Scholar] [CrossRef] [PubMed]
  3. Li, B.; Shi, X.; Lian, L.; Chen, Y.; Chen, Z.; Sun, X. Quantifying the effects of climate variability, direct and indirect land use change, and human activities on runoff. J. Hydrol. 2020, 584, 124684. [Google Scholar] [CrossRef]
  4. Xu, C.Y.; Chen, H.; Guo, S.L. Hydrological modeling in a changing environment: Issues and challenges. Water Resour. Res. 2013, 2, 85–95. [Google Scholar] [CrossRef]
  5. Fu, G.; Chen, S.; Liu, C.; Shepard, D. Hydro-Climatic Trends of the Yellow River Basin for the Last 50 Years. Clim. Chang. 2004, 65, 149–178. [Google Scholar] [CrossRef] [Green Version]
  6. Li, J.; Zhou, S. Quantifying the contribution of climate- and human-induced runoff decrease in the Luanhe river basin, China. J. Water Clim. Chang. 2015, 7, 430–442. [Google Scholar] [CrossRef]
  7. Zhang, H.; Huang, Q.; Gu, L.; Chen, K.; Yu, Q. Changes in the long-term hydrological regimes and the impacts of human activities in the main Wei River, China. Hydrol. Sci. J. 2016, 61, 1054–1068. [Google Scholar] [CrossRef]
  8. Das, J.; Nanduri, U.V. Assessment and evaluation of potential climate change impact on monsoon flows using machine learning technique over Wainganga River basin, India. Hydrol. Sci. J. 2018, 63, 1020–1046. [Google Scholar] [CrossRef] [Green Version]
  9. Huntington, T.G. Evidence for intensification of the global water cycle: Review and synthesis. J. Hydrol. 2006, 319, 83–95. [Google Scholar] [CrossRef]
  10. Xue, D.; Zhou, J.; Zhao, X.; Liu, C.; Wei, W.; Yang, X.; Li, Q.; Zhao, Y. Impacts of climate change and human activities on runoff change in a typical arid watershed, NW China. Ecol. Indic. 2021, 121, 107013. [Google Scholar] [CrossRef]
  11. Milly, P.C.D.; Dunne, K.A.; Vecchia, A.V. Global pattern of trends in streamflow and water availability in a changing climate. Nat. Cell Biol. 2005, 438, 347–350. [Google Scholar] [CrossRef] [PubMed]
  12. Chawla, I.; Mujumdar, P.P. Isolating the impacts of land use and climate change on streamflow. Hydrol. Earth Syst. Sci. 2015, 19, 3633–3651. [Google Scholar] [CrossRef] [Green Version]
  13. Wu, L.; Zhang, X.; Hao, F.; Wu, Y.; Li, C.; Xu, Y. Evaluating the contributions of climate change and human activities to runoff in typical semi-arid area, China. J. Hydrol. 2020, 590, 125555. [Google Scholar] [CrossRef]
  14. Li, F.; Zhang, G.; Xu, Y.J. Spatiotemporal variability of climate and streamflow in the Songhua River Basin, northeast China. J. Hydrol. 2014, 514, 53–64. [Google Scholar] [CrossRef]
  15. Wang, S.; Wang, Y.; Ran, L.; Su, T. Climatic and anthropogenic impacts on runoff changes in the Songhua River basin over the last 56years (1955–2010), Northeastern China. Catena 2015, 127, 258–269. [Google Scholar] [CrossRef]
  16. Kong, D.; Miao, C.; Wu, J.; Duan, Q. Impact assessment of climate change and human activities on net runoff in the Yellow River Basin from 1951 to 2012. Ecol. Eng. 2016, 91, 566–573. [Google Scholar] [CrossRef]
  17. Zhang, Y.; Guan, D.; Jin, C.; Wang, A.; Wu, J.; Yuan, F. Analysis of impacts of climate variability and human activity on streamflow for a river basin in northeast China. J. Hydrol. 2011, 410, 239–247. [Google Scholar] [CrossRef]
  18. Zhao, Y.; Zou, X.; Gao, J.; Xu, X.; Wang, C.; Tang, D.; Wang, T.; Wu, X. Quantifying the anthropogenic and climatic contri-butions to changes in water discharge and sediment load into the sea: A case study of the Yangtze River, China. Sci. Total Environ. 2015, 536, 803–812. [Google Scholar] [CrossRef] [PubMed]
  19. McVicar, T.R.; Li, L.; Van Niel, T.; Zhang, L.; Li, R.; Yang, Q.; Zhang, X.; Mu, X.; Wen, Z.; Liu, W.; et al. Developing a decision support tool for China’s re-vegetation program: Simulating regional impacts of afforestation on average annual streamflow in the Loess Plateau. For. Ecol. Manag. 2007, 251, 65–81. [Google Scholar] [CrossRef]
  20. Wagner, P.D.; Bhallamudi, S.M.; Narasimhan, B.; Kantakumar, L.N.; Sudheer, K.P.; Kumar, S.; Schneider, K.; Fiener, P. Dynamic integration of land use changes in a hydrologic assessment of a rapidly developing Indian catchmen. Sci. Total Environ. 2016, 539, 153–164. [Google Scholar] [CrossRef] [PubMed]
  21. Yonaba, R.; Biaou, A.C.; Kota, M.; Tazen, F.; Mounirou, L.A.; Zouré, C.O.; Queloz, P.; Karambiri, H.; Yacouba, H. A dynamic land use/land cover input helps in picturing the Sahelian paradox: Assessing variability and attribution of changes in surface runoff in a Sahelian watershed. Sci. Total Environ. 2020, 757, 143792. [Google Scholar] [CrossRef] [PubMed]
  22. Budyko, M.I. Climate and Life; Academic Press: New York, CA, USA, 1974. [Google Scholar]
  23. Sankarasubramanian, A.; Vogel, R.M.; Limbrunner, J.F. Climate elasticity of streamflow in the United States. Water Resour. Res. 2001, 37, 1771–1781. [Google Scholar] [CrossRef]
  24. Fu, G.; Charles, S.P.; Chiew, F.H.S. A two-parameter climate elasticity of streamflow index to assess climate change effects on annual streamflow. Water Resour. Res. 2007, 43, 2578–2584. [Google Scholar] [CrossRef]
  25. Roderick, M.L.; Farquhar, G.D. A simple framework for relating variations inrunoff to variations in climatic conditions and catchment properties. Water Resour. Res. 2011, 47, 667–671. [Google Scholar] [CrossRef]
  26. Choudhury, B. Evaluation of an empirical equation for annual evaporation using field observations and results from a biophysical model. J. Hydrol. 1999, 216, 99–110. [Google Scholar] [CrossRef]
  27. Yang, H.; Yang, D.; Lei, Z.; Sun, F. New analytical derivation of the mean annual water-energy balance equation. Water Resour. Res. 2008, 44, W03410. [Google Scholar] [CrossRef]
  28. Li, H.; Shi, C.; Zhang, Y.; Ning, T.; Sun, P.; Liu, X.; Ma, X.; Liu, W.; Collins, A. Using the Budyko hypothesis for detecting and attributing changes in runoff to climate and vegetation change in the soft sandstone area of the middle Yellow River basin, China. Sci. Total. Environ. 2020, 703, 135588. [Google Scholar] [CrossRef] [PubMed]
  29. Gbohoui, Y.P.; Paturel, J.-E.; Tazen, F.; Mounirou, L.A.; Yonaba, R.; Karambiri, H.; Yacouba, H. Impacts of climate and environmental changes on water resources: A multi-scale study based on Nakanbé nested watersheds in West African Sahel. J. Hydrol. Reg. Stud. 2021, 35, 100828. [Google Scholar] [CrossRef]
  30. Wu, J.; Miao, C.; Wang, Y.; Duan, Q.; Zhang, X. Contribution analysis of the long-term changes in seasonal runoff on the Loess Plateau, China, using eight Budyko-based methods. J. Hydrol. 2017, 545, 263–275. [Google Scholar] [CrossRef]
  31. Wu, J.; Miao, C.; Zhang, X.; Yang, T.; Duan, Q. Detecting the quantitative hydrological response to changes in climate and human activities. Sci. Total. Environ. 2017, 586, 328–337. [Google Scholar] [CrossRef] [PubMed]
  32. Gudmundsson, L.; Greve, P.; Seneviratne, S.I. The sensitivity of water availability to changes in the aridity index and other factors-A probabilistic analysis in the Budyko space. Geophys. Res. Lett. 2016, 43, 6985–6994. [Google Scholar] [CrossRef] [Green Version]
  33. Hasan, E.; Tarhule, A.; Kirstetter, P.-E.; Clark, R.; Hong, Y. Runoff sensitivity to climate change in the Nile River Basin. J. Hydrol. 2018, 561, 312–321. [Google Scholar] [CrossRef]
  34. Zhang, X.; Dong, Q.; Cheng, L.; Xia, J. A Budyko-based framework for quantifying the impacts of aridity index and other factors on annual runoff. J. Hydrol. 2019, 579, 124224. [Google Scholar] [CrossRef]
  35. Sinha, J.; Das, J.; Jha, S.; Goyal, M.K. Analysing model disparity in diagnosing the climatic and human stresses on runoff variability over India. J. Hydrol. 2020, 581, 124407. [Google Scholar] [CrossRef]
  36. Sen, P.K. Estimates of the regression coefficient based on Kendall’s tau. J. Am. Stat. Assoc. 1968, 63, 1379–1389. [Google Scholar] [CrossRef]
  37. Pettitt, A.N. A non-parametric approach to the change-point problem. Appl. Stat. 1979, 28, 126–135. [Google Scholar] [CrossRef]
  38. Fu, B. On the calculation of the evaporation from land surface (in Chinese). Sci. Atmos. Sin. 1981, 1, 23–31. [Google Scholar]
  39. Zhang, L.; Dawes, W.R.; Walker, G.R. Response of mean annual evapotranspiration to vegetation changes at catchment scale. Water Resour. Res. 2001, 37, 701–708. [Google Scholar] [CrossRef]
  40. Wang, D.B.; Tang, Y. A one-parameter Budyko model for water balance captures emergent behavior in Darwinian hy-drologic models. Geophys. Res. Lett. 2014, 41, 4569–4577. [Google Scholar] [CrossRef] [Green Version]
  41. Cao, X.L. Impact of Climate Change on Eco Hydrological Process of the Second Songhua River Basin. Ph.D. Thesis, Dalian University of Technology, Dalian, China, 2017. [Google Scholar]
  42. Dey, P.; Mishra, A. Separating the impacts of climate change and human activities on streamflow: A review of methodologies and critical assumptions. J. Hydrol. 2017, 548, 278–290. [Google Scholar] [CrossRef]
Figure 1. River networks and hydrological stations in the Changbai Mountain area (CMA).
Water 13 03473 g001
Figure 2. Results of Sen’s slope estimator for partitions of the Changbai Mountain area. (a,b) show the trend and significance of the runoff, (c,d) show the trend of the precipitation and the potential evapotranspiration.
Water 13 03473 g002
Figure 3. Distribution of the mean annual evaporation ratio ( E T a / P ) vs. the mean annual dryness index ( E T 0 / P ) in a Budyko framework. Fengman (FM), Quanhe (QH), Huanggou (HG), Gaolichengzi (GLCZ), Hanyangtun (HYT), Kaishantun (KST), and Changbai (CB) hydrological stations.
Water 13 03473 g003
Figure 4. Results of the Pettitt mutation point test in partitions of the Changbai Mountain area. (a) Fengman, (b) Gaolichengzi, (c) Hanyangtun, (d) Quanhe, (e) Kaishantun, (f) Huanggou, and (g) Changbai hydrological stations.
Water 13 03473 g004
Figure 5. Relationship between the elasticity of runoff and the dryness index under different parameter values of n . (a,b) Second Songhua River Basin, (c,d) Tumen River Basin, (e,f) Yalu River Basin. Fengman (FM), Quanhe (QH), Huanggou (HG), Gaolichengzi (GLCZ), Hanyangtun (HYT), Kaishantun (KST), and Changbai (CB) hydrological stations.
Water 13 03473 g005
Table 1. Overview of datasets used in this study.
DatasetsType of DataSpatial ResolutionTemporal ResolutionPeriodSource
Meteorological
observations
P, T, WS, SSD, VP, RHPoint data (10
stations)
Daily1960–2016National Meteorological Information Center of the China Meteorological Administration
Surface runoff
observations
RPoint data (7
stations)
Yearly1960–2016Water Resources Commission of the Ministry of Water Resources
Equation recommendedET0Point data (10
stations)
Daily1960–2016Estimated according to the Penman–Monteith equation
Table 2. Basic hydroclimatic characteristics of the Changbai Mountain area.
BasinStationAreas (km2)P (mm a−1)ET0 (mm a−1)R (mm a−1)ET0/PR/Pn
SSRB 1Fengman42,500723.57816.24311.851.130.421.11
Gaolichengzi4728779.67828.04504.641.060.660.65
Hanyangtun8532654.64796.57369.901.220.560.77
TRB 2Quanhe31,800558.13834.65209.011.500.371.07
Kaishantun11,062595.52811.22145.211.360.241.67
YRB 3Huanggou55,420881.68797.02417.060.900.471.18
Changbai2211648.88767.13462.831.180.720.52
1 SSRB = Second Songhua River Basin; 2 TRB = Tumen River Basin; 3 YRB = Yalu River Basin.
Table 3. Hydroclimatic characteristics of the base and impact periods.
BasinStationData PeriodLong-Term Mean ValueElasticity
P
(mm)
E T 0  
(mm)
R
(mm)
E T 0 / P n ε P ε E T 0 ε n
SSRBFengman1960–1975684.34816.44328.531.190.941.52−0.52−0.81
1976–2016738.88816.16305.341.111.191.72−0.72−0.86
Gaolichengzi1960–1975714.01838.63566.431.180.421.13−0.13−0.41
1976–2016805.29823.91480.521.020.7581.35−0.35−0.61
Hanyangtun1960–1975617.44772.03393.171.250.621.29−0.29−0.63
1976–2016669.16806.14360.811.210.801.42−0.42−0.75
TRBQuanhe1960–1975527.32827.39253.091.570.811.48−0.48−0.94
1976–2016570.16837.49191.811.471.191.83−0.83−1.15
Kaishantun1960–1975585.33795.00224.301.361.111.70−0.70−1.00
1976–2016599.49817.55114.351.362.022.63−1.63−1.42
YRBHuanggou1960–1975864.53807.36502.050.930.831.39−0.39−0.58
1976–2016888.37792.99383.890.891.371.80−0.80−0.66
Changbai1960–1975691.15737.57494.241.070.531.20−0.20−0.49
1976–2016632.39778.67450.571.230.511.20−0.20−0.52
Table 4. Attribution analysis for the Changbai Mountain area.
BasinStationChange from Base Period to Infact PeriodInduced Runoff Change
(mm)
Contribution to Runoff Change (%)
Δ R Δ P Δ E T 0 Δ n Δ R P Δ R E T 0 Δ R n μ p μ E T 0 μ c   μ n  
SSRBFengman−23.1954.54−0.270.2537.980.06−57.4339.80.139.960.2
Gaolichengzi−85.9191.29−14.710.3474.872.4−152.7532.61.033.666.4
Hanyangtun−32.3651.7234.110.1839.65−5.65−62.8736.75.241.958.1
TRBQuanhe−61.2842.8410.10.3926.6−1.66−79.3924.71.626.373.7
Kaishantun−109.9514.1622.550.917.45−4.68−96.736.94.311.288.9
YRBHuanggou−118.1623.84−14.370.5417.934.44−124.3912.23.015.284.8
Changbai−43.67−58.7641.1−0.02−49.97−4.7711.3575.67.282.817.2
Publisher’s Note: MDPI stays neutral with regard to jurisdictional claims in published maps and institutional affiliations.

