Article

Runoff Characteristics and Soil Loss Mechanism in the Weathered Granite Area under Simulated Rainfall

1
Institute of Soil and Water and Environmental Sciences, College of Environment and Resource Sciences, Zhejiang University, Hangzhou 310058, China
2
Zhejiang Provincial Key Laboratory of Agricultural Resources and Environment, Hangzhou 310058, China
3
Agricultural Experiment Station of Zhejiang University, Hangzhou 310058, China
*
Author to whom correspondence should be addressed.
Water 2021, 13(23), 3453; https://doi.org/10.3390/w13233453
Submission received: 20 October 2021 / Revised: 2 December 2021 / Accepted: 2 December 2021 / Published: 5 December 2021
(This article belongs to the Special Issue Modelling of Soil Conservation, Soil Erosion and Sediment Transport)

Abstract

:
Soils developed from the parent materials of highly weathered granite are particularly susceptible to soil erosion. Therefore, it is of great significance to conduct in-depth research on runoff characteristics and soil loss mechanisms in weathered granite areas. Using the weathered granite area in the hilly region of southeastern China as the research object, we conducted indoor artificial rainfall simulation experiments involving three slope steepnesses (SSs), 8°, 15°, and 25°, and five rainfall intensities (RIs), 0.5, 1.0, 1.5, 2.0, and 2.5 mm/min. The results showed that sediment load (SL) has positively linear relationships with mean runoff velocity (V), Reynolds number (Re), Froude number (Fr), shear stress (τ), and stream power (w). The eroded sediment was principally composed of silt and clay that accounted for 65.41–73.41% of the total SL. There was a boundary point at 0.02 mm for the particle size distribution (PSD) of the eroded sediment. The enrichment ratio (Er) of sand-grained particles (0.02–2 mm) ranged from approximately 0.45 to 0.65, while the Er of fine-grained particles (<0.02 mm) ranged from approximately 1.37 to 1.80. These results increase our understanding of the relationships among RI, SS, runoff, and soil losses from weathered granite hillslopes, particularly the relationships between different hydraulic parameters and sediment size characteristics.

1. Introduction

Soil erosion is one of the most important global environmental problems [1,2]; however, the sensitive weathered granite regions of southeastern China are particularly vulnerable [3,4]. Determining the mechanism of soil loss still remains a challenge due to the physical complexity of the erosion process [5]. The nature of eroded sediment, such as its size and density, has a great impact on the process of sediment yield [6]. Severe soil erosion not only reduces the productivity of the land but also causes pollution in aquatic environments [7,8]. The sediment caused by water erosion can act as a carrier of soil-bound nutrients and contaminants that are unevenly distributed in the sediment surface because of the varying surface areas [9,10,11,12]. The characterization of eroded sediment particle size distribution (PSD) is important for understanding erosion estimation and modeling [13,14]. Therefore, prerequisite knowledge about sediment sorting and dynamics is of great significance for studying the transportation of different kinds of nutrients and contaminants from sloping farmlands to aquatic environments [15,16].
Soil erosion involves the detachment of original soil materials by rainfall runoff and the subsequent transportation and deposition of the activated mobile particles [17]. The process of soil erosion is influenced by various factors including rainfall characteristics [18,19,20], topographic conditions [21,22], soil properties [23,24,25], farming methods [8,26], and vegetation cover [27,28], among which rainfall intensity (RI) and slope steepness (SS) have been widely studied and are still the focus of research [29,30,31]. For example, Sobol et al. [32] investigated the effects of rainfall intensity and slope steepness on the development of soil erosion in the southern Cis-Ural region, finding that soil loss linearly depended on these two factors, and that the clay content was higher in eroded material than in the original soils. Dai et al. [33] conducted field runoff plot-monitoring tests to reveal the plot-scale characteristics of surface soil erosion in the karst rocky desertification regions. They found that rainfall intensity had significant effects on runoff depth and soil loss rates, and slope steepness had a greater effect on soil loss than slope length. Guo et al. [34] investigated the combined impacts of rainfall and surface runoff on soil erosion, finally identifying the relationships between soil erosion and different hydraulic parameters. The effects of sample collection time intervals and rain peak morphology on the analysis results of runoff yield and soil erosion have also been studied [1,35,36].
The mechanism of soil erosion has been extensively studied over recent years around the world with different methods, including experimental monitoring and model simulation [37,38,39,40]. The current models of erosion forecasting can generally be divided into two categories: the physical model and the empirical model [13,41]. For example, a structural equation modeling method was employed by [42] to study the interactive effects of precipitation and vegetation on soil erosion. Kiani-Harchegani, Sadeghi, Singh, Asadi, and Abedi [29] found that partial eta-squared is an effective novel technique for improving the interpretation of complex hydrological processes and erosion evolution. Chen et al. [43] employed a meta-analysis of field plot data to identify the effects of soil–water conservation measures on the mitigation of land degradation. In addition, significant efforts have been made to investigate the process of soil erosion in different condition scales [44,45], particularly to explore the erosion mechanisms concerning the different hydraulic parameters on the sloping farmland. The hydraulic characteristics of runoff depth (h), mean runoff velocity (V), Reynolds number (Re), Froude number (Fr), hydraulic shear stress (τ), and stream power (w) have been applied to evaluate soil erosion in prediction models [34,46,47]. It has been commonly reported that sediment yield presents good linear relationships with τ, w, V, Re, and Fr [48,49].
However, the current studies about soil erosion in China mainly focus on slopes with loess, red and purple soils [9,43,50] and relatively little information is available regarding the slopes of weathered granite in SE China. The soils developed from the parent materials of highly weathered granite are notably susceptible to soil erosion [51]. The high intensity, frequency, and centralized distribution of rainstorms caused by fluent typhoons easily cause soil erosion and ultimately affect the sustainability of local socioeconomic development [52]. Authors recently attempted to explore the loss mechanisms of runoff, soil, and nutrients from weathered granite slopes with different underlying layers [51,53]. Research about the relationships between different hydraulic parameters and sediment size characteristics has not yet been conducted and the erosion mechanism is not well understood. Therefore, it is of great significance to conduct in-depth research to study the runoff characteristics and soil loss mechanisms in weathered granite areas. The objectives of this study are (1) to quantitatively highlight the characteristics of runoff and sediment yields from the weathered granite slopes, and (2) to identify the relationships between different hydraulic parameters and sediment size characteristics.

2. Materials and Methods

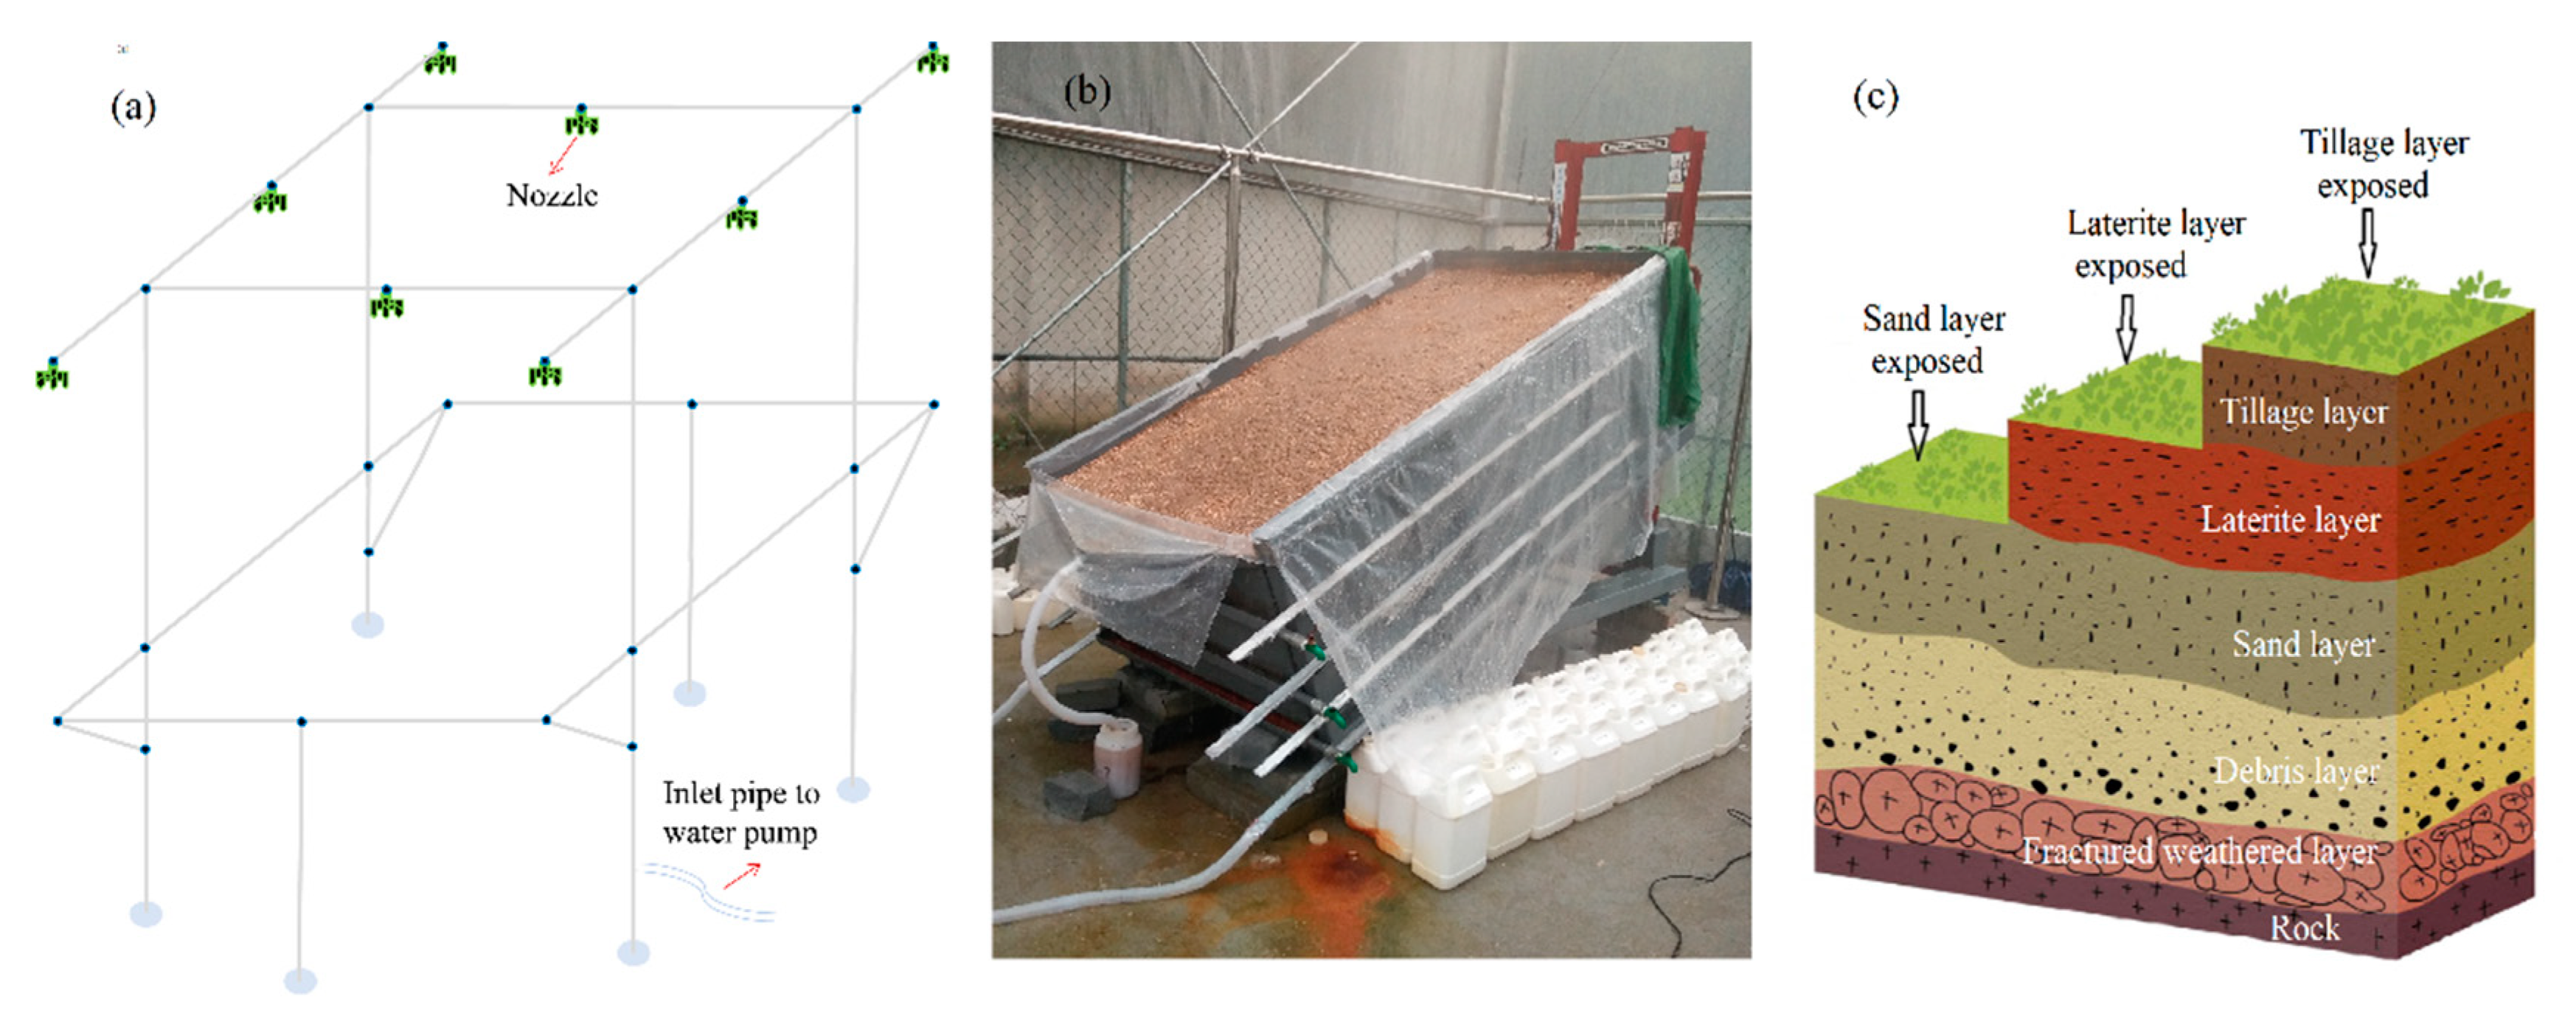
2.1. Experimental Equipment

The rainfall experiments were completed at the Research Center for Agricultural Non-point Source Pollution and Soil Erosion Control of Zhejiang University (Changxing County, China) from September to December 2018. The equipment used included the rainfall simulator (Figure 1a) as well as runoff flumes (Figure 1b). The portable QYJY-502 rainfall simulator (Qingyuan Xi’an Measurement and Control Technology Co., Ltd., Long Island City, NY, USA) could be adjusted precisely to any expected RI between 0.25 and 3.33 mm/min by combining different kinds of nozzles and water pressures. The nozzles were uniformly placed above the runoff flumes at a height of 6 m with a rainfall coverage of 4 × 4 m, and 20 rainfall-calibrating gauges were placed around the runoff flumes. Before starting each rainfall test, the runoff plots were covered with waterproof cloth. Data of the rainfall calibrating gauges were verified for the Christiansen’s uniformity coefficient of rainfall, which were all above 85% and considerably acceptable. Then, the tests started after the waterproof cloths were taken away.

2.2. Materials

The experimental soil was taken from the weathered granite hillslopes in Anji County (30°34′ N, 119°23′ E) of northwestern Zhejiang Province, a mid-subtropical monsoon region characterized by abundant rainfall and a mild climate [54]. Torrential precipitation, caused by frequent typhoons, and slopes with an SS higher than 25° are dominant in the study area, with an SS of 8° considered a key threshold for soil erosion according to local data. In this area, soil thickness reduces due to the topsoil removal caused by severe hydraulic damage, exposing different underlying soil horizons (Figure 1c). Based on the parent material horizons and the outcrop of the different soil layers, soils from the tillage layer with slight water erosion were chosen as the simulated rainfall study objects to further explore the runoff characteristics and soil loss mechanisms of SE China’s hilly region. Another reason why soils from the tillage layer were chosen was that the surface runoff on the slopes of sand and laterite layers was too thin to measure the runoff velocity. With a pH of 5.72, the experimental soils are weakly acidic and classed as clay loam, composed of 56.36% sand, 22.02% silt, and 21.62% clay. The bulk density is 1.65 g/cm3 with a mean weight diameter (MWD) of 0.31 mm. The contents of soil organic matter, total nitrogen and total phosphorus are, respectively, 2.65, 0.74, and 1.90 g/kg.

2.3. Experimental Design and Measurements

Field soil was collected at 5 cm intervals from the top to downward layers and the physico-chemical properties were analyzed in an indoor laboratory. The test methods and results of the basic physical and chemical properties of the three soil layers can be found in published research papers [54]. All the measurements were conducted in triplicate. Then, runoff flumes were filled with original soil with the corresponding layers based on the original state method of removal, maintaining a consistent bulk density. The experimental soils were set aside for some time to naturally settle before the rainfall experiments. Three SSs, 8°, 15°, and 25°, and five RIs, 0.5, 1.0, 1.5, 2.0, and 2.5 mm/min, were adopted according to the data from the local meteorological station to simulate the corresponding hydrological and terrain conditions. Two runoff flumes were simultaneously used for the experimental research replications. The 5 cm topsoil layer was disturbed by rainfall splashes and the test soil was replaced with original soil after each rainfall test.
The time of rainfall initiation was recorded using stopwatches and the rainfall lasted 90 min after surface runoff occurred for convenient runoff and sediment collection. The runoff sediment samples were collected from the top “V-shape” outlet at every 3 min and the runoff volumes (Rv) were measured using the volume method. The amounts of eroded sediment were measured using the dry weighing method and then the sediment was further analyzed using the pipette method to determine the PSD, MWD, and enrichment ratio (Er) of different particles. The velocity of surface runoff was measured by the dye-racing method after the rainfall runoff became relatively stable. The time taken for the dye tracer to travel a given distance along the slopes was recorded with stopwatches, which was conducted in triplicate to get the average values for determining the measured runoff velocity (V0).

2.4. Data Calculation and Analysis

V0 was determined as the travelling distance per unit time and was then used to estimate the mean runoff velocity (V) via the following formula:
V = k V 0
where V0 is the measured runoff velocity, m/s; V is the mean runoff velocity, m/s; k is a coefficient equal to 0.67 as the runoff is laminar flow. h was calculated via the following formula:
h = Q V B t
where h is the runoff depth, m; Q is the accumulative Rv during sampling time t (s), m3; B is the width of water-crossing section, m. Re and Fr were determined to reflect the flow regime and were calculated as follows:
R e = V h v
F r = V g h
where v is the kinematic viscosity, m2/s; g is the gravitational acceleration, m/s2. τ was calculated via the following formula:
τ = ρ g h J
where τ is the shear stress, N/m2; ρ is the mass density of the runoff-sediment mixture assuming the sediment volume to be negligible, g/L; J is the friction slope, m/m. w was calculated via the following formula:
w = τ V
where w is the stream power, N/m/s. The runoff rate (Rr), sediment rate (Sr), sediment concentration (Sc), Er and MWD of the eroded sediment were determined according to the methods reported in the previous studies [6,10,53].
I = R V R I T S c o s S S
where I is the runoff coefficient; T is the time of runoff, min; Rv is runoff volume, L; RI is rainfall intensity, mm/min; SS is slope steepness, °; S is runoff tank area, m2.
The figures were drawn using Origin 9.0, and statistical analysis was performed using Microsoft Excel 2016, SPSS 20.0 and CANOCO 5.0. The correlation tests and multiple regression analyses between Rv, SL and SS, RI and the hydraulic parameters were finally conducted to determine their relationships. A redundancy analysis (RDA) was employed to determine the relationships between sediment size characteristics and different hydraulic parameters by analyzing the Er and MWD of the eroded sediment.

3. Results and Discussion

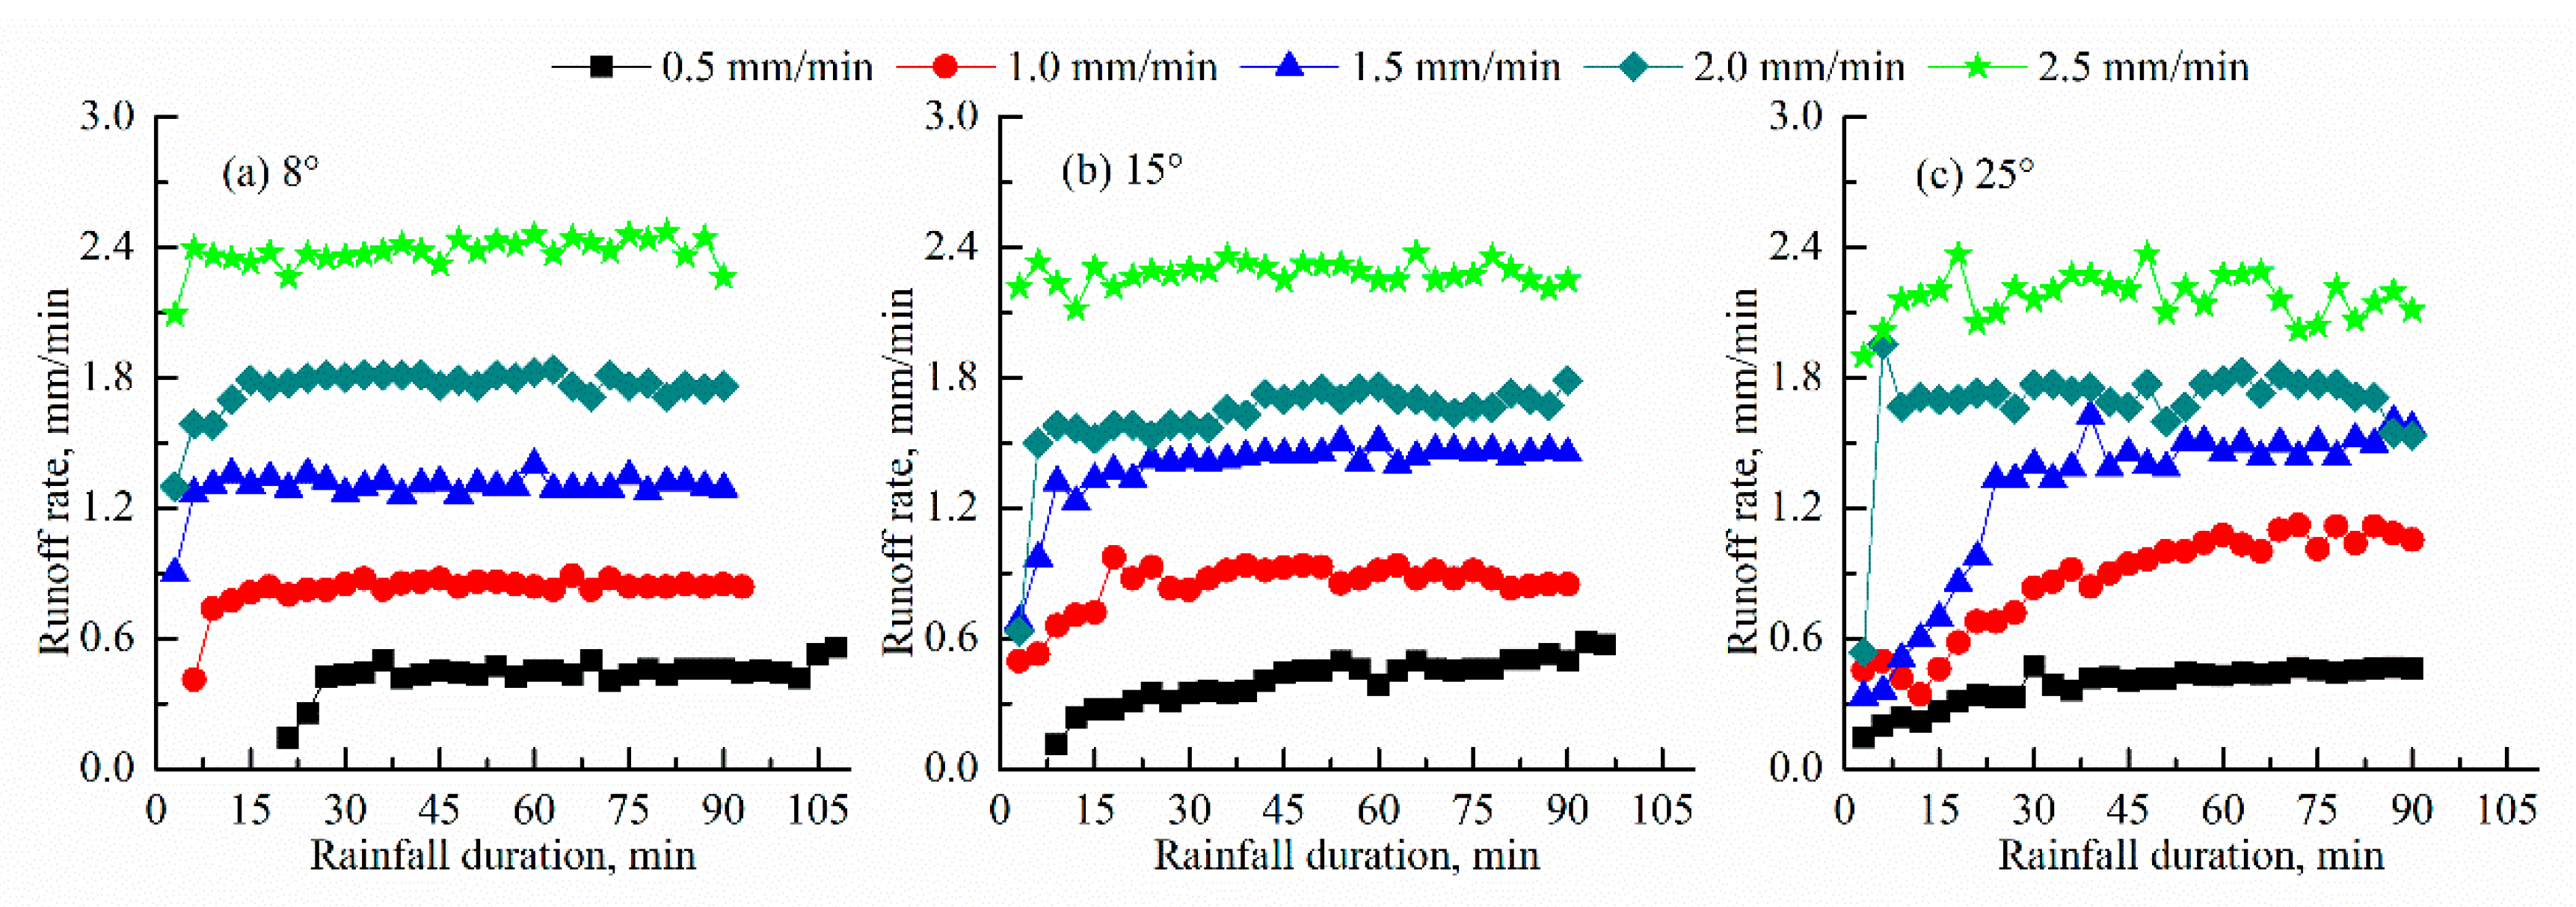
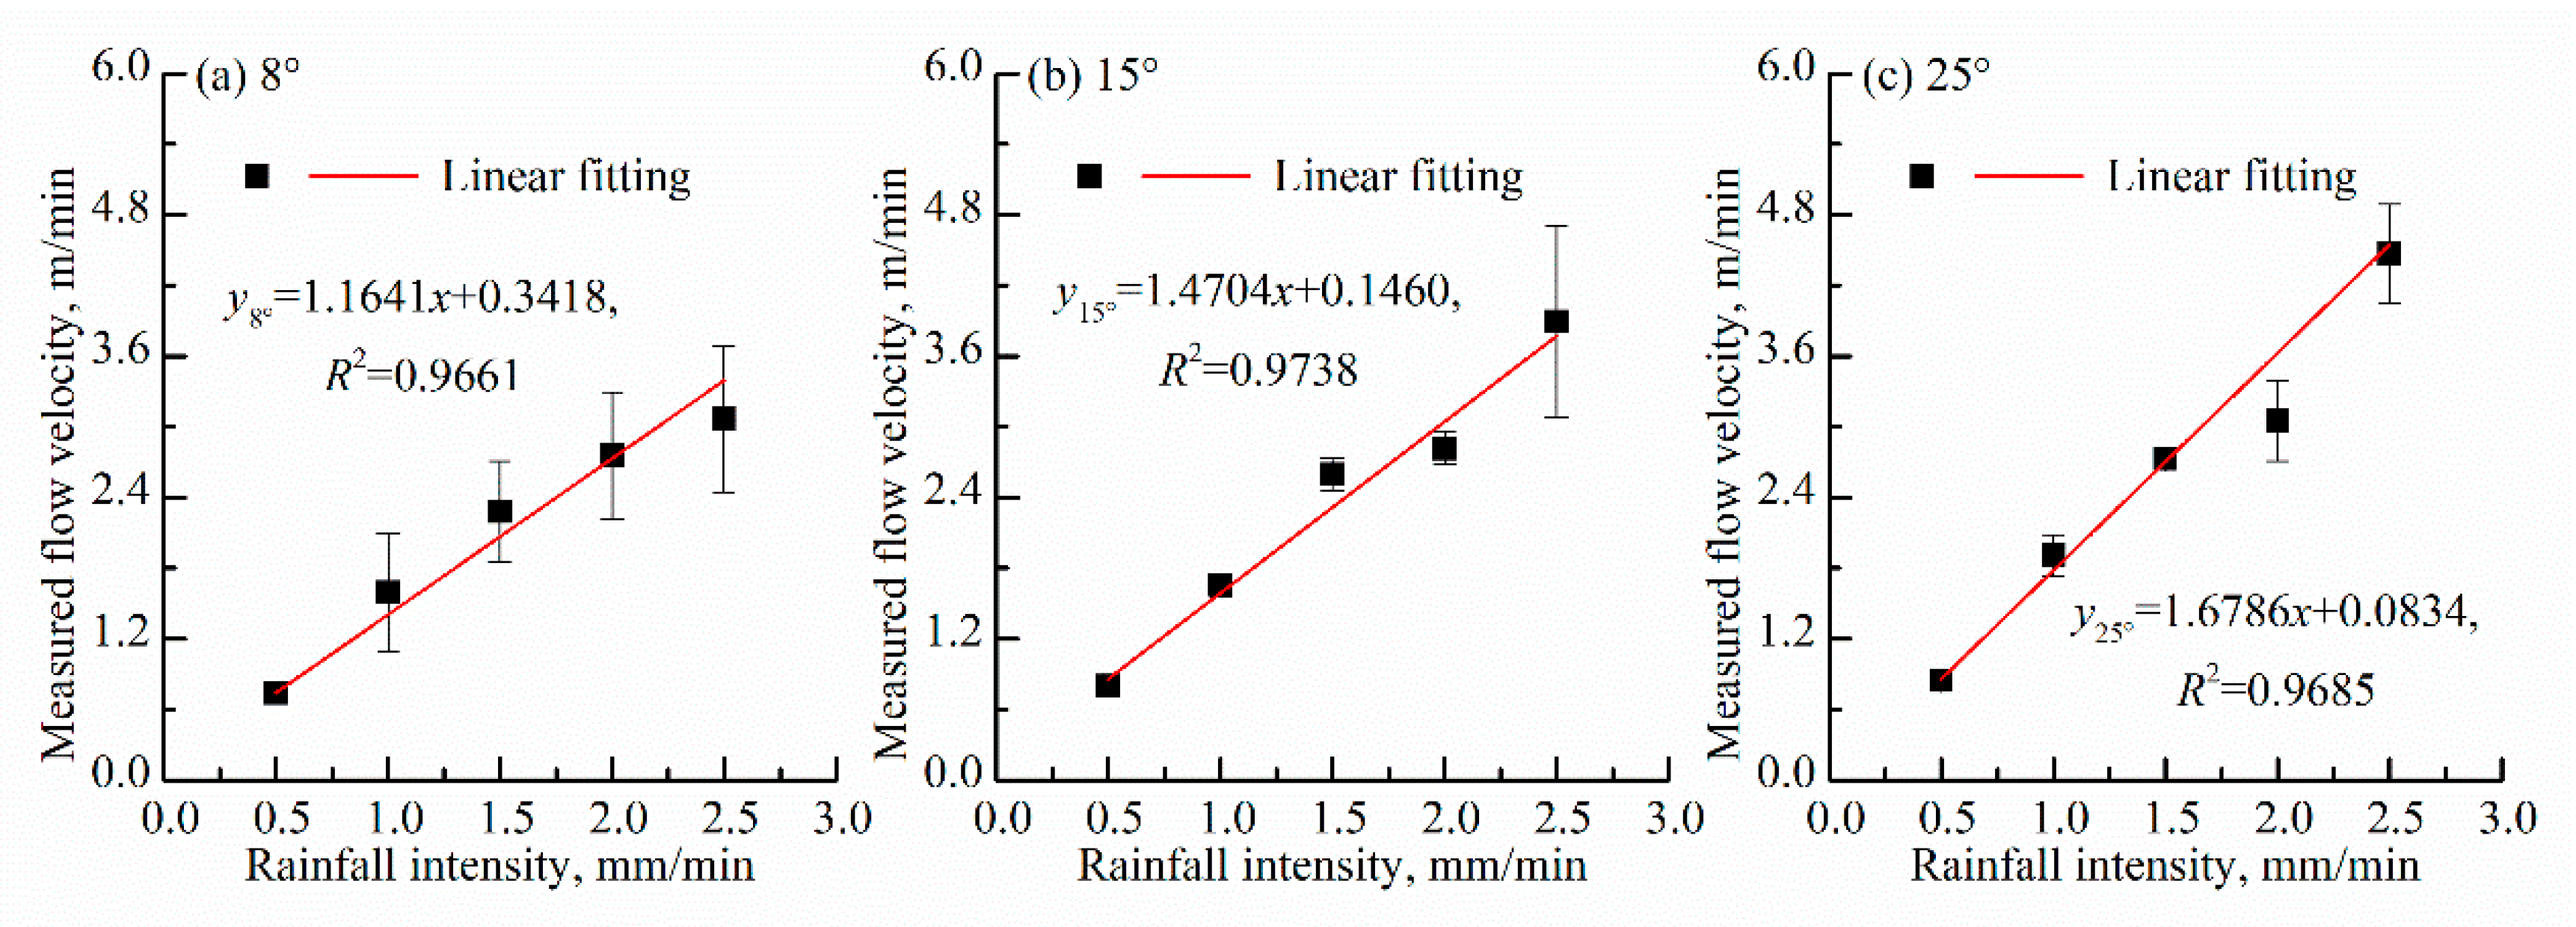
3.1. Characteristics of Runoff Generation

Table 1 shows that the values of T0 are negatively correlated to RI and SS. T0 on the slopes with an SS of 25°, 15°, and 8° decreased 83.15%, 88.86%, and 93.89%, respectively, as RI increased from 0.5 to 2.5 mm/min. The dropping ratios of T0 under the uniform RI were, respectively, 85.61%, 63.00%, 61.27%, 64.55%, and 60.29% when SS was increased from 8° to 25°. RI presents a much greater correlation to T0 compared to SS. It has been reported that the process of runoff generation is affected by multiple factors such as the soil properties, the underlying surface, and topographic and rainfall characteristics [8,27,37]. As for the rainfall characteristics, the intensity and duration of every rainfall event are the most important factors affecting runoff generation [55,56]. T0 significantly decreased as slope steepness increased (SS), most likely due to the pre-saturation process of the experimental soil. The soil was saturated and the soil pores were full of infiltrated water at the initial stage. Surface runoff originates when the infiltration rate is less than the rainfall intensity (Hortonian flow). This decrease in infiltration happens when the soil begins to become saturated. The experimental soil contained very little organic matter and was weakly aggregated with poor stability. The surface roughness caused the rainfall runoff to infiltrate the soil more easily; the infiltration rate is related to the rate of water supply [57]. The runoff pattern transformed into saturation excess after the experimental soil was entirely saturated with the prolonged rainfall duration. Additionally, the experimental soil was more likely to be saturated in heavy rainfall, and the runoff velocity became faster on the steeper slopes, with an accelerated horizontal component of gravity, thereby shortening T0 [58,59].
Rr first increased with rainfall duration and then reached a relatively stable dynamic state until the end of the rainfall (Figure 2). As the rainfall duration reduced to a stable state, the RI increased and the SS decreased with a range around 3–45 min. There is a clear positive correlation between Rr and RI, while Rr tended to be negatively correlated with SS under the uniform RI. The accumulative Rv had a positive correlation with increasing RI (R2 > 0.99) and decreased as the SS increased because of the declining rainfall-bearing area (Table 1), similar to the trends of Rr. Rr increased with the increasing RI in the uncovered runoff flumes as a consequence of the increased water supply per unit of time of heavier rainfalls [34]. Rain splash will cause the soil surface structure to be gradually compacted, and then form a crust on the soil surface, which is conducive to the generation of runoff [60]. The runoff coefficient (I) is significantly positively correlated with RI, but not significantly correlated with SS. This shows the positive impact of RI on runoff. The size and velocity of raindrops were larger under heavier rainfalls, making it more likely that soil aggregates are broken down into smaller parts; this can cause pore clogging and soil sealing [61]. The formation of crust reduced surface roughness and limited the soil infiltration rate after the soil structure was broken by the beating action of the raindrops, resulting in greater runoff generation and a higher Rr [62]. There are two crust modes on the soil surface: the physically structural crust and the depositional crust [63]. The structural crust forms first and is caused by raindrop impacts and then the depositional crust occurs due to the formations of puddles and surface runoff [64]. Crusts on the soil surface are an important symbol of soil spoilage by rainfall runoff. Raindrop impacts the soil’s physical properties, and soil losses have been found to gradually decrease with the increasing RI. This occurs because raindrops with a low Ri have lower levels of kinetic energy [5].
Generally, V0 tended to increase with the increasing SS (Figure 3) and displayed linear correlations with RI (R2 > 0.96). The hydraulic parameters under different experimental conditions are depicted in Table 2. V ranges from 0.83 × 10⁻² to 4.99 × 10⁻² m/s and h ranges from 1.35 to 2.31 mm. The trends of increasing h and V caused by eliminating the raindrops’ impact are similar to the results of An et al. [65], while Beuselinck et al. [66] found that raindrop impact slows down V. In agreement with these findings, Lu, Zheng, Li, Bian, and An [61] reported that raindrop impact increases with increasing RI among 0.53 and 1.67 mm/min, which results in heavy soil compaction and crust followed by low soil infiltration and more runoff generation. With regard to Re, the values generally increased with the increasing RI, varying from 12.70 to 72.76, indicating that the surface runoff is a type of laminar tranquil flow according to the criterion of open channel flow, because all the values are less than 500. Fr also increased with the increasing RI, ranging from 0.06 to 0.42, indicating that the surface runoff belongs to slow flow as all the values are smaller than the critical threshold of 1. The values of τ show trends that increased with the increasing RI from 0.47 × 10⁻² to 10.83 × 10⁻² N/m. In the case of w, the values increased with both increasing RI and SS with a range of 0.04 × 10⁻⁴ to 5.29 × 10⁻⁴ N/m/s, and the values are far lower than the results of Guo, Ma, Cai, and Wu [34] and Sajjadi and Mahmoodabadi [49] due to the difference in soil types and the experimental setup.

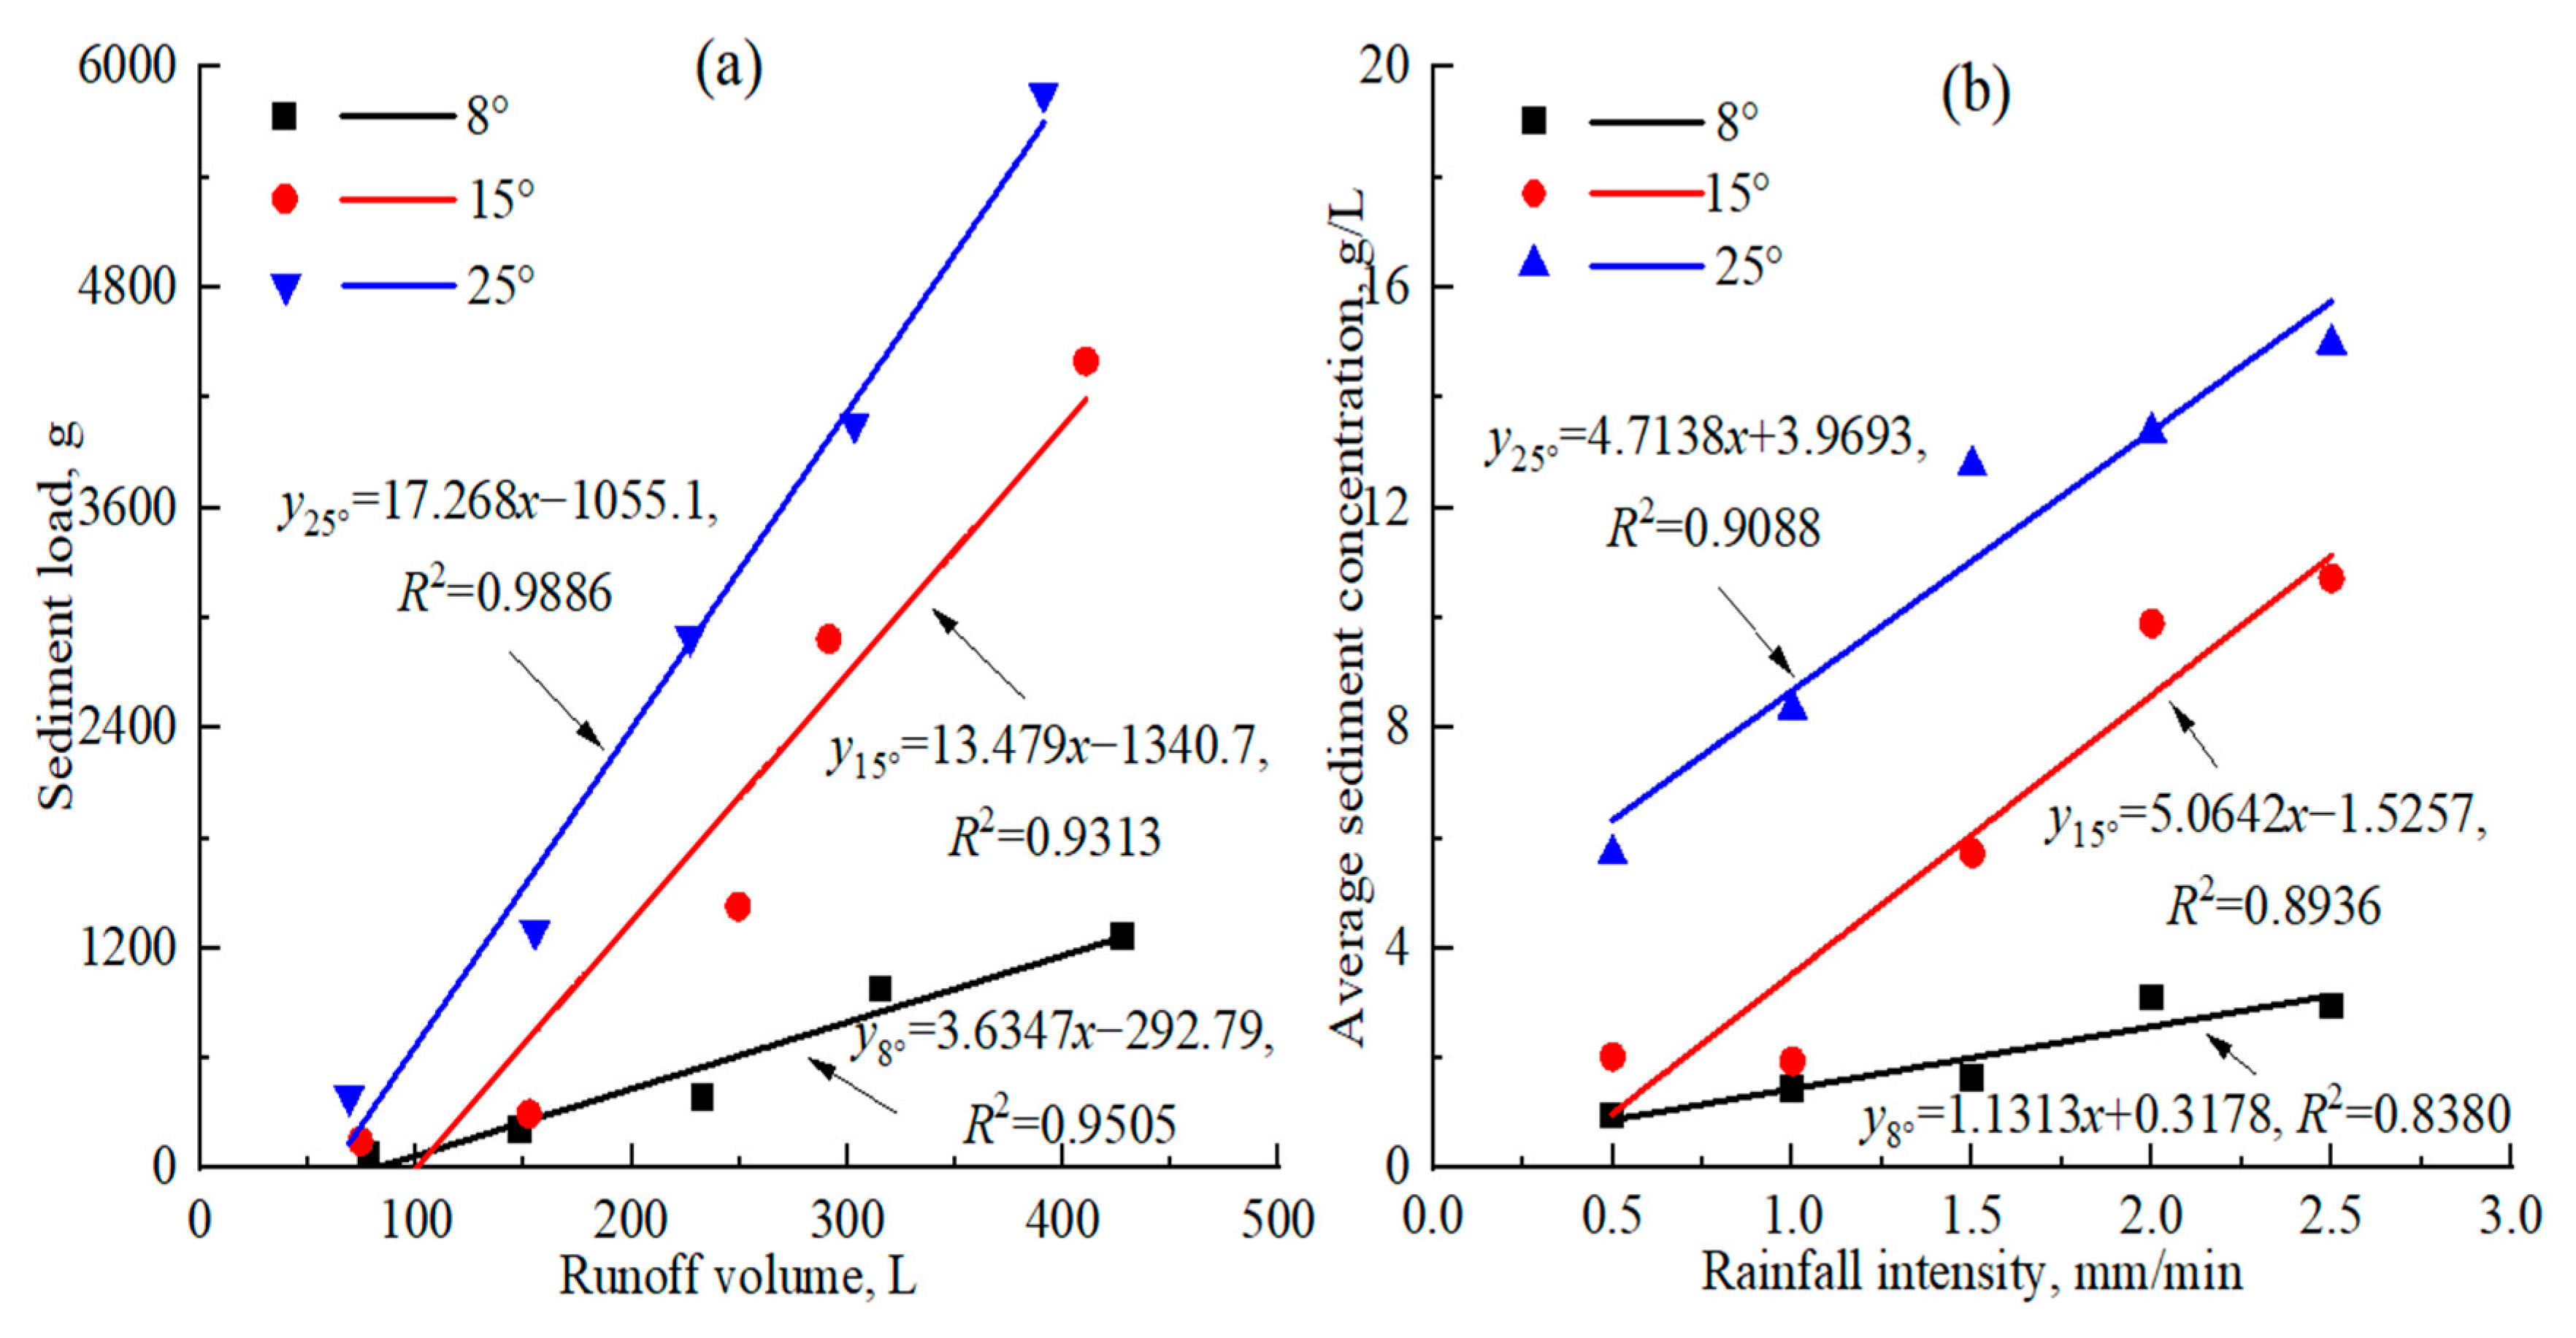
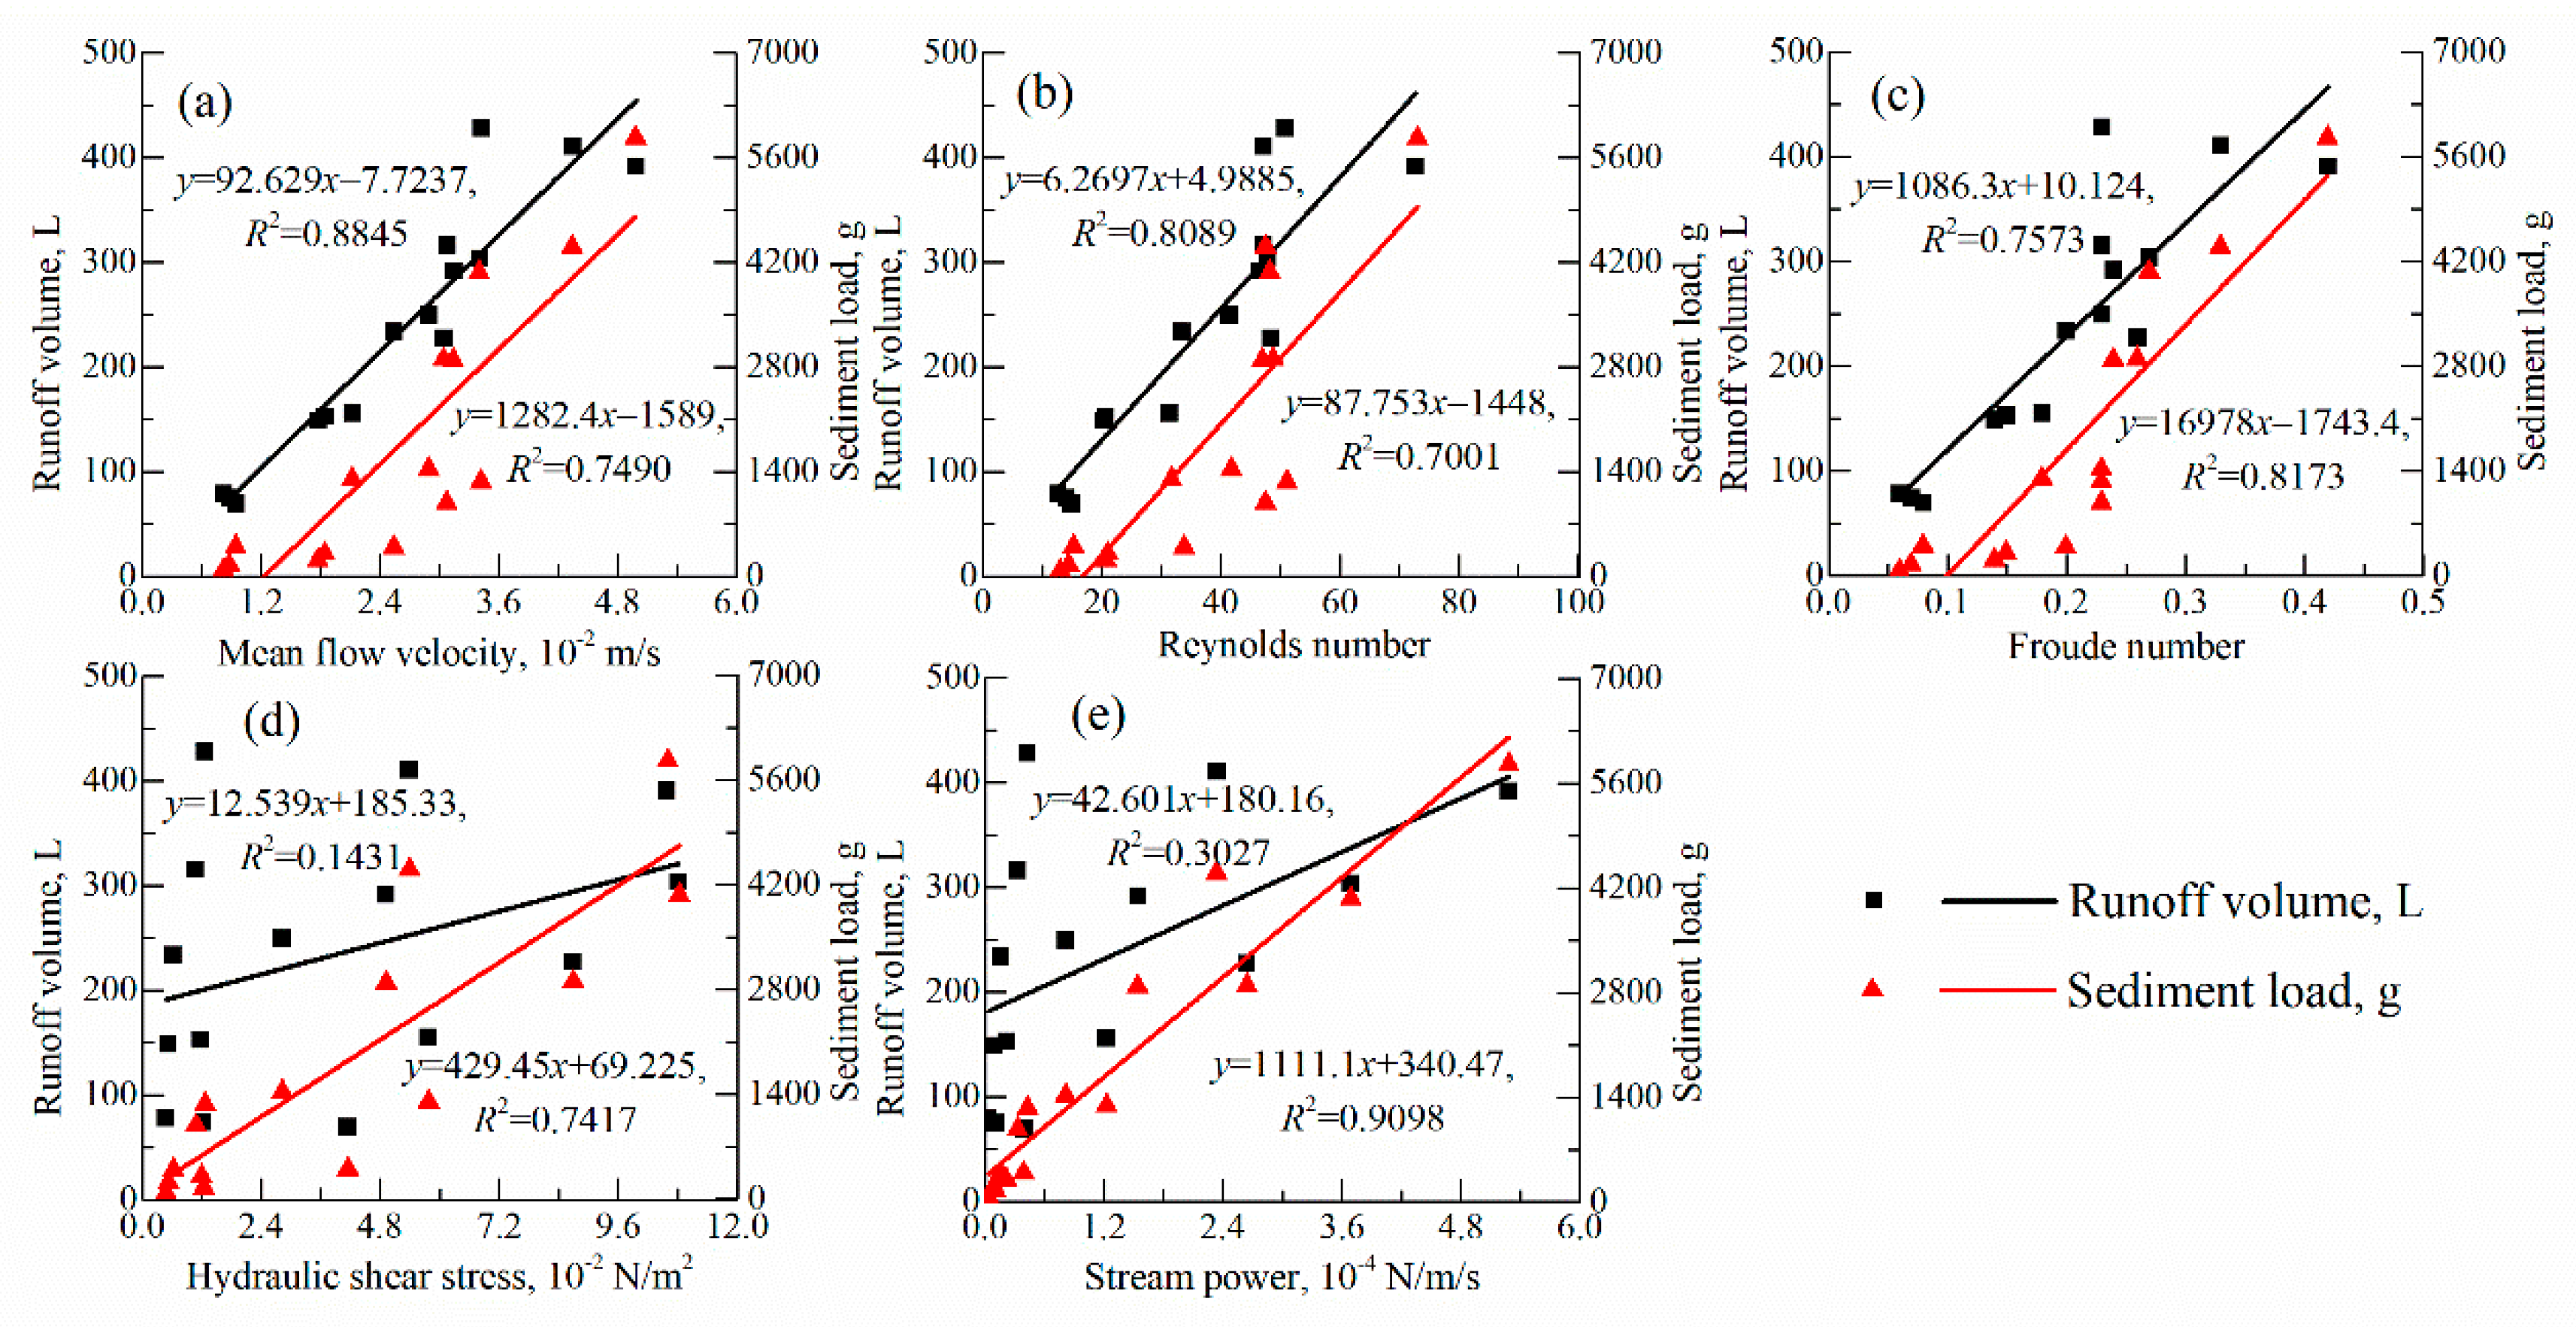
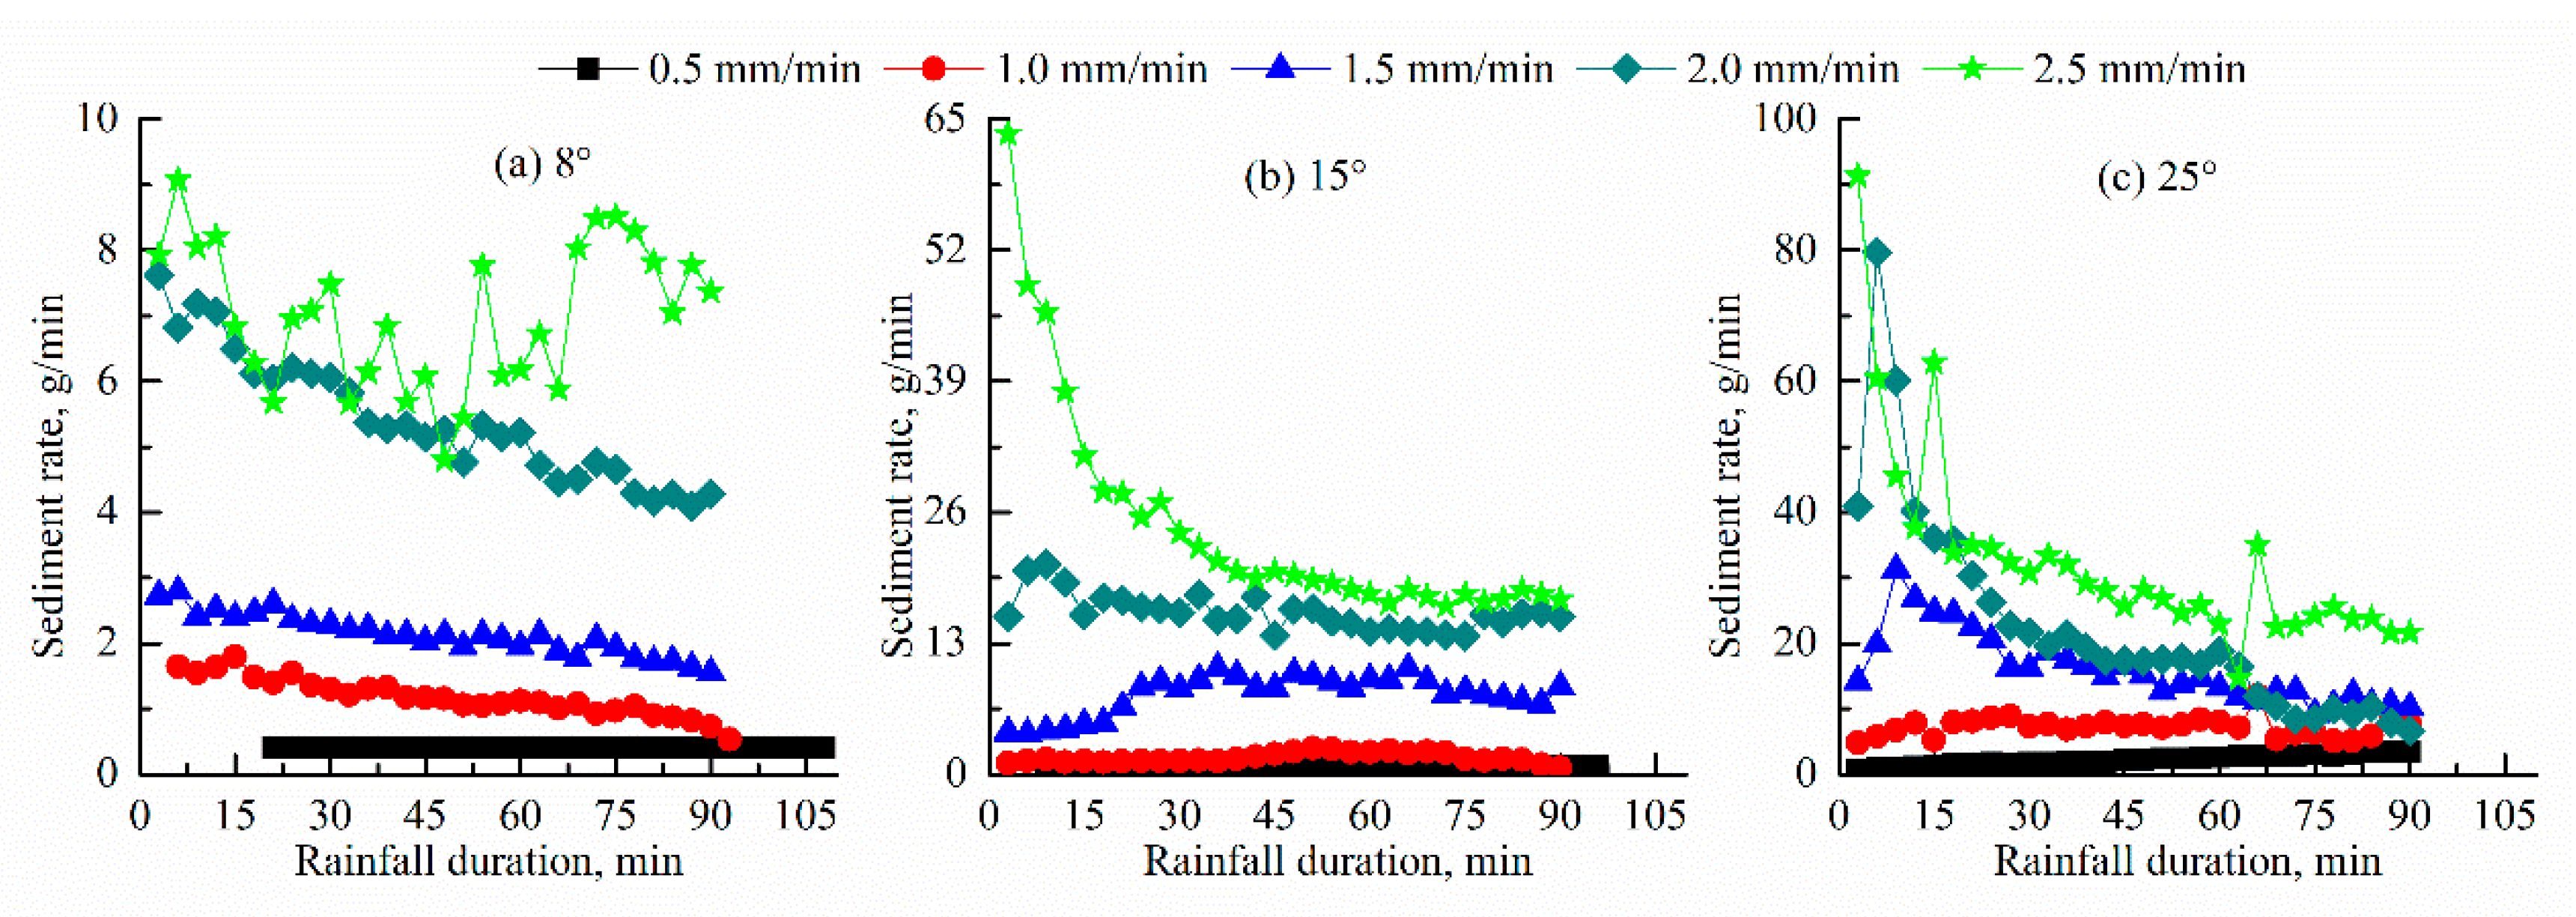
3.2. Characteristics of Sediment Yield

The trends of Sr changing with rainfall duration under different experimental conditions are depicted in Figure 4. Sr increased sharply at the initial stage and then displayed a rapid decreasing trend with the prolongation of rainfall duration with some minor fluctuations under most of the rainfall occurrences, which is mainly due to the first flushing effect [4]. There was strong splashing erosion in the runoff flumes during the initial pre-saturation stage of the experimental soil before the generation of surface runoff. Surface runoff gradually formed with the prolongation of rainfall duration and migrated to the bottom outlet, transporting the mobile particles that have been activated in the earlier stage. The soil erosion induced by rainfall commonly consists of the rill and interrill components according to the source of the eroded sediment [9,67]. The pattern of soil erosion in this study belongs to interrill erosion due to the relatively short slope length (2.0 m) of the experimental runoff flumes [2]; there was almost no rill erosion. Interrill erosion is more likely to transport fine sediment, because the coarse sediment is hard to activate and transport down the slopes. Surface runoff has been reported to be a key factor in controlling soil erosion on hillslopes due to its ability to detach and transport soil materials [68]. There are two erosion mechanisms: raindrop splashes and runoff washes [69]. Soil aggregates in the topsoil are destroyed by raindrop kinetic energy and then the fine-grained particles are peeled off and carried away [70]. The soil aggregates can be disrupted by quick wetting and mechanical breakdown due to raindrop hammering [71]. The strong disruption of soil materials and fast formation of crusts on the surface are related to the increasing RI. Sr has a positive correlation to RI, and the average Sc is positively interrelated to both RI and SS (Table 1). The accumulative SL also positively correlates with the increasing RI and SS, with a range of 74.50–5857.25 g. The increasing times of total SL on the slopes with SS of 8°, 15°, and 25° were, respectively, 15.93, 28.17, and 13.85 when RI increased from 0.5 to 2.5 mm/min (Table 1). Figure 5 shows that the sediment yield is positively linearly related to total the Rv on various slopes (R2 > 0.93). The average Sc also positively correlates with RI (R2 > 0.83) and the order of the average Sc under different slopes is 25° > 15° > 8° when RI is uniform, indicating that the increasing sediment rate is faster than that of runoff generation. These results are similar to the findings of Tuset et al. [72], who found that the fluctuations of suspended Sc are strongly correlated to runoff magnitude and the amounts of eroded sediment correlate to Rv. The average Sc increased about 2.10, 4.26, and 1.62 times, respectively, for the slopes with SS of 8°, 15°, and 25° when RI increased from 0.5 to 2.5 mm/min. The erosion form changed from a transporting limitation to a detaching limitation when RI increased, to some extent because of the soil’s inherent susceptibility to form seals [67].
Both total Rv and SL present positively linear relationships with V, Re, Fr, τ, and w (Figure 6). However, the linear fitting effects between τ, w, and total Rv are not very high. Specifically, the correlations between total Rv and V (R2 = 0.88), Re (R2 = 0.81) are better than that between total SL and V (R2 = 0.75), Re (R2 = 0.70). On the contrary, correlations between total SL and Fr (R2 = 0.82), τ (R2 = 0.74), w (R2 = 0.91) are better than between total Rv and Fr (R2 = 0.76), τ (R2 = 0.14), w (R2 = 0.30). These results indicate that these hydraulic parameters are good indicators of total SL. The soil particles are more easily transported by runoff with stronger τ and w and faster V under heavier rainfalls. Field simulation experiments by Tian et al. [73] stated that the most sensitive hydrodynamic parameters to SL are τ and w. Sajjadi and Mahmoodabadi [49] concluded that V is a better parameter to use when predicting Sc than w and τ. In this study, Re is the most highly correlated parameter with total SL, which is, in some respects, consistent with the findings of Guo, Ma, Cai, and Wu [34]. Taking the comprehensive effects of RI, SS, and surface runoff hydraulics on the erosion process into consideration, a multiple regression analysis was conducted to determine the relationships between SL and RI, SS, V, h, Re, Fr, τ, and w. The relationships can be expressed by the following formula:
S L = 75.16 S S 200.84 R I + 66,600.38 V 4488.87 h 22.39 R e 72925.42 F r + 86.4 + 1017.71 w + 7762.50 , R 2 = 0.959 ,     ρ < 0.01 ,    n = 15
where SL is the sediment load, g; SS is the slope steepness, m/m; RI is the rainfall intensity, mm/min; V is the runoff velocity, 10−2 m/s; h is the runoff depth, mm; Re is the Reynolds number; Fr is the Frounde number; τ is the hydraulic shear stress, 10−2 N/m2; w is the stream power, N/m/s; n is the number of the samples. Equation (8) shows that the relationships can be described by a linear equation with a determination coefficient (R2) larger than 0.96.

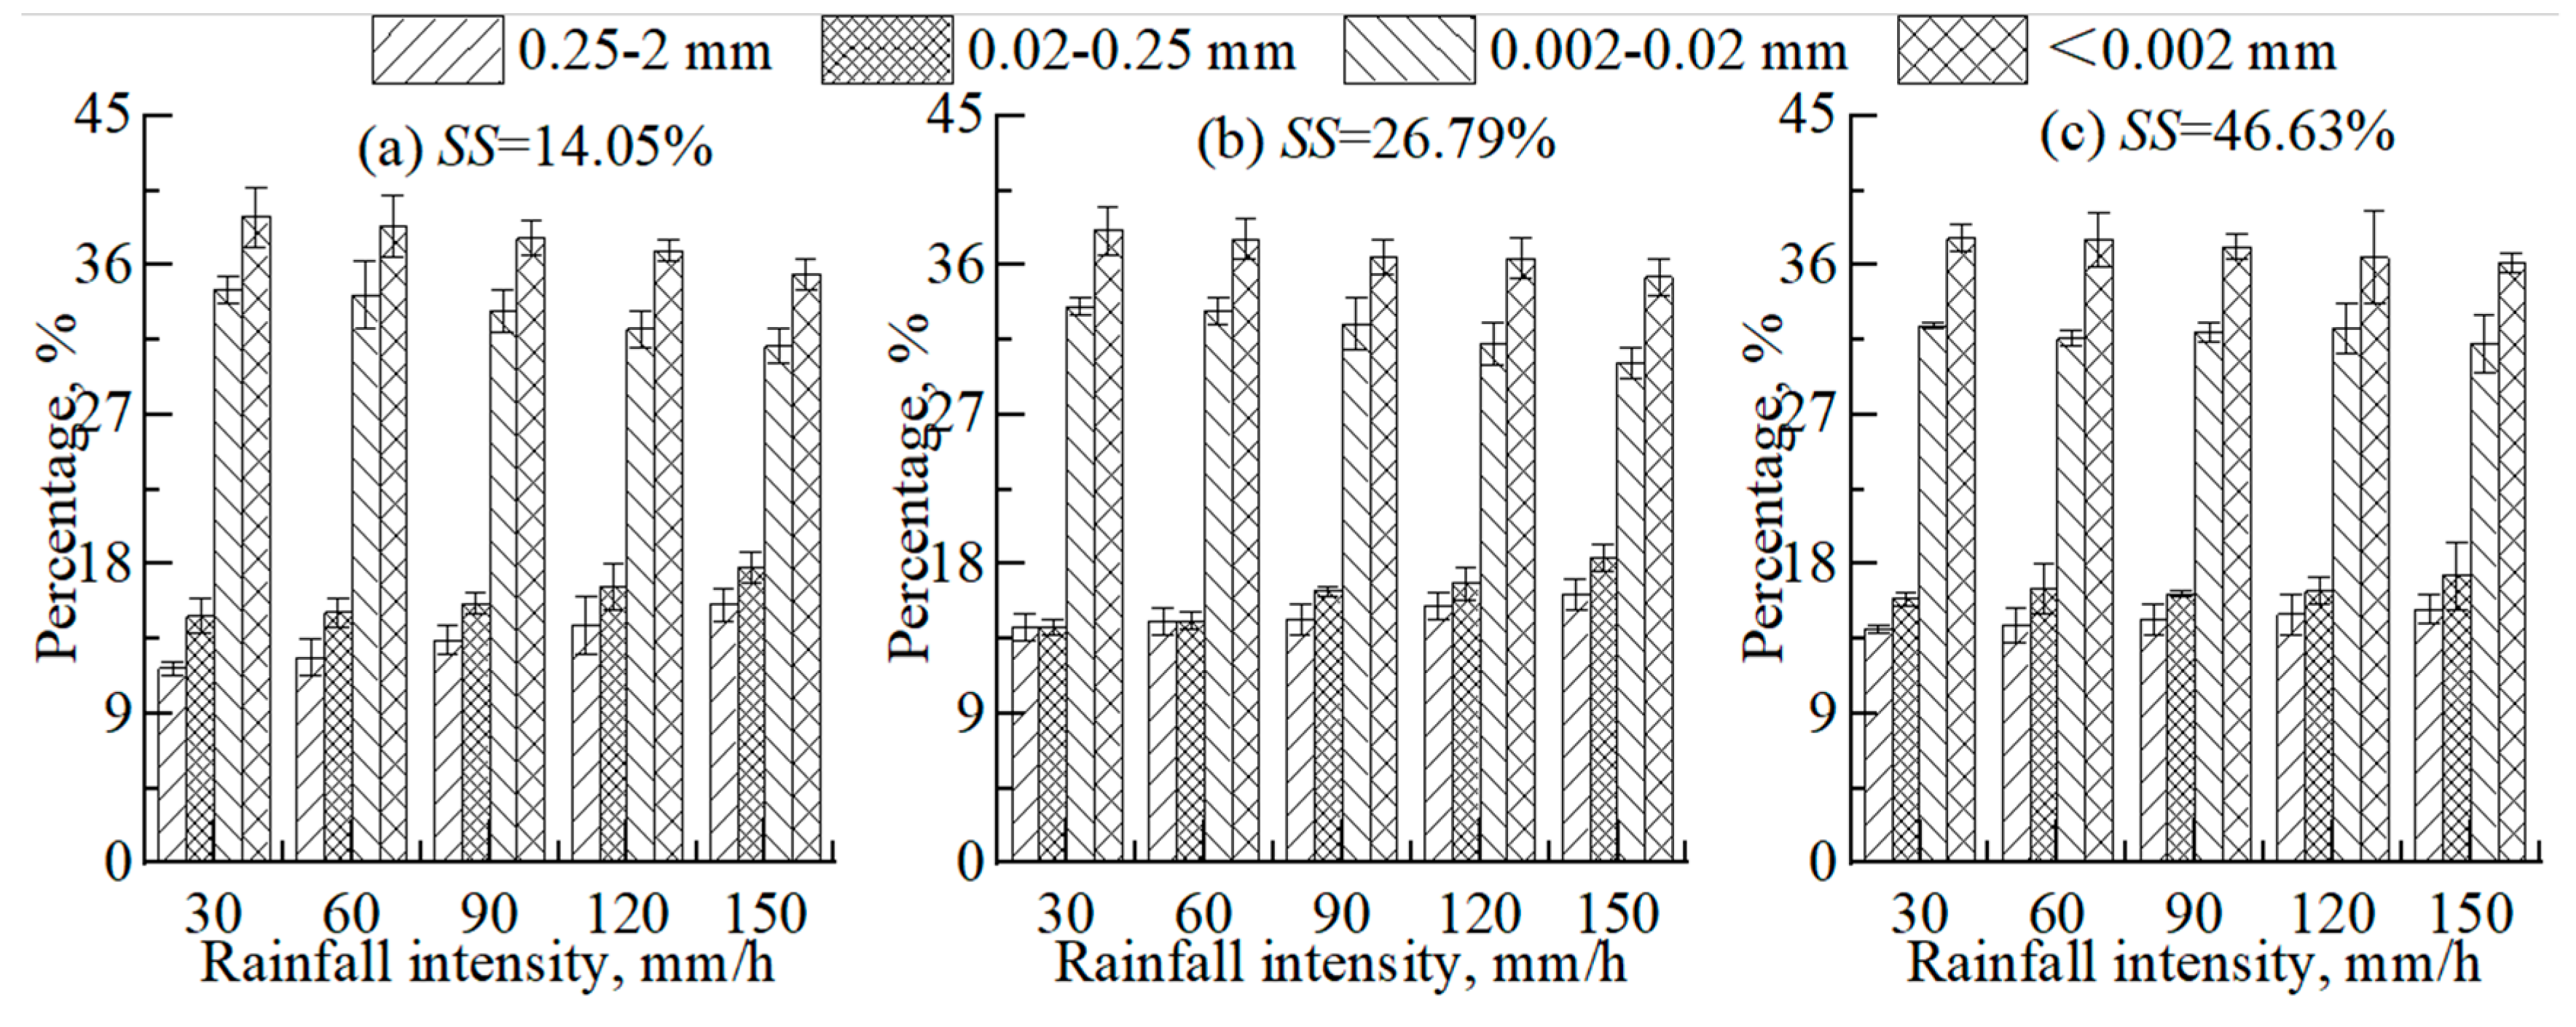
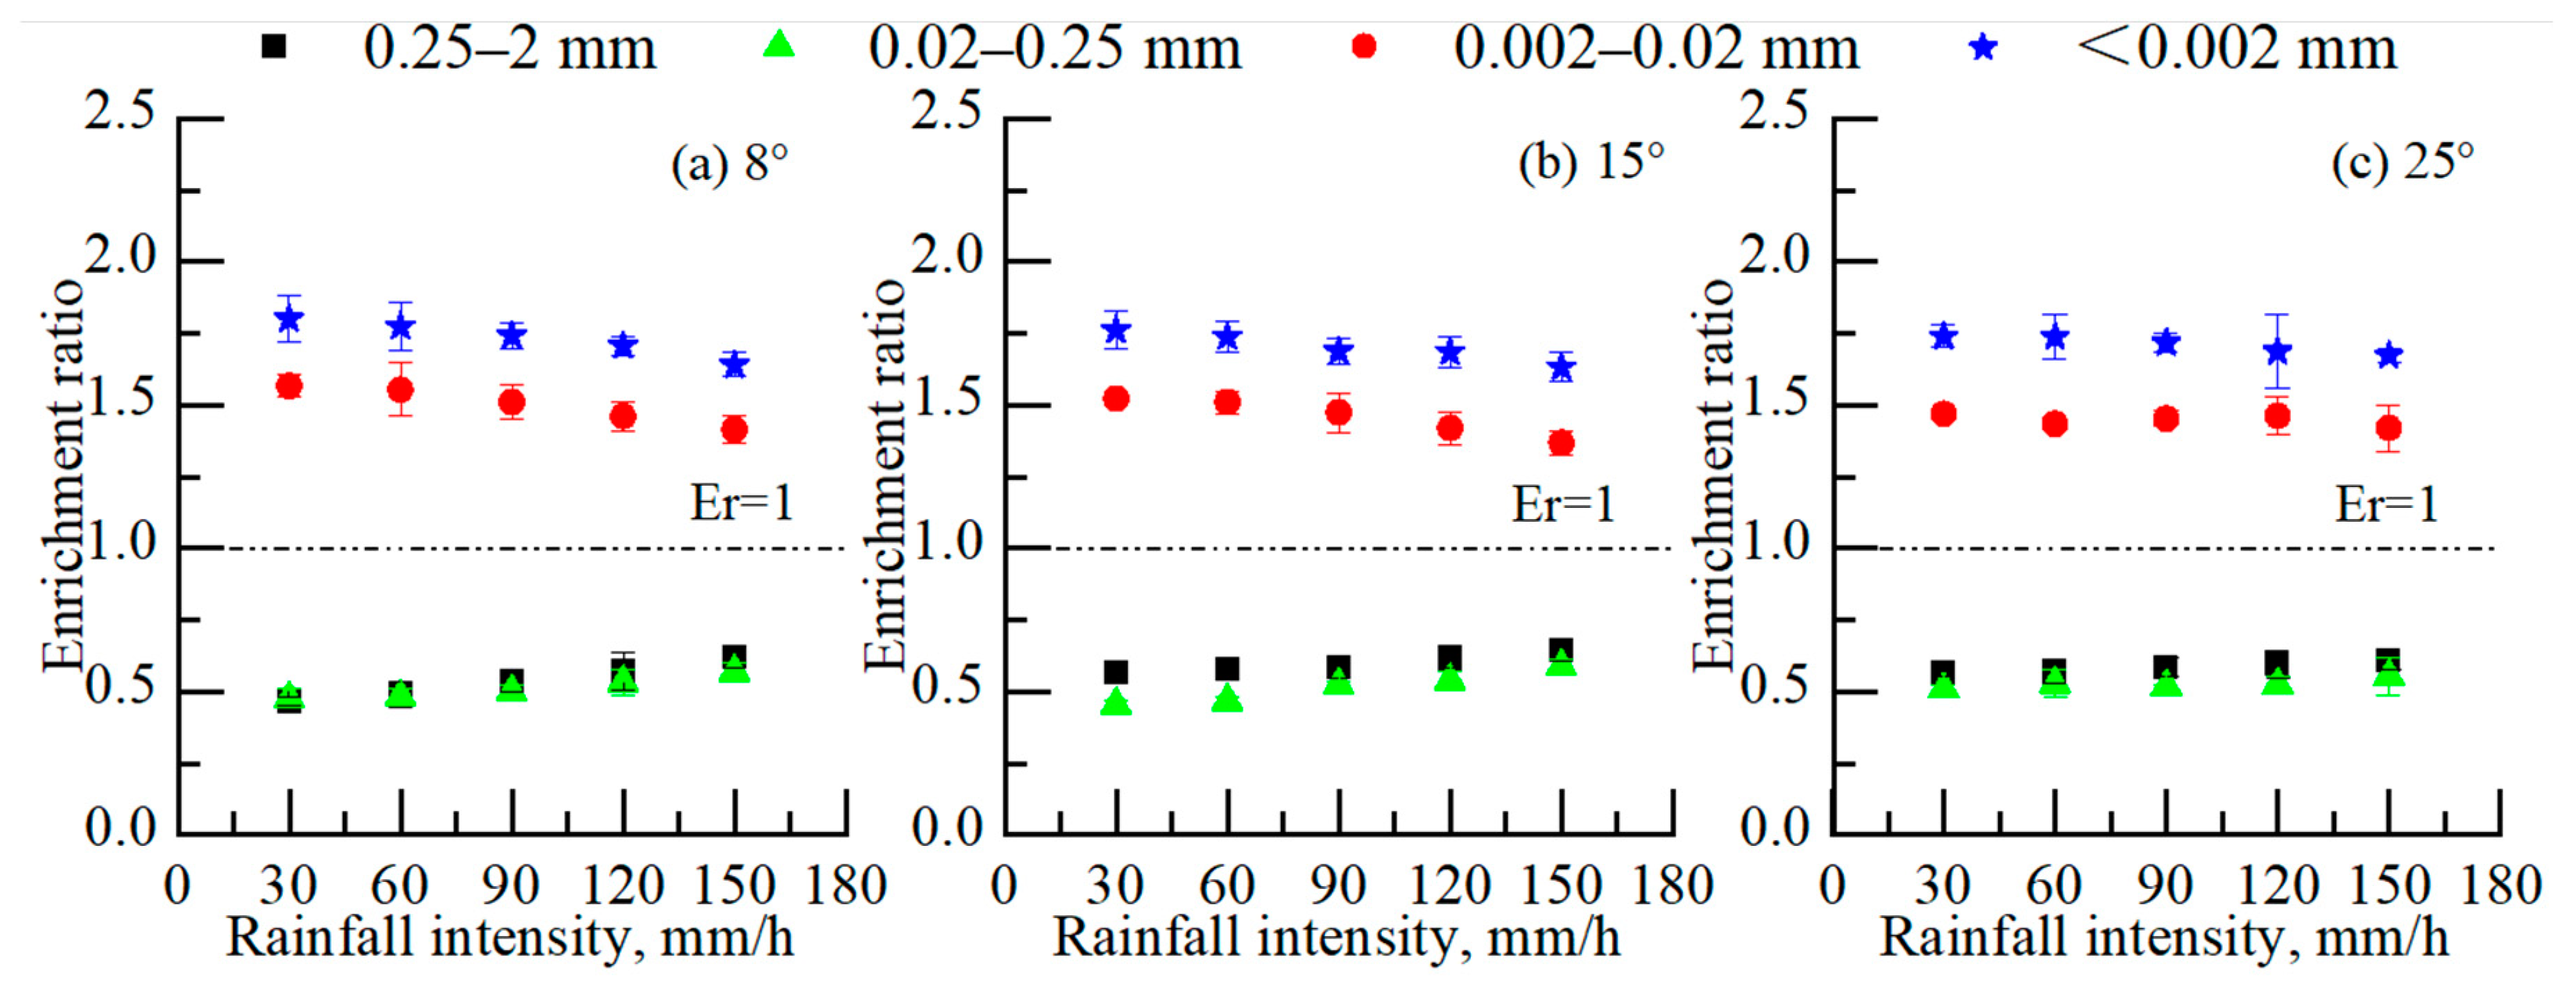
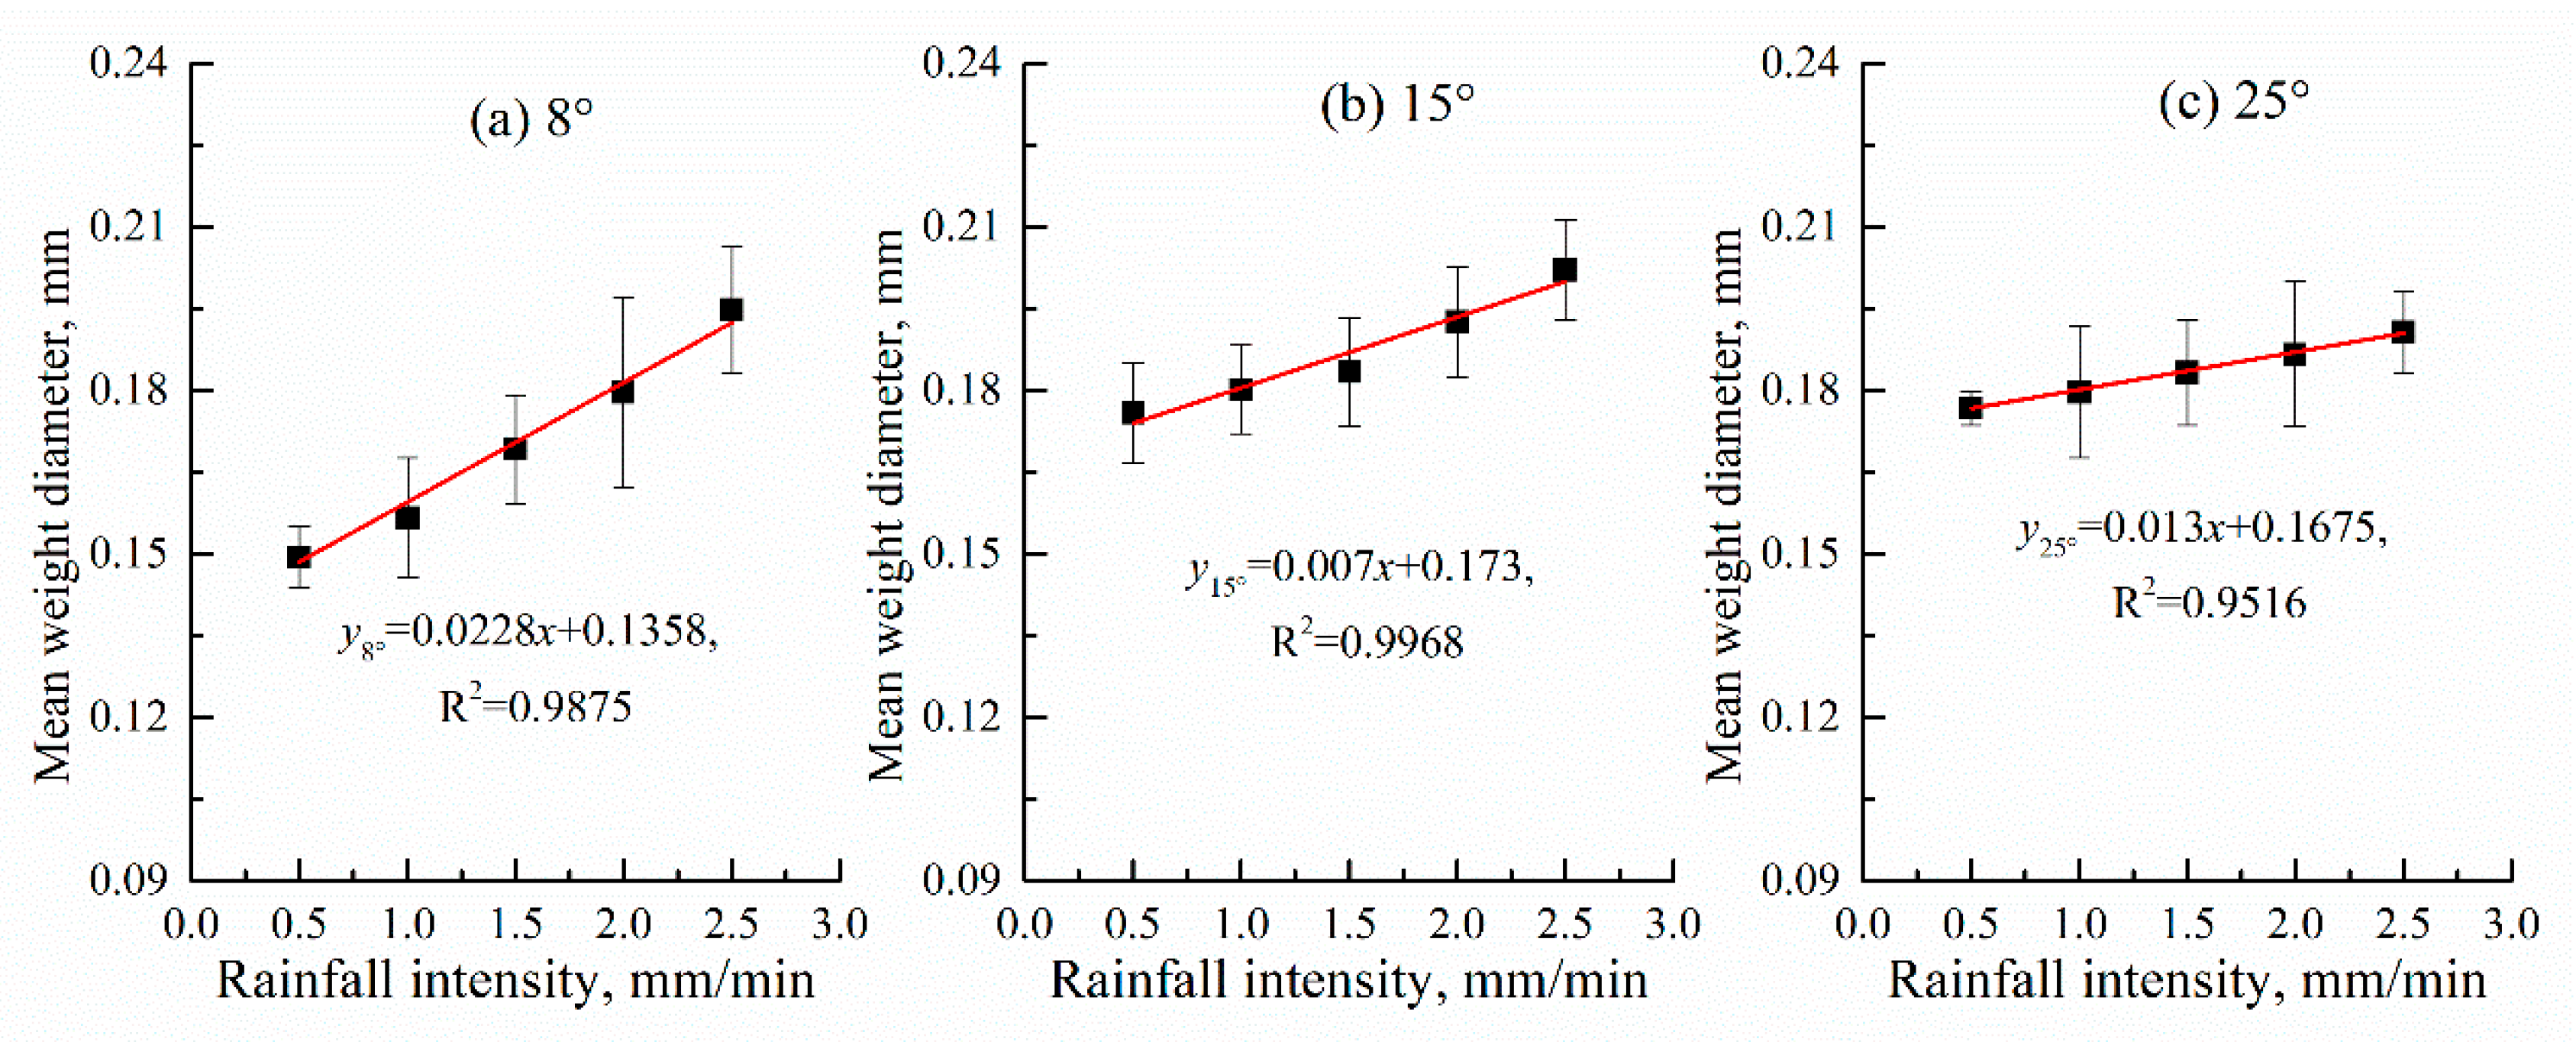
3.3. Characteristics of Sediment Size

The PSD of eroded sediment is affected by many factors including soil properties, such as texture and clay content [23]; soil nature, e.g., soil aggregates, moisture, and particle size [17]; the rainfall nature, e.g., intensity and duration [60]; and runoff types, e.g., shallow flow and rill flow [27]. The soil texture has been reported to be one of the most predominant factors affecting the PSD of eroded sediment [24,74]. The temporal and spatial variability of eroded sediment PSD depends on the main factors impacting the erosion process. A better understanding of the process of sediment transportation and the characteristics of size selectivity can increase our understanding of the functions and interactions of these different factors. In this study, the percentages of PSD for eroded sediment present an order of clay (<0.002 mm) > silt (0.002–0.02 mm) > fine sand (0.02–0.25 mm) > coarse sand (0.25–2 mm) when RI and SS are determined, which is the opposite of the original soil order (Figure 7). The eroded sediment is principally composed of silt- and clay-grained particles that account for about 65.41–73.41% of the total SL. There is a boundary point at 0.02 mm for the PSD of eroded sediment because the percentages of sand-grained particles (0.02–2 mm) generally increased with the increasing RI, while that of clay- and silt-grained particles regularly decreased. However, there is no notable regularity of PSD among slopes with different SSs under the uniform RI. The Er of various sediment particles under different experimental conditions can prove the existence of a grading limitation of 0.02 mm for sediment transportation (Figure 8). The Er of sand-grained particles are all <1 with a range of 0.45–0.65, while that of clay- and silt-grained particles are >1 with a range of 1.37–1.80. The Er of clay and silt particles are negatively related to SS, whereas the Er of sand-grained particles present no notable regularity related to SS. The results of Er for silt- and clay-grained particles are similar to the findings of Lin et al. [75] with a range of 1.1–1.4, indicating a more severe depletion for silt- and clay-grained particles in the original soil. However, the Er of sand-grained particles is inconsistent with their corresponding results and the main interpretation might be due to the difference in experimental conditions and setup. Other studies have found that eroded sediment presents bimodal distributions in that particles with both large and small grains are easily transported, while the particles with intermediate-sized grains are not migrated [10,58]. In theory, fine-grained particles mostly gather in aggregates because of soil cohesion, while coarser particles are large enough to be moved without forming aggregates [6]. To some extent, the clay- and silt-grained particles are difficult to peel away and transport due to their agglomerate structure. Fine-grained particles become available for transportation and enrichment when the rainfall energy is high enough to break soil aggregates; however, coarse particles with high resistance are not easily displaced and transported during the erosion process [23]. The increasing RI and level of raindrop energy led to an increase in the proportions of sand-grained particles; this phenomenon is more pronounced on the steeper slopes. Large raindrops increased the detachment of soil particles and the transporting capacity of the surface runoff. This demonstrates that soil aggregates can be broken down into smaller masses and transported in a suspension, accounting for the notably higher proportion of fine-grained particles in the eroded sediment than the original soil. In contrast with the results of this study, some research has shown that the particles in the eroded sediment are mostly consistent with the original soil, or even coarser [58]. The process of sediment transportation is not only determined by the amount of raindrop energy, but also by the physico-chemical properties of the original soil [76]. The sand-grained particles may be relocated on the downward slopes during the transporting process even after they have been dragged and are unable to migrate significant distances. Raindrop splashes induced a particle cloud in the surface runoff, and the suspended particles might have been relocated on the slopes when the sedimentation velocity was faster than the flow velocity. The moving distance of the transported particles is determined by the runoff velocity, the sedimentation rate, and flowing height of the particles [53]. Overall, the transporting capacity of the rainfall runoff in this study is very strong due to the weak cohesive force between soil particles and the combination of heavy rainfalls and steep slopes in the weathered granite area, making the eroded sediment easy to transport.
The MWD is calculated in order to reconsider PSD, reflecting the stability of the original soil [10]. The MWD of the eroded sediment shows positively linear relationships with RI (R2 > 0.95) with a range of 0.15–0.20 mm (Figure 9). The differences between the maximum and minimum values of MWD on slopes with SS of 8°, 15°, and 25° become smaller and are, respectively, 0.045, 0.026, and 0.014 mm. The MWD of the eroded sediment is far less than that of the original soil (0.31 mm), indicating that a greater number of fine-grained particles are enriched in the eroded sediment by interrrill erosion. The correlations between the Er of various sediment particles, MWD, and different hydraulic parameters were analyzed (Table 3). There are positive correlations among Er1 (0.25–2 mm), Er2 (0.02–0.25 mm), MWD, and different hydraulic parameters, while negative correlations are observed for Er3 (0.002–0.02 mm) and Er4 (<0.002 mm). The MWD correlations are extremely significant among RI, V, Re, Fr, and Er. For τ, the correlation is only significant for Er3. Regarding h and SS, the correlations are not significant. The MWD is also found to positively correlate with the different hydraulic parameters; the correlation between h and SS is the weakest. Some studies analyzed the Er3 and Er4 of eroded sediment by comparing to the undisturbed soil, concluding that that the eroded sediment becomes coarser and more stable as rainfall duration increases [10]. It is commonly speculated that clay- and silt-grained particles accumulate at the beginning of rainfall. The approximate threshold of transportation between suspension/saltation and bed loading can be identified by the size classification and minimum transporting rate [9,69]. Hao, Wang, Guo, and Hua [19] found that the aggregates <0.05 mm are preferentially moved by suspension/saltation while those between 0.105 and 0.25 mm are usually resistant to runoff transportation. Loch and Donnollan [77] also concluded the transitional size variation of 0.125–0.25 mm from suspension/saltation to bed loading. Leguedois et al. [78] reported that particles ≥0.05 mm are carried away in the form of individual airborne particles, while those <0.05 mm are moved in aggregates. The research performed by Asadi, Moussavi, Ghadiri, and Rose [58] indicated that the critical range of size classes for bed loading is 0.18–0.38 mm in the fluvial sand, while it is 0.5–1.0 mm in the forest soil. Studies by Harchegani, Sadeghi, and Asadi [1] and Wang and Shi [79] reached findings that were similar to the critical point of 0.063 mm for the depletion/enrichment of sediment particles by interrill erosion. The differences between these results may be attributed to varying soil textures, causing different erodibility and rainfall characteristics with different hydraulic parameters [74]. Another interpretation is that the grading criteria and operating methods are different. Altogether, the actual grading limitation of the transporting mechanisms between suspension/saltation and bed loading depends on both the soil properties and hydraulic characteristics. Further tests that investigate sediment size characteristics with more detailed classifications should be conducted to specifically discover the accurate grading limitation. Furthermore, effective conservation practices should be taken into consideration to mitigate soil and water losses from the bare hillslopes of weathered granite, since heavy rainfalls mostly have a high probability of occurrence in these areas, particularly those with intensive agricultural practices.

4. Conclusions

The characteristics of runoff and sediment yield in relation to different hydraulic parameters were analyzed based on the method of artificial rainfall simulation. The results suggested that the impact of RI on runoff and sediment yield was stronger than that of SS. T0 was shortened because the experimental soil was more quickly pre-saturated and V became faster in heavier rainfalls on steep slopes. All the hydraulic parameters showed positive correlations with increasing RI and SS except h. SL positively and linearly correlates to V, Re, Fr, τ, and w, indicating that these hydraulic parameters could be effective indicators for erosion estimation and modeling. The average Sc presented a positive correlation with RI (R2 > 0.83) and increased with the increasing SS. The runoff is more selective for the silt and clay of the detached soil materials, resulting in the decline of sediment MWD when compared to the original soil. A clear boundary of 0.02 mm for the PSD of the eroded sediment was observed, because the Er values of fine-grained particles (<0.02 mm) are all larger than 1. The MWD positively correlates with different hydraulic parameters and the correlations with RI, V, Re, and Fr are extremely significant. Nevertheless, the specific transport transitions, from suspension to saltation and even bed loading, merit further study with more detailed size classifications.

Author Contributions

T.S. and L.Z. developed the model and carried out the experiments. T.S. also wrote the main part of the manuscript. L.D. and X.F. took part in the development of the model, planned and carried out part of the experiments, analyzed the results. K.F. wrote parts of the manuscript. L.N. and R.S. participated in the coordination of the study and reviewed the manuscript. All authors have read and agreed to the published version of the manuscript.

Funding

This research was supported by the National Natural Science Foundation of China (Grant No. 41877065).

Institutional Review Board Statement

Not applicable.

Informed Consent Statement

Not applicable.

Conflicts of Interest

The authors declare no conflict of interest.

References

  1. Kiani-Harchegani, M.; Sadeghi, S.H.; Asadi, H. Comparing grain size distribution of sediment and original soil under raindrop detachment and raindrop-induced and flow transport mechanism. Hydrol. Sci. J. 2018, 63, 312–323. [Google Scholar] [CrossRef]
  2. Zhang, J.; Wang, Z. Interrill soil erosion processes on steep slopes. J. Hydrol. 2017, 548, 652–664. [Google Scholar] [CrossRef]
  3. Deng, Y.; Duan, X.; Ding, S.; Cai, C.; Chen, J. Suction stress characteristics in granite red soils and their relationship with the collapsing gully in south China. Catena 2018, 171, 505–522. [Google Scholar] [CrossRef]
  4. Fei, K.; Deng, L.; Zhang, L.; Sun, T.; Wu, Y.; Fan, X.; Dong, Y. Lateral transport of soil total carbon with slope runoff and interflow: Effects of rainstorm characteristics under simulated rainfall. Catena 2019, 179, 39–48. [Google Scholar] [CrossRef]
  5. Vaezi, A.R.; Ahmadi, M.; Cerdà, A. Contribution of raindrop impact to the change of soil physical properties and water erosion under semi-arid rainfalls. Sci. Total Environ. 2017, 583, 382–392. [Google Scholar] [CrossRef] [PubMed]
  6. Zhang, P.; Yao, W.; Liu, G.; Xiao, P.; Sun, W. Experimental study of sediment transport processes and size selectivity of eroded sediment on steep Pisha sandstone slopes. Geomorphology 2020, 363, 107211. [Google Scholar] [CrossRef]
  7. Liu, D.; She, D.; Yu, S.; Shao, G.; Chen, D. Rainfall intensity and slope gradient effects on sediment losses and splash from a saline–sodic soil under coastal reclamation. Catena 2015, 128, 54–62. [Google Scholar] [CrossRef]
  8. Ebabu, K.; Tsunekawa, A.; Haregeweyn, N.; Adgo, E.; Meshesha, D.T.; Aklog, D.; Masunaga, T.; Tsubo, M.; Sultan, D.; Fenta, A.A.; et al. Effects of land use and sustainable land management practices on runoff and soil loss in the Upper Blue Nile basin, Ethiopia. Sci. Total Environ. 2019, 648, 1462–1475. [Google Scholar] [CrossRef] [PubMed]
  9. Shi, Z.; Fang, N.; Wu, F.; Wang, L.; Yue, B.; Wu, G. Soil erosion processes and sediment sorting associated with transport mechanisms on steep slopes. J. Hydrol. 2012, 454–455, 123–130. [Google Scholar] [CrossRef]
  10. Wu, X.; Wei, Y.; Wang, J.; Xia, J.; Cai, C.; Wu, L.; Fu, Z.; Wei, Z. Effects of erosion degree and rainfall intensity on erosion processes for Ultisols derived from quaternary red clay. Agric. Ecosyst. Environ. 2017, 249, 226–236. [Google Scholar] [CrossRef]
  11. Uusitalo, R. Suspended soil as a source of potentially bioavailable phosphorus in surface runoff waters from clay soils. Water Res. 2000, 34, 2477–2482. [Google Scholar] [CrossRef]
  12. Haygarth, P.; Jarvis, S. Soil derived phosphorus in surface runoff from grazed grassland lysimeters. Water Res. 1997, 31, 140–148. [Google Scholar] [CrossRef]
  13. Aksoy, H.; Eris, E.; Tayfur, G. Empirical Sediment Transport Models Based on Indoor Rainfall Simulator and Erosion Flume Experimental Data. Land Degrad. Dev. 2017, 28, 1320–1328. [Google Scholar] [CrossRef]
  14. Qi, Y.; Zhang, T.C. Transport of manure-borne testosterone in soils affected by artificial rainfall events. Water Res. 2016, 93, 265–275. [Google Scholar] [CrossRef] [PubMed] [Green Version]
  15. Hall, K.K.; Evanshen, B.G.; Maier, K.J.; Scheuerman, P.R. Application of Multivariate Statistical Methodology to Model Factors Influencing Fate and Transport of Fecal Pollution in Surface Waters. J. Environ. Qual. 2014, 43, 358–370. [Google Scholar] [CrossRef] [PubMed]
  16. Napoli, M.; Marta, A.D.; Zanchi, C.A.; Orlandini, S. Assessment of soil and nutrient losses by runoff under different soil management practices in an Italian hilly vineyard. Soil Tillage Res. 2017, 168, 71–80. [Google Scholar] [CrossRef]
  17. Gupta, S.K.; Tyagi, J.; Sharma, G.; Jethoo, A.S.; Singh, P.K. An Event-Based Sediment Yield and Runoff Modeling Using Soil Moisture Balance/Budgeting (SMB) Method. Water Resour. Manag. 2019, 33, 3721–3741. [Google Scholar] [CrossRef]
  18. Fu, X.T.; Zhang, L.P.; Wang, Y. Effect of Slope Length and Rainfall Intensity on Runoff and Erosion Conversion from Laboratory to Field. Water Resour. 2019, 46, 530–541. [Google Scholar] [CrossRef]
  19. Hao, H.-X.; Wang, J.-G.; Guo, Z.-L.; Hua, L. Water erosion processes and dynamic changes of sediment size distribution under the combined effects of rainfall and overland flow. Catena 2019, 173, 494–504. [Google Scholar] [CrossRef]
  20. An, J.; Zhang, Y.; Wang, Y. Rainstorm pattern effects on the size distribution of soil aggregate in eroded sediment within contour ridge systems. J. Soils Sediments 2020, 20, 2192–2206. [Google Scholar] [CrossRef]
  21. Sabzevari, T.; Talebi, A. Effect of hillslope topography on soil erosion and sediment yield using USLE model. Acta Geophys. 2019, 67, 1587–1597. [Google Scholar] [CrossRef]
  22. Zambon, N.; Johannsen, L.L.; Strauss, P.; Dostal, T.; Zumr, D.; Cochrane, T.A.; Klik, A. Splash erosion affected by initial soil moisture and surface conditions under simulated rainfall. Catena 2021, 196, 104827. [Google Scholar] [CrossRef]
  23. Saedi, T.; Shorafa, M.; Gorji, M.; Moghadam, B.K. Indirect and direct effects of soil properties on soil splash erosion rate in calcareous soils of the central Zagross, Iran: A laboratory study. Geoderma 2016, 271, 1–9. [Google Scholar] [CrossRef]
  24. Koiter, A.J.; Owens, P.N.; Petticrew, E.L.; Lobb, D. The role of soil surface properties on the particle size and carbon selectivity of interrill erosion in agricultural landscapes. Catena 2017, 153, 194–206. [Google Scholar] [CrossRef]
  25. Xia, J.; Cai, C.; Wei, Y.; Zhou, Y.; Gu, J.; Xiong, Y.; Zhou, X. Variations of soil hydraulic properties along granitic slopes in Benggang erosion areas. J. Soils Sediments 2021, 21, 1177–1189. [Google Scholar] [CrossRef]
  26. Martínez-Mena, M.; Carrillo-López, E.; Boix-Fayos, C.; Almagro, M.; Franco, N.G.; Díaz-Pereira, E.; Montoya, I.; de Vente, J. Long-term effectiveness of sustainable land management practices to control runoff, soil erosion, and nutrient loss and the role of rainfall intensity in Mediterranean rainfed agroecosystems. Catena 2020, 187, 104352. [Google Scholar] [CrossRef]
  27. Chen, H.; Zhang, X.; Abla, M.; Lü, D.; Yan, R.; Ren, Q.; Ren, Z.; Yang, Y.; Zhao, W.; Lin, P.; et al. Effects of vegetation and rainfall types on surface runoff and soil erosion on steep slopes on the Loess Plateau, China. Catena 2018, 170, 141–149. [Google Scholar] [CrossRef]
  28. Starke, J.; Ehlers, T.A.; Schaller, M. Latitudinal effect of vegetation on erosion rates identified along western South America. Science 2020, 367, 1358–1361. [Google Scholar] [CrossRef] [PubMed]
  29. Kiani-Harchegani, M.; Sadeghi, S.H.; Singh, V.P.; Asadi, H.; Abedi, M. Effect of rainfall intensity and slope on sediment particle size distribution during erosion using partial eta squared. Catena 2019, 176, 65–72. [Google Scholar] [CrossRef]
  30. Liang, Z.; Liu, H.; Zhao, Y.; Wang, Q.; Wu, Z.; Deng, L.; Gao, H. Effects of rainfall intensity, slope angle, and vegetation coverage on the erosion characteristics of Pisha sandstone slopes under simulated rainfall conditions. Environ. Sci. Pollut. Res. 2020, 27, 17458–17467. [Google Scholar] [CrossRef]
  31. Khaledi Darvishan, A.; Homayonfar, V.; Sadeghi, S.H. Designing, construction and calibration of a portable rainfall simulator for field runoff and soil erosion studies. Iran. J. Watershed Manag. Sci. Eng. 2016, 10, 105–112. [Google Scholar]
  32. Sobol, N.V.; Gabbasova, I.M.; Komissarov, M.A. Effect of rainfall intensity and slope steepness on the development of soil erosion in the Southern Cis-Ural region (A model experiment). Eurasian Soil Sci. 2017, 50, 1098–1104. [Google Scholar] [CrossRef]
  33. Dai, Q.; Peng, X.; Wang, P.; Li, C.; Shao, H. Surface erosion and underground leakage of yellow soil on slopes in karst regions of southwest China. Land Degrad. Dev. 2018, 29, 2438–2448. [Google Scholar] [CrossRef]
  34. Guo, Z.; Ma, M.; Cai, C.; Wu, Y. Combined effects of simulated rainfall and overland flow on sediment and solute transport in hillslope erosion. J. Soils Sediments 2018, 18, 1120–1132. [Google Scholar] [CrossRef]
  35. Zhao, L.; Hou, R. Effects of collection time intervals of surface runoff and sediment on soil erosion analysis during rainfall. Catena 2018, 165, 201–206. [Google Scholar] [CrossRef]
  36. Xu, J.; Zhang, J.; Li, M.; Wang, F. Effect of Rain Peak Morphology on Runoff and Sediment Yield in Miyun Water Source Reserve in China. Water 2019, 11, 2429. [Google Scholar] [CrossRef] [Green Version]
  37. Huang, J.; Wu, P.; Zhao, X. Effects of rainfall intensity, underlying surface and slope gradient on soil infiltration under simulated rainfall experiments. Catena 2013, 104, 93–102. [Google Scholar] [CrossRef]
  38. Borrelli, P.; Robinson, D.A.; Fleischer, L.R.; Lugato, E.; Ballabio, C.; Alewell, C.; Meusburger, K.; Modugno, S.; Schütt, B.; Ferro, V.; et al. An assessment of the global impact of 21st century land use change on soil erosion. Nat. Commun. 2017, 8, 1–13. [Google Scholar] [CrossRef] [Green Version]
  39. Astorga, R.T.; Villalobos, S.D.L.S.; Velasco, H.; Domínguez-Quintero, O.; Cardoso, R.P.; Dos Anjos, R.M.; Diawara, Y.; Dercon, G.; Mabit, L. Exploring innovative techniques for identifying geochemical elements as fingerprints of sediment sources in an agricultural catchment of Argentina affected by soil erosion. Environ. Sci. Pollut. Res. 2018, 25, 20868–20879. [Google Scholar] [CrossRef]
  40. Quan, X.; He, J.; Cai, Q.; Sun, L.; Li, X.; Wang, S. Soil erosion and deposition characteristics of slope surfaces for two loess soils using indoor simulated rainfall experiment. Soil Tillage Res. 2020, 204, 104714. [Google Scholar] [CrossRef]
  41. Wu, L.; Li, P.; Ma, X.-Y. Estimating nonpoint source pollution load using four modified export coefficient models in a large easily eroded watershed of the loess hilly–gully region, China. Environ. Earth Sci. 2016, 75, 1056. [Google Scholar] [CrossRef]
  42. Zhou, J.; Fu, B.; Gao, G.; Lü, Y.; Liu, Y.; Lü, N.; Wang, S. Effects of precipitation and restoration vegetation on soil erosion in a semi-arid environment in the Loess Plateau, China. Catena 2016, 137, 1–11. [Google Scholar] [CrossRef]
  43. Chen, J.; Xiao, H.; Li, Z.; Liu, C.; Ning, K.; Tang, C. How effective are soil and water conservation measures (SWCMs) in reducing soil and water losses in the red soil hilly region of China? A meta-analysis of field plot data. Sci. Total Environ. 2020, 735, 139517. [Google Scholar] [CrossRef]
  44. Zheng, M.-G.; Li, R.-K.; He, J.-J.; Cui, M. Sediment delivery across multiple spatio-temporal scales in an agriculture watershed of the Chinese Loess Plateau. J. Mt. Sci. 2015, 12, 1241–1253. [Google Scholar] [CrossRef]
  45. Golosov, V.; Collins, A.L.; Tang, Q.; Zhang, X.; Zhou, P.; He, X.; Wen, A. Sediment transfer at different spatial and temporal scales in the Sichuan Hilly Basin, China: Synthesizing data from multiple approaches and preliminary interpretation in the context of climatic and anthropogenic drivers. Sci. Total Environ. 2017, 598, 319–329. [Google Scholar] [CrossRef]
  46. Ali, M.; Sterk, G.; Seeger, M.; Boersema, M.; Peters, P. Effect of hydraulic parameters on sediment transport capacity in overland flow over erodible beds. Hydrol. Earth Syst. Sci. 2012, 16, 591–601. [Google Scholar] [CrossRef] [Green Version]
  47. Zhao, Q.; Li, D.; Zhuo, M.; Guo, T.; Liao, Y.; Xie, Z. Effects of rainfall intensity and slope gradient on erosion characteristics of the red soil slope. Stoch. Environ. Res. Risk Assess. 2015, 29, 609–621. [Google Scholar] [CrossRef]
  48. Guo, T.; Wang, Q.; Li, D.; Zhuang, J.; Wu, L. Flow hydraulic characteristic effect on sediment and solute transport on slope erosion. Catena 2013, 107, 145–153. [Google Scholar] [CrossRef]
  49. Sajjadi, S.A.; Mahmoodabadi, M. Sediment concentration and hydraulic characteristics of rain-induced overland flows in arid land soils. J. Soils Sediments 2015, 15, 710–721. [Google Scholar] [CrossRef]
  50. Xing, H.; Huang, Y.-H.; Chen, X.-Y.; Luo, B.-L.; Mi, H.-X. Comparative study of soil erodibility and critical shear stress between loess and purple soils. J. Hydrol. 2018, 558, 625–631. [Google Scholar] [CrossRef]
  51. Deng, L.-Z.; Fei, K.; Sun, T.-Y.; Zhang, L.-P.; Fan, X.-J.; Ni, L. Characteristics of runoff processes and nitrogen loss via surface flow and interflow from weathered granite slopes of Southeast China. J. Mt. Sci. 2019, 16, 1048–1064. [Google Scholar] [CrossRef]
  52. Anache, J.A.; Flanagan, D.C.; Srivastava, A.; Wendland, E.C. Land use and climate change impacts on runoff and soil erosion at the hillslope scale in the Brazilian Cerrado. Sci. Total Environ. 2018, 622–623, 140–151. [Google Scholar] [CrossRef]
  53. Deng, L.; Sun, T.; Fei, K.; Zhang, L.; Fan, X.; Wu, Y.; Ni, L. Effects of erosion degree, rainfall intensity and slope gradient on runoff and sediment yield for the bare soils from the weathered granite slopes of SE China. Geomorphology 2020, 352, 106997. [Google Scholar] [CrossRef]
  54. Sun, T.; Deng, L.; Fei, K.; Zhang, L.; Fan, X. Characteristics of phosphorus adsorption and desorption in erosive weathered granite area and effects of soil properties. Environ. Sci. Pollut. Res. 2020, 27, 28780–28793. [Google Scholar] [CrossRef] [PubMed]
  55. Ran, Q.; Su, D.; Li, P.; He, Z. Experimental study of the impact of rainfall characteristics on runoff generation and soil erosion. J. Hydrol. 2012, 424–425, 99–111. [Google Scholar] [CrossRef]
  56. Katebikord, A.; Darvishan, A.K.; Alavi, S.J.; Student, G.M.; Professor, A. Effects of Rainfall Duration on Hydrological Response of Field Plots under Rainfall Simulation. J. Watershed Manag. Res. 2018, 9, 49–56. [Google Scholar] [CrossRef]
  57. Vaezi, A.R.; Bahrami, H.A. Relationship between Soil Productivity and Erodibility in Rainfed Wheat Lands in Northwestern Iran. J. Agric. Sci. Technol. 2014, 16, 1455–1466. [Google Scholar]
  58. Asadi, H.; Moussavi, A.; Ghadiri, H.; Rose, C. Flow-driven soil erosion processes and the size selectivity of sediment. J. Hydrol. 2011, 406, 73–81. [Google Scholar] [CrossRef] [Green Version]
  59. Mahmoodabadi, M.; Sajjadi, S.A. Effects of rain intensity, slope gradient and particle size distribution on the relative contributions of splash and wash loads to rain-induced erosion. Geomorphology 2016, 253, 159–167. [Google Scholar] [CrossRef]
  60. Han, Y.; Fan, Y.; Xin, Z.; Wang, L.; Cai, Q.; Wang, X. Effects of wetting rate and simulated rain duration on soil crust formation of red loam. Environ. Earth Sci. 2016, 75, 1–9. [Google Scholar] [CrossRef]
  61. Lu, J.; Zheng, F.; Li, G.; Bian, F.; An, J. The effects of raindrop impact and runoff detachment on hillslope soil erosion and soil aggregate loss in the Mollisol region of Northeast China. Soil Tillage Res. 2016, 161, 79–85. [Google Scholar] [CrossRef]
  62. Nciizah, A.; Wakindiki, I. Rainfall pattern effects on crusting, infiltration and erodibility in some South African soils with various texture and mineralogy. Water SA 2014, 40, 57. [Google Scholar] [CrossRef] [Green Version]
  63. Morin, J.; Van Winkel, J. The Effect of Raindrop Impact and Sheet Erosion on Infiltration Rate and Crust Formation. Soil Sci. Soc. Am. J. 1996, 60, 1223–1227. [Google Scholar] [CrossRef]
  64. Comino, J.R.; Sinoga, J.R.; González, J.S.; Guerra-Merchán, A.; Seeger, M.; Ries, J. High variability of soil erosion and hydrological processes in Mediterranean hillslope vineyards (Montes de Málaga, Spain). Catena 2016, 145, 274–284. [Google Scholar] [CrossRef]
  65. An, J.; Zheng, F.; Lu, J.; Li, G. Investigating the Role of Raindrop Impact on Hydrodynamic Mechanism of Soil Erosion Under Simulated Rainfall Conditions. Soil Sci. 2012, 177, 517–526. [Google Scholar] [CrossRef]
  66. Beuselinck, L.; Govers, G.; Hairsine, P.; Sander, G.; Breynaert, M. The influence of rainfall on sediment transport by overland flow over areas of net deposition. J. Hydrol. 2002, 257, 145–163. [Google Scholar] [CrossRef]
  67. An, J.; Liu, Q. Soil aggregate breakdown in response to wetting rate during the inter-rill and rill stages of erosion in a contour ridge system. Catena 2017, 157, 241–249. [Google Scholar] [CrossRef]
  68. Strohmeier, S.; Laaha, G.; Holzmann, H.; Klik, A. Magnitude and Occurrence Probability of Soil Loss: A Risk Analytical Approach for the Plot Scale For Two Sites in Lower Austria. Land Degrad. Dev. 2016, 27, 43–51. [Google Scholar] [CrossRef]
  69. Kinnell, P. The influence of time and other factors on soil loss produced by rain-impacted flow under artificial rainfall. J. Hydrol. 2020, 587, 125004. [Google Scholar] [CrossRef]
  70. Ma, R.; Li, Z.-X.; Cai, C.-F.; Wang, J.-G. The dynamic response of splash erosion to aggregate mechanical breakdown through rainfall simulation events in Ultisols (subtropical China). Catena 2014, 121, 279–287. [Google Scholar] [CrossRef]
  71. Shi, Z.-H.; Yan, F.-L.; Li, L.; Li, Z.-X.; Cai, C.-F. Interrill erosion from disturbed and undisturbed samples in relation to topsoil aggregate stability in red soils from subtropical China. Catena 2010, 81, 240–248. [Google Scholar] [CrossRef]
  72. Tuset, J.; Vericat, D.; Batalla, R. Rainfall, runoff and sediment transport in a Mediterranean mountainous catchment. Sci. Total Environ. 2016, 540, 114–132. [Google Scholar] [CrossRef]
  73. Tian, P.; Xu, X.; Pan, C.; Hsu, K.; Yang, T. Impacts of rainfall and inflow on rill formation and erosion processes on steep hillslopes. J. Hydrol. 2017, 548, 24–39. [Google Scholar] [CrossRef]
  74. Wu, X.; Wei, Y.; Wang, J.; Cai, C.; Deng, Y.; Xia, J. RUSLE erodibility of heavy-textured soils as affected by soil type, erosional degradation, and rainfall intensity: A field simulation. Land Degrad. Dev. 2018, 29, 408–421. [Google Scholar] [CrossRef]
  75. Lin, J.; Huang, Y.; Zhao, G.; Jiang, F.; Wang, M.-K.; Ge, H. Flow-driven soil erosion processes and the size selectivity of eroded sediment on steep slopes using colluvial deposits in a permanent gully. Catena 2017, 157, 47–57. [Google Scholar] [CrossRef]
  76. Sadeghi, S.H.; Harchegani, M.K.; Asadi, H. Variability of particle size distributions of upward/downward splashed materials in different rainfall intensities and slopes. Geoderma 2017, 290, 100–106. [Google Scholar] [CrossRef]
  77. Loch, R.; Donnollan, T. Field rainfall simulator studies on two clay soils of the Darling Downs, Queensland. II. Aggregate Breakdpwn, sediment properties and soil erodibility. Soil Res. 1983, 21, 47–58. [Google Scholar] [CrossRef]
  78. Leguédois, S.; Planchon, O.; Legout, C.; Le Bissonnais, Y. Splash Projection Distance for Aggregated Soils. Soil Sci. Soc. Am. J. 2005, 69, 30–37. [Google Scholar] [CrossRef]
  79. Wang, L.; Shi, Z. Size Selectivity of Eroded Sediment Associated with Soil Texture on Steep Slopes. Soil Sci. Soc. Am. J. 2015, 79, 917–929. [Google Scholar] [CrossRef]
Figure 1. Schematic diagrams of experimental equipment with (a) rainfall simulator, (b) test plots, and (c) soil layers for classical weathered granite slopes.
Water 13 03453 g001
Figure 2. Runoff rate with rainfall duration under different experimental conditions.
Water 13 03453 g002
Figure 3. Relationships between measured runoff velocity and rainfall intensity on different slopes.
Water 13 03453 g003
Figure 4. Sediment rate with rainfall duration under different experimental conditions.
Water 13 03453 g004
Figure 5. Relationships between (a) sediment load and runoff volume, (b) average sediment concentration and rainfall intensity under different experimental conditions.
Water 13 03453 g005
Figure 6. Relationships between runoff volume, sediment load, and different hydraulic parameters.
Water 13 03453 g006
Figure 7. Particle size distribution of eroded sediment under different experimental conditions.
Water 13 03453 g007
Figure 8. Enrichment ratio of various sediment particles under different experimental conditions.
Water 13 03453 g008
Figure 9. Mean weight diameter of eroded sediment under different experimental conditions.
Water 13 03453 g009
Table 1. Statistical table of test monitoring data.
SS (°)RI (mm/min)T0 (min)Rv (L)SL (g)Average Sc (g/L)I
80.518.5578.3074.500.950.88
1.04.27148.30212.381.430.83
1.52.37233.15384.111.650.87
2.01.83315.35975.703.090.88
2.51.13427.771261.402.950.96
150.56.7374.02150.802.040.85
1.02.36152.25297.491.950.88
1.52.00249.151428.455.730.96
2.01.30291.322886.009.910.84
2.50.75410.334399.2310.720.94
250.52.6769.07394.485.710.85
1.01.58155.231296.658.350.95
1.50.92227.052899.5312.770.93
2.00.65303.334059.5513.380.93
2.50.45390.985857.2514.980.96
Note: SS is slope steepness; RI is rainfall intensity; T0 is the occurring time of surface runoff and sediment yield; Rv is runoff volume; SL is sediment load; Sc is average sediment concentration; I is the runoff coefficient.
Table 2. Hydraulic parameters under different experimental conditions.
SS (°)RI (mm/min)V (10−2 m/s)h (mm)ReFrτ (10−2 N/m2)w (10−4 N/m/s)
80.50.83 ± 0.011.75 ± 0.0212.70 ± 2.140.06 ± 0.000.47 ± 0.010.04 ± 0.01
1.01.78 ± 0.561.54 ± 0.4920.44 ± 2.070.14 ± 0.070.52 ± 0.160.09 ± 0.01
1.52.55 ± 0.481.69 ± 0.3633.52 ± 2.090.20 ± 0.050.62 ± 0.130.16 ± 0.01
2.03.08 ± 0.601.90 ± 0.3747.25 ± 2.810.23 ± 0.071.07 ± 0.210.33 ± 0.02
2.53.43 ± 0.692.31 ± 0.5550.80 ± 1.600.23 ± 0.071.26 ± 0.300.43 ± 0.01
150.50.89 ± 0.091.54 ± 0.1614.11 ± 0.120.07 ± 0.011.23 ± 0.130.11 ± 0.00
1.01.85 ± 0.101.53 ± 0.0920.69 ± 0.090.15 ± 0.011.18 ± 0.070.22 ± 0.00
1.52.90 ± 0.161.59 ± 0.0941.48 ± 0.170.23 ± 0.022.82 ± 0.150.82 ± 0.00
2.03.15 ± 0.151.72 ± 0.0846.66 ± 0.190.24 ± 0.024.91 ± 0.241.55 ± 0.01
2.54.35 ± 0.901.75 ± 0.3547.22 ± 0.040.33 ± 0.115.38 ± 1.072.34 ± 0.00
250.50.95 ± 0.051.35 ± 0.0714.92 ± 0.120.08 ± 0.014.14 ± 0.230.39 ± 0.00
1.02.13 ± 0.201.35 ± 0.1231.35 ± 0.290.18 ± 0.035.77 ± 0.521.23 ± 0.01
1.53.05 ± 0.071.38 ± 0.0348.52 ± 0.490.26 ± 0.018.69 ± 0.202.65 ± 0.03
2.03.41 ± 0.391.65 ± 0.2047.95 ± 0.220.27 ± 0.0410.83 ± 1.303.69 ± 0.02
2.54.99 ± 0.471.45 ± 0.1472.76 ± 0.120.42 ± 0.0610.59 ± 1.045.29 ± 0.01
Note: SS is slope steepness; RI is rainfall intensity; V is mean flow velocity; h is mean runoff depth; Re is Reynolds number; Fr is Frounde number; τ is hydraulic shear stress; w is stream power.
Table 3. The correlations (R) between Er, MWD, T0 and different hydraulic parameters as well as RI and SS.
Er1Er2Er3Er4MWDT0ScI
RI0.726 **0.861 **−0.769 **−0.904 **0.754 **−0.597 *0.542 *0.575 *
SS0.3840.172−0.395−0.1700.374−0.395−0.768 **0.341
V0.720 **0.833 **−0.773 **−0.860 **0.746 **−0.567 *0.696 **0.557 *
h0.1560.380−0.166−0.4150.180−0.464−0.3170.385
Re0.686 **0.795 **−0.744 **−0.812 **0.711 **−0.520 *0.718 **0.478
Fr0.687 **0.782 **−0.745 **−0.798 **0.711 **−0.527 *0.761 **0.513
τ0.5140.461−0.562 *−0.4510.520 *−0.0160.970 **−0.064
w0.523 *0.523 *−0.563 *−0.531 *0.534 *−0.2240.932 **0.162
Note: SS is slope steepness; RI is rainfall intensity; V is mean flow velocity; h is mean runoff depth; Re is Reynolds number; Fr is Frounde number; τ is hydraulic shear stress; w is stream power. Er1 to Er4 are the Enrichment ratio of sediment particles, respectively, for 0.25–2, 0.02–0.25, 0.002–0.02, <0.002 mm; T0 is the occurring time of surface runoff and sediment yield; Sc is sediment concentration; I is the runoff coefficient; MWD is mean weight diameter. *, the correlation is significant at a confidence level of 0.05, n = 15; **, the correlation is significant at a confidence level of 0.01, n = 15.
Publisher’s Note: MDPI stays neutral with regard to jurisdictional claims in published maps and institutional affiliations.

