Article

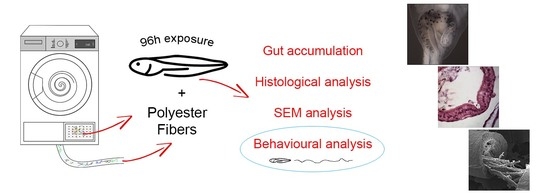
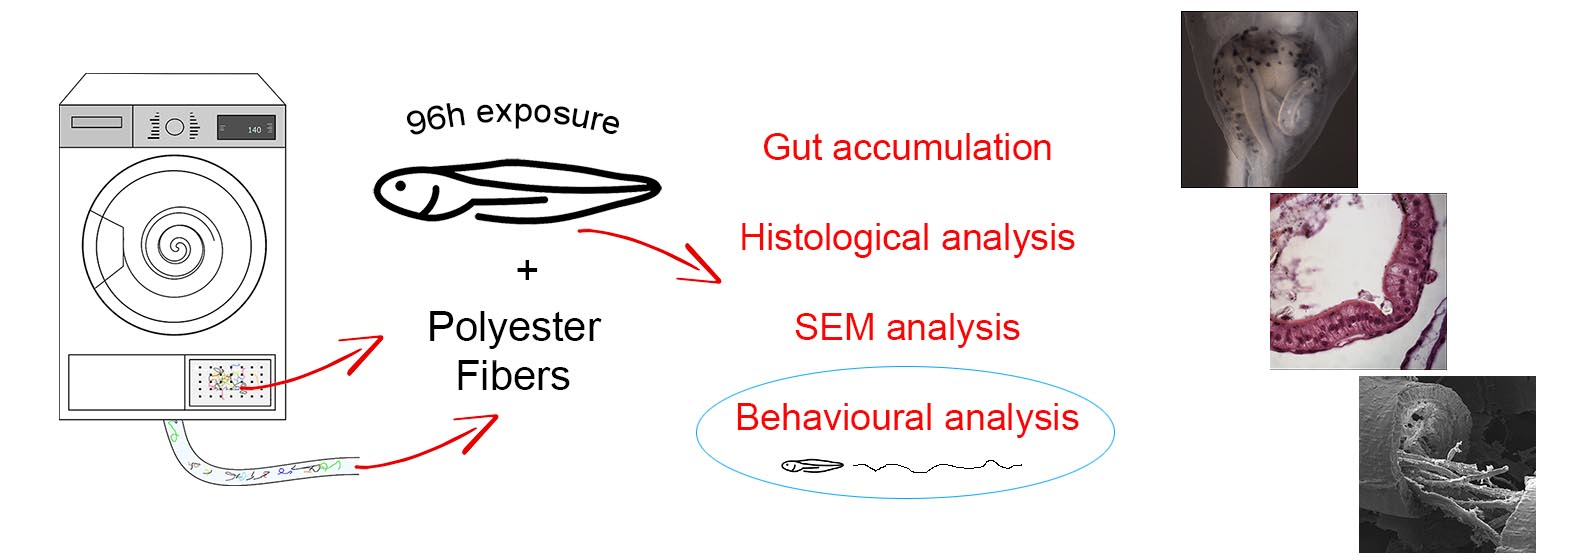
The Toxicity of Polyester Fibers in Xenopuslaevis

1
Department of Environmental Science and Policy, Università Degli Studi di Milano, Via Celoria, 26, 20133 Milano, Italy
2
Unitech NOLIMITS, Imaging Facility, Università Degli Studi di Milano, Via Golgi, 19, 20133 Milano, Italy
*
Author to whom correspondence should be addressed.
Water 2021, 13(23), 3446; https://doi.org/10.3390/w13233446
Submission received: 2 November 2021 / Revised: 22 November 2021 / Accepted: 2 December 2021 / Published: 4 December 2021

Abstract

:
Microplastics are practically ubiquitous and pose a serious survival challenge for many species. Most of the exposure experiments for determining the toxicological effects of microplastics were performed with a microplastic varying little in shape and size (often purchased microplastic beads), but few studies deal with non-homogeneous samples. We analyzed the effect on Xenopus laevis larva on the early development of polyester fibers, PEFs, taken from a dryer machine in which 100% polyester fabrics were dried after washing. Three concentrations were tested. The results showed that the gastrointestinal tract, GIT, was the most affected system by PEFs which modified the normal shape of the intestine with an EC50 96 h value of 6.3 µg mL−1. Fibers were observed to press against the digestive epithelium, deforming the normal architecture of the gut, sometimes pushing deep into the epithelium until piercing it. Physical GIT occlusion was observed in a concentration-dependent manner. However, no other damages were registered. No mortality was observed, but PEF-exposed larvae showed a significant reduction in their mobility. The results of the present paper suggest that environmental samples with their heterogeneity may have adverse effects on X. laevis development.

Graphical Abstract

1. Introduction

Plastic pollution is omnipresent, and pieces of plastic less than 5 mm, commonly referred to as microplastics (MPs) [1], are reported to be present in a wide variety of environmental compartments [2], such as in the atmosphere [3], aquatic and terrestrial ecosystems [4], remote areas [5], and even food [6] and beverages [7]. According to Baldwin et al. [8], MPs can be classified into five categories based on their shape: fragments, films, foams, pellets/beads, and fibers/lines, the latter being the most common in the environment [9].
Microplastic fibers (MPFs) derive from various sources: from clothes mostly made of polyethylene terephthalate, namely polyester, through a direct pathway from clothing to water courses or via the atmosphere [9,10]. They are known to enter the environment during the production process, laundering the end products, or due to disintegration of textiles and non-laundering fabrics such as flags, sails, furniture, carpets, or mattresses. Household and office dust, but also abrasions of insulating materials from construction sites, represent other known sources for PEFs ([11] and references within). In particular, the washing process of polyester textiles was demonstrated to represent an important source of MPFs [12,13,14,15]. Browne and co-workers reported that wastewater from domestic washing machines could produce >1900 fibers per wash of a single garment [13], while Napper and Thompson found that an average 6 kg wash load of acrylic fabric could release over 700,000 fibers, suggesting that a large proportion of MPFs found in the aquatic environment may be derived from sewage, as a consequence of clothes washing [15]. De Falco estimated that over 6,000,000 fibers are potentially released from a 5 kg wash consisting solely of polyester fabrics [14]. More recently, Belzagui and colleagues estimated 0.28 million tons of MPFs year−1 as the mass flow detached from household laundry that reaches aquatic environments [12]. Despite the differences among these studies, probably due to the fact that the number and weight of fibers released during wash cycles greatly varied according to wash treatment [15], these data strongly indicate that MPF pollution is an issue of great concern for both human and environmental health.
As with washing machines, the drying of synthetic textiles was also reported to produce MPFs. In this case, indeed, two environmental compartments are involved: the atmosphere via the exhaust air, and the aquatic environment either directly via the drain or indirectly via a water tank. Regarding the air pollution due to electric dryers, a few studies exist. O’Brien et al. reported and quantified for the first time the MPF release from a dryer machine into the ambient air [16], while Kapp and Miller studied the spatial distribution of MPFs emitted from the vent of a dryer directly into the environment [17]. To the best of our knowledge, no study of the effects of the MPF load into the water from a dryer machine is available so far. To date, only very few studies have evaluated the accumulation and the toxicological effects of MPs in amphibians [18,19,20,21,22] although this group is considered one of the most endangered vertebrate groups [23]. For this reason, we investigated the toxicity of the MPFs produced during the drying process on Xenopus laevis. This species is widely used in toxicological tests [24,25,26] and also in ecological risk assessment studies [27].
The present paper aimed at evaluating the mortality and the potential adverse effects induced by polyester fibers, PEFs, in X. laevis by exposing embryos from stage 8–9, blastula stage, to stage 46, and completion of organogenesis [28]. Since no previous studies of microplastic fiber effects on amphibian larvae were available so far, three different increasing concentrations with a wide range were selected: 1, 10, and 50 µg mL−1. At the end of the exposure, the ingestion of PEFs and their possible adverse effects on the digestive system of the larvae were assessed by light and electron (SEM) microscopy analyses. Additionally, the swimming behavior of the exposed larvae was compared with that of controls to evaluate potential alterations due to the PEF burden.

2. Materials and Methods

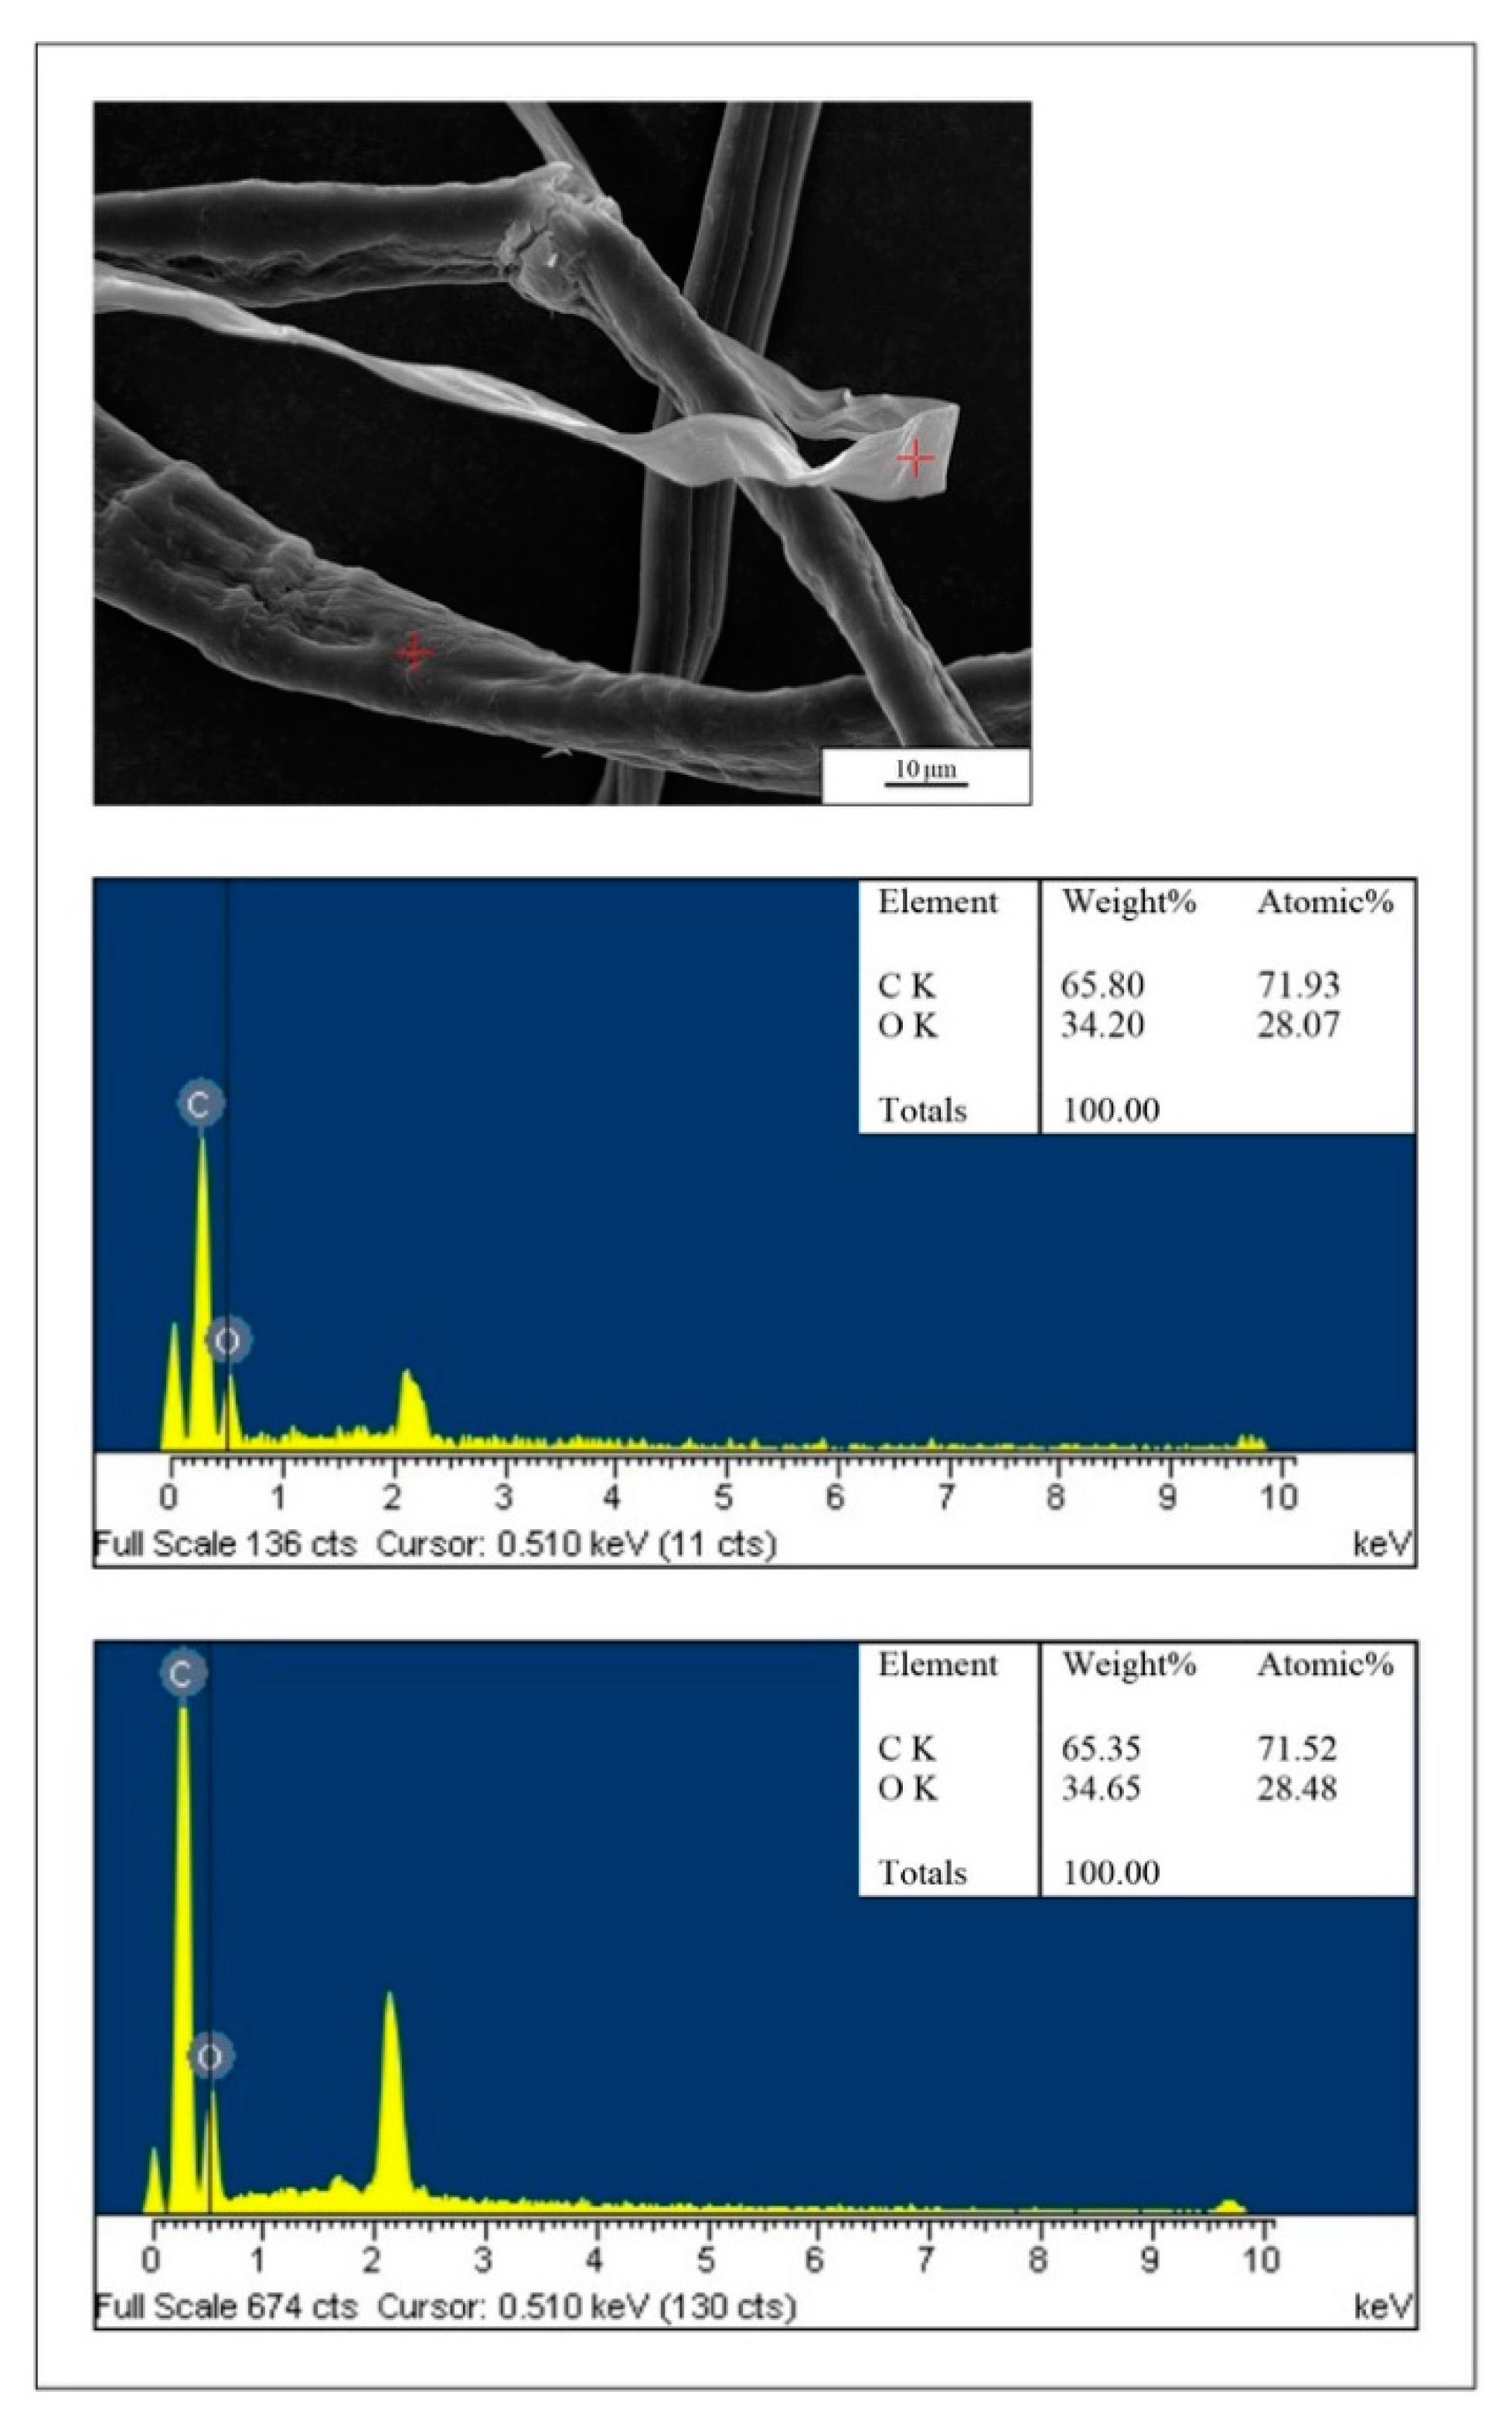
2.1. Sampling and Characterization of PEFs

PEFs for the exposure tests were obtained by washing and then drying 5.4 kg of 100% polyester clothes and fabrics of different colors with a domestic tumble dryer. PEFs were first collected from the water tank and from the exhaust air filter, then microscopically compared. The dryer tank was previously rinsed with deionized water and the dryer filter thoroughly cleaned with a vacuum cleaner. All items were washed, then loaded into the dryer and dried with a normal drying program. The wastewater deriving from this first cycle was discarded as well as the fibers collected from the dryer filter. The same items were washed and dried again, only this time the wastewater was collected, poured into a glass bottle, and stored in the dark at 4 °C. Fibers on the air filter were collected as well, wrapped in aluminum foil, and transported to the laboratory for weight evaluation and the subsequent microscopical analyses. The total amount of fibers collected from the air filter were obtained by weighting the whole sample on an analytical scale (precision 0.1 mg).
To verify that the PEFs in wastewaters were the same as those collected on the dryer filter, a subsample of the total wastewater volume was filtered under a vacuum using an in-house manufactured glass filtration apparatus that allowed filtering up to four samples simultaneously (three samples and a blank). Samples of 250 mL of wastewater and the blank of the same volume of ultrapure Milli-Q® water were filtered on silver membranes with the following features: 0.8 mm pore size, 13 mm diameter, and filtration area 19.6 mm2. After filtration, filters were carefully removed, placed into a glass container, and dried in a glass desiccator until reaching a constant weight. The total fiber amount in wastewater was calculated proportionally to the subsample volume. The amount of fiber per kg of fabric was determined by dividing the total amount of fiber in the wastewater by the dry weighted of dried fabrics.
A first comparative analysis was performed with a Leica EZ4D stereomicroscope, and then with a Leica DMRA2 light microscope equipped with a Leica DC300F digital camera. A subsample of PEFs coming from the exhaust air filter and the silver filters used for the wastewater filtration were mounted onto standard SEM stubs and gold-sputtered. The fibers’ detailed morphology and the elemental composition were studied with a Zeiss LEO 1430 scanning electron microscope (SEM) coupled with a Centaurus detector for energy dispersive x-ray spectroscopy (EDS) analysis. The elemental analysis was performed using Oxford Instruments INCA version 4.04 software (Abingdon, UK). The operating conditions were as follows: accelerating voltage, 20 kV; probe current, 360 pA; and working distance, 15.0 mm. EDS analysis of single fibers from both the matrixes showed similar appearance, shape, and elemental composition. Figure 1 shows an example of two spectra from PEF fibers used for the exposure experiment. The obtained experimental C:O atomic ratios (71.5:28.5 and 71.9:28.1) were very close to the stoichiometric PET ratio (71.4:28.6) and close to the experimental C:O ratio of PET measured with the same instrument [29].
Cylindric and ribbon-like shapes with a variable width up to 24 µm and a height of 1–3 µm were observed; their length was on average 660 ± 423 µm (min 68 µm, max 3638 µm, n = 450), with most of the fibers in the range between 200 and 800 µm (about 70%). Considering the mean size of the fibers as described by SEM analyses (660 µm length, 12 µm width and 2 µm height), we obtained an indicative fiber volume of 15,840 µm3 fiber−1 (1.6 × 10⁻⁵ mm−3 fiber−1) and an indicative fiber weight of 2.2 × 10⁻⁵ mg fiber−1 (considering a density of polyester of 1.38 mg mm−3). From these calculations, we obtain an indicative number of fibers per exposure concentration of 46, 455, and 2270 PEFs mL−1, for the three tested concentrations of 1, 10, and 50 µg mL−1 PEFs. Since X. laevis larvae were exposed in 10 mL medium, the estimated numbers of PEFs were 455, 4550, and 22,700, respectively. Regarding the median and maximum MP concentrations at the outlet of wastewater treatment plants reported by Schmidt et al. [30] (6.4 and 450 MPs L−1, respectively), exposure concentrations of this work were higher than the measured environmental concentrations in water. Not, however, when considering that amphibian tadpoles feed on the sediment substrate. In sediment, MP concentrations were reported to be higher than in water due to the deposition of high-density MPs such as polyester fibers [31]. Direct comparison with environmental concentrations in sediments is not feasible due to the difference in units. Exposure concentrations used in the present work were consistent and even lower than those in the literature [17,30] (in which up to 100,000 particle mL−1 were tested [32].

2.2. Animals and Experimental Design

Adult X. laevis were maintained at the University of Milan in an automatic breeding system (TecnoPlus; Techniplast, Italy) under controlled conditions: T = 20 ± 2 °C; pH = 7.5 ± 0.5; conductivity = 1000 ± 100 μS; 12 h light/dark cycle and fed a semi-synthetic diet two times a week (XE40; Mucedola S.r.l., Settimo Milanese, Milano, Italy). Embryos were obtained from overnight natural mating; after breeding, adults were removed, and embryos were collected in glass Petri dishes. Fertilized eggs were de-jelled in a 2.25% L-cysteine solution with an arranged pH of 8.0, and rinsed several times in FETAX solution, whose composition in µg mL−1 was: 625 NaCl, 96 NaHCO3, 30 KCl, 15 CaCl2, 60 CaSO4 • 2H2O, and 70 MgSO4. Normally cleaved embryos at the blastula stage (stage 8–9, according to [28] were selected for testing and exposed to a nominal concentration of 1, 10, and 50 µg mL−1 PEFs in 60 mm glass Petri dishes.
Ten embryos were seeded in each Petri dish containing 10 mL of the control (FETAX solution) or test suspensions which were prepared in FETAX as well, by serial dilution of the stock solution. One liter of stock solution of 50 µg mL−1 PEFs in FETAX was previously prepared and maintained on a shaker under continuous agitation. The PEFs were taken from the air filter whereas these were made of the same material as those from the water filtration filters but, contrary to these latter, contained sufficient fibers. All of the groups, including the control, were triplicated, and allowed to develop in a thermostatic chamber at 23 °C ± 0.5 until stage 46, free swimming larva, 96 hpf, at the end of the test. Each day, all solutions were renewed, and embryos checked for viability. At the end of the test, a swimming behavioral test was performed. Briefly, twenty larvae per group, randomly taken from the three replicates, were individually transferred to a Petri dish filled with 10 mL of FETAX solution to be video tracked. Samples were put into a 27 mm plastic cylinder (the arena), placed inside a 60 mm plastic Petri dish and allowed 1 min to acclimate before being recorded. Videos were taken from above for 30 s using a 1080p HD 30 fps digital camera and subsequently analyzed by the AnimalTracker plugin [33] and the free image process program ImageJ [34]. Total immobility time (sec), distance moved (mm), and mean swimming speed (mm/sec) were considered as swimming activity endpoints.
At the end of the analysis, all larvae were anesthetized with MS222 at a final concentration of 100 µg mL−1, evaluated for single malformations under a Leica EZ4 D stereomicroscope and photographed. At the very end, all samples were fixed for the subsequent microscopical analyses (see below).

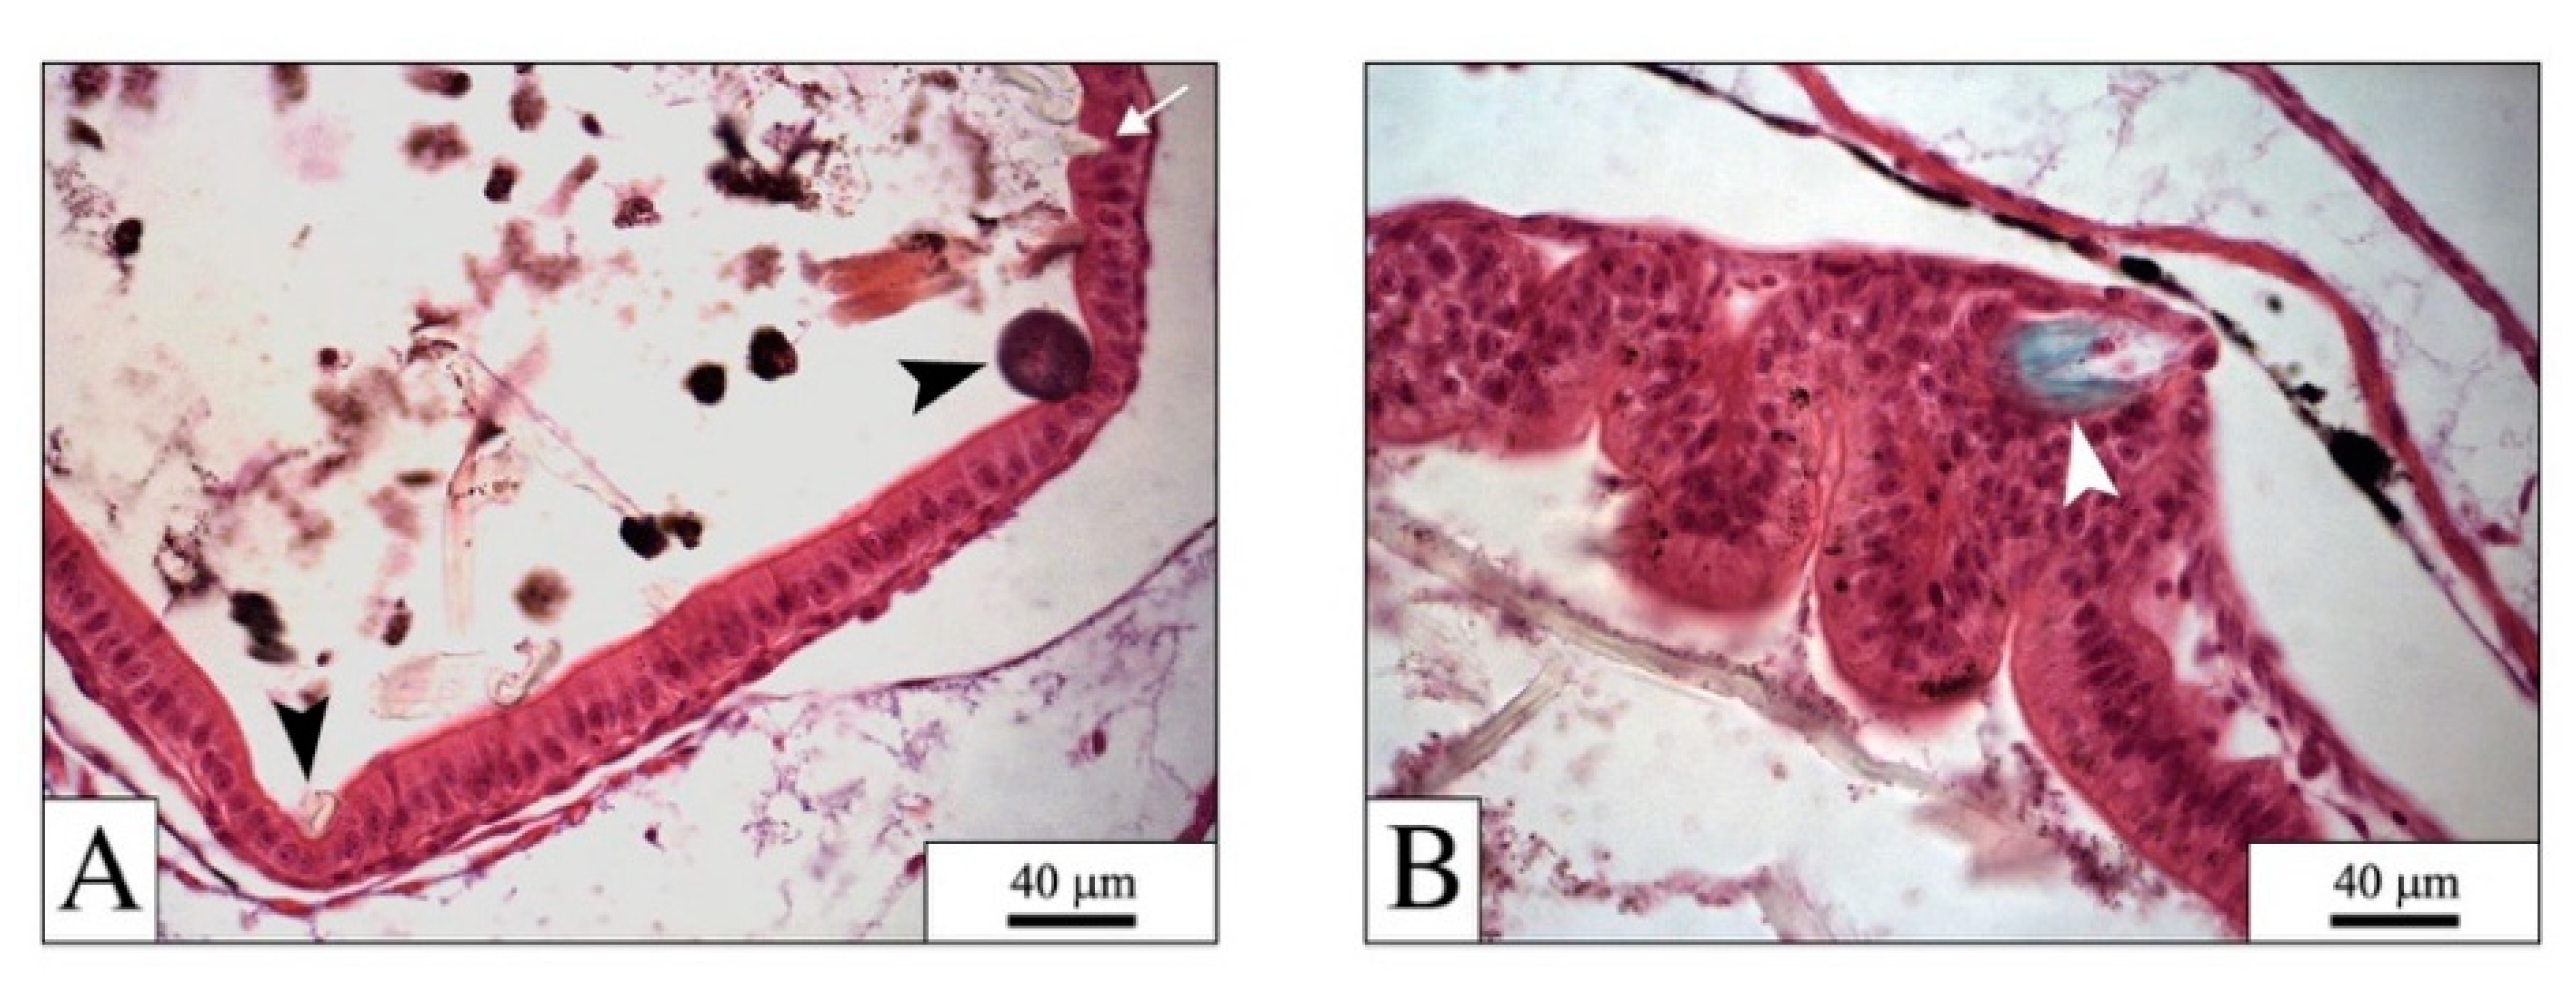
2.3. Microscopical Analyses

For light microscopy analyses, ten larvae per group were randomly selected and fixed overnight in Bouin’s fluid at RT. After fixation, larvae were rinsed in tap water, dehydrated in an ascending ethanol series and embedded in Bio-plast tissue embedding medium (Bio-Optica Srl, Milano, Italy). Seven-micrometer transverse serial sections of the larvae at the abdominal level were obtained using a Reichert rotative microtome and stained with hematoxylin–eosin (HE). The slides were examined under a Leica DMRA2 light microscope, and images were collected with a Leica DC300F digital camera.
For scanning electron microscopy analyses, ten larvae from each treatment group were randomly selected, post-fixed in 1% OsO4 for 2 h, at 4 °C, dehydrated with an ascending ethanol series, and critical-point dried in a Balzers Unions CPD 020 apparatus (Balzers Unions, Lichtenstein). Under a stereomicroscope, the whole samples were mounted onto standard aluminum stubs, gold-sputtered, and observed under a FE-SEM Sigma (Zeiss, Jena, Germany) at 7 kV, WD 20–10 cm. After these first observations, samples were removed from their respective stubs and put again under the stereomicroscope. The digestive tract of each larva was carefully dissected, mounted onto SEM stubs, and prepared for a new analysis session.

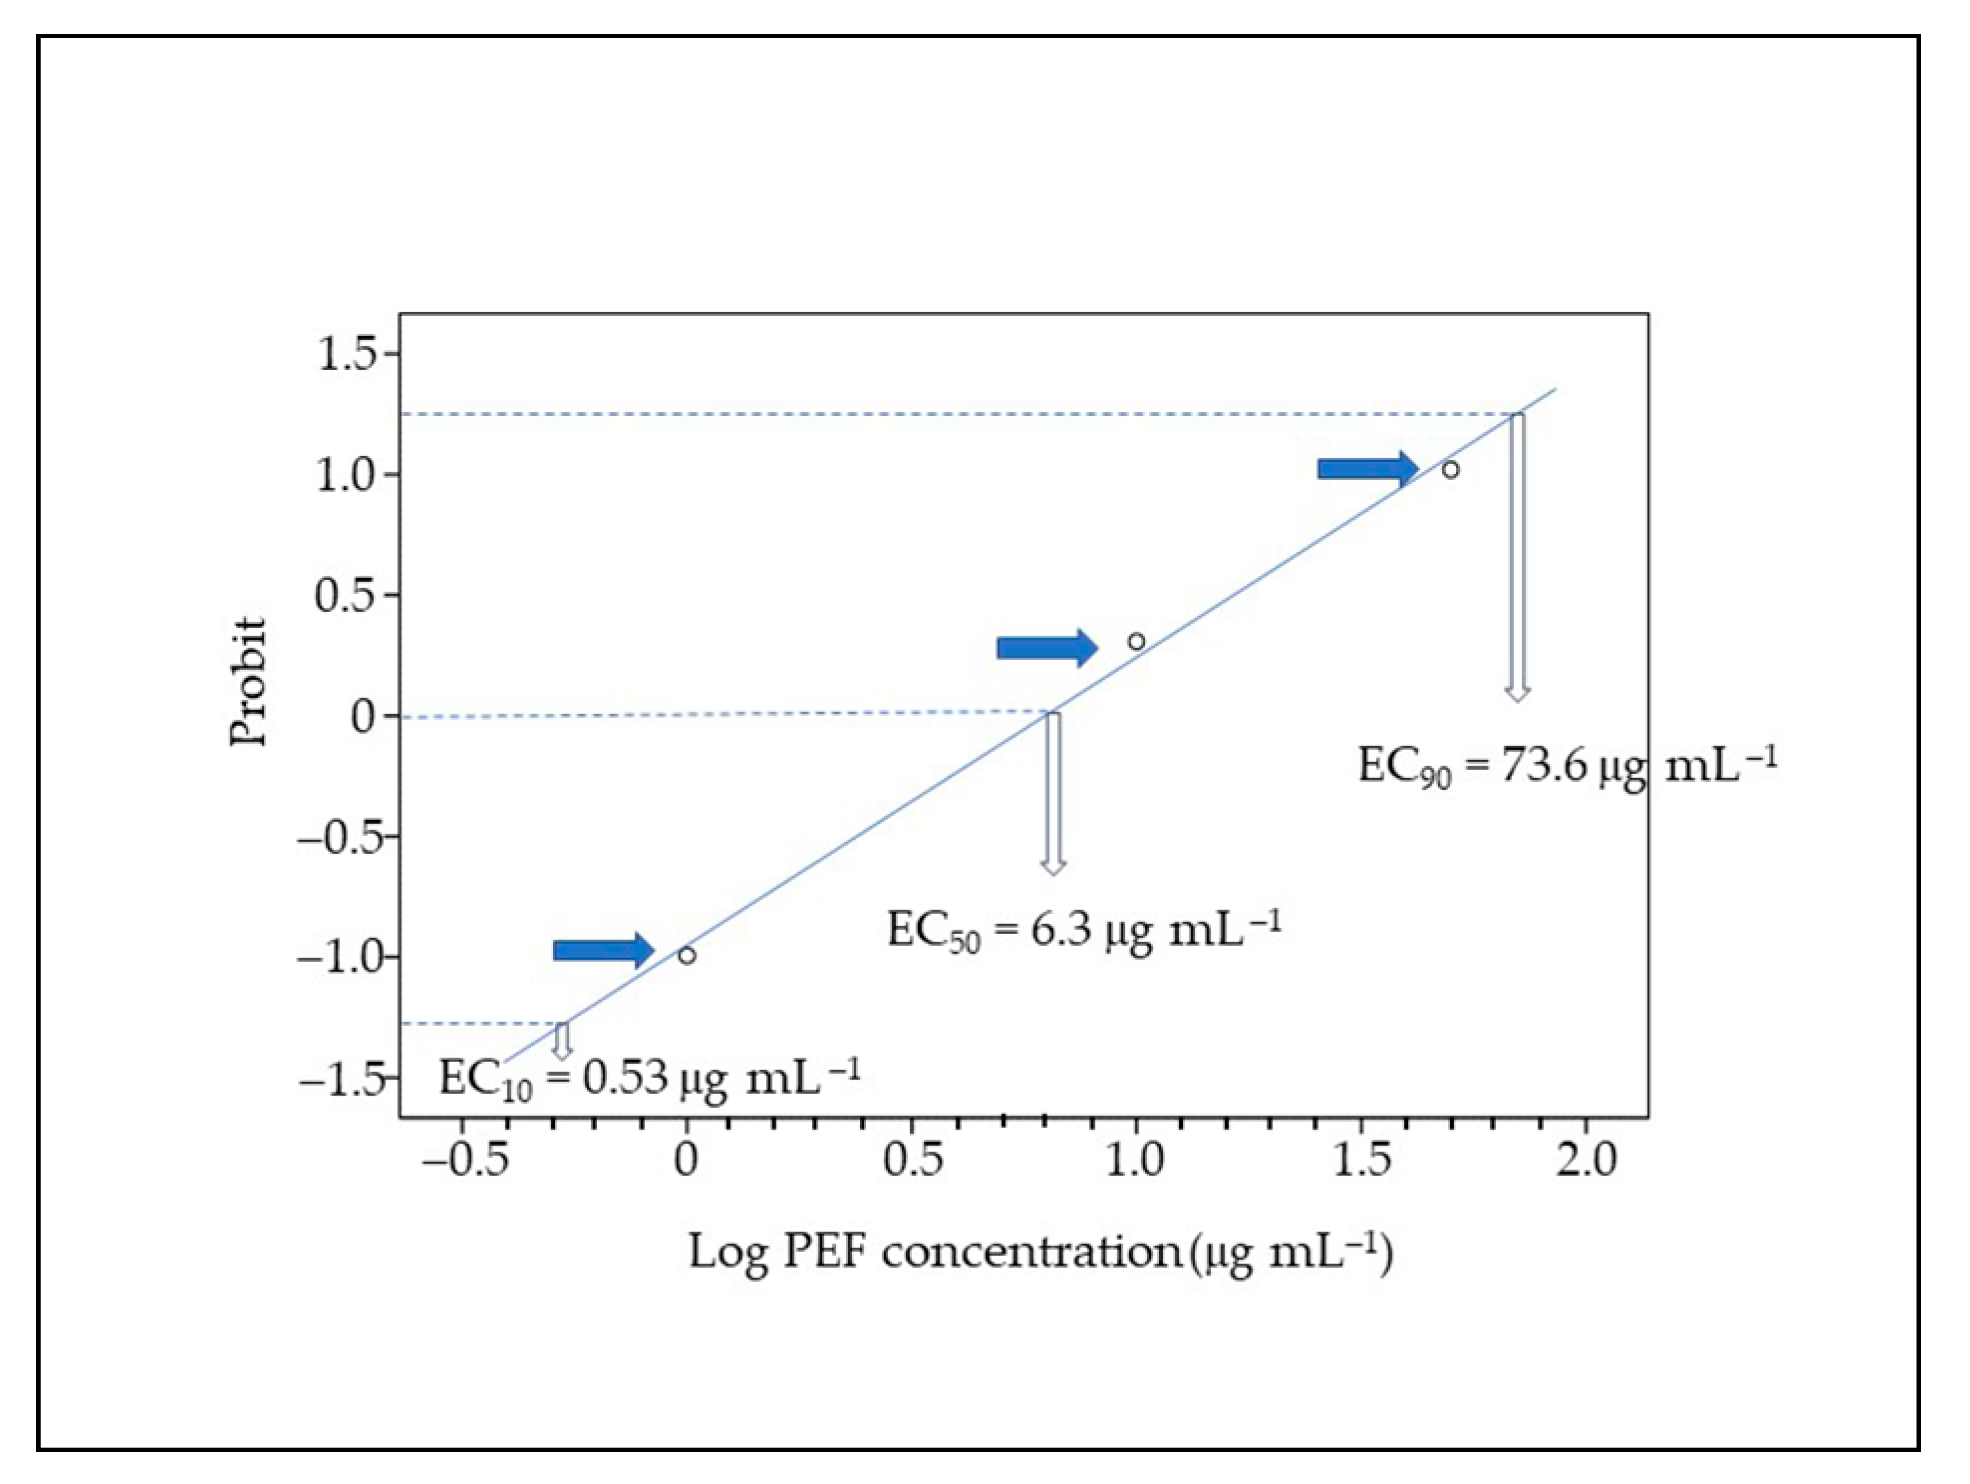
2.4. Statistical Analysis

The effect of PEFs exposure on the swimming activity of larvae was investigated by using χ2 analysis with Yate’s correction for number of case frequencies. Regression analysis was used for testing the percentage of cases swimming more than 200 mm in relation to the PEF concentration and one way-ANOVA for testing the mean speed differences among experimental groups. Malformed frequencies in the treatment groups were tested by using χ2 analysis with Yate’s correction and for pair comparison (treated vs. control) by Fisher’s exact test. EC50 value at 96 h of the abnormal gut coiling was calculated using Log-probit regression analysis. Log regression was preferred due to the best fit (zslope = 4.76; p < 0.001 ***). The non-parametric Kruskal-Wallis test was performed among the mean swimming speed of each larva in relation to the exposure concentrations. All analyses were performed using the SPSS 15.0 statistical software.

3. Results

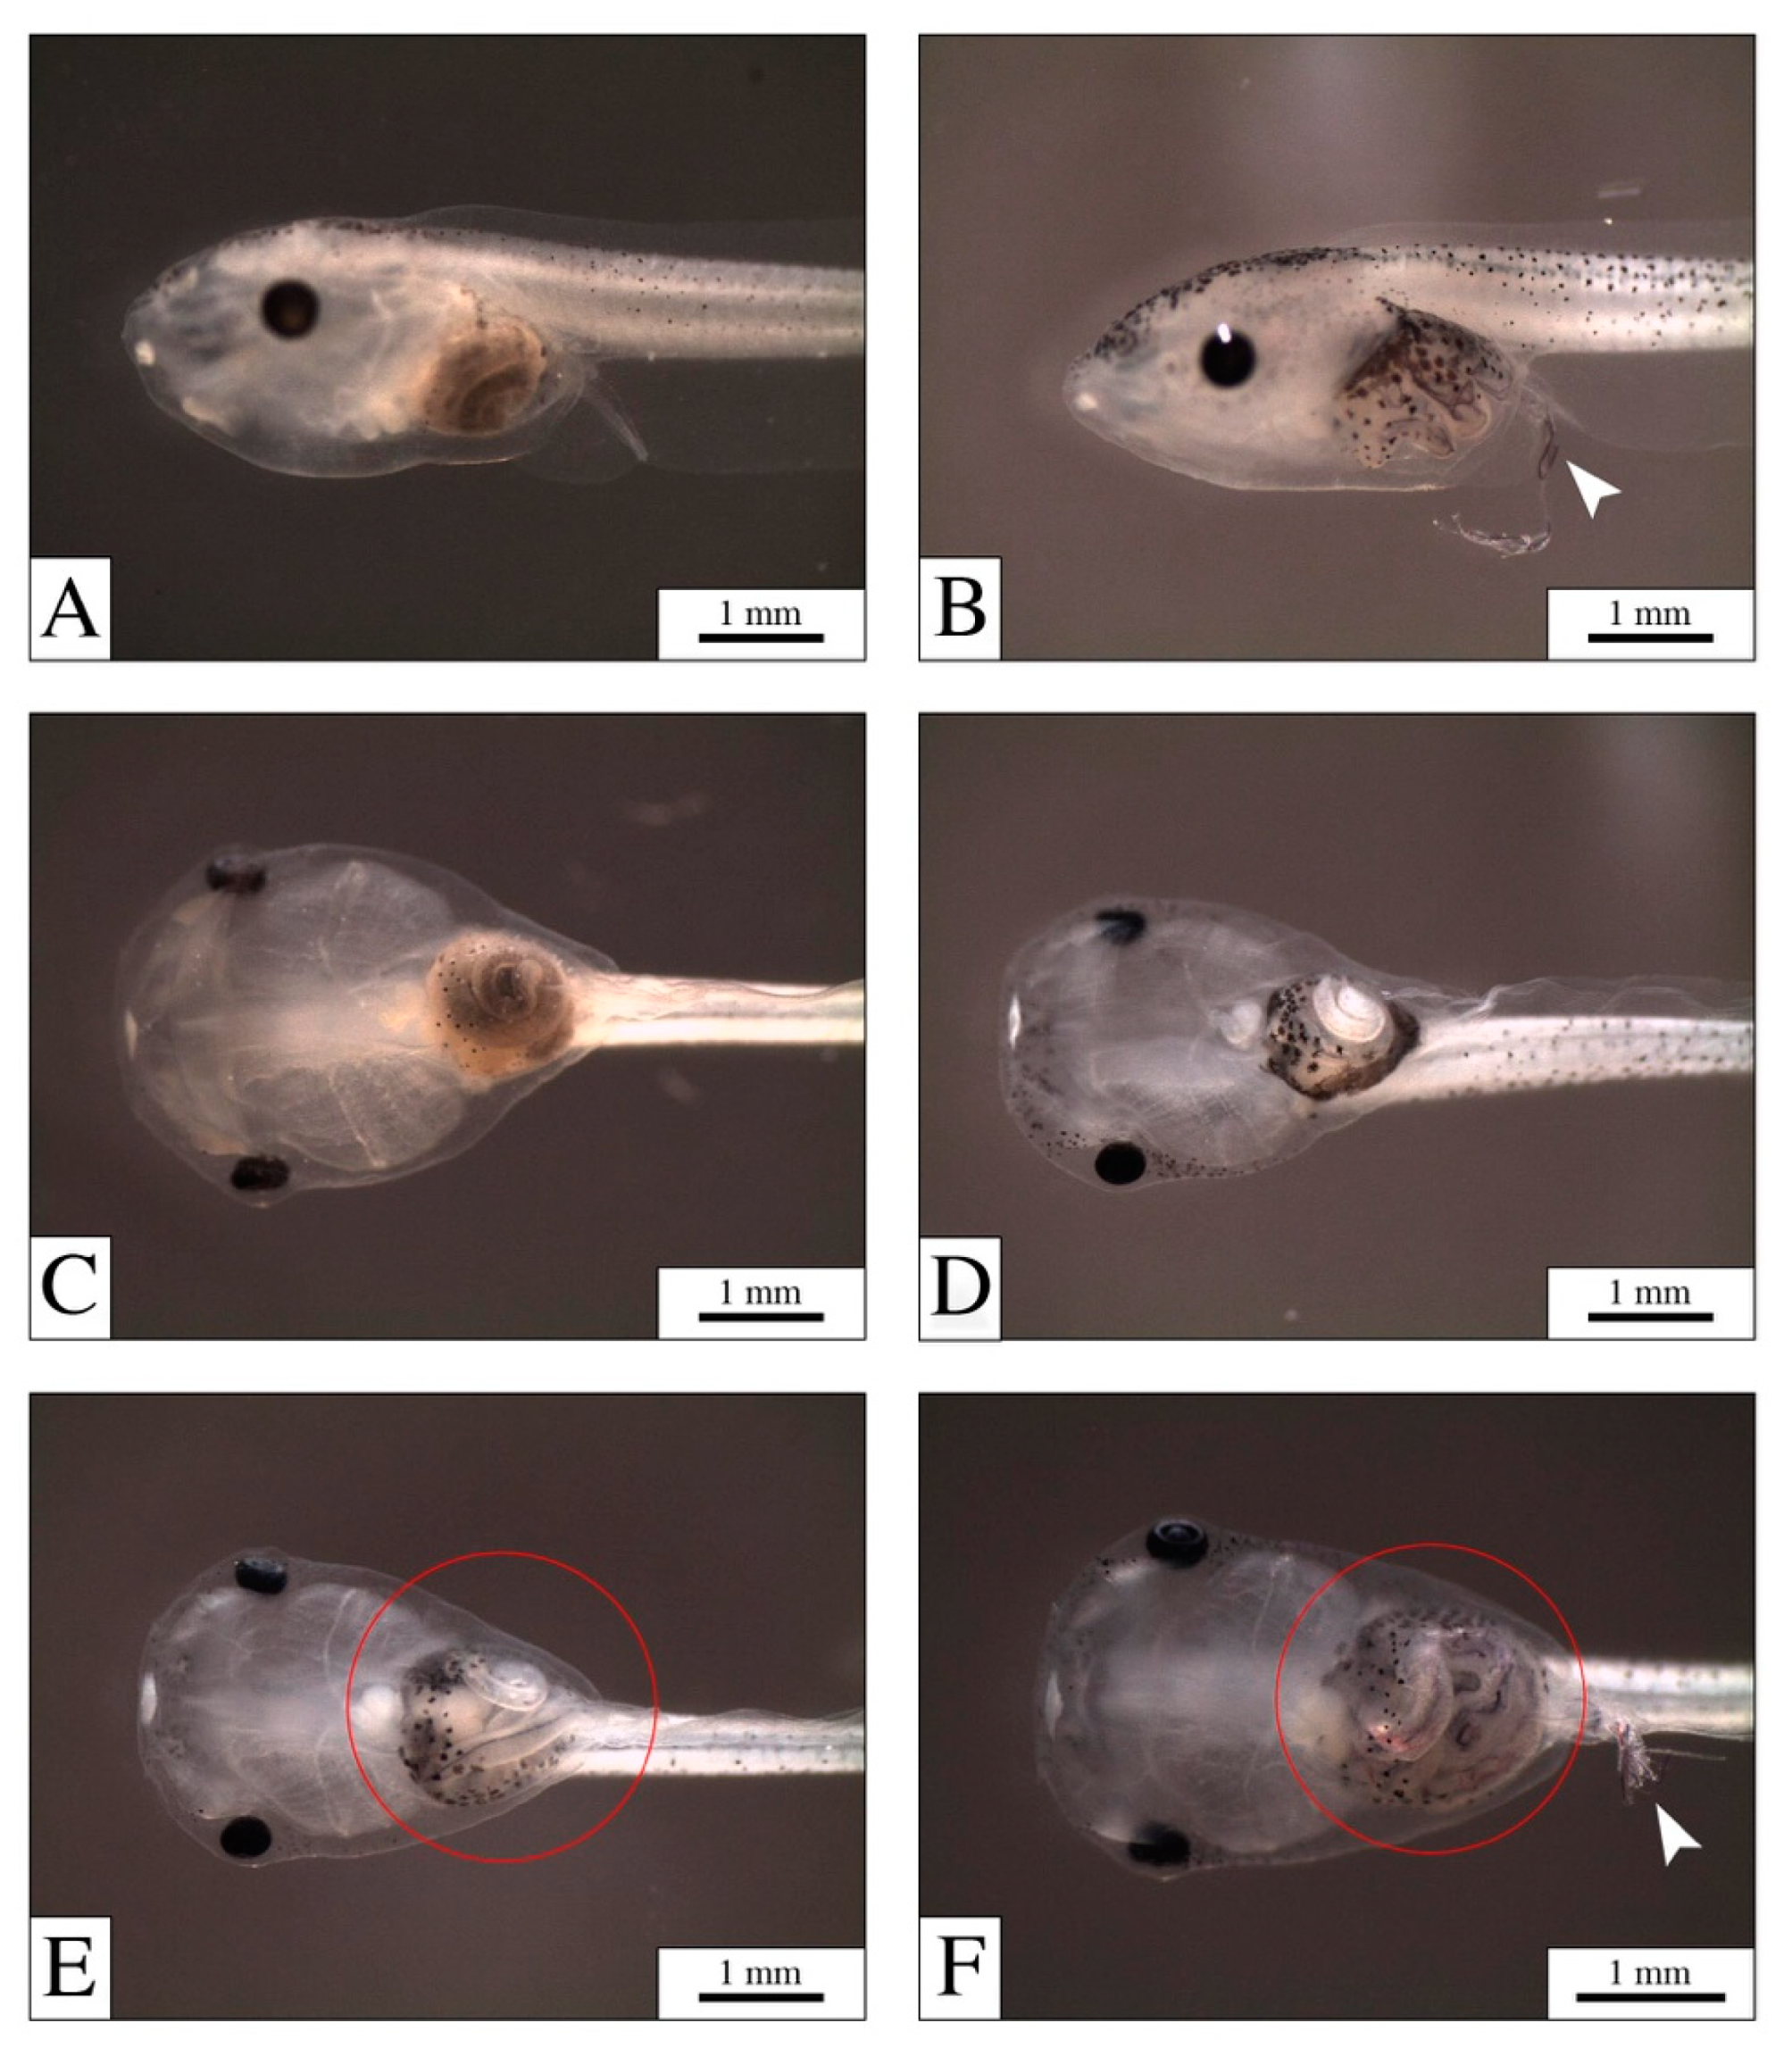
3.1. Mortality, Malformations, and PEF Effects

No mortality was recorded among replicates during the exposure and at the end of the test, and all larvae from controls and PEF-exposed groups reached the NF stage 46 [28] Still, a significant number of guts with abnormal coiling was observed in samples exposed to 10 and 50 µg mL−1 groups (62% and 85%, respectively) in comparison to no cases in the control group (0%) and four cases in 1 µg mL−1 exposed group (16%). Malformed frequencies were significantly affected by the treatment (χ2 with Yate’s correction = 31; p < 0.001 ***), and 50 and 10 µg mL−1 significantly differed from the control (Fisher’s exact test; p < 0.001 *** and p < 0.0022 **, respectively), but not 1 µg mL−1 (Fisher’s exact test; p = 0.30). The EC50 96 h value of 6.3 mg mL−1 for abnormal gut coiling (3.1–11.5 as 95% confidence interval) was calculated by Log-Probit analysis. Although estimated from pooled data, this value should be considered as indicative of the malformations observed at gut level in the PEF exposed groups. The observed frequencies of the gut abnormality coiled as analysed by Log-Probit regression are shown in Figure 2. At the three exposure concentrations (1, 10, 50 µg mL−1), the observed effect frequencies were very well distributed along the dose-response curve, being the 16%, the 62% and the 85% of cases affected by the observed abnormality. For this reason, experimental data were very well approximated by the Log-Probit regression (p < 0.001 ***).
Considering the exposure medium volume of 10 mL, the number of larvae in each Petri dish (10 specimens), and the indicative mass for a fiber of 0.022 mg fiber−1 (see Materials and Methods section for calculation), the number of fibers larva−1 was 286. These fibers had a mean size of 660 µm length, 12 µm width, and 2 µm height, and produced a considered effect in 50% of the population. Clearly, this number must be considered a theoretical estimate. Nevertheless, it can be deduced that a single fiber has no severe impact, ten perhaps, hundreds almost certainly. Especially in the 10 and 50 µg mL−1 groups, the presence of a high number of fibers inside the digestive systems induced irregularly coiled or completely unfolded guts. No other developmental abnormalities were observed. Despite the high number of fibers, at least in the 10 and 50 µg mL−1 groups, no clogging of the branchial openings was observed, and no evident damages to the gill baskets were detected.
The morphological analyses were performed at different levels of detail, beginning with the observation by the stereomicroscope of all the living larvae and then by subjecting them to the standard histopathologic procedures for light microscopy examination. Ten other samples per group, including the control, underwent a more detailed analysis by SEM, allowing the detection of possible damages at the most affected tissues/organs, as indicated by the histological investigations.
Under the stereomicroscope, all samples from 1 µg mL−1 group were very similar to the controls, mainly with a normal gut development (Figure 3). On the contrary, samples from 10 and 50 µg mL−1 groups showed the clear presence of differently colored fibers into their guts (Figure 3B,E,F), and most of them showed an abnormal gut coiling (Figure 3E,F). In some samples from both 10 and 50 µg mL−1 PEFs many fibers were observed partially extruded from the anus or still dangling from it (Figure 3B,F). No other alteration in their external morphology was observed.
The histological analyses confirmed the digestive system as the most affected apparatus, stomach and gut being the preferential sites of PEF accumulation (Figure 4). Indeed, large clusters of PEFs were also observed in samples from 1 µg mL−1 PEF, but in this group, they were less frequent when compared with the morphological pictures observed in samples from 10 and 50 µg mL−1 PEF. Independently from the amount of fibers present in the gut, the cells of the digestive epithelium always showed regularly shaped microvilli organized in a well-defined brush border (Figure 4).
In larvae from all exposed groups, fibers were observed pressing on the digestive epithelium and sometimes deforming the normal architecture of the gut (Figure 4 and Figure 5). In the most affected areas, the stiffness of some fibers within the gut reduced the height of the digestive cells, and sometimes few thin fibers penetrated the epithelium, inducing the rupture or the detachment of adjacent cells (Figure 5A). Only in one sample with the highest PEF concentration was a single fiber observed inside the intestinal wall near the basement membrane, as if the intestine had been pierced by this structure (Figure 5B).
The analyses performed by SEM confirmed what was observed by light microscopy; a very large masse of fibers was found at the two highest concentrations (Figure 6). In one sample from the 50 µg mL−1 group, a long fiber was detected coming out of the body (Figure 7A). However, this condition was not exclusive to the highest PEF concentration, as in another sample from the 10 µg mL−1 group, the gut was pierced by a thin fiber (Figure 7B). No other signs of pain or stress were observed externally, so we devoted our attention to the digestive systems of all the larvae, mainly focusing on the inner portion of their guts, where fibers came into contact with the digestive cells. Masses of intertwined fibers were also observed in some samples exposed to the lowest PEF concentration, although they did not reach the number and size of tangles as observed in the 10 and 50 µg mL−1 groups (Figure 6).
Despite the presence of a large number of differently shaped fibers, no damages to the apical portion of the digestive cells were observed. The epithelium always showed a regular brush border with integer microvilli (Figure 7E,F), and only in a few cases mechanical damages, such as ruptures or interruption, were detected. Interestingly, in samples from the lowest PEF concentration, fibers showed a sort of mucous coating, which we found as empty molds on the inner surface of the intestinal wall (Figure 7C). This coating, which may be of different thicknesses, had the shape and the morphological features of the fiber which was inside. Under the stereomicroscope, it could be manually removed, thus making the fiber free from this “shell” (Figure 7D). These typical structures were never observed in samples from the two highest PEF concentrations, which on the contrary, showed abundant unorganized mucous material among the fibers inside the gut lumen.
Samples from 10 and 50 µg mL−1 groups also showed an impressive number of bacteria onto the fibers (Figure 7G). Sometimes, the microbial species were so abundant that they completely covered the fibers along their total length (Figure 7H). This bacterial encrustation was not observed in samples from 1 µg mL−1 PEFs.

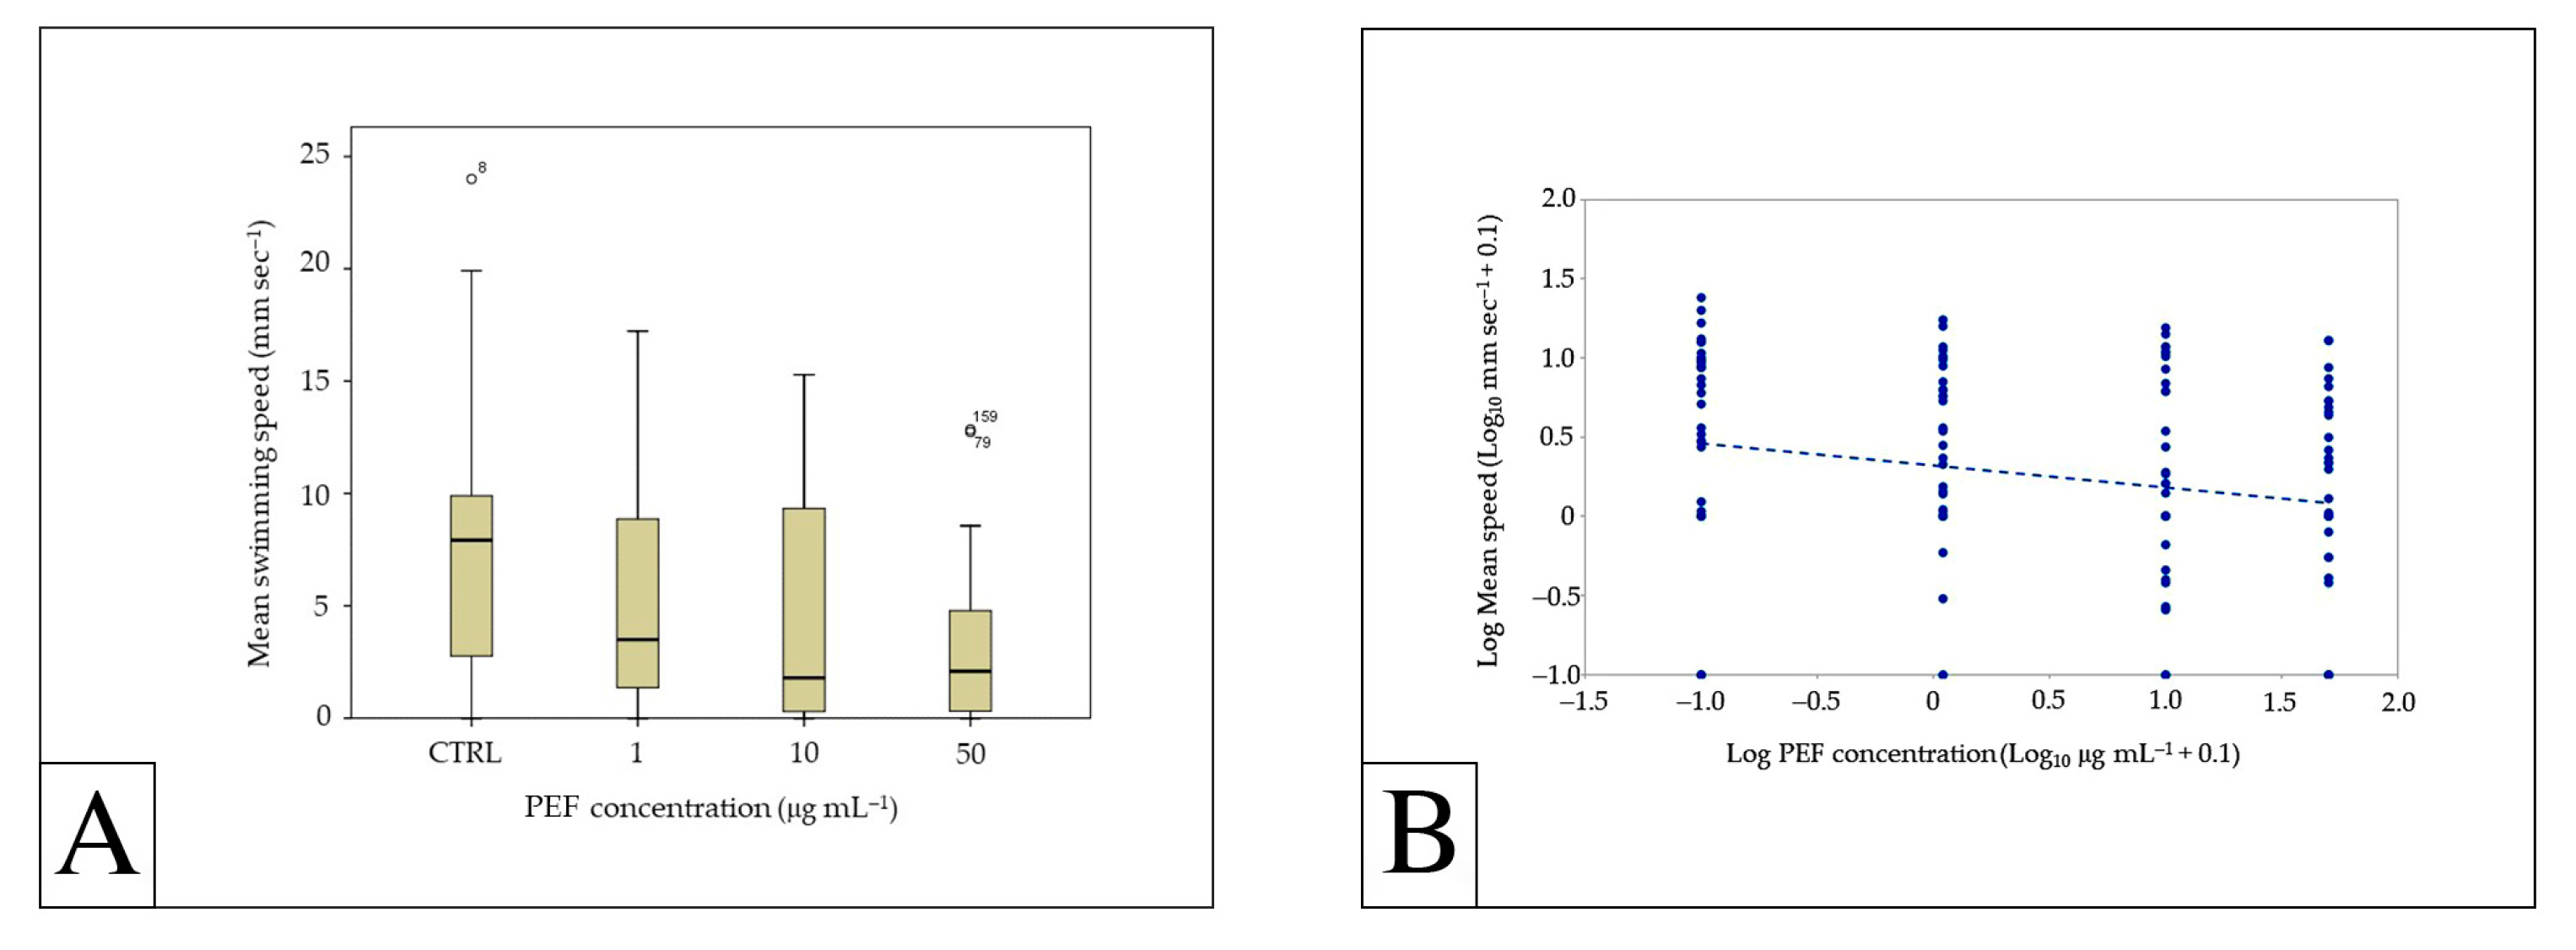
3.2. Effects of PEFs on Swimming Behavior

Table 1 shows the results of the swimming behavior in all groups, control included. Almost all control larvae (95%) spent most of their time in the outer portion of the arena, of which 65% swam for more than 20 s. Among these, seven samples (35%) covered more than 200 mm. Moreover, samples exposed to PEFs spent most of their time in the outer circle of the Petri, but greatly reduced the swimming time and the travelled distance. In fact, at the highest tested concentration (50 µg mL−1) only 20% of the specimens swam for more than 20 sec, and only 5% of them covered more than 200 mm.
Regression analysis showed a significant exponential relationship between the percentage of larvae covering more than 200 mm and the exposure concentrations (y = 27.27 *e−0.035x; R2 = 0.94; p = 0.033).
Box-plot analysis of the distribution of the single swimming speed of each larva in the inner and outer sector of the Petri dish is shown in Figure 8. The regression analysis of the log transformed data confirmed a significant decreasing trend of the mean speed vs. PEF concentration (p = 0.008 **), despite the wide variability of the data. The Kruskal-Wallis test also showed a significant difference of the mean speed in relation to the PEF concentration (χ2 = 9.2; d.f. = 3; p = 0.027 *).
In all groups, control included, about 90% of samples spent less than 5 sec in the inner circle of the arena, swimming for most of the time when in this sector. Anyway, PEF-exposed larvae swam for less time and travelled a lower distance in this circle when compared to controls. For example, at the highest concentration about 90% of the specimens covered less than 25 mm, while in the control group, only 50% of the samples fell in the distance class 0-25 mm.
Mean speed, obtained as the ratio between the distance covered and the time spent in each sector was significantly affected by PEF exposure (one-way ANOVA, F3;114 = 93.9; p = 0.012 *), with the highest mean speed observed in controls (7.3 mm sec−1, CI = 5.2–9.5), and the lowest (3.1 mm sec−1, CI = 1.7–4.5) in the 50 µg mL−1 PEF exposed group. Larvae exposed to 1 and 10 µg mL−1 PEF showed intermediate mean speeds of 5.3 mm sec−1, CI = 3.5–7.1 and 4.6 mm sec−1, CI = 2.6–6.5, respectively. Despite the clear trend, only the comparison between controls and 50 µg mL−1 group resulted statistically significant (Bonferroni post-hoc test, p = 0.007 **).

4. Discussion

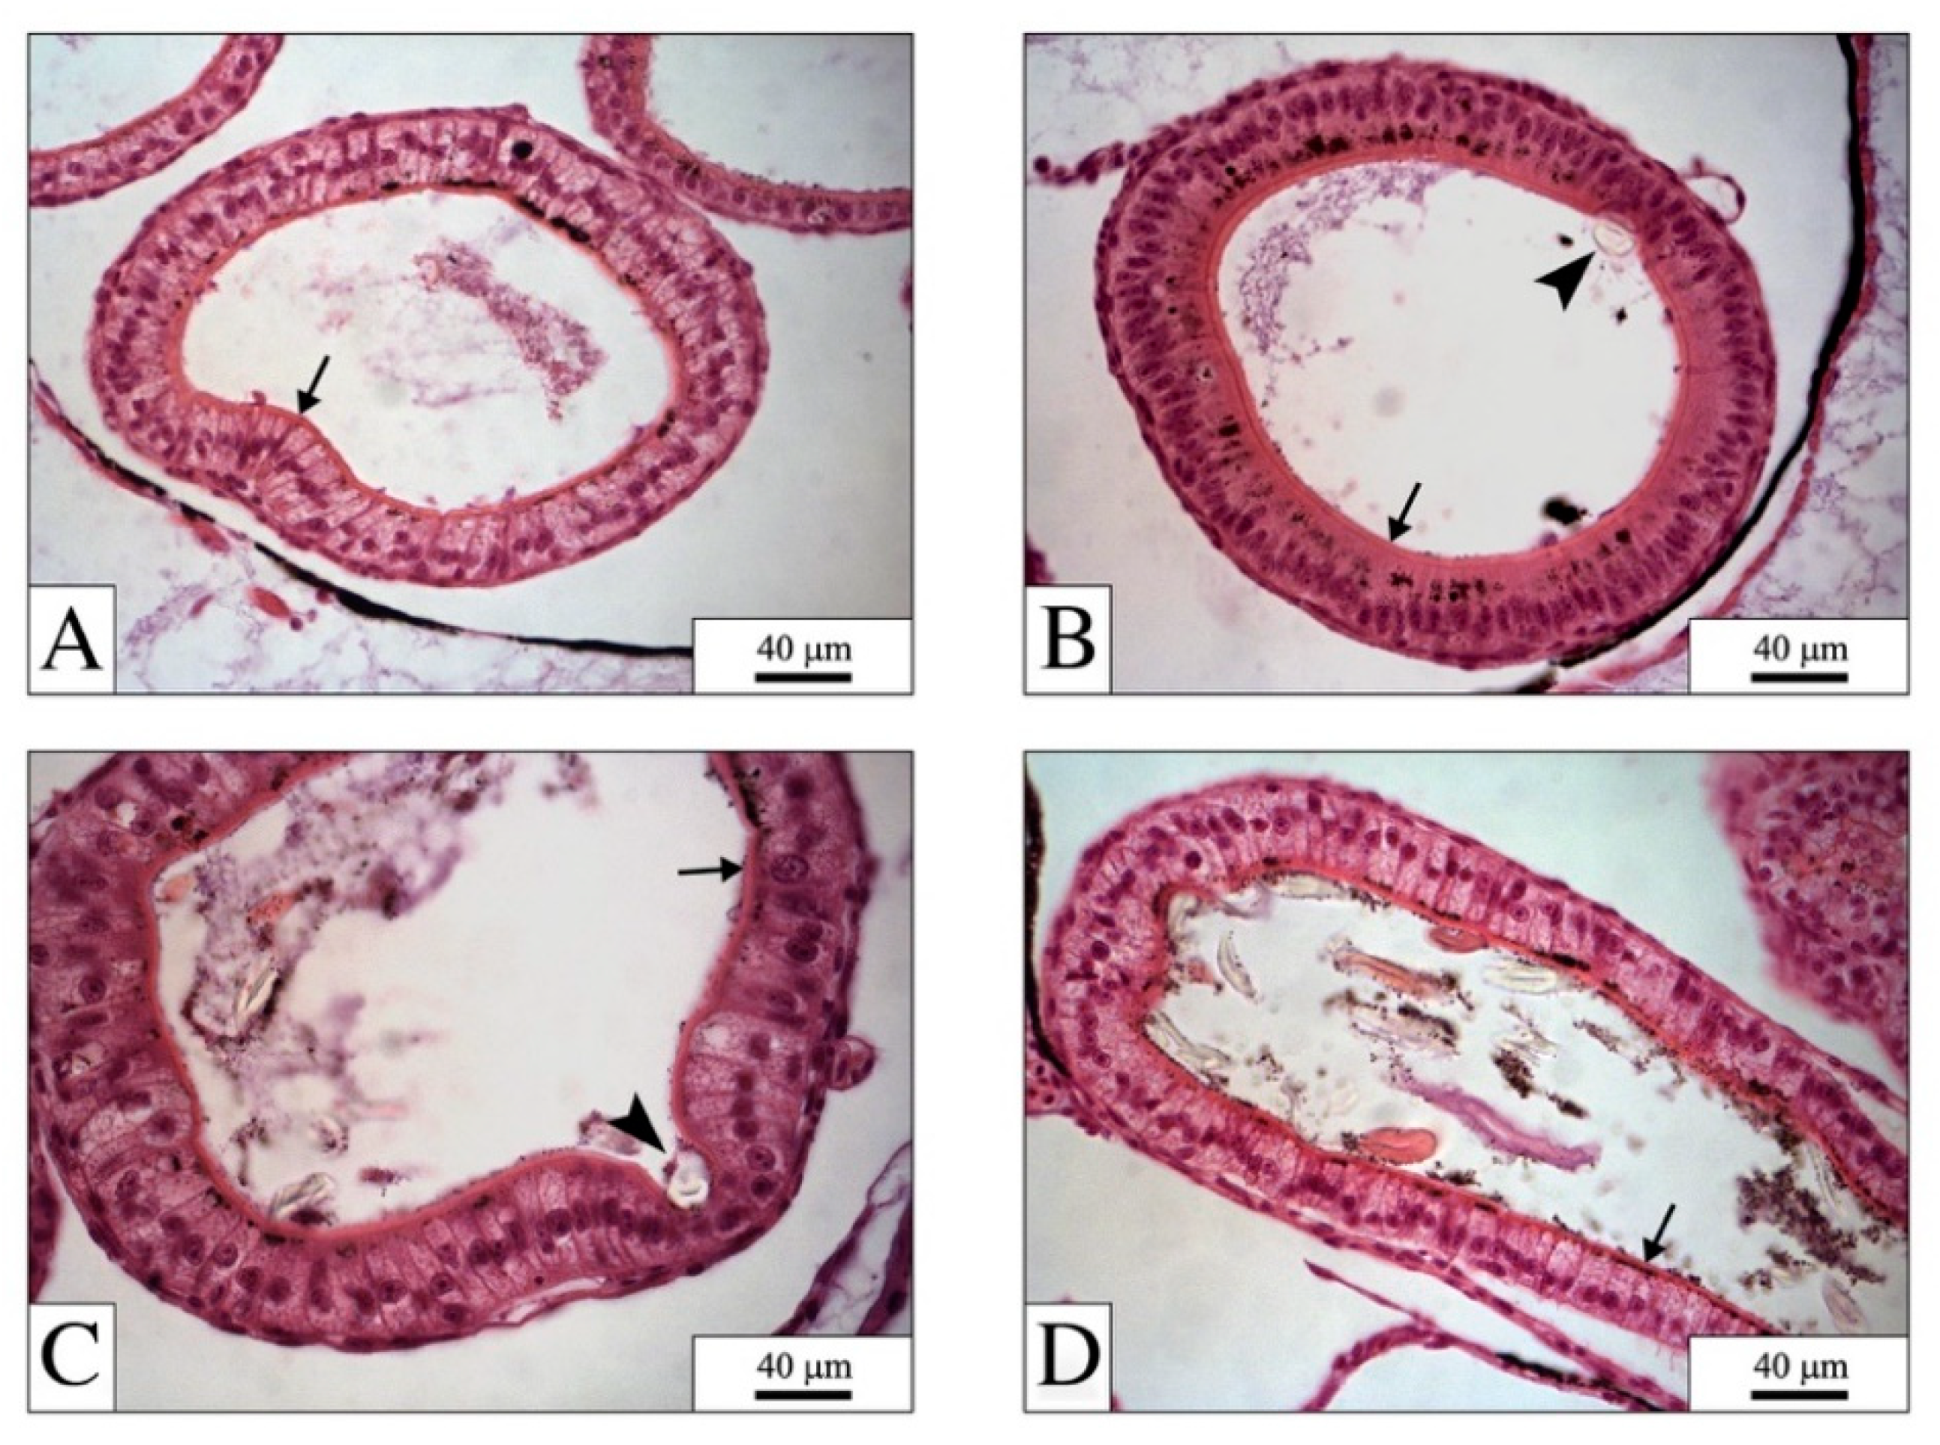
4.1. The Digestive System: The Main Target for PEFs

Results from our paper clearly show that X. laevis easily ingest PEFs and that these can accumulate extensively into the digestive system of the larvae. A general increase in ingested PEFs with increasing concentration was observed, but no mortality was registered at the end of the exposure time, even at the highest PEF concentration. A few cases of a gut full of fibers were also recorded in samples exposed to 1 µg mL−1 PEFs. Comparing the mass of fibers inside the intestine, sometimes no differences were detected between samples from 10 and 50 µg mL−1 PEF groups. Especially at the lowest tested concentration, it seems that not all larvae could find as many PEFs as they could feed on, suggesting a great efficiency of X. laevis larvae in peaking up PEFs, even if their shape and size were not so reliable as an optimal food resource. The length of the fibers, in fact, was up to 3638 µm (average 660 ± 423 µm), nearly approaching the length of a 96 h larva head (about 4 mm). Obviously, the presence of alternative food resources, as it happens in the natural environment, could reduce the strong tendency to ingest PEFs. This issue was already explored by Hu and co-workers [21] who reported that the presence of other food sources reduced MP ingestion, but not entirely eliminated it, demonstrating that MP ingestion can also occur in the presence of alternative food resources. The MP-food selectivity is expected to be highly dependent on many factors such as the species, the developing stage and the MP characteristics, an aspect that should be given priority in further research.
Except for the intestine, where a clear effect on regular coiling was observed (Figure 3), no other tissue/organ resulted affected by PEFs, indicating the digestive system as the preferential target for these materials. It must be considered that in X. laevis developing larvae, the mouth opens at Nieuwkoop and Faber, NF, stage 40 [27], which corresponds to 2 and 18 days post fertilization, pf, at 23 °C, and that our exposure ended at NF stage 46, about 4 days and 10 h pf. This means that larvae could not ingest PEFs for the total exposure time, but only for about 40 h. Nevertheless, all samples from 10 and 50 µg mL−1 PEF groups displayed the gut completely clogged by fibers, as did some samples exposed to the lowest PEF concentration. The EC50 96 h value of 6.3 µg mL−1 and the calculated number of 286 fiber larva−1, indicate that a relatively low number of PEFs can severely affect the digestive system of developing amphibian larvae. We hypothesized that the stiffness of the fibers did not allow their passage out of the intestine, producing strains and even drilling the tissue. Such a hypothesis, of course, needs to be confirmed by further and more detailed studies.

4.2. PEFs in the Gut: Physical Effects

According to Waring et al. our data indicate that PEF adverse effects are mainly due to the physical rather than chemical properties of the fibers [35]. In fact, no damages were observed at the digestive epithelium of larvae exposed to PEFs (no damages to the apical portion of the cells, no cellular detritus inside the gut lumen, no signs of degenerating fields, and no modification in the cell junctions’ integrity was recorded), although there was stretching, thinning, and even piercing of the intestinal wall. The bioresistance and the stiffness of the fibers together with their sharp and pointed edges likely caused the effected recorded both by light and electron microscopy, such as abnormal gut coiling (Figure 3), deformation of the regular shape of the digestive cells and more in general of the digestive wall (Figure 4 and Figure 5) and piercing of the gut and the whole body (Figure 5 and Figure 7).
It is known that shape may influence the toxicity of MPs due to the different retention times, accumulation and physical damage [36]. The higher accumulation capacity of fibers in the gut compared to other shapes of MPs such as fragments or beads was already reported in the literature. Qiao and colleagues in zebrafish reported a shape-dependent accumulation in the gut with the order fibers > fragments > beads [37]. The same authors also reported that the accumulation of MPs caused multiple toxic effects in fish intestine, such as mucosal damage, increased permeability, inflammation, and metabolism disruption. Au et al. [38] and Blarer and Burkhardt-Holm [39] reported that in two amphipod species fibers had longer intestinal residence time and higher mortality than other MP particles. Similarly, Gray and Weinstein reported that in the daggerblade grass shrimp MP fibers had a higher accumulation and stronger acute toxicity than beads and fragments [40].
Despite the wide use of Xenopus sp. in numerous ecotoxicological studies, also aimed at evaluating the toxicity of different kinds of MPs, to our knowledge no data on the effects of MP fibers on X. laevis are available so far. Tussellino and colleagues tested the effects of standard 50 nm-uncoated polystyrene nanoparticles on X. laevis development and found that the embryo mortality rate was dose-dependent and that survived larvae showed a high percentage of malformations. The same authors showed that nanoparticles could enter the digestive cells, suggesting toxic and potential teratogenic effects of these nanomaterials [41]. Hu and co-workers [21] studied the uptake, accumulation, and elimination of 1 and 10 µm polystyrene MPs in X. tropicalis, and also the effects of feeding on these processes and reported the microsphere presence in both the digestive tract and gills within 1 h after exposure. They also reported that once transferred to clean water, fed larvae, differently from those unfed, significantly decreased the amount of absorbed polystyrene particles, concluding that the presence of food decreased the uptake and increased the elimination of microspheres, but they did not consider the possible pathological effects induced by the exposure. More recently, De Felice and colleagues investigated the potential adverse effects induced by spherical polystyrene MP ingestion in X. laevis larvae and found that they easily accumulate in the digestive tract but not in the gills. No pathological effects were observed after the histological examinations of tissues and organs, and no alterations in the normal development or the swimming activity of the larvae were observed. The authors concluded that spherical MP did not affect X. laevis development (at least in the first developmental phases (96 h)) [20].
As already stated above, fibers are known to be more toxic than beads or otherwise shaped MP particles, and our results seem to confirm this (at least during the early phases of development). Since larvae were exposed only for 96 h and the duration of effective PEFs ingestion was only for about 40 h, elimination of PEFs cannot be easily evidenced in such a short time. However, we found evidence of partially eliminated PEFs (Figure 3B,F), but this was only occasionally observed in a few specimens out of tens observed per concentration. Moreover, there is no evidence that samples with partially excreted PEFs successfully eliminated them with certainty. On the contrary, proof of tangled PEFs inside the gut, especially at the highest concentrations (Figure 6), suggest that they could easily be blocked by mechanical retention inside the gut, particularly in correspondence of the intestinal loops, and where the size of the gut lumen decreases. Thus, considering our results (Figure 3, Figure 5, and Figure 7), additional damages induced by fibers during subsequent larval development cannot be excluded as well. However, a clear indication of the toxic effects induced by PEFs in the period considered, also emerges from the analysis of the swimming behavior of the larvae exposed to PEFs, which moved for less time and covered a shorter distance than controls. Our results agree with data from Tosetto et al., who observed a different behavior in the beachhopper Platorchestia smithi exposed to polyethylene microspheres (38–45 µm diameter) [42]. These authors reported a decrease in the jump height in samples treated with MPs when compared to controls. Hypoactivity was also reported in zebrafish after polystyrene nanoplastic exposure [43]. Indeed, data from the literature reported controversial results in zebrafish in which a hyperactivity with increased swimming distance was observed after exposure to polystyrene microplastics [44]. Interestingly, the only paper which considered the swimming activity of X. laevis larvae after MP exposure did not report any difference between exposed groups and controls [20]. Also in this case, we can hypothesize that the differences between results from De Felice and ours could be due to the different shape and size of the used MPs and thus the higher toxicity of fibers compared to beads.

4.3. Side Effects due to PEFs

The high toxicity of PEFs can also be deduced from our results by SEM. The evident mucous coating observed in samples from 1 µg mL−1 PEF (Figure 7C,D) well agree with data from the literature which reported that MPs are known to cause local inflammation in the intestine [35,37,45,46]. As a response to the presence of exogenous materials, the digestive epithelium replies with the production of mucous, which works with double action: (i) forming a first defense line against possible bacterial infection; and (ii) trying to facilitate their elimination via the gastrointestinal tract. Such a response, which is physiologic in every intestine [47], is more evident in the gut of samples exposed to 1 µg mL−1 PEFs, where the material to be incorporated is rather limited in respect to that present in the digestive system of 10 and 50 µg mL−1 PEF-exposed samples. An excessive mucous layer onto the epithelial surface, together with an integer digestive epithelium, was already observed in X. laevis exposed to carbon nanopowder and considered by the authors as a response to a pre-inflammation status induced by the nanoparticle overload [48].
Contrary to the presence of the mucous coating and differently from samples exposed to 10 and 50 µg mL−1 PEF, 1 µg mL−1 PEF-exposed samples did not show any bacteria on the surface of the fibers inside their intestine. In the highest concentrations, the presence of these microbial species was sometimes so pronounced that not even a small area of the fiber surface could be observed (Figure 7H). Interestingly, such a condition has already been described after MP exposure in fish, where MPs induced gut microbiota dysbiosis and specific bacterial alteration [37], and in mammals where mice fed high-concentration polyethylene MPs suffered intestinal dysbacteriosis and inflammation [46]. According to these papers, only high concentrations of MPs could induce such modifications in gut microbiota. This corresponds well with the lack of bacterial encrustation of the fibers observed in the gut of 1 µg mL−1 PEF-exposed sample.

4.4. Future Perspectives

Of course, further studies are needed to better understand the actual risk associated with the presence of PEFs in the aquatic environment, but simple solutions can be easily adopted to minimize the release of fibers from synthetic fabrics released with the wastewater of dryers, for example. Given that PEFs in these machines can be collected from both the exhaust air filter and the wastewater tank, it seems clear that the weakest link is the tank into which the fibers are transferred, ready to be dumped into sewerage system. Regardless of its efficiency, the air filter’ function is to reduce the number of fibers in the atmosphere, and the use of filters with an adequate mesh size can assure a good quality for the exhaust air. In contrast, there is usually no filtration system for the water which enters the wastewater treatment plants without any kind of subsequent filtration. Although wastewater treatment plants can generally eliminate more than 84% of MPs from the water, they are still classified as the major input source of MP fibers to the aquatic environment [49,50]. Specific efficient filters for dryer machines, which are already commercially available, should be installed directly from the manufacturer, and also from any private user, in order to minimizing the input of fibers into the aquatic environment. Such solutions require economic efforts and green policies that should be urgently considered.

5. Conclusions

This study showed for the first time that larvae of the amphibian X. laevis can ingest environmentally relevant microfiber polyesters. Very high numbers of PEF can be taken up resulting in significant effects on their movement, even if the exposure time was very limited. Considering the real time of the exposure (i.e., the time it takes for the mouth to open during regular development), the ingestion of so many PEFs is really imposing and indicates a potential risk for the developing amphibian larvae. Light and electron microscopy investigations on X. laevis larvae showed that ingested PEFs modify the normal shape of the intestines, inducing macro- and microscopic alterations with a calculated EC50 96 h value of 6.3 µg mL−1. Moreover, behavioral effects indicate that the ingestion of PEFs can reduce larval motility, thus impairing their future feeding efficiency. Microscopy observations suggested that fibers can be expulsed through feces. However, the data demonstrate that fibers can obstruct and even pierce the wall of the intestine. We believe that our PEF sample contained fibers that were small enough to be ingested by the developing X. laevis larvae, but larger and stiff enough to be at least partially retained inside the gut and even cause severe effects. This study highlights the potential threat from synthetic fibers released from consumption (washing and drying) of clothes and other fabrics and calls for measures to reduce the release of these fibers into wastewater.

Author Contributions

R.B., conceptualization, methodology, investigation, resources, writing—original draft preparation, writing—review and editing, supervision; N.S., methodology, investigation, resources; A.W., methodology, investigation, writing—review and editing; P.T., conceptualization, methodology, investigation, resources, writing—original draft preparation, writing—review and editing, supervision. All authors have read and agreed to the published version of the manuscript.

Funding

This study was partially funded by the grant FFABR-2018_DIP_033 from the Italian Ministry of Education, University and Research, MIUR, to P.T.

Institutional Review Board Statement

The study was conducted according to the relevant European (EU Directive 2010/63/EU for animal experiments) and Italian (Legislative Decree No. 26/2014) laws, rules, and regulations. All procedures were examined and approved by the Animal Welfare Organisation of the Università degli Studi di Milano. Facility authorization number: 198283; date: 19 December 2019.

Informed Consent Statement

Not applicable.

Data Availability Statement

Data presented in this study are available on request from the corresponding author.

Conflicts of Interest

The authors declare no conflict of interest.

References

  1. Arthur, C.; Baker, J.; Bamford, H. Proceedings of the International Research Workshop on the Occurrence, Effects and Fate of Microplastic Marine Debris. In Proceedings of the International Research Workshop on the Occurrence, Effects and Fate of Microplastic Marine Debris, Tacoma, WA, USA, 9–11 September 2008; NOAA Technical Memorandum NOS-OR&R-30. National Oceanic and Atmospheric Administration (NOAA): Washington, DC, USA, 2009; p. 530. [Google Scholar]
  2. Du, J.; Zhou, Q.; Li, H.; Xu, S.; Wang, C.; Fu, L.; Tang, J. Environmental Distribution, Transport and Ecotoxicity of Microplastics: A Review. J. Appl. Toxicol. 2021, 41, 52–64. [Google Scholar] [CrossRef]
  3. Zhang, Y.; Kang, S.; Allen, S.; Allen, D.; Gao, T.; Sillanpää, M. Atmospheric Microplastics: A Review on Current Status and Perspectives. Earth-Sci. Rev. 2020, 203, 103118. [Google Scholar] [CrossRef]
  4. Duis, K.; Coors, A. Microplastics in the Aquatic and Terrestrial Environment: Sources (with a Specific Focus on Personal Care Products), Fate and Effects. Environ. Sci. Eur. 2016, 28, 2. [Google Scholar] [CrossRef] [PubMed] [Green Version]
  5. Zhang, Y.; Gao, T.; Kang, S.; Sillanpää, M. Importance of Atmospheric Transport for Microplastics Deposited in Remote Areas. Environ. Pollut. 2019, 254, 112953. [Google Scholar] [CrossRef]
  6. Toussaint, B.; Raffael, B.; Angers-Loustau, A.; Gilliland, D.; Kestens, V.; Petrillo, M.; Rio-Echevarria, I.M.; Van den Eede, G. Review of Micro- and Nanoplastic Contamination in the Food Chain. Food Addit. Contam. Part A 2019, 36, 639–673. [Google Scholar] [CrossRef] [PubMed]
  7. Shruti, V.C.; Pérez-Guevara, F.; Elizalde-Martínez, I.; Kutralam-Muniasamy, G. First Study of Its Kind on the Microplastic Contamination of Soft Drinks, Cold Tea and Energy Drinks—Future Research and Environmental Considerations. Sci. Total Environ. 2020, 726, 138580. [Google Scholar] [CrossRef]
  8. Baldwin, A.K.; Corsi, S.R.; Mason, S.A. Plastic Debris in 29 Great Lakes Tributaries: Relations to Watershed Attributes and Hydrology. Environ. Sci. Technol. 2016, 50, 10377–10385. [Google Scholar] [CrossRef]
  9. Miller, R.Z.; Watts, A.J.R.; Winslow, B.O.; Galloway, T.S.; Barrows, A.P.W. Mountains to the Sea: River Study of Plastic and Non-Plastic Microfiber Pollution in the Northeast USA. Mar. Pollut. Bull. 2017, 124, 245–251. [Google Scholar] [CrossRef]
  10. Henry, B.; Laitala, K.; Klepp, I.G. Microfibres from Apparel and Home Textiles: Prospects for Including Microplastics in Environmental Sustainability Assessment. Sci. Total Environ. 2019, 652, 483–494. [Google Scholar] [CrossRef] [PubMed]
  11. Rebelein, A.; Int-Veen, I.; Kammann, U.; Scharsack, J.P. Microplastic Fibers—Underestimated Threat to Aquatic Organisms? Sci. Total Environ. 2021, 777, 146045. [Google Scholar] [CrossRef] [PubMed]
  12. Belzagui, F.; Gutiérrez-Bouzán, C.; Álvarez-Sánchez, A.; Vilaseca, M. Textile Microfibers Reaching Aquatic Environments: A New Estimation Approach. Environ. Pollut. 2020, 265, 114889. [Google Scholar] [CrossRef]
  13. Browne, M.A.; Crump, P.; Niven, S.J.; Teuten, E.; Tonkin, A.; Galloway, T.; Thompson, R. Accumulation of Microplastic on Shorelines Woldwide: Sources and Sinks. Environ. Sci. Technol. 2011, 45, 9175–9179. [Google Scholar] [CrossRef]
  14. De Falco, F.; Gullo, M.P.; Gentile, G.; Di Pace, E.; Cocca, M.; Gelabert, L.; Brouta-Agnésa, M.; Rovira, A.; Escudero, R.; Villalba, R.; et al. Evaluation of Microplastic Release Caused by Textile Washing Processes of Synthetic Fabrics. Environ. Pollut. 2018, 236, 916–925. [Google Scholar] [CrossRef]
  15. Napper, I.E.; Thompson, R.C. Release of Synthetic Microplastic Plastic Fibres from Domestic Washing Machines: Effects of Fabric Type and Washing Conditions. Mar. Pollut. Bull. 2016, 112, 39–45. [Google Scholar] [CrossRef] [Green Version]
  16. O’Brien, S.; Okoffo, E.D.; O’Brien, J.W.; Ribeiro, F.; Wang, X.; Wright, S.L.; Samanipour, S.; Rauert, C.; Toapanta, T.Y.A.; Albarracin, R.; et al. Airborne Emissions of Microplastic Fibres from Domestic Laundry Dryers. Sci. Total Environ. 2020, 747, 141175. [Google Scholar] [CrossRef]
  17. Kapp, K.J.; Miller, R.Z. Electric Clothes Dryers: An Underestimated Source of Microfiber Pollution. PLoS ONE 2020, 15, e0239165. [Google Scholar] [CrossRef]
  18. Boyero, L.; López-Rojo, N.; Bosch, J.; Alonso, A.; Correa-Araneda, F.; Pérez, J. Microplastics Impair Amphibian Survival, Body Condition and Function. Chemosphere 2020, 244, 125500. [Google Scholar] [CrossRef]
  19. da Costa Araújo, A.P.; Gomes, A.R.; Malafaia, G. Hepatotoxicity of Pristine Polyethylene Microplastics in Neotropical Physalaemus cuvieri Tadpoles (Fitzinger, 1826). J. Hazard. Mater. 2020, 386, 121992. [Google Scholar] [CrossRef] [PubMed]
  20. De Felice, B.; Bacchetta, R.; Santo, N.; Tremolada, P.; Parolini, M. Polystyrene Microplastics Did Not Affect Body Growth and Swimming Activity in Xenopus laevis Tadpoles. Environ. Sci. Pollut. Res. 2018, 25, 34644–34651. [Google Scholar] [CrossRef] [PubMed]
  21. Hu, L.; Chernick, M.; Hinton, D.E.; Shi, H. Microplastics in Small Waterbodies and Tadpoles from Yangtze River Delta, China. Environ. Sci. Technol. 2018, 52, 8885–8893. [Google Scholar] [CrossRef] [PubMed]
  22. Hu, L.; Su, L.; Xue, Y.; Mu, J.; Zhu, J.; Xu, J.; Shi, H. Uptake, Accumulation and Elimination of Polystyrene Microspheres in Tadpoles of Xenopus tropicalis. Chemosphere 2016, 164, 611–617. [Google Scholar] [CrossRef]
  23. Stuart, S.N.; Chanson, J.S.; Cox, N.A.; Young, B.E.; Rodrigues, A.S.L.; Fischman, D.L.; Waller, R.W. Status and Trends of Amphibian Declines and Extinctions Worldwide. Science 2004, 306, 1783–1786. [Google Scholar] [CrossRef] [PubMed] [Green Version]
  24. Bacchetta, R.; Santo, N.; Fascio, U.; Moschini, E.; Freddi, S.; Chirico, G.; Camatini, M.; Mantecca, P. Nano-Sized CuO, TiO2 and ZnO Affect Xenopus laevis Development. Nanotoxicology 2012, 6, 381–398. [Google Scholar] [CrossRef] [PubMed]
  25. Bantle, J.A.; Fort, D.J.; Rayburn, J.R.; Deyoung, D.J.; Bush, S.J. Further Validation of FETAX: Evaluation of the Developmental Toxicity of Five Known Mammalian Teratogens and Non-Teratogens. Drug Chem. Toxicol. 1990, 13, 267–282. [Google Scholar] [CrossRef] [PubMed]
  26. Dumont, J.N.; Schultz, T.W.; Buchanan, M.V.; Kao, G.L. Frog Embryo Teratogenesis Assay: Xenopus (FETAX)—A Short-Term Assay Applicable to Complex Environmental Mixtures. In Short-Term Bioassays in the Analysis of Complex Environmental Mixtures III; Waters, M.D., Sandhu, S.S., Lewtas, J., Claxton, L., Chernoff, N., Nesnow, S., Eds.; Environmental Science Research; Springer US: Boston, MA, USA, 1983; pp. 393–405. ISBN 978-1-4613-3611-2. [Google Scholar]
  27. Hoke, R.A.; Ankley, G.T. Application of Frog Embryo Teratogenesis Assay-Xenopus to Ecological Risk Assessment. Environ. Toxicol. Chem. 2005, 24, 2677–2690. [Google Scholar] [CrossRef]
  28. Nieuwkoop, P.D.; Faber, J. Normal Table of Xenopus Laevis (Daudin): A Systematical and Chronological Survey of the Development from the Fertilized Egg till the End of Metamorphosis; Garland Pub.: New York, NY, USA, 1994; ISBN 978-0-8153-1896-5. [Google Scholar]
  29. Winkler, A.; Santo, N.; Ortenzi, M.A.; Bolzoni, E.; Bacchetta, R.; Tremolada, P. Does Mechanical Stress Cause Microplastic Release from Plastic Water Bottles? Water Res. 2019, 166, 115082. [Google Scholar] [CrossRef]
  30. Schmidt, C.; Kumar, R.; Yang, S.; Büttner, O. Microplastic Particle Emission from Wastewater Treatment Plant Effluents into River Networks in Germany: Loads, Spatial Patterns of Concentrations and Potential Toxicity. Sci. Total Environ. 2020, 737, 139544. [Google Scholar] [CrossRef]
  31. Wang, Z.; Zhang, Y.; Kang, S.; Yang, L.; Shi, H.; Tripathee, L.; Gao, T. Research Progresses of Microplastic Pollution in Freshwater Systems. Sci. Total Environ. 2021, 795, 148888. [Google Scholar] [CrossRef]
  32. Weber, A.; von Randow, M.; Voigt, A.-L.; von der Au, M.; Fischer, E.; Meermann, B.; Wagner, M. Ingestion and Toxicity of Microplastics in the Freshwater Gastropod Lymnaea stagnalis: No Microplastic-Induced Effects Alone or in Combination with Copper. Chemosphere 2021, 263, 128040. [Google Scholar] [CrossRef] [PubMed]
  33. Gulyás, M.; Bencsik, N.; Pusztai, S.; Liliom, H.; Schlett, K. AnimalTracker: An ImageJ-Based Tracking API to Create a Customized Behaviour Analyser Program. Neuroinformatics 2016, 14, 479–481. [Google Scholar] [CrossRef]
  34. Schneider, C.A.; Rasband, W.S.; Eliceiri, K.W. NIH Image to ImageJ: 25 Years of Image Analysis. Nat. Methods 2012, 9, 671–675. [Google Scholar] [CrossRef]
  35. Waring, R.H.; Harris, R.M.; Mitchell, S.C. Plastic Contamination of the Food Chain: A Threat to Human Health? Maturitas 2018, 115, 64–68. [Google Scholar] [CrossRef]
  36. Jemec, A.; Horvat, P.; Kunej, U.; Bele, M.; Kržan, A. Uptake and Effects of Microplastic Textile Fibers on Freshwater Crustacean Daphnia Magna Environ. Pollut. 2016, 219, 201–209. [Google Scholar] [CrossRef] [PubMed]
  37. Qiao, R.; Deng, Y.; Zhang, S.; Wolosker, M.B.; Zhu, Q.; Ren, H.; Zhang, Y. Accumulation of Different Shapes of Microplastics Initiates Intestinal Injury and Gut Microbiota Dysbiosis in the Gut of Zebrafish. Chemosphere 2019, 236, 124334. [Google Scholar] [CrossRef] [PubMed]
  38. Au, S.Y.; Lee, C.M.; Weinstein, J.E.; Hurk, P.; van den Klaine, S.J. Trophic Transfer of Microplastics in Aquatic Ecosystems: Identifying Critical Research Needs. Integr. Environ. Assess. Manag. 2017, 13, 505–509. [Google Scholar] [CrossRef]
  39. Blarer, P.; Burkhardt-Holm, P. Microplastics Affect Assimilation Efficiency in the Freshwater Amphipod Gammarus fossarum. Environ. Sci. Pollut. Res. 2016, 23, 23522–23532. [Google Scholar] [CrossRef] [PubMed]
  40. Gray, A.D.; Weinstein, J.E. Size- and Shape-Dependent Effects of Microplastic Particles on Adult Daggerblade Grass Shrimp (Palaemonetes pugio). Environ. Toxicol. Chem. 2017, 36, 3074–3080. [Google Scholar] [CrossRef] [PubMed]
  41. Tussellino, M.; Ronca, R.; Formiggini, F.; Marco, N.D.; Fusco, S.; Netti, P.A.; Carotenuto, R. Polystyrene Nanoparticles Affect Xenopus laevis Development. J. Nanopart. Res. 2015, 17, 70. [Google Scholar] [CrossRef]
  42. Tosetto, L.; Brown, C.; Williamson, J.E. Microplastics on Beaches: Ingestion and Behavioural Consequences for Beachhoppers. Mar. Biol. 2016, 163, 199. [Google Scholar] [CrossRef]
  43. Chen, Q.; Gundlach, M.; Yang, S.; Jiang, J.; Velki, M.; Yin, D.; Hollert, H. Quantitative Investigation of the Mechanisms of Microplastics and Nanoplastics toward Zebrafish Larvae Locomotor Activity. Sci. Total Environ. 2017, 584–585, 1022–1031. [Google Scholar] [CrossRef]
  44. Chen, Q.; Lackmann, C.; Wang, W.; Seiler, T.-B.; Hollert, H.; Shi, H. Microplastics Lead to Hyperactive Swimming Behaviour in Adult Zebrafish. Aquat. Toxicol. 2020, 224, 105521. [Google Scholar] [CrossRef] [PubMed]
  45. Ferraz, M.; Bauer, A.L.; Valiati, V.H.; Schulz, U.H. Microplastic Concentrations in Raw and Drinking Water in the Sinos River, Southern Brazil. Water 2020, 12, 3115. [Google Scholar] [CrossRef]
  46. Li, B.; Ding, Y.; Cheng, X.; Sheng, D.; Xu, Z.; Rong, Q.; Wu, Y.; Zhao, H.; Ji, X.; Zhang, Y. Polyethylene Microplastics Affect the Distribution of Gut Microbiota and Inflammation Development in Mice. Chemosphere 2020, 244, 125492. [Google Scholar] [CrossRef] [PubMed]
  47. Pelaseyed, T.; Bergström, J.H.; Gustafsson, J.K.; Ermund, A.; Birchenough, G.M.H.; Schütte, A.; van der Post, S.; Svensson, F.; Rodríguez-Piñeiro, A.M.; Nyström, E.E.L.; et al. The Mucus and Mucins of the Goblet Cells and Enterocytes Provide the First Defense Line of the Gastrointestinal Tract and Interact with the Immune System. Immunol. Rev. 2014, 260, 8–20. [Google Scholar] [CrossRef] [Green Version]
  48. Bacchetta, R.; Tremolada, P.; Di Benedetto, C.; Santo, N.; Fascio, U.; Chirico, G.; Colombo, A.; Camatini, M.; Mantecca, P. Does Carbon Nanopowder Threaten Amphibian Development? Carbon 2012, 50, 4607–4618. [Google Scholar] [CrossRef]
  49. Gies, E.A.; LeNoble, J.L.; Noël, M.; Etemadifar, A.; Bishay, F.; Hall, E.R.; Ross, P.S. Retention of Microplastics in a Major Secondary Wastewater Treatment Plant in Vancouver, Canada. Mar. Pollut. Bull. 2018, 133, 553–561. [Google Scholar] [CrossRef]
  50. Magni, S.; Binelli, A.; Pittura, L.; Avio, C.G.; Della Torre, C.; Parenti, C.C.; Gorbi, S.; Regoli, F. The Fate of Microplastics in an Italian Wastewater Treatment Plant. Sci. Total Environ. 2019, 652, 602–610. [Google Scholar] [CrossRef]
Figure 1. SEM image of two PEFs (upper panel) with the indication of the points in which the EDS analyses have been performed. The middle and the lower panels show the resulting spectra: ribbon-like PEF (middle panel) lower PEF (lower panel).
Water 13 03446 g001
Figure 2. Log-Probit regression of the frequencies of the gut abnormality coiled as observed at the three exposure concentrations (blue arrows) and EC10, EC50 and EC90 values (empty arrows) calculated by the regression: y = 1.197; x = 0.953; n = 3; zslope = 4.8, p < 0.001.
Water 13 03446 g002
Figure 3. Xenopus laevis larvae at NF stage 46 (96 hpf). (A) Lateral view of a control sample. (B) Lateral view of a larva exposed to 50 µg mL−1 PEFs showing some fibers partially expelled from the anus (white arrowhead). (C) Ventral view of a control larva. (D) Ventral view of a larva exposed to 1 µg mL−1 PEFs with an almost regular gut coiling. (E,F) Ventral view of a 10 and 50 µg mL−1 PEF-exposed larva showing abnormal gut coiling (red circle).
Water 13 03446 g003
Figure 4. Histological sections of X. laevis larvae at NF stage 46 (96 hpf). (A) Intestinal loop from a control sample. (B) Intestinal loop from a 1 µg mL−1 PEF-exposed larva with a fiber (black arrowhead) leaning on the digestive epithelium. (C) Intestinal loop from a 10 µg mL−1 PEF-exposed larva with a fiber (black arrowhead) partially embedded into the digestive epithelium. (D) Intestinal loop from 50 µg mL−1 PEF-exposed larva showing the wide presence of PEFs inside the gut lumen. Black arrow = brush border.
Water 13 03446 g004
Figure 5. Histological sections of the intestinal loops from X. laevis larvae at NF stage 46 (96 hpf). (A) Larva exposed to 10 µg mL1 PEF showing the deformation of the intestinal wall due to the presence of two fibers (black arrowhead), together with a thin fiber sneaking among the cells of the digestive epithelium (white arrow). (B) Larva exposed to 50 µg mL1 PEF showing a fiber that pierced the digestive epithelium, near the basement membrane (white arrowhead).
Water 13 03446 g005
Figure 6. SEM images of the intestine from 96 h-old X. laevis larvae. (A) Control larva. (B) Larva exposed to 1 µg mL−1 PEFs. (C) Larva exposed to 10 µg mL−1 PEFs. (D) Larva exposed to 50 µg mL−1 PEFs. Note the increased presence of fibers inside the gut lumen with increasing PEF concentration.
Water 13 03446 g006
Figure 7. SEM images from 96 h-old X. laevis larvae. (A) External view of a larva exposed to 50 µg mL−1 PEFs with a fiber pierced into the body wall. (B) External view of a dissected intestine from a 10 µg mL−1 PEF-exposed larva showing a fiber (white arrowhead) partially extruded from the intestinal wall. (C) Sagittal section of the small intestine from a 1 µg mL−1 PEF-exposed sample showing the lower portion of a mucous coating coming from a detached fiber (black arrowheads) onto the gut inner surface. (D) A partially peeled fiber (white arrowhead) from a 1 µg mL−1 PEF-exposed sample. (E,F) Details of the apical portion of the digestive cells from a control (E) and a 50 µg mL−1 PEF-exposed sample (F), both showing a regular brush border. Black arrow = basal portion of the microvilli. (G,H) Details of fibers partially (G) or completely encrusted by bacteria (H) in a 50 and 10 µg mL−1 PEF-exposed sample, respectively.
Water 13 03446 g007
Figure 8. Box-plot of the mean swimming speed of each larva in the inner and outer sector of the Petri dish in relation to the PEF concentration (A) and linear regression of the Log transformed mean swimming speed of each larva in the inner and outer sector of the petri in relation to the Log transformed PEF concentration (B); regression equation and parameters: y = −0.169x + 0.42; n = 118; R2 = 0.06; p = 0.008.
Water 13 03446 g008
Table 1. Number (N) and percentage (%) of larvae which spent 0–10 s, >10–20 s, and >20–30 s in the inner or outer part of the Petri dish (Total time); those which did not move for 0–10 s, >10–20 s, and >20–30 s in the inner and outer part of the Petri dish (Immobilization time), and those which travelled for a total distance of 0–100, >100–200, and >200 mm in the two sectors (Distance travelled).
TreatmentTotal TimeImmobilization TimeDistance Travelled
TimeInner PartOuter PartTimeInner PartOuter PartDistanceInner PartOuter Part
SecN%N%SecN%N%mmN%N%
CTRL0–101995000–10201009450–100201001260
>10–201515.0>10–2000420>100–2000015.0
>20–30001995>20–3000735>20000735
Total2010020100Total2010020100Total2010020100
1 μg mL−10–1020100000–10201005250–100201001260
>10–200000>10–2000735>100–20000315
>20–300020100>20–3000840>20000525
Total2010020100Total2010020100Total2010020100
10 μg mL−10–101785000–10201005250–10018901470
>10–20315315>10–2000525>100–200210315
>20–30001785>20–30001050>200025315
Total2010020100Total2010020100Total2010020100
50 μg mL−10–101890000–1019954200–100201001785
>10–20210210>10–2015630>100–20000210
>20–30001890>20–30001050>2000015
Total2010020100Total2010020100Total2010020100
Total0–107492.5000–107998.72328.80–1007897.55568.8
>10–2067.567.5>10–2011.32227.5>100–20022.5911.2
>20–30007492.5>20–30003543.7>200410.51620
Total8010080100Total8010080100Total3810080100
Publisher’s Note: MDPI stays neutral with regard to jurisdictional claims in published maps and institutional affiliations.

