Article

Evaluation of Groundwater Suitability for Irrigation and Drinking Purposes in an Agricultural Region of the North China Plain

1
Hebei Cangzhou Groundwater and Land Subsidence National Observation and Research Station, Cangzhou 061000, China
2
China Institute of Geo-Environment Monitoring, Beijing 100081, China
*
Author to whom correspondence should be addressed.
Water 2021, 13(23), 3426; https://doi.org/10.3390/w13233426
Submission received: 2 November 2021 / Revised: 29 November 2021 / Accepted: 1 December 2021 / Published: 3 December 2021
(This article belongs to the Special Issue River Ecological Restoration and Groundwater Artificial Recharge)

Abstract

:
Groundwater is an irreplaceable resource for irrigation and drinking in the North China Plain, and the quality of groundwater is of great importance to human health and social development. In this study, using the information from 59 groups of groundwater samples, groundwater quality conditions for irrigation and drinking purposes in an agricultural region of the North China Plain were analyzed. The groundwater belongs to a Quaternary loose rock pore water aquifer. The depths of shallow groundwater wells are 20–150 m below the surface, while the depths of deep groundwater wells are 150–650 m. The sodium adsorption ratio (SAR), sodium percentage (%Na), residual sodium carbonate (RSC), magnesium hazard (MH), permotic index (PI) and electrical conductivity (EC) were selected as indexes to evaluate the shallow groundwater suitability for irrigation. What’s more, the deep groundwater suitability for drinking was assessed and the human health risk of excessive chemicals in groundwater was studied. Results revealed that SAR, Na% and RSC indexes indicated the applicability of shallow groundwater for agricultural irrigation in the study area. We found 57.1% of the shallow groundwater samples were located in high salinity with a low sodium hazard zone. The concentrations of fluorine (F) in 79.0% of the deep groundwater samples and iodine (I) in 21.1% of the deep groundwater samples exceeded the permissible limits, respectively. The total hazard quotient (HQ) values of fluorine in over half of the deep groundwater samples exceeded the safety limits, and the health risk degree was ranked from high to low as children, adult females and adult males. In addition to natural factors, the soil layer compression caused by groundwater over-exploitation increased the fluorine concentration in groundwater. Effective measures are needed to reduce the fluorine content of the groundwater of the study area.

1. Introduction

With the development of society, groundwater plays an increasingly important role in agricultural irrigation and domestic drinking [1,2]. Access to high-quality groundwater is indispensable to human health, agricultural irrigation and sustainable social development [3,4]. The shallow groundwater is often developed for irrigation in agricultural areas with the advantages of a low well-forming cost and being easy to obtain. In recent decades, groundwater quality and hydrochemical characteristics have been under the increased influence of pollution in an area of intense agricultural activities [5]. The pollutants pass through the soil and unsaturated zones and penetrate the aquifer, causing groundwater quality deterioration [6]. On the other side, the quality of groundwater directly affects the soil permeability, soil fertility and crop production when used for irrigation because of the ions exchange reaction between groundwater and soil [7,8,9,10]. Sodium concentration in groundwater is important because sodium reacts with soil to reduce its permeability and then the hydraulic conductivity declines, causing soil with poor internal drainage [11,12]. In general, the type of sodium-enriched soil will not support plant growth. The evaluation of groundwater suitability for irrigation has been studied by many researchers, which is mainly based on the important indicator values of total salinity, sodium and other related ions in irrigation water assessment [13,14]. According to the previous study, different indicators reflect different water quality results for irrigation. Although irrigation water quality is confirmed to be good by some indicators, the evaluation results by other indicators may be inappropriate [7,15,16,17].
In addition to irrigation, another important function of groundwater is domestic drinking, with over a third of the world population using groundwater as a drinking water resource [18,19]. Compared with shallow groundwater, deep groundwater is less contaminated by human activities and can better play a drinking function. The quality and safety conditions of drinking water have been a public concern all over the world especially in developing countries, where many kinds of diseases are directly associated with unsanitary conditions in drinking water [3,20,21,22]. Therefore, the evaluation of groundwater quality for drinking is significant for health [23,24].
Contaminants in groundwater can directly enter the human body by oral, inhalation, skin contact or indirectly accumulate in the body through the food chain [2,25]. The problem of contaminants intake from groundwater are more serious in agricultural irrigation areas and rural areas, as residents tend to drink groundwater directly through simple filtration measures. Given the adverse effects of such groundwater contamination on human health, closer links between pollutant concentrations and related health effects are needed to implement more effective risk assessment and mitigation measures [26,27]. Since the 1990s, health risk assessment (HRA) has become a hot topic with a crucial guiding function in determining whether contaminants pose adverse risks to health and whether groundwater can be drunk directly [28,29]. In recent years, human health risk assessment has been developed and widely used in many countries to determine the adverse effects of chemicals taken from groundwater in different populations [30,31,32,33,34].
Fluoride contamination in groundwater has been recognized as a widespread international problem, which influences millions of people in many regions [35,36,37,38]. Drinking groundwater with a high concentration of fluoride may endanger human health and cause fluorosis or other diseases. On the other hand, the use of groundwater with a high concentration of fluoride for irrigation makes the aeration zone and shallow groundwater contaminated. Food, vegetables and fruits irrigated by high fluoride groundwater enter the human body through the food chain, which may cause food-type poisoning [39]. In recent years, many scholars have assessed the health risk of fluoride in groundwater exposure to people of different age groups [35,36,40,41].
The North China Plain is a significant agricultural area in China, and also a typical water shortage area. Groundwater is used as the main resource for irrigation and drinking in this area. Meanwhile, groundwater with high fluoride concentrations exists in some areas in central and eastern of the North China Plain, which threatens the health of residents. At present, the contradiction between supply and demand of groundwater resources is prominent in this area, and the shortage and pollution problems of groundwater are increasingly serious [39,42,43]. Thus, a comprehensive and detailed evaluation of groundwater suitability for agricultural irrigation and drinking is important for groundwater scientific management and sustainable utilization, which is urgently needed in the North China Plain [44].
This paper selected a typical agricultural area in the central region of the North China Plain, where groundwater played an increasingly important role in recent years. In the study area, groundwater accounts for 65% of the total available water resources, so the quality of groundwater has a significant effect on irrigation and domestic drinking [45,46]. The investigation findings showed that the groundwater was over-exploited in the study area, and some kinds of chemicals in groundwater exceeded the standard levels, especially fluorine. However, the groundwater suitability for drinking and agriculture in this region has not been well studied and there are fewer relevant references can be found. Thus, more detailed research work on this topic is necessary. In this study, the hydrochemical characteristics of the groundwater were analyzed based on 59 groundwater samples collected in the field. According to the different practical uses of shallow and deep groundwater, the irrigation suitability of shallow groundwater and drinking suitability of deep groundwater were evaluated separately and the health risk of major excessive ions to different human groups was studied. Multiple evaluation methods (irrigation water suitability indexes, groundwater quality index, groundwater quality standards and health risk model) were selected to reflect the groundwater suitability situation more comprehensively and objectively, and to find typical indicators affecting the groundwater suitability. The findings can be used in the formulation of new policies and strategies for groundwater quality management in the North China Plain.

2. Materials and Methods
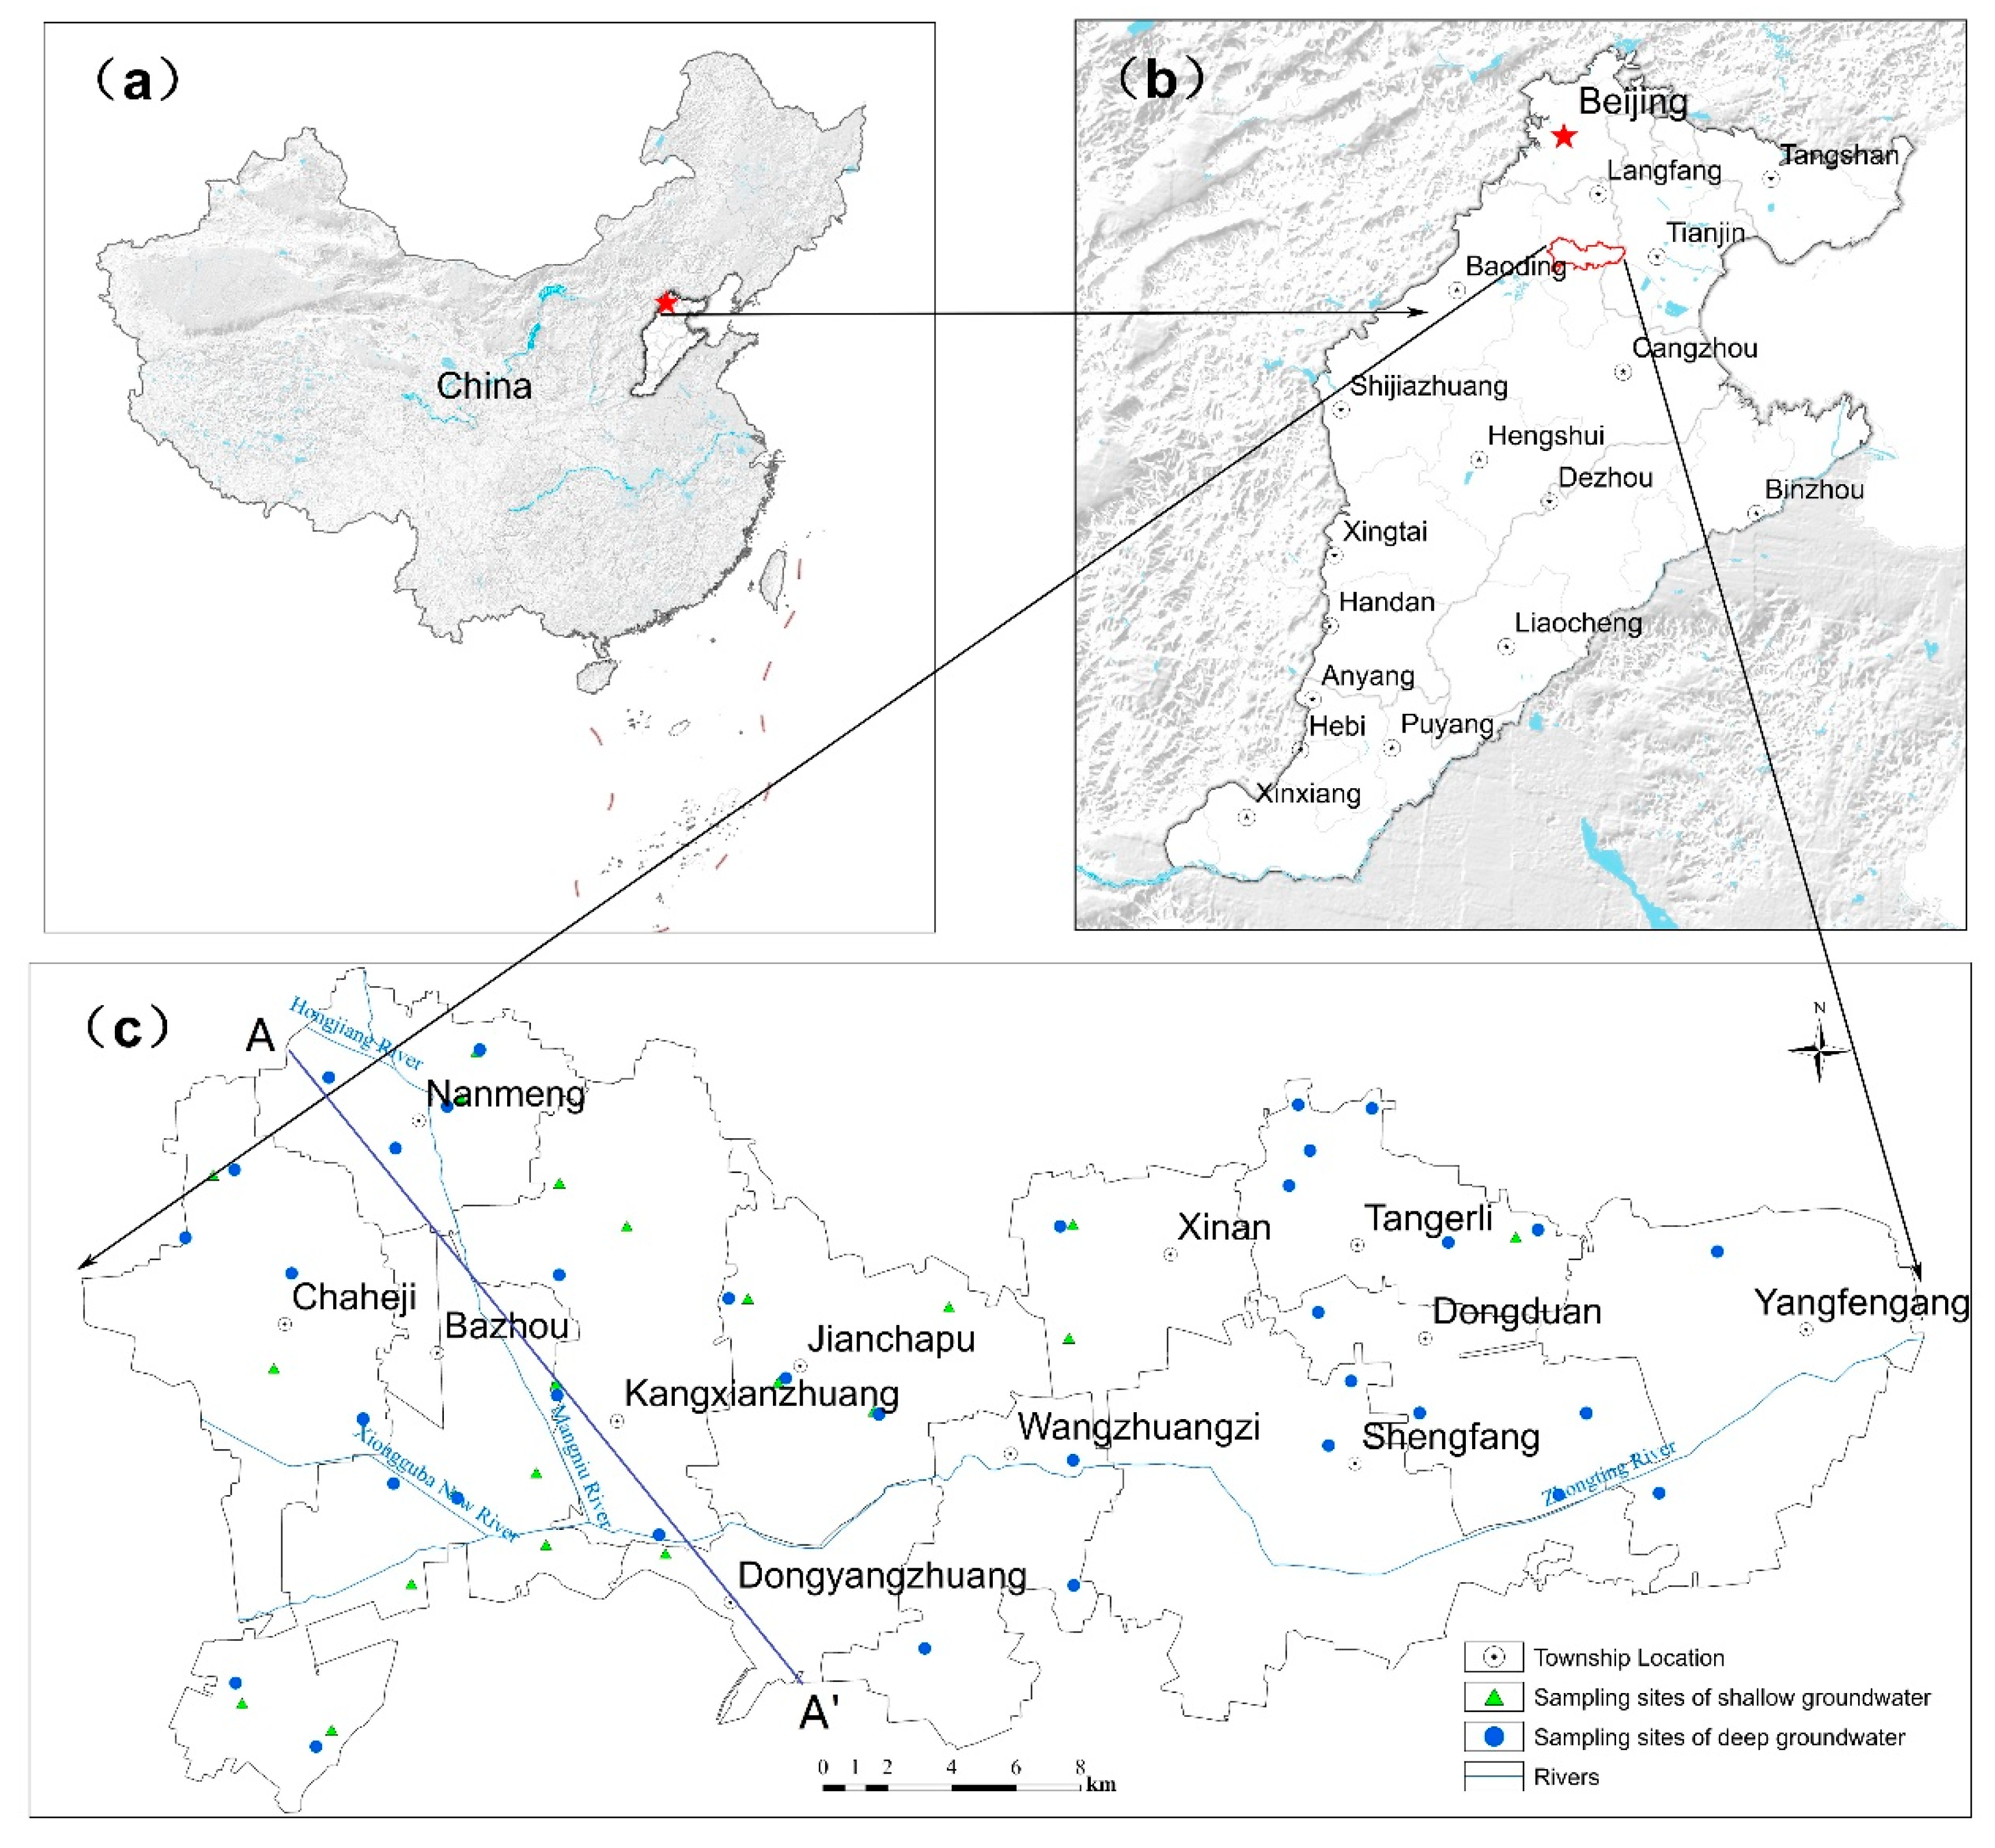
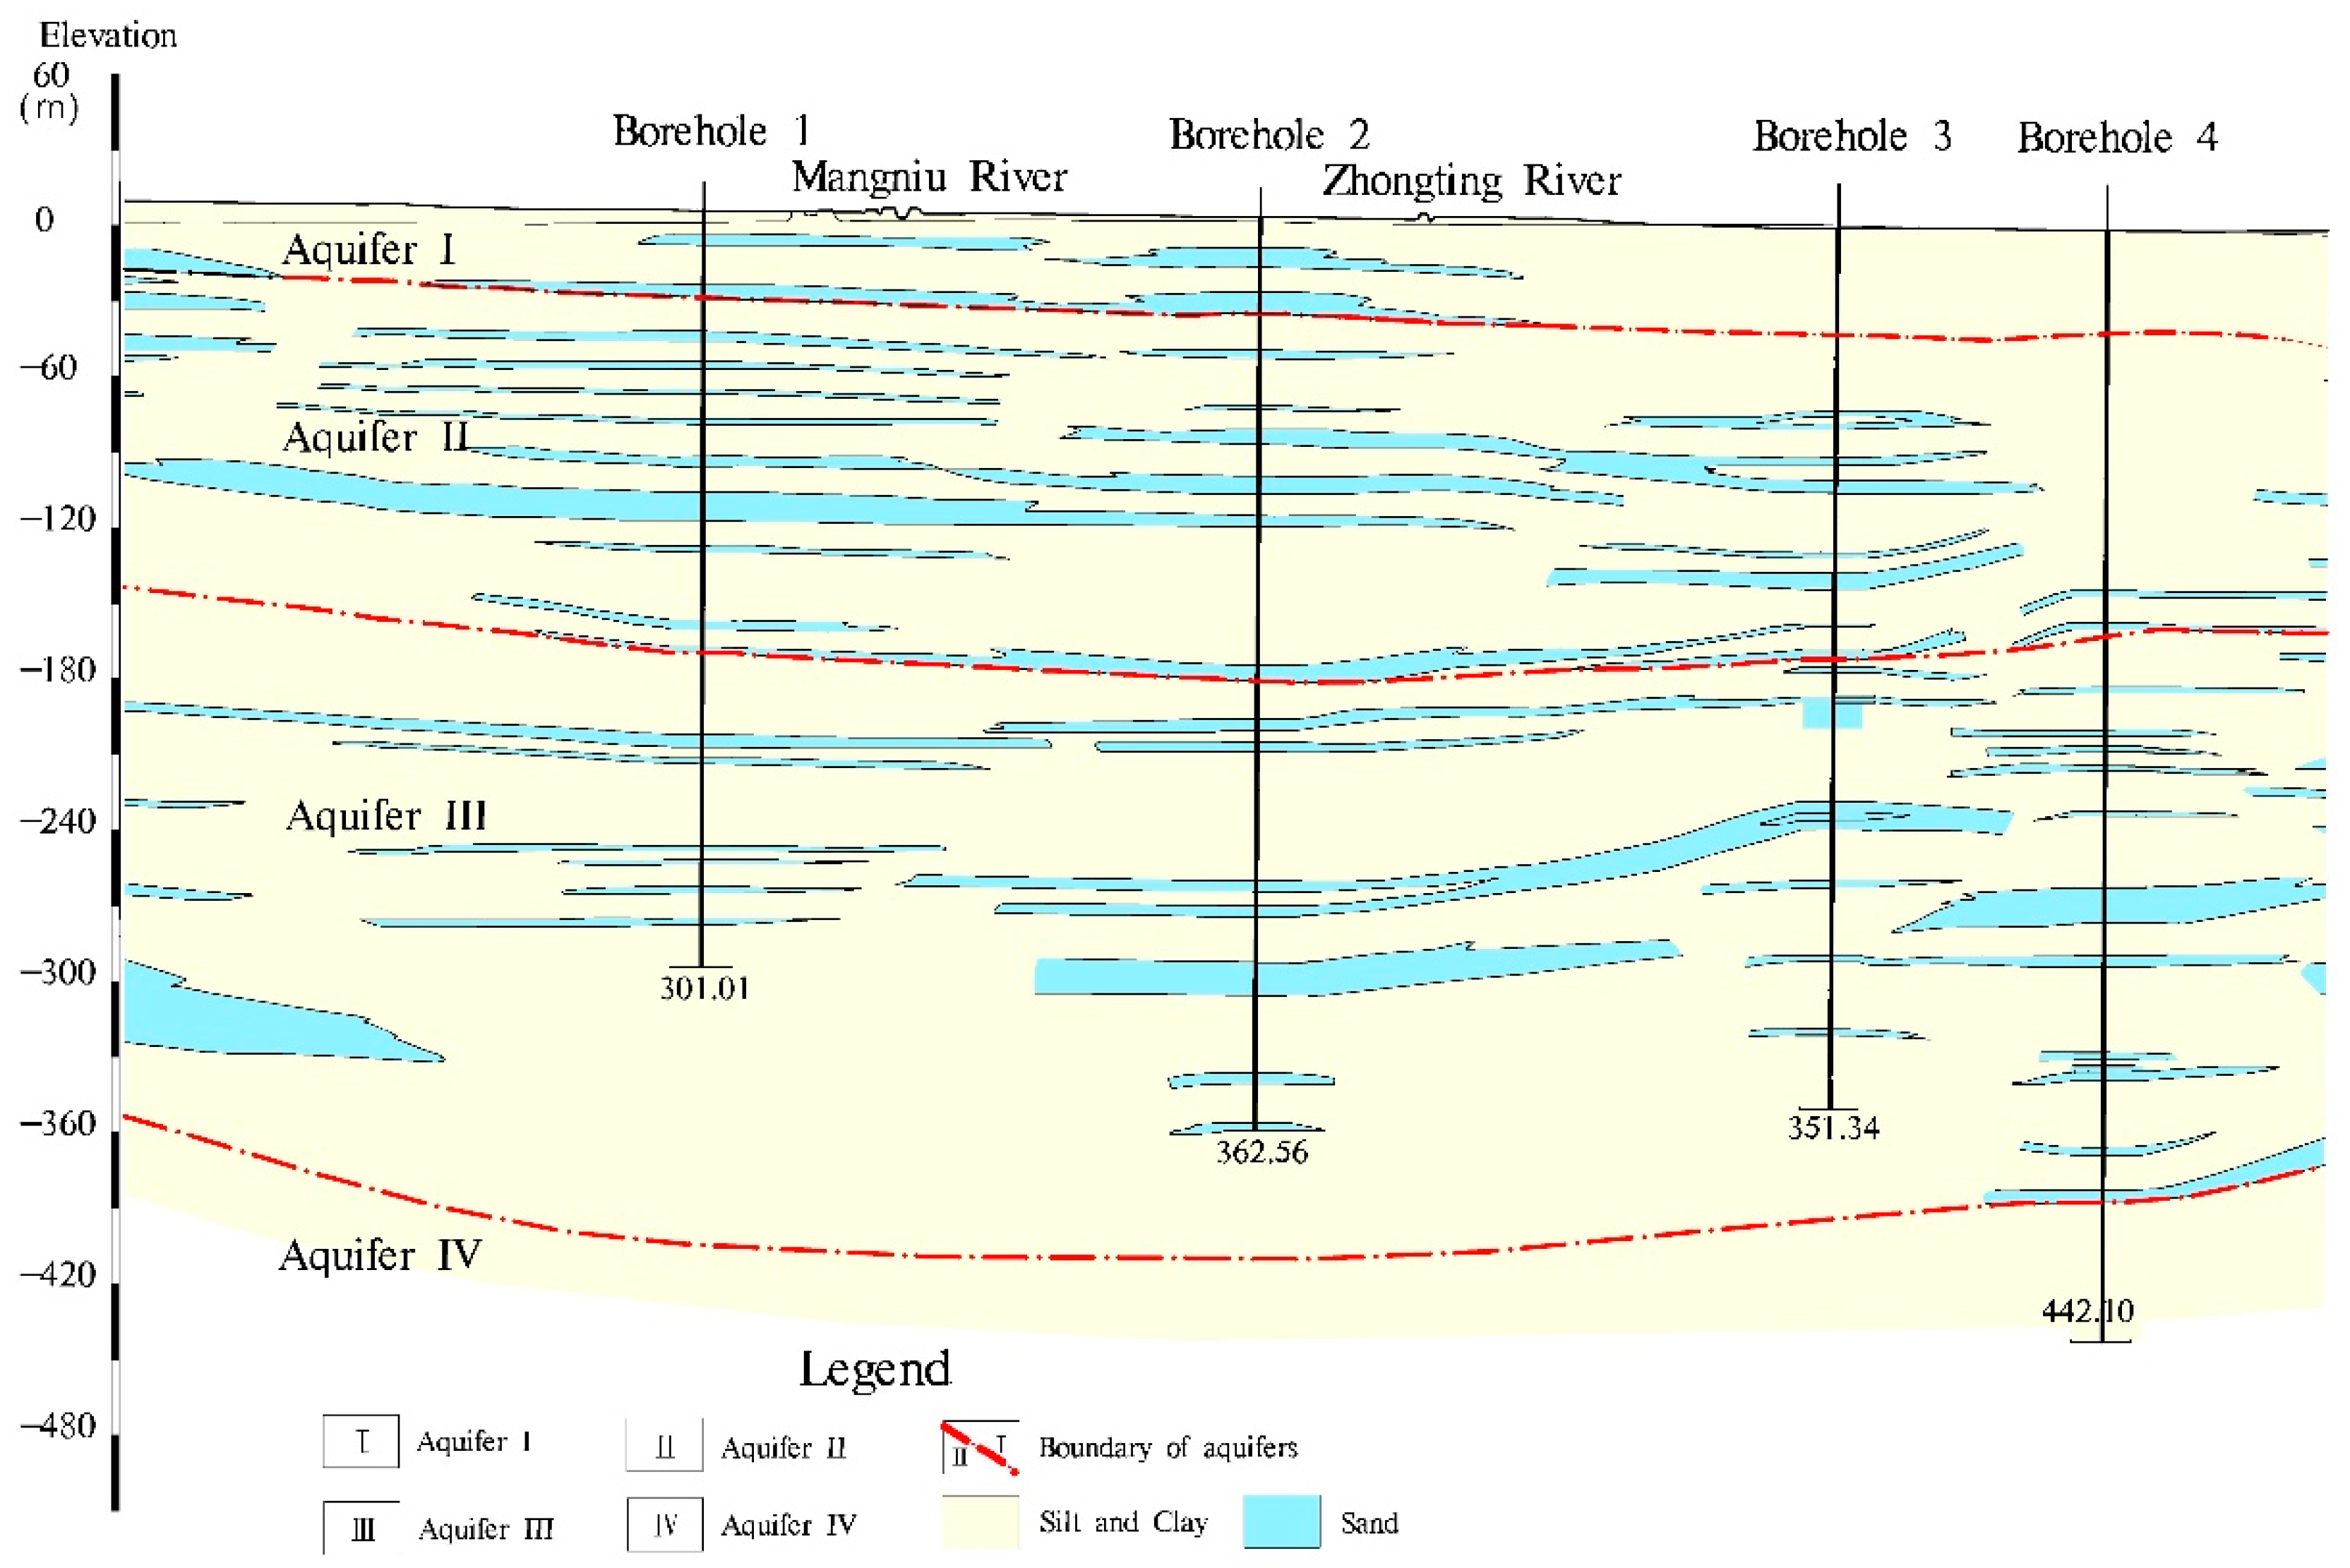
2.1. Study Area

The water samples used in this paper were taken from Bazhou irrigation district in the central North China Plain. The study region extends between E 116°15′–116°55′ longitudes and N 38° 59′–39°13′ latitudes, covering a total area of about 780 km2 (Figure 1). The study region is located in the alluvial plain of lower reaches of the Haihe River basin, with four seasonal rivers including Hongjiang River, Xiongguba New River, Mangniu River and Zhongting River, as well as more than 50 large drainage and irrigation canals. The terrain slopes from northwest to southeast in this area, and the ground elevation slowly drops from 11.1 m to 2.1 m. The climate is suitable for the growth of a variety of crops, with an annual average temperature of 11.5 °C. The annual average precipitation is 543.6 mm and the mean annual potential evaporation is 1060 mm [46,47].
The study area possesses typicality in the aspect of hydrogeological conditions and groundwater utilization for the research of groundwater quality, function or suitability. Field investigation shows that groundwater in this region is mainly deposited in the loose sand layer pore of the Quaternary system. The aquifer exhibits spatial gradient characteristics, changing from a single structure composed of freshwater to a multilayer structure composed of freshwater and saltwater from northwest to southeast. The flow direction of both shallow and deep groundwater is generally from northwest to southeast, and the groundwater flow field is changed in the local groundwater funnel area under the influence of over-exploitation.
Groundwater in the study region can be divided into shallow groundwater and deep groundwater according to the regional hydrogeological conditions and groundwater exploitation. The depths of shallow groundwater wells are 20–150 m below the surface, while the depths of deep groundwater wells are 150–650 m. In general, the groundwater level is greatly affected by exploitation and precipitation. The shallow groundwater levels are 2–30 m below the surface, while the deep groundwater levels are within the depths of 30–90 m.
The aquifer system can be classified into four different aquifers by its lithological properties and geological age, named I, II, III and IV from top to bottom vertically [48] (Figure 2). Aquifer I is unconfined, composed of sand gravel, medium sand, fine sand and silty-fine sand, and the depths of the aquifer bottom are 30–50 m. Aquifer II, 140–160 m deep, is a semi-confined aquifer. Aquifer III consists of sandy gravel and medium to fine sand with depths of 360–380 m. Aquifer IV is made up of cemented sand gravel and medium to fine sand, and the aquifer bottom is below 380 m. Both third and fourth aquifers are confined aquifers. Groundwater in Aquifer I and II is classified as shallow groundwater, while groundwater in Aquifer III and IV is named deep groundwater based on aquifer distribution and groundwater exploitation depth [49].
The study region has gradually changed from a single all-freshwater aquifer structure to a multi-layer structure composed of freshwater on the top, saltwater in the middle and freshwater on the bottom from northwest to southeast. Saltwater is mainly deposited in the lower part of Aquifer I and upper part of Aquifer II, and all deep groundwater is freshwater situated below the saltwater bottom boundary.
According to the field investigation, the source of irrigation water is mainly from shallow groundwater, and the source of drinking water is mainly from deep groundwater. Groundwater provides about 65% of the total water supply, and the proportions of groundwater used for agricultural irrigation and drinking are about 74% and 14%, respectively, in the study area [45,46]. Long-term groundwater over-exploitation causes a general decline of groundwater level, forming shallow groundwater funnel of agricultural exploitation type and deep groundwater funnel of domestic drinking exploitation type. Due to the geological conditions and anthropogenic activities in the study region, the fluorine content in groundwater exceeds the standard limits, having a serious impact on groundwater function.

2.2. Methods of Suitability Evaluation for Irrigation Purpose

In this study, six indicators were selected for comprehensive analysis to evaluate whether groundwater is suitable for irrigation, containing sodium adsorption ratio (SAR), sodium percentage (%Na), residual sodium carbonate (RSC), magnesium hazard (MH), permeability index (PI) and electrical conductivity (EC). According to the suitability classification of groundwater agricultural irrigation (Table 1), the proportion of different categories of each index was statistically analyzed. The spatial distribution figures of different categories of each index were drawn by the Kriging interpolation method in ArcGIS software, and this method was often used when analyzing and interpreting groundwater quality spatial variations [6,50].
SAR is introduced, from the U.S. Department of Agriculture, which can reflect the relative activity of the alternate adsorption effect between Na+ and soil components in groundwater. SAR predicts the Na+ hazard of high carbonate waters, especially if they contain no residual alkali [1], and can act as a good indicator of the alkalization ability of groundwater. The higher the SAR value is, the stronger the alkalization ability of the groundwater.
Sodium concentration is usually expressed in the form of %Na [51], which affects the permeability and structure of the soil. Sodium filling in the soil would limit water and airflow in the soil, alter the permeability structure of the soil and inhibit crop growth.
RSC is an indicator that determines the harmful effect of carbonate and bicarbonate on groundwater quality for irrigation [7,51]. In general, high concentrations of carbonate and bicarbonate in groundwater along with calcium and magnesium can affect the suitability of groundwater for crop rising [2]; If the concentration of carbonate in groundwater is too high, excess carbonate may combine with sodium ion to form bicarbonate which would affect the permeability structure of the soil.
The magnesium hazard (MH) was suggested by Szaboles and Darab, which was also used to assess the water suitability for agricultural use [7]. MH values in groundwater render the soil to become alkaline, thus resulting in low crop production. If the Mg2+ concentration in irrigation water reaches a certain level, MH may affect the soil structure and produce bad effects on crops.
The existence of sodium, calcium, magnesium and bicarbonate in irrigation water may influence the soil permeability. If the soil accumulates large amounts of salts, the soil structure will be destroyed and crop growth will be affected [52]. Permeability index (PI) can be used to determine the water movement capability in soil based on the concentration of Ca2+, Mg2+, Na+ and HCO3 [16]. PI is also a criterion for water quality suitability for agricultural irrigation, which is used to assess the permeability and drainage capacity of the soil [51].
In addition, EC is usually used as the indicator of salinity hazard to reflect water quality for irrigation.
In addition, an irrigation water classification diagram (USSL diagram and Wilcox diagram) is used to classify the groundwater suitability for irrigation according to the irrigation water quality classification standard from the U.S. Department of Agriculture [53,54]. The relationship between EC and SAR is indicated by the USSL diagram, and the relationship between EC and %Na is indicated by the Wilcox diagram.

2.3. Methods of Suitability Evaluation for Drinking

The suitability of groundwater for domestic drinking evaluated by comparing the values of different water quality parameters with the Class III water limits (suitable for drinking directly) stipulated by the Standard for Groundwater Quality of China (SGQC, GB/T 14848-2017) and permissible values for drinking water recommended by the World Health Organization (WHO, 2017) guidelines [55] presented in Section 3.1.
In this study, groundwater quality index (GQI) values are calculated using the World Health Organization standard (WHO, 2011) [50,56] and the suitability for drinking purposes is investigated. GQI variation graphs, computed by using the WHO standard and Kriging interpolation method, were provided by ArcGIS software. According to the WHO (2011) standard, GQI is expressed as follows:
GQI = i = 1 n w i ( C i S i ) × 100
where C is the observed groundwater quality parameters (GQP), S is the standard value of GQP based on the WHO (2011) standard and w indicates the weight of each GQP based on the WHO (2011) standard. The WHO (2011) standards for each GQP and the weight values were presented in Table 2. The various groundwater classification grading for drinking consumptions based on computed GQI values were presented in Table 3.
According to the results of drinking water quality evaluation, typical pollutants are selected for health risk assessment using the mode recommended by the U.S. EPA [57]. Based on the actual situation of water utilization in the study area, the exposure pathways of drinking water intake and skin contact are considered in health risk assessment, while the respiratory exposure pathway is negligible due to the low risk for human health [24,34]. Human health risk through drinking intake and skin exposure pathways was calculated using the following formulas [57,58]:
CDI = C w × IR × EF × ED BW × AT
DAD = C w × K i × ET × SA × EF × ED × EV × CF BW × AT
  HQ c = CDI RfD c
HQ d = DAD RfD d
HQ =   ( HQ c + HQ d )
where Cw (mg/L) indicates the concentration of the typical pollutant in groundwater. IR (L/day) is the ingestion rate for drinking water. EF (day/year) is the exposure frequency for ingestion and dermal pathways. ED (year) is the average exposure duration. BW (kg) is the human average body weight. AT (AT = 365 × ED, day) indicates average exposure time for ingestion and dermal pathways. CDI (mg/(kg·day)) and DAD (mg/(kg·day)) indicate daily average exposure dosage through drinking water and dermal contact, respectively. Ki (cm/hour) indicates the dermal permeability coefficient. ET (hour/day) means the exposure time during the shower. SA (cm2) specifies exposed skin surface area during bathing. EV (times/day) is the bathing frequency. CF (L/cm3) is the conversion factor. RfDc (mg/(kg·day)) and RfDd (mg/(kg·day)) are the reference dose absorbed by drinking water and skin contact, respectively. HQc and HQd are the non-carcinogens hazard quotient through ingestion and dermal absorption of water, respectively. HQ is the total hazard quotient including exposure routes of drinking water and skin contact. HQ <1 suggests an acceptable non-carcinogenic risk, while the value above 1 indicates a higher probability of adverse health effects.

2.4. Water Sampling and Measurement

In August 2020, 59 groups of groundwater samples were collected in the study area including 21 groups of shallow groundwater samples and 38 groups of deep groundwater samples. The shallow groundwater samples were selected within the depth of 20–130 m, while the deep groundwater samples were selected within the depth of 170–650 m. The spatial distribution of sampling points were shown in Figure 1. The shallow groundwater samples were collected from local irrigation wells and the deep groundwater samples were collected from drinking water wells. Sampling procedures, samples preservation and treatment methods were conducted in accordance with groundwater sampling technical standards.
To make sure the collected samples reflect the actual situation of the chemicals in groundwater, groundwater in wells would be pumped out more than three minutes before sampling. The 2.5 L plastic sampling bottles were used as containers and were washed three times with deionized water to keep clean. Haver rapid water quality detector was used to measure water temperature, pH and redox potential in the field. All groundwater samples were sealed with sealing membranes and kept in a cryogenic incubator.
All samples were delivered to the laboratory (Tianjin geological and mineral testing center) to test within 48 h. The test indicators mainly include potassium (K+), sodium (Na+), calcium (Ca2+), magnesium (Mg2+), chloride (Cl), sulfate (SO42−), bicarbonate (HCO3), carbonate (CO32−), orthophosphate (PO43−), fluorine (F), iodine (I), ammonia-nitrogen (NH4+-N), nitrate-nitrogen (NO3-N), nitrite-nitrogen (NO2-N), total alkalinity, total hardness (TH), iron (Fe), manganese (Mn) and chemical oxygen demand (CODMn). The analysis technology and equipment referred to the detection indexes and methods recommended by the Standard for Groundwater Quality of China (SGQC) [44].
When analyzing groundwater samples, quality control was performed with less than 5% error for all duplicate samples. Quality assurance is achieved by implementing laboratory standard procedures and applying quality control methods. In the test of indicators, average values were obtained from multiple test records. The verification of the analysis method was based on subsequent criteria for detection quality control, including external calibration, precision, percent accuracy, linearity, detection limit (DL), quantitative limit (QL) and blank reagents.

3. Results and Discussion

3.1. Hydrochemical Characteristics of Main Ions in Groundwater

The statistical results of the main anions, cations and hydrochemical indicators in groundwater are shown in Table 4. The measured pH values ranged from 7.31 to 8.50 with a mean value of 7.85 in the shallow groundwater and ranged from 8.20 to 9.15 with an average value of 8.60 in the deep groundwater, indicating that groundwater in the study area is generally in a partial alkaline environment. The measured EC values ranged from 3.56 to 3717.10 µs/cm with an average value of 1709.77 µs/cm in the shallow groundwater and changed from 1.59 to 1556.00 µs/cm with a mean of 698.95 µs/cm in the deep groundwater, showing that shallow groundwater is more susceptible to fertilization and irrigation. The total hardness (TH, by CaCO3) values of shallow groundwater ranged from 18.73 to 1482.85 mg/L with an average value of 673.82 mg/L and ranged from 10.12 to 82.96 mg/L with an average value of 24.81 mg/L in the deep groundwater. The TH value in shallow groundwater is over 27 times the value in deep groundwater, probably due to the salinity and mineral dissolution in aquifers under the influence of climate, precipitation, evaporation, topography and human activity [7]. The measured CODMn values ranged from 0.66 to 5.58 mg/L with an average value of 1.74 mg/L in the shallow groundwater and ranged from 0.37 to 1.66 mg/L with an average value of 0.67 mg/L in the deep groundwater, indicating that shallow groundwater is more polluted by organic matter than deep groundwater.
The field investigation findings show that there is continuous aquiclude (confining stratum) between shallow and deep groundwater, obstructing the chemical exchange between shallow and deep groundwater. Obvious differences in water levels can be seen between shallow groundwater and deep groundwater, which illustrate the aquiclude’s impact. The deep groundwater is in a more closed environment than shallow groundwater. As a result, the difference in hydrochemistry exists between shallow and deep groundwater.
The average concentrations of cations (expressed as meq/L) in shallow and deep groundwater in the study area were in the following order of Na+ > Mg2+ > Ca2+ > K+ and Na+ > Ca2+ > Mg2+ > K, respectively. The high content of Na+ in groundwater is attributed to the dissolution of sodium-containing minerals, cation exchange among minerals and high weathering processes of rocks [13,52,59]. Ca2+ is primarily derived from calcium-rich minerals (including pyroxene, feldspar and amphibole), and Mg2+ is mainly derived from ions exchange between groundwater and minerals in rocks and soil [13]. Furthermore, the high concentration values of Na+, Ca2+ and Mg2+ in groundwater may be due to the effects of domestic wastewater and irrigation water [14].
The average concentrations of anions (expressed as meq/L) in shallow and deep groundwater in the study area were in the following order of HCO3 > SO42− > Cl > CO32− and HCO3 > Cl > SO42− > CO32−, respectively. Strong weathering and dissolution of carbonate, and the reaction of soil CO2 with the dissolution of silicate minerals are all responsible for the high concentration of bicarbonate in groundwater [60,61]. The strong evaporation effect and dissolution of gypsum, as well as human activity (including the utilization of agricultural fertilizers and wastewater discharge) in semi-arid areas, may increase the SO42− concentration in groundwater [59].

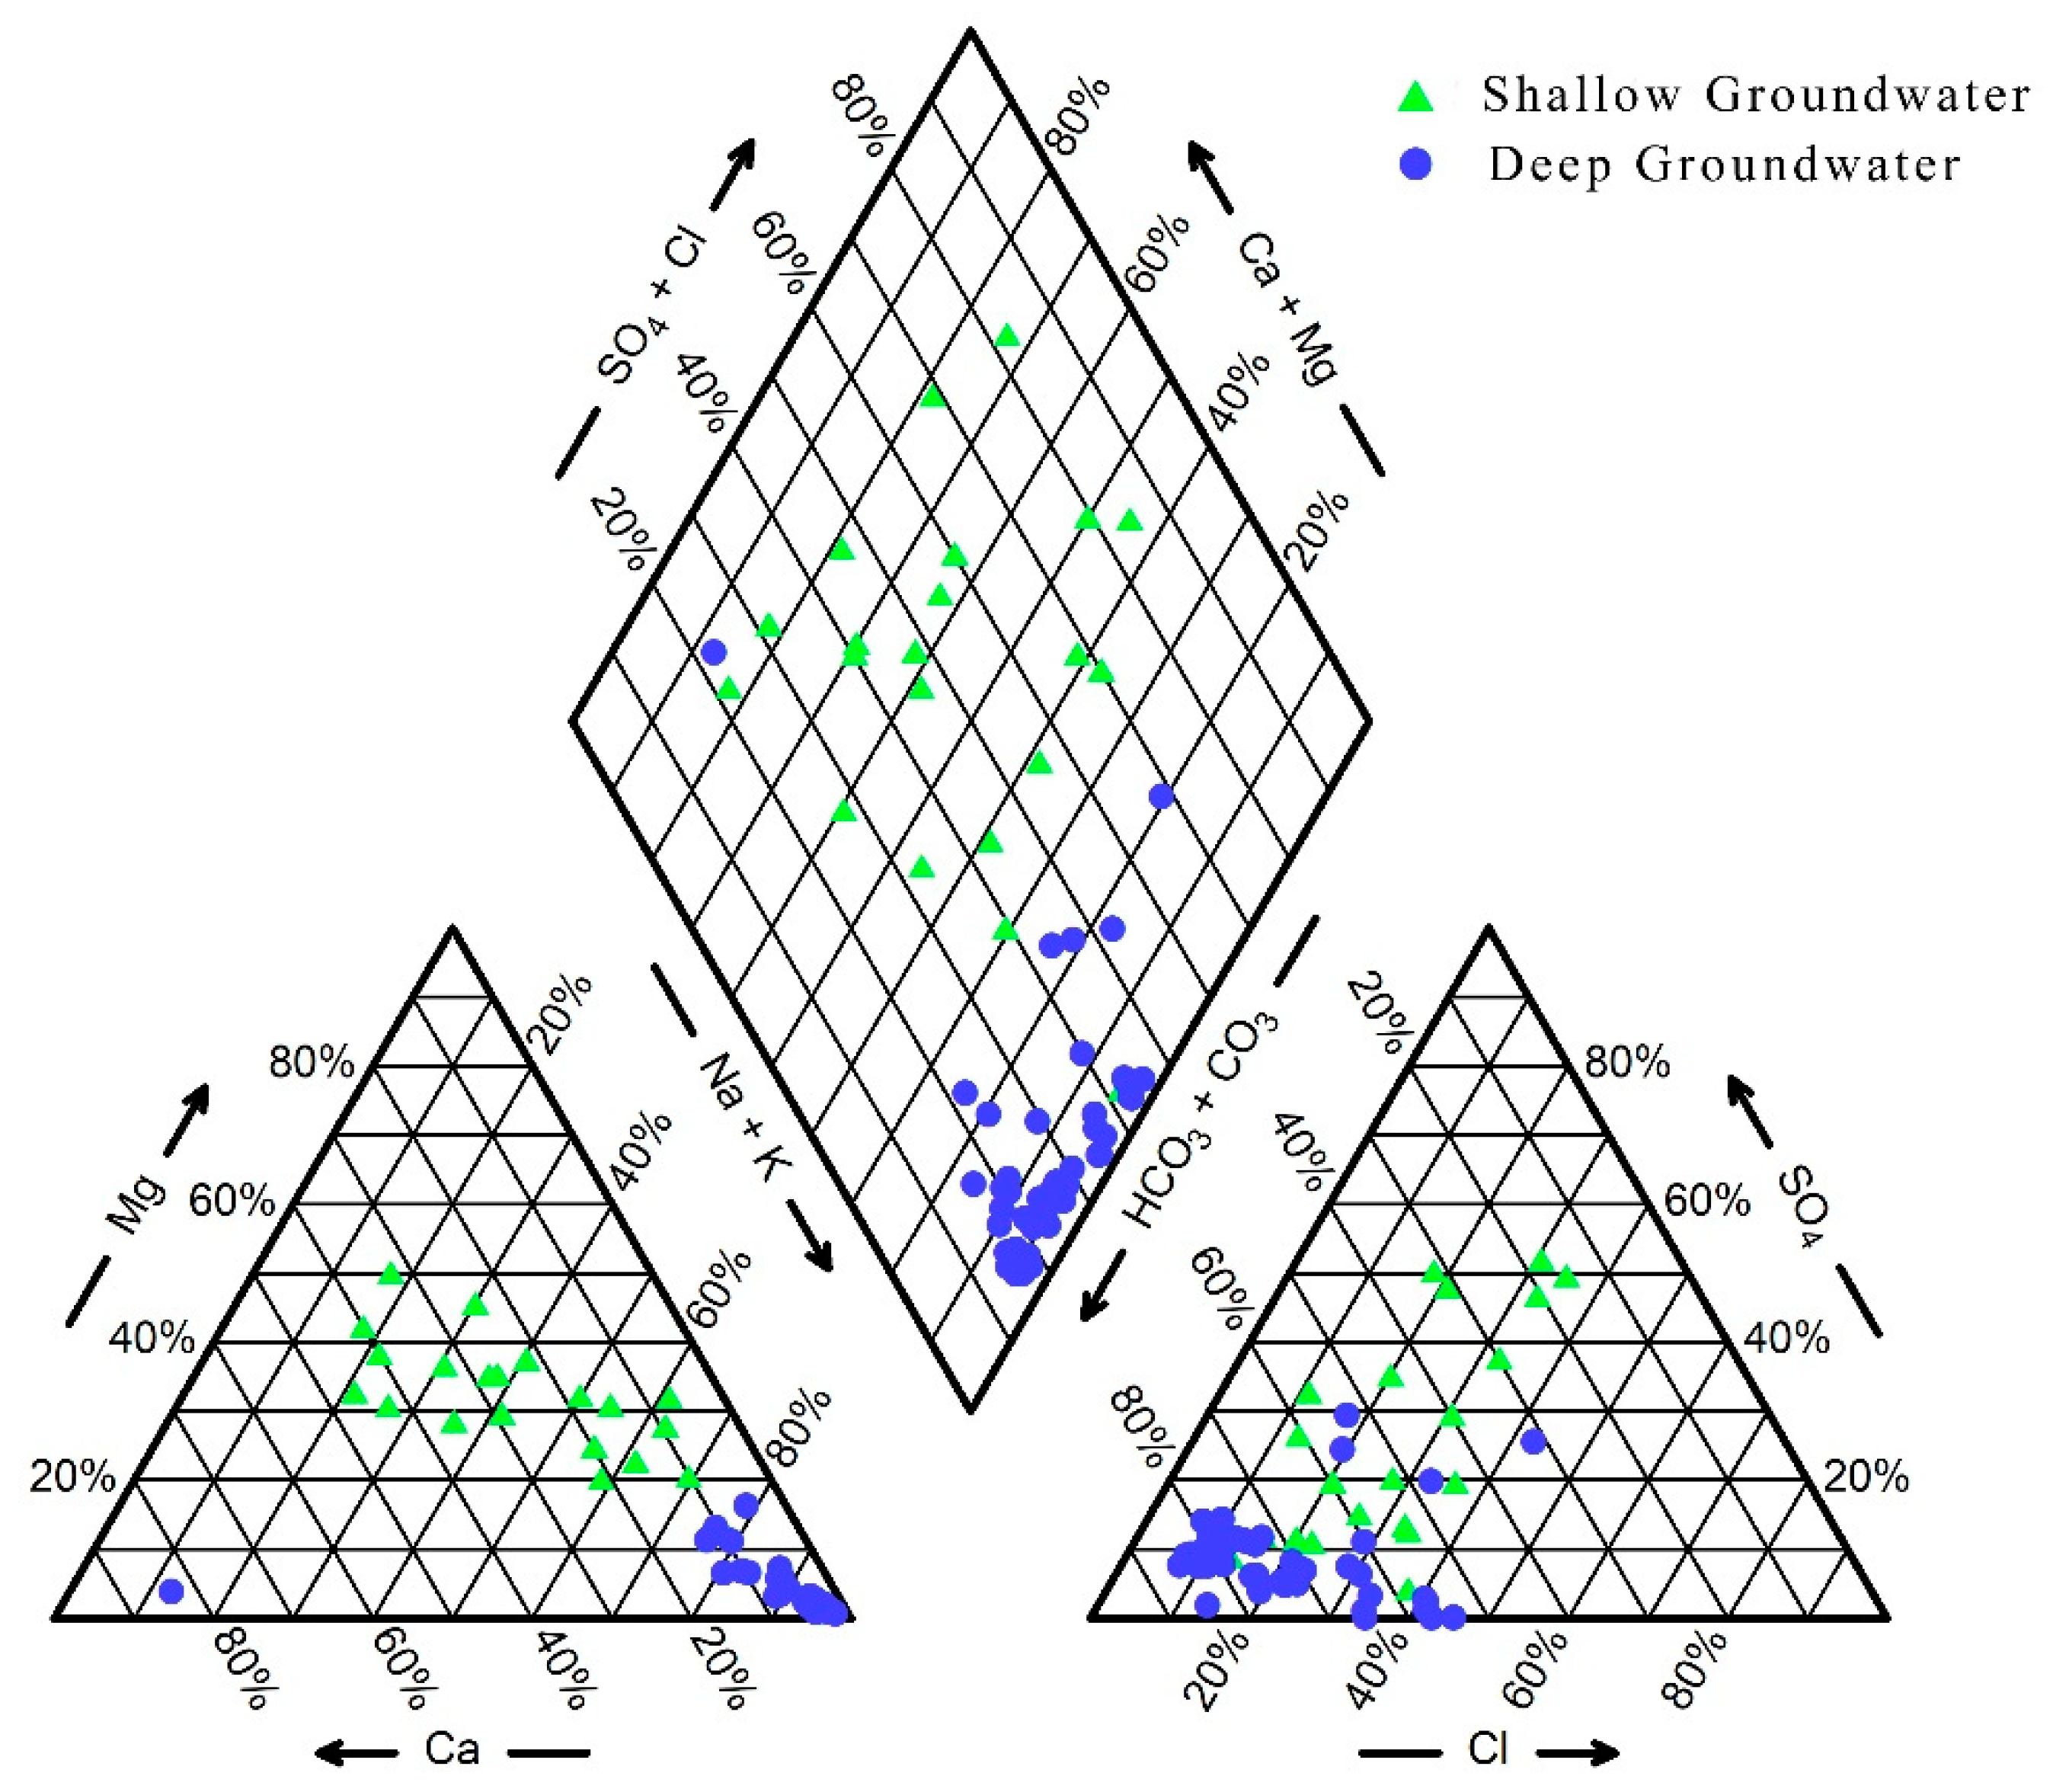
3.2. Hydrochemical Types of Groundwater

The hydrochemical data are shown on the Piper trilinear diagram to determine the groundwater hydrochemical facies in the study area. Piper trilinear diagram contains two triangles, one for plotting cations, and the other for plotting anions, where the hydrochemical facies can be identified within the diamond-shaped field [26,62]. The groundwater samples collected from shallow and deep aquifers were plotted for comparison (Figure 3). The results showed that most samples of the shallow and deep groundwater were distributed in the lower right of the cation triangle, indicating that the groundwater samples are mainly concentrated in the Na+ and Ca2+ cation facies. In the anion triangle, most of the samples were distributed on the left, indicating that the samples were mainly concentrated in the high equivalent percentage region of HCO3 and SO42−. The weathering of carbonate minerals, dissolution of gypsum and evaporation are important factors in controlling groundwater chemistry characteristics [10]. Based on the analysis results, the hydrochemical facies of groundwater in the study area could be classified into HCO3-Na, HCO3-Ca•Mg, HCO3•SO4-Na•Mg and SO4•Cl-Ca•Mg types in the shallow groundwater as well as HCO3-Na, HCO3•Cl-Na and HCO3-Ca types in the deep groundwater according to the naming rules of the Schukalev classification.
The continuous aquiclude between shallow and deep groundwater has obstructing impacts on the ions exchange. In addition, there are significant differences in the depths of the shallow and deep groundwater samples. As a result, sharp variation in hydrochemistry can be seen between shallow and deep groundwater samples.

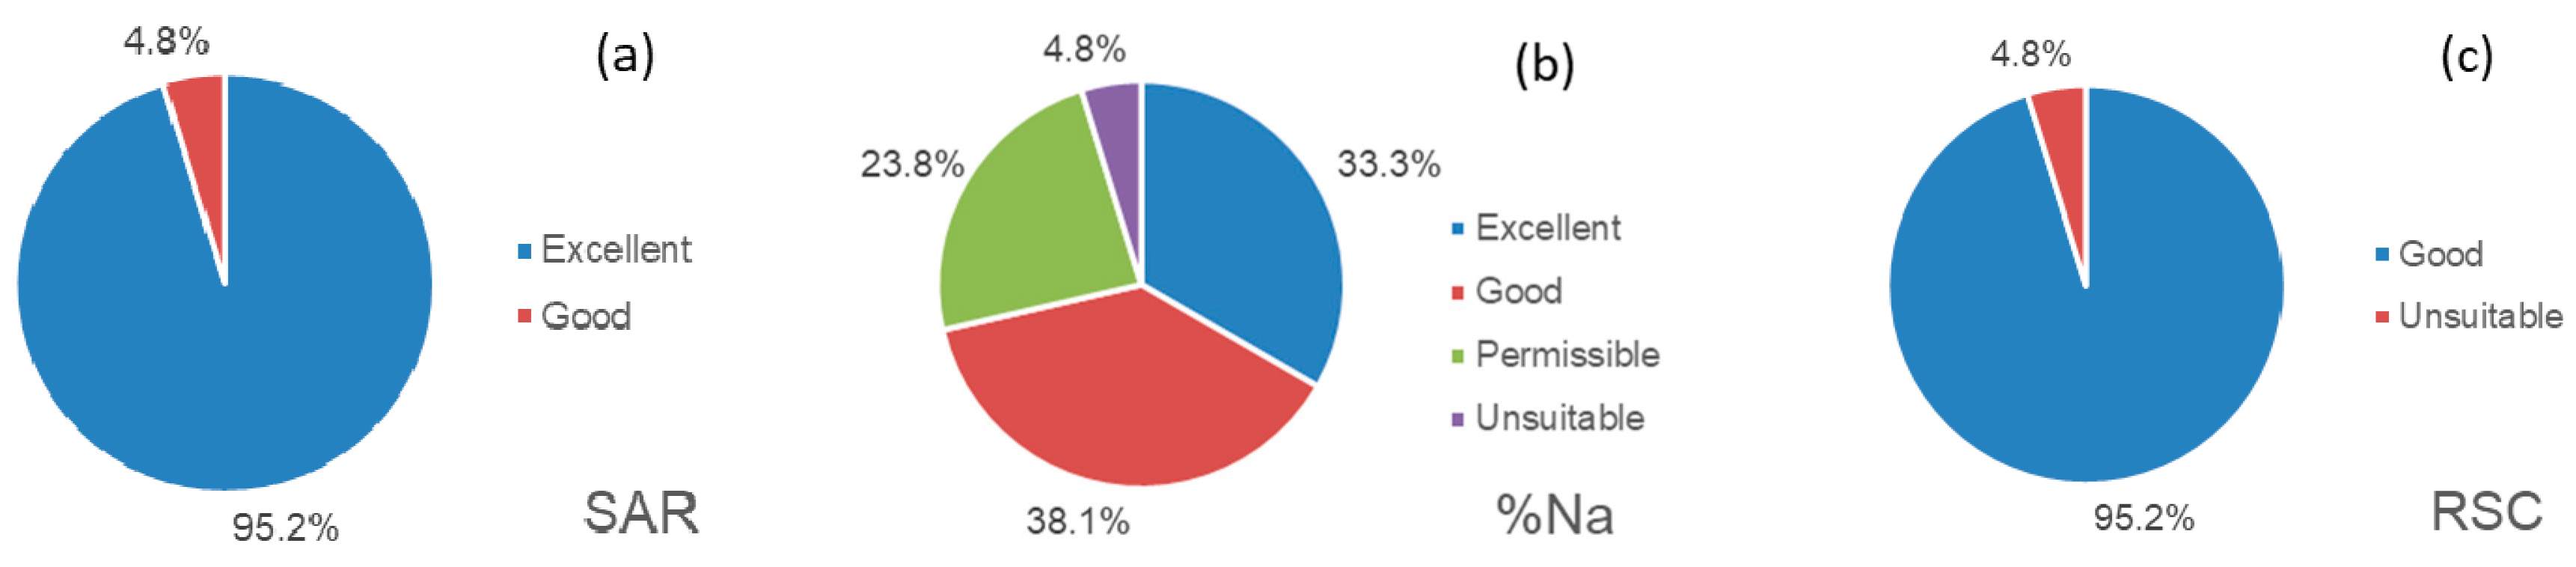
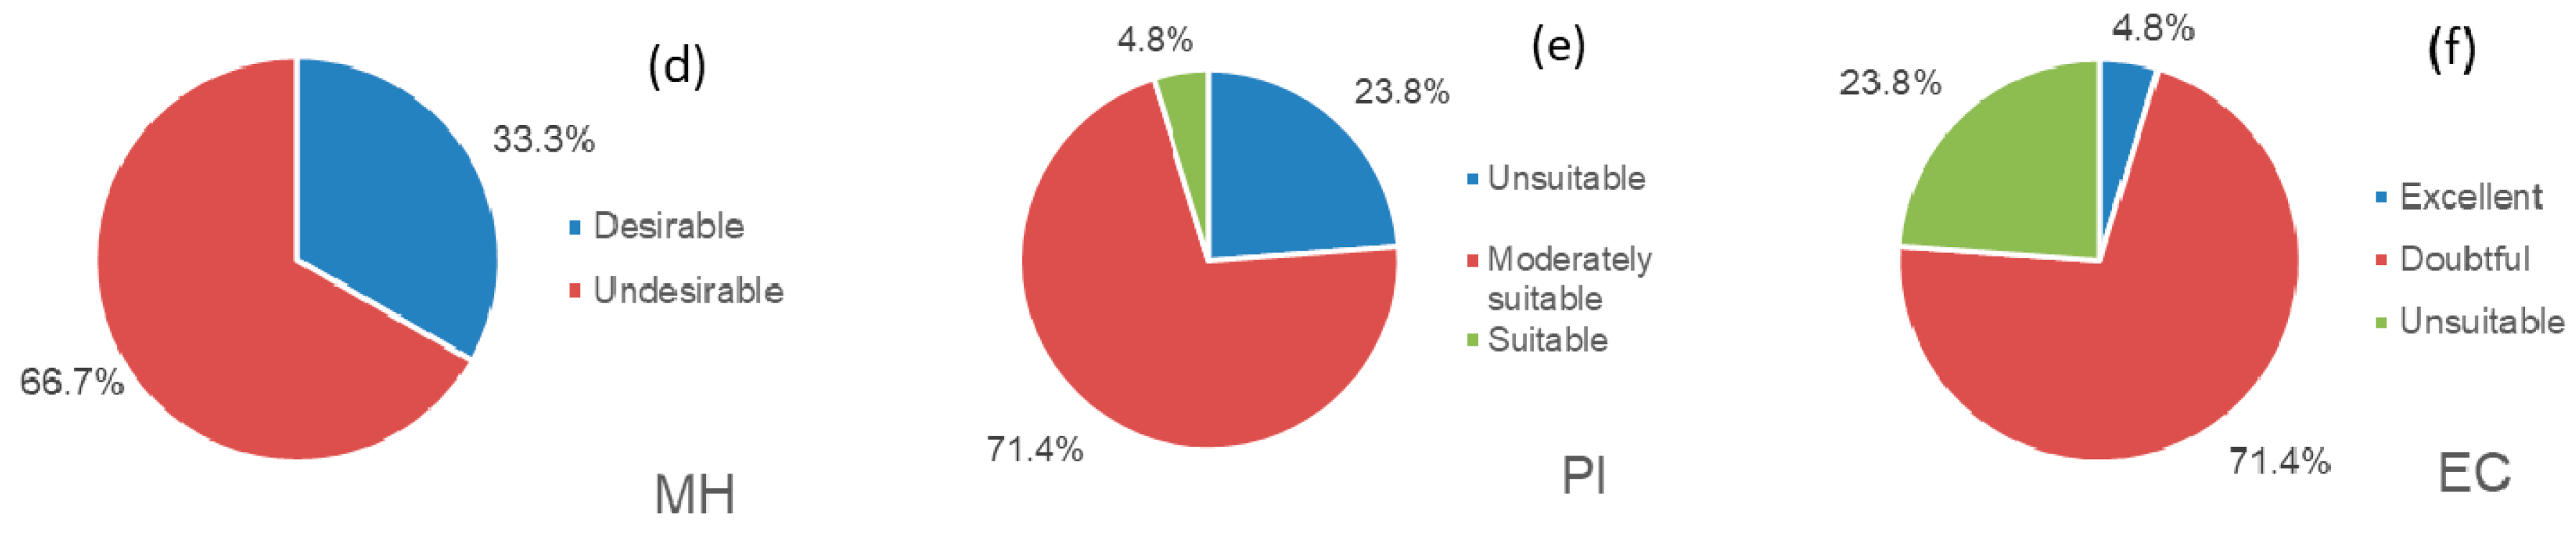
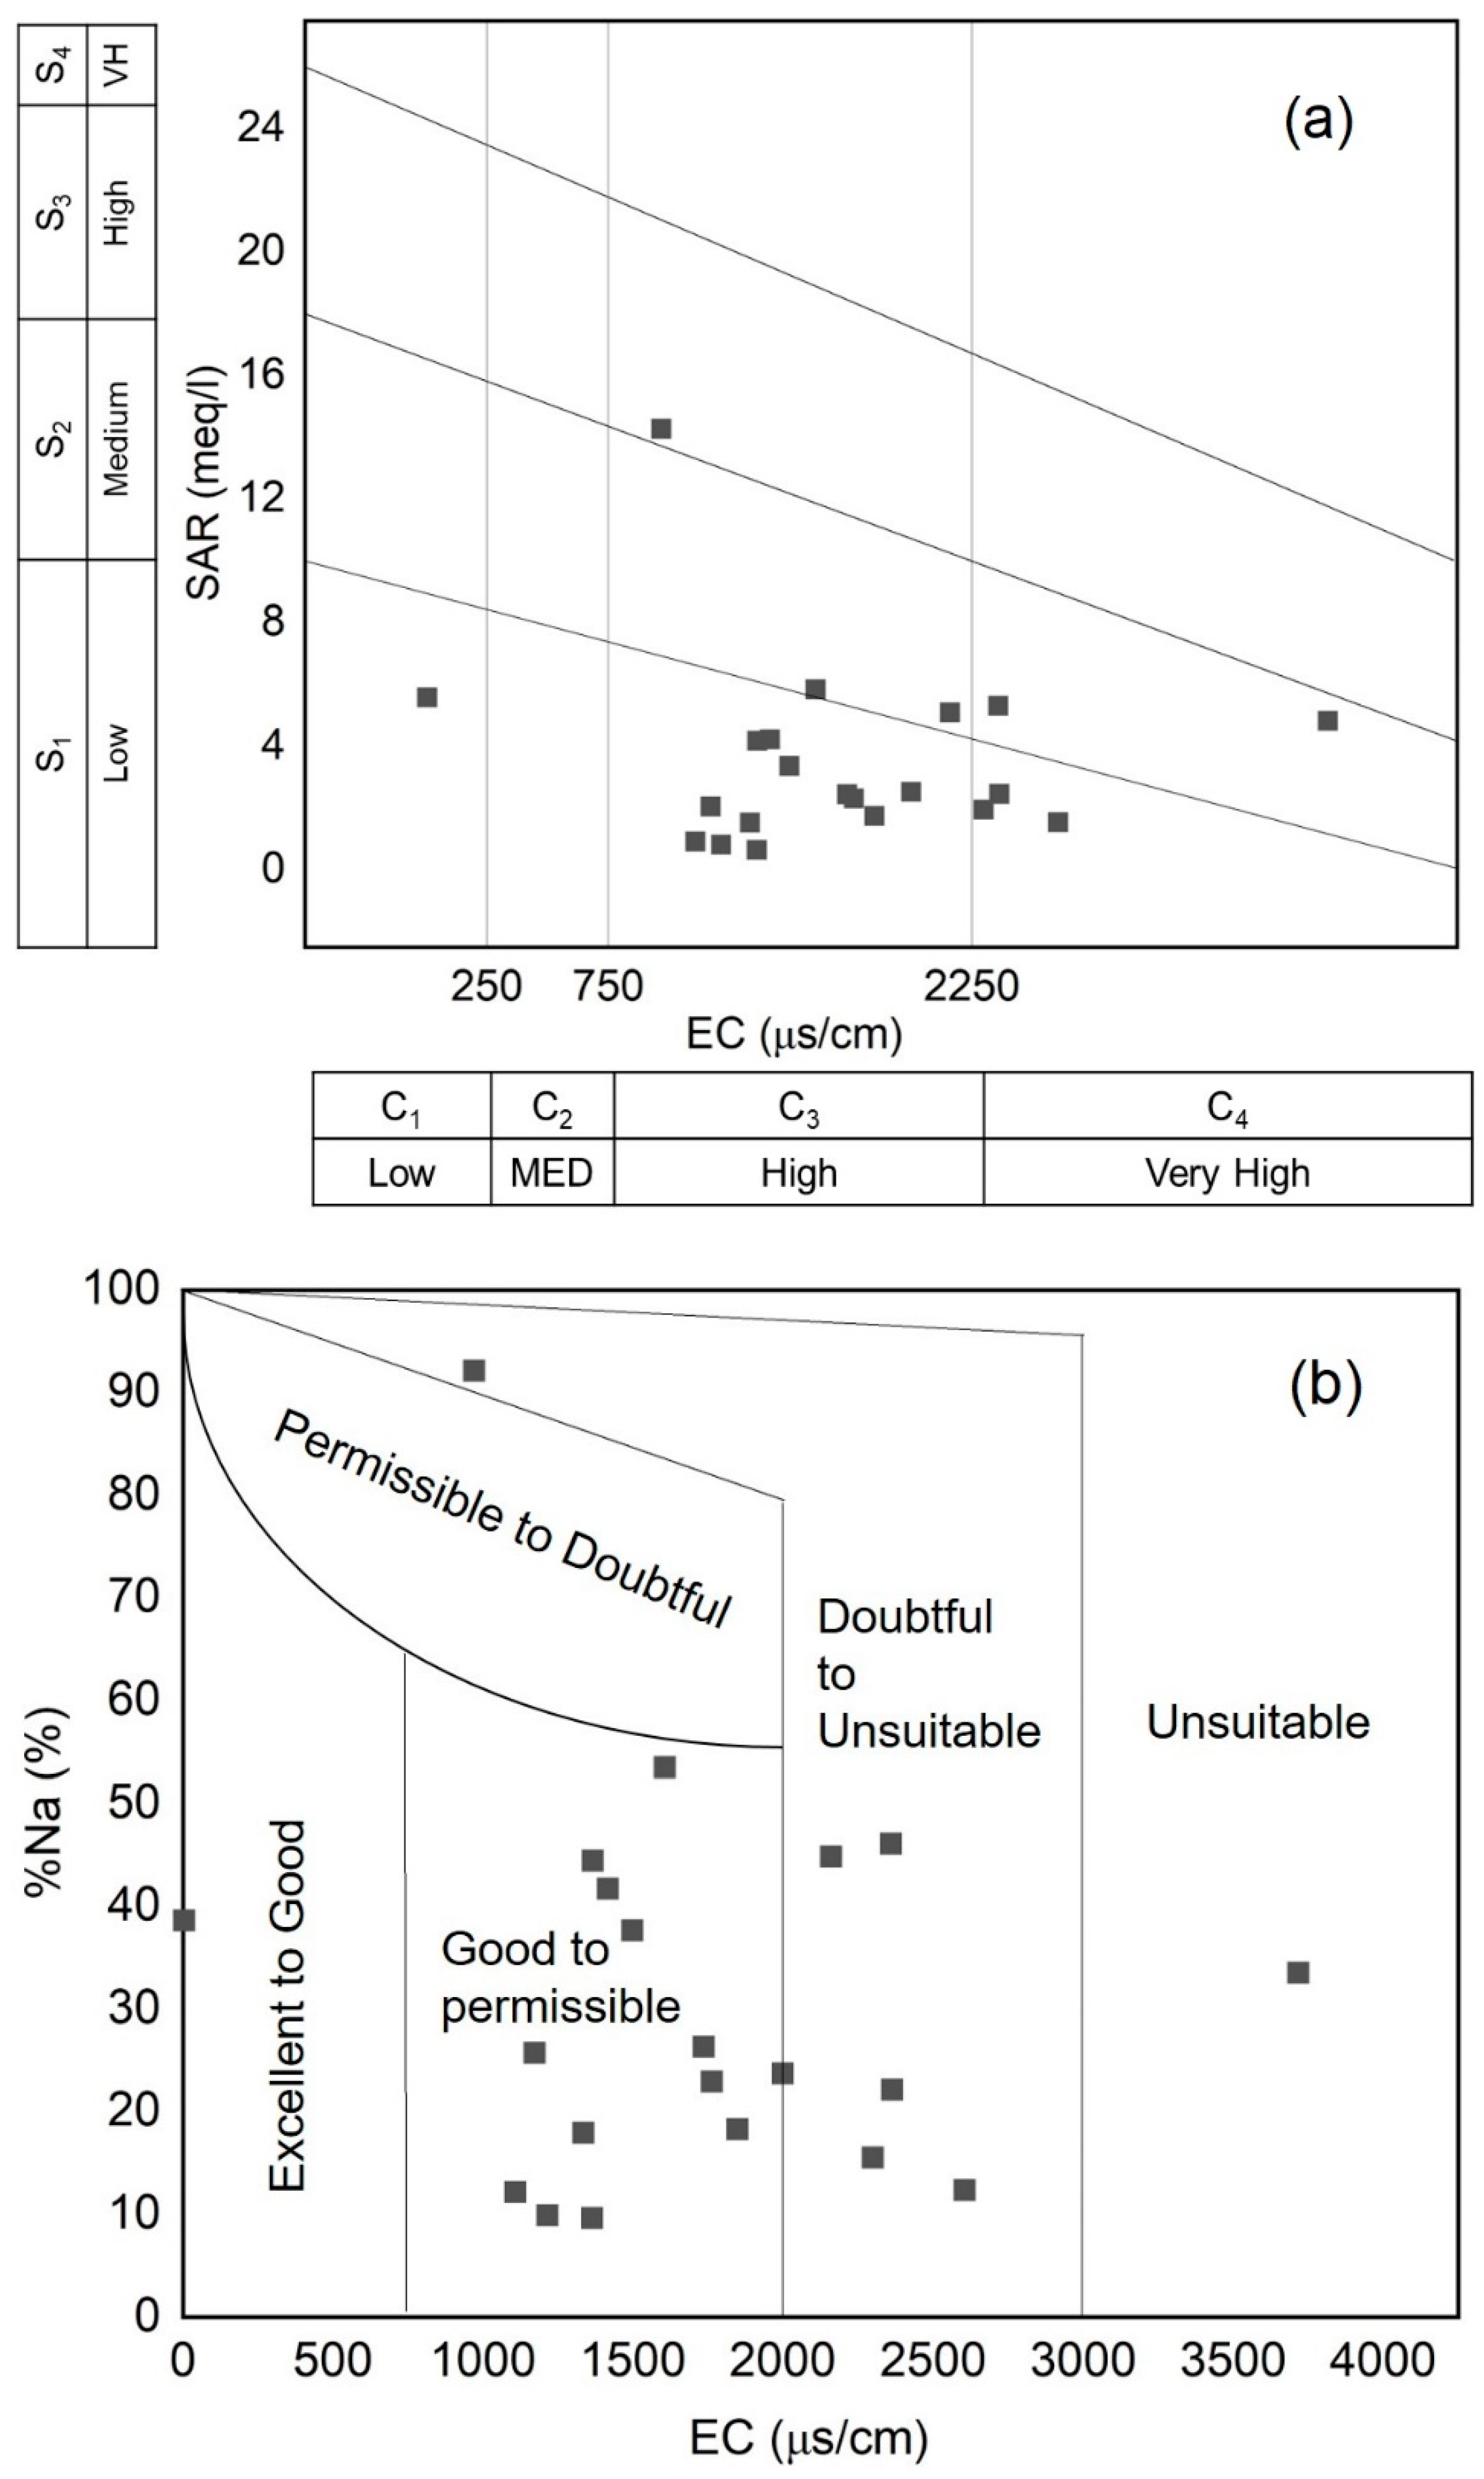
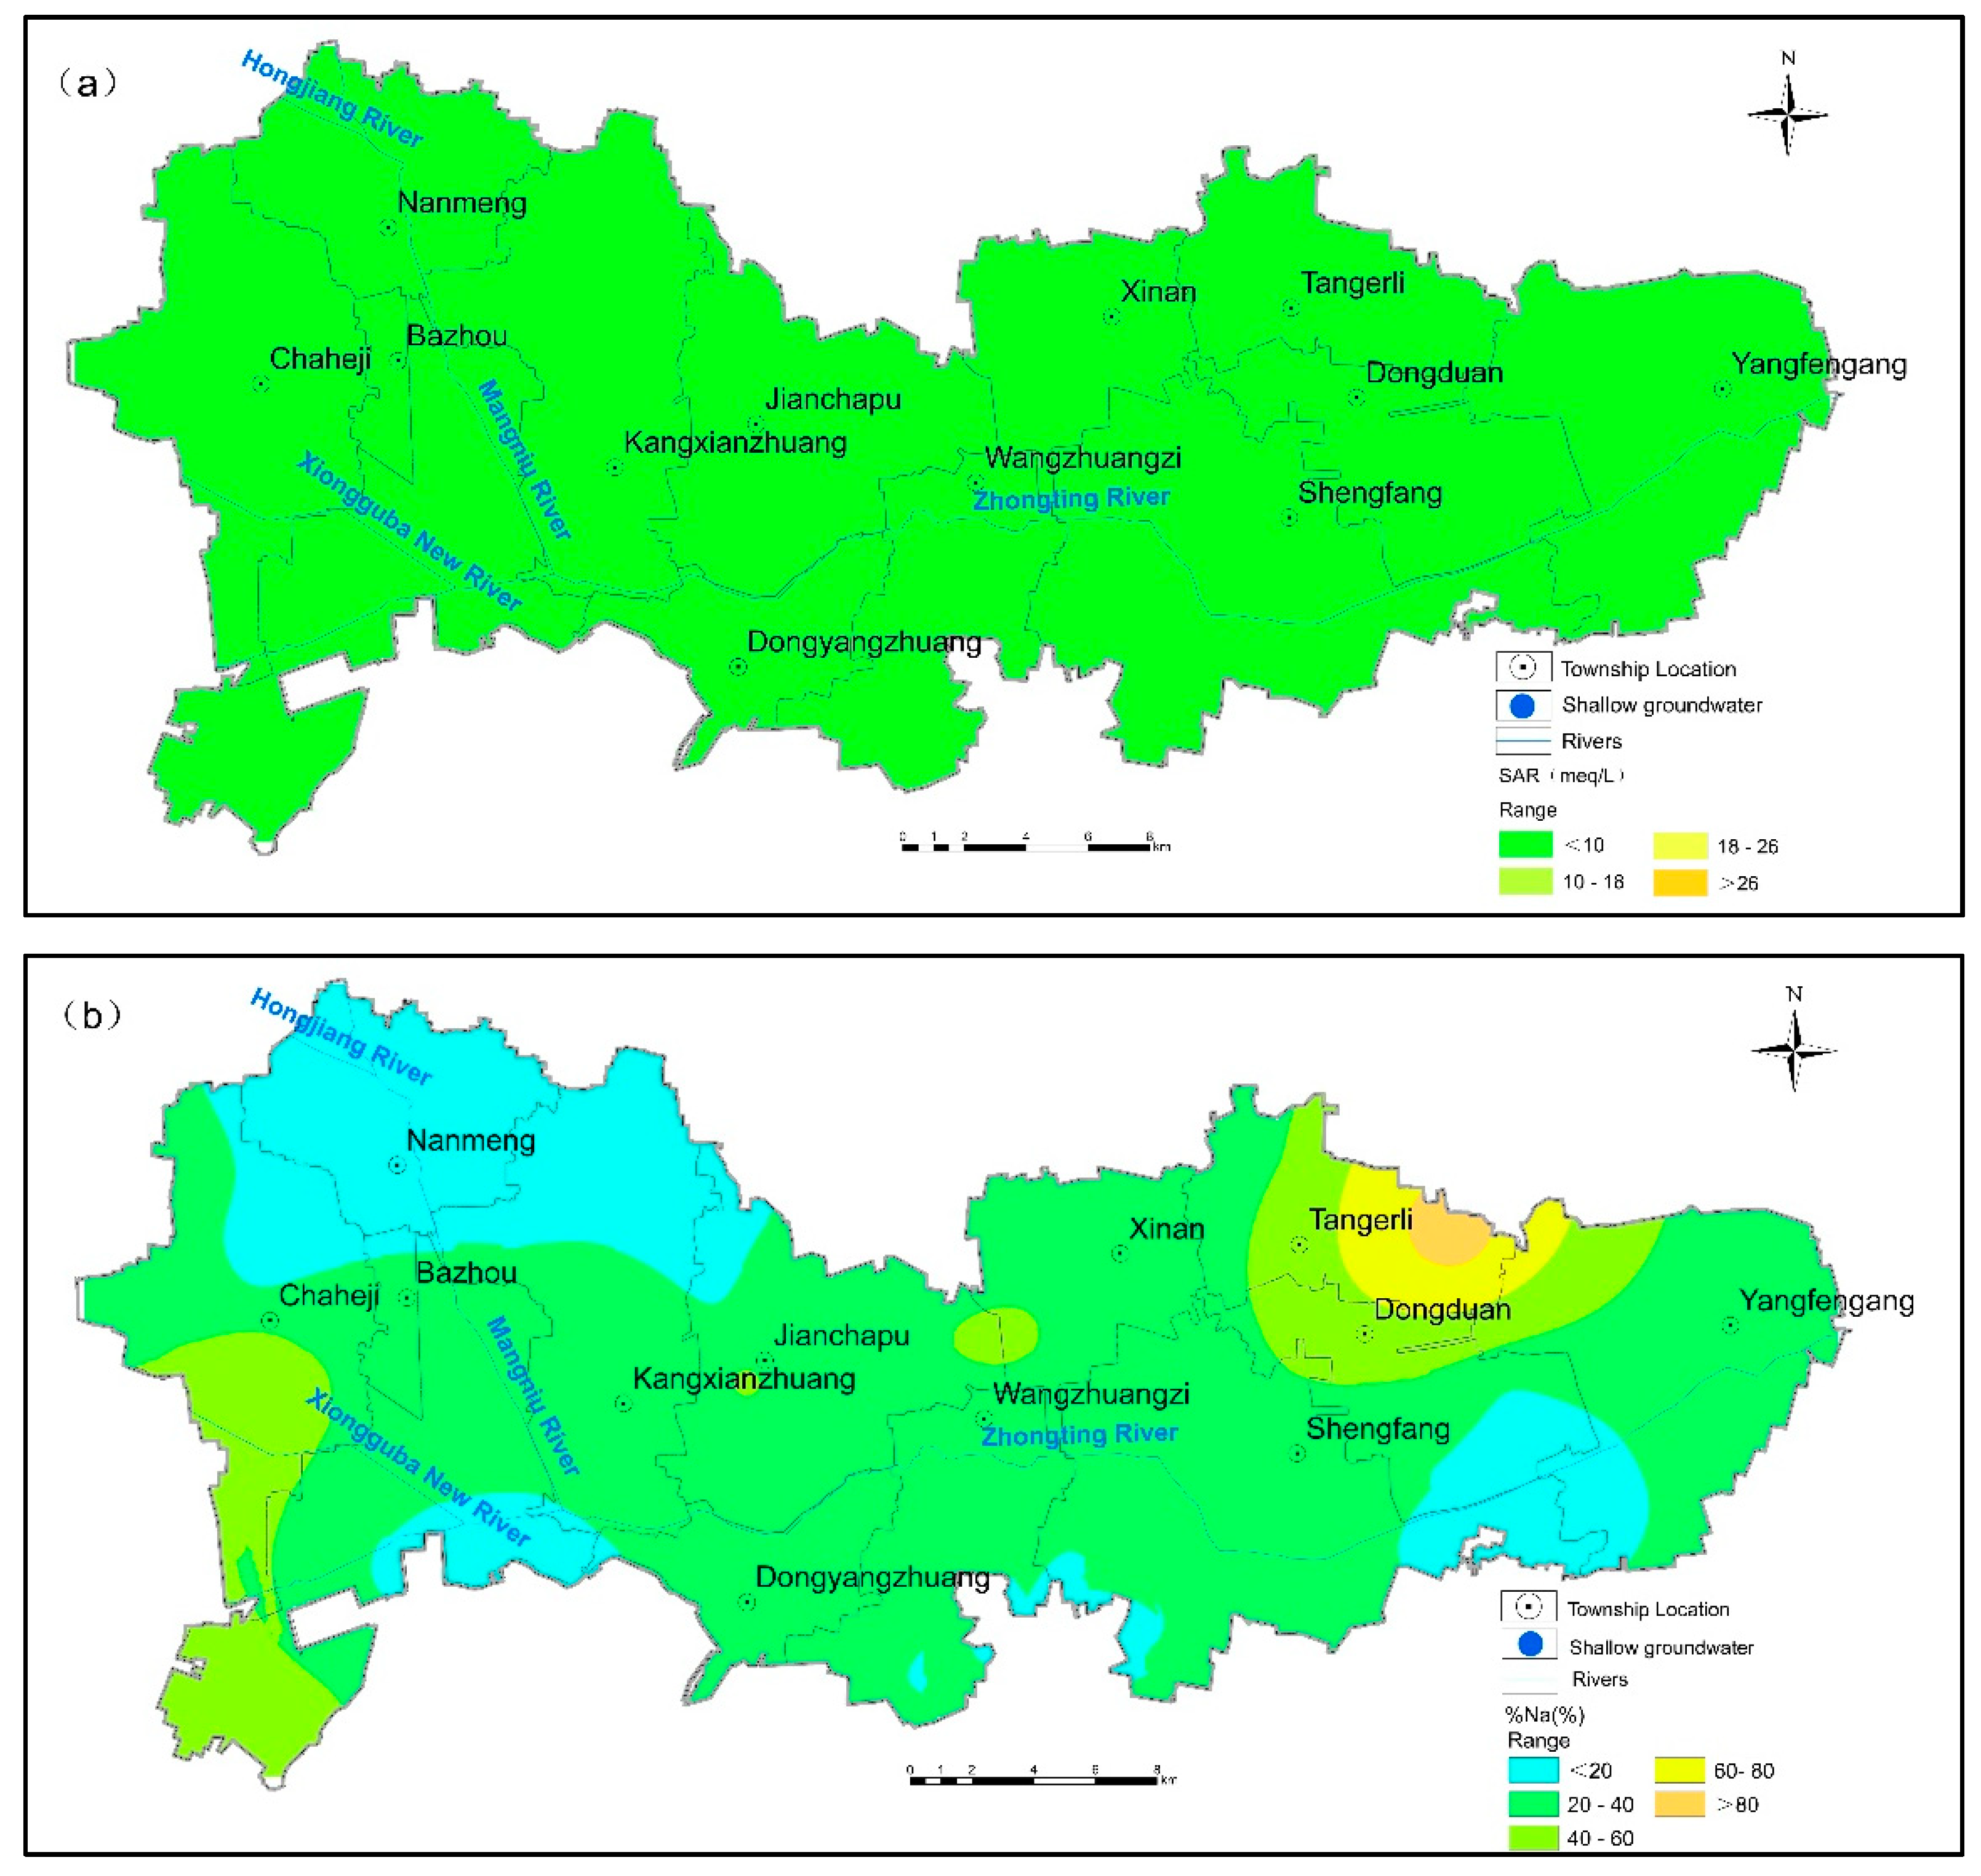
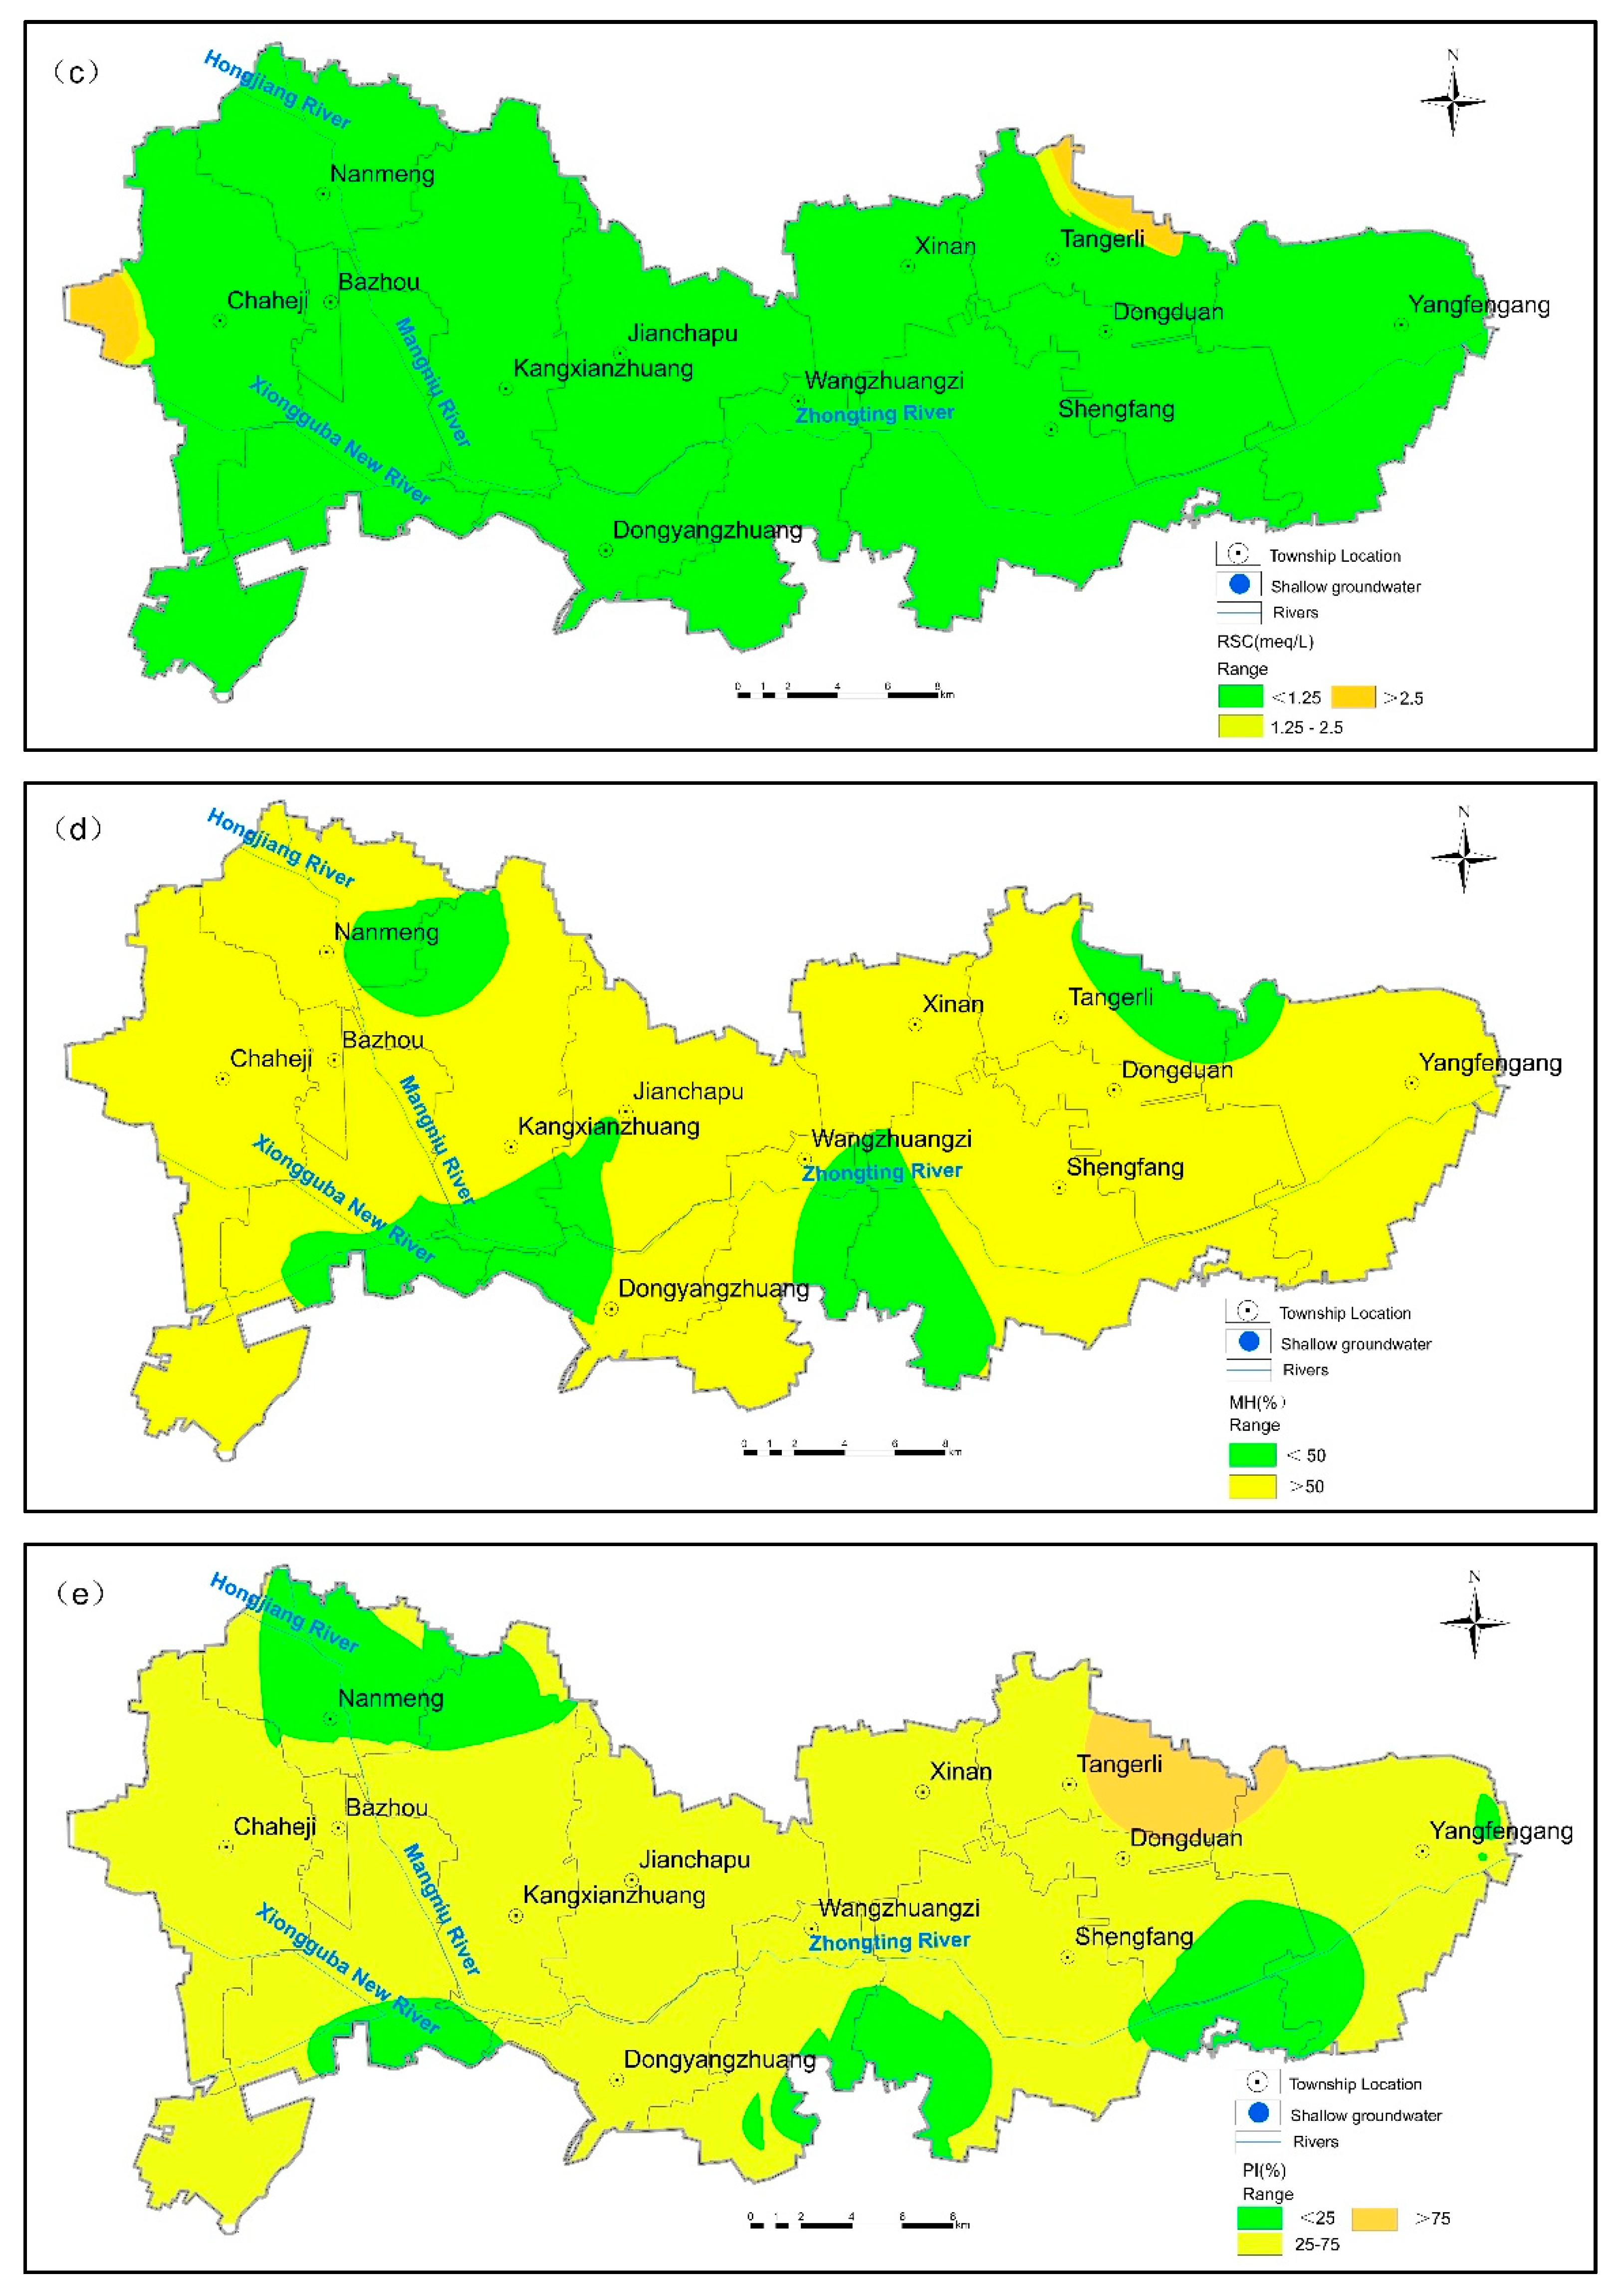
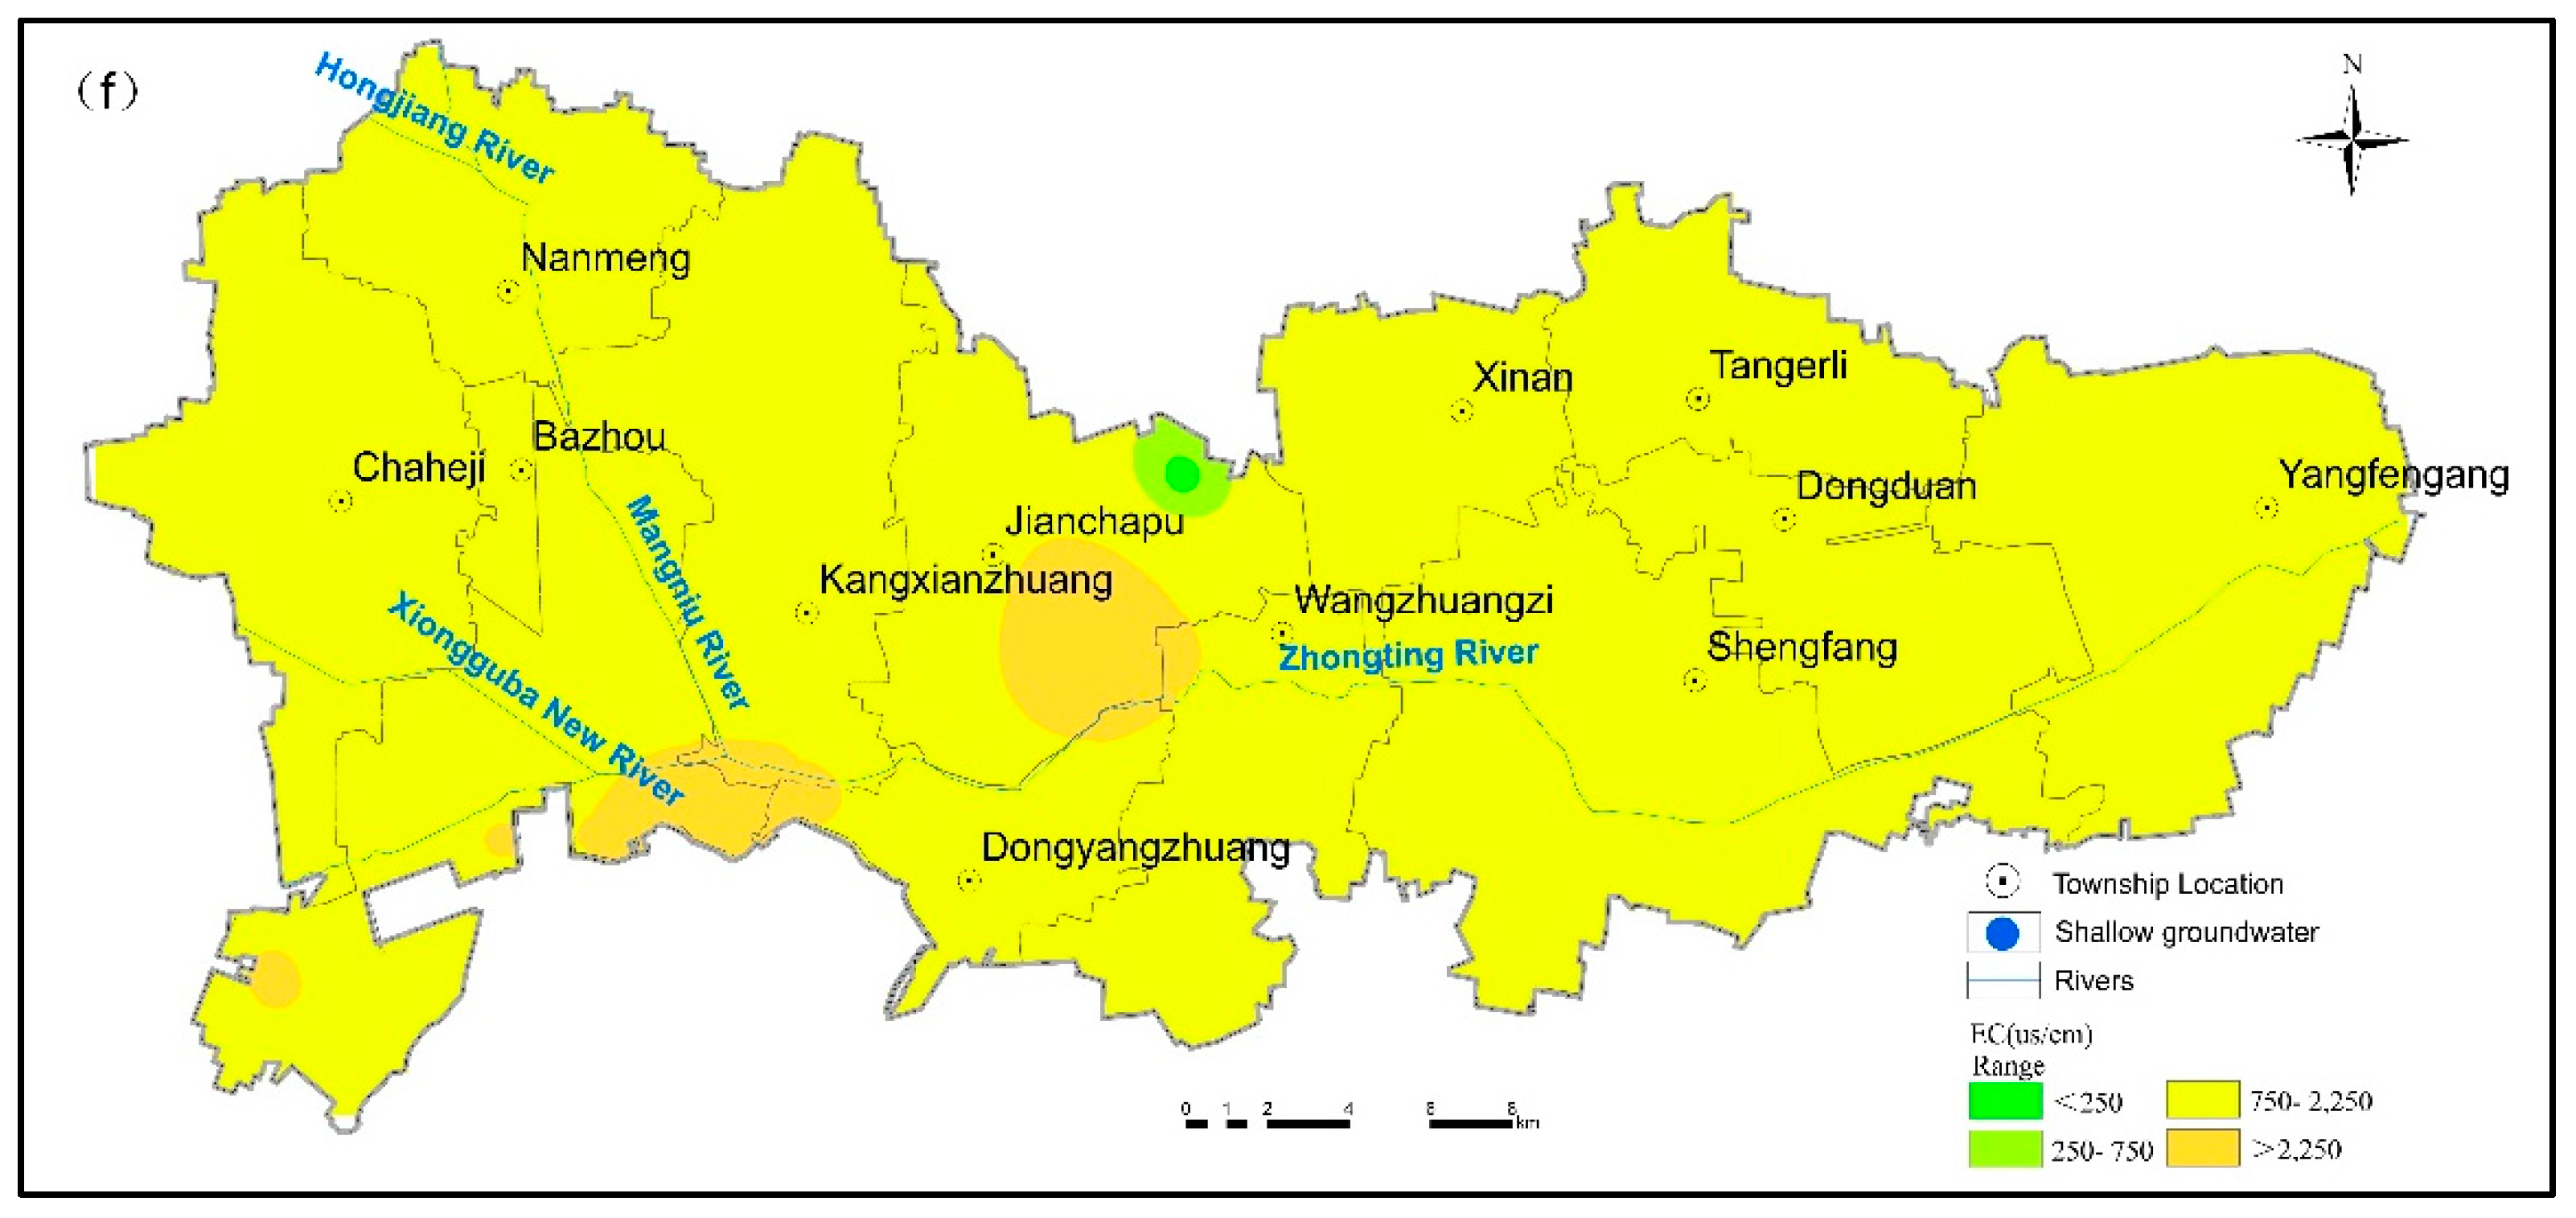
3.3. Suitability Evaluation for Agricultural Irrigation

The shallow groundwater suitability evaluation for agricultural irrigation was conducted based on Table 1 using six evaluation indexes: SAR, %Na, RSC, MH, PI and EC. Irrigation suitability proportions based on different indexes are shown in Figure 4.
SAR can be used to test the suitability of groundwater for irrigation, and a higher SAR value indicates a stronger alkalinization capacity. The SAR values of groundwater in the study area ranged from 0.64 to 14.28 meq/L, showing that the groundwater in the study area has a low sodium hazard and is suitable for irrigation.
%Na is another manifestation of sodium hazard, where high concentrations of sodium can lead to magnesium and calcium deficiency in plants. To obtain a higher crop yield, generally, the %Na value of irrigation water should not exceed 60%. The %Na values of 95.2% of the shallow groundwater samples in the study area were less than 60%, indicating their suitability for irrigation. Moreover, the %Na values of 71.4% of the samples were less than 40%, showing the groundwater quality was excellent or good for irrigation.
RSC is used to describe the amount of carbonate and bicarbonate present in groundwater, which would reduce soil permeability when the concentration is too high. According to Table 2, RSC values in 95.2% of the shallow groundwater samples were less than 1.25 meq/L, indicating that the groundwater quality in this region is very suitable for irrigation. The RSC values in the remaining samples were greater than 2.5 meq/L, indicating that they were not suitable for irrigation.
MH is one of the important parameters used to estimate the groundwater suitability for irrigation [7]. When Mg2+ content in irrigated water reaches a certain level, magnesium alkalinization may occur in the soil affecting the soil structure. Only 33.3% of the groundwater samples in the study area had MH values of less than 50%, which were suitable for irrigation. The remaining region, with MH values greater than 50%, may lead to soil magnesinization during long-term irrigation using groundwater.
PI is also an important parameter for measuring the groundwater suitability for irrigation. Based on computational analysis, PI values in 4.8% of the shallow groundwater samples were greater than 75%, indicating that the groundwater in these areas is suitable for irrigation. In addition, PI values in 23.8% of the shallow groundwater samples were less than 25%, indicating that the groundwater in these areas was not suitable for long-term irrigation.
Only 4.8% of the shallow groundwater samples were in the good category according to EC values. We found 71.4% of the samples had EC values between 750 µs/cm and 2250 µs/cm, suggesting that the shallow groundwater at these locations may not be suitable for drainage restricted soil. More seriously, 23.8% of the shallow groundwater samples were unsuitable for irrigation based on EC analysis.
An irrigation water classification diagram was drawn according to the U.S. irrigation water quality classification criteria to evaluate the feasibility of groundwater for irrigation. A USSL diagram (Figure 5a), where the SAR values were plotted against the EC values in irrigation groundwater, was used to comprehensively reflect sodium and salinity hazards [7]. The results showed that 57.1% of the shallow groundwater samples fell into C3-S1 zone (high salinity with low sodium hazard) where using groundwater for irrigation would not bring sodium harm. However, it was necessary to select crops with good salt tolerance for planting. In total, 14.3%, 9.5% and 9.5% of the shallow groundwater samples fell into the C4-S1 zone (very high salinity with low sodium hazard), C3-S2 zone (high salinity with medium sodium hazard) and C4-S2 zone (very high salinity with medium sodium hazard), respectively, where it was also necessary to select plants with good salt tolerance and take drainage measures. Overall, using shallow groundwater for agricultural irrigation would give rise to a serious salinity hazard, but the degree of sodium hazard would be low. The process of salt deposition and soil salinization is mainly caused by the salinity in irrigation water, which may reduce the effective absorption of water and nutrients by plants [20]. Reasonable drainage mode and good soil permeability are needed for better agricultural irrigation and lower salinity hazards [18].
The relationship between the electrical conductivity (EC) and the sodium percentage (%Na) was given by the Wilcox diagram for classifying irrigation water quality (Figure 5b). We found 57.1% and 33.3% of shallow groundwater samples were within good to permissible zone and doubtful to unsuitable zone, respectively. In general, most of the shallow groundwater in the study area was appropriate for irrigation based on the contrasting relationship between EC and %Na.
The classification zoning map about groundwater suitability for irrigation based on six irrigation indexes was shown in Figure 6. As can be seen from Figure 6a, almost all SAR values are less than 10 meq/L (Excellent level), indicating that groundwater in the study region has a low sodium hazard for irrigation. Based on Figure 6b, almost all groundwater is suitable for irrigation (%Na values less than 60%, Excellent, Good and Suitable levels), except for groundwater in the northeast part of the study (%Na values exceed 80%, Unsuitable level). According to the on-site investigation, there are factories in the northeast outside the study area, which may have effects on groundwater quality. Also, almost all RSC values are less than 1.25 meq/L (Good level) (Figure 6c), showing groundwater quality has a low harmful effect of carbonate on irrigation. MH values larger than 50% (Undesirable level) distribute in many parts of the study area (Figure 6d), which means the Mg2+ concentration in irrigation water reaches a certain level in many regions and may affect the soil structure. PI values in most areas range from 25% to 75% (Figure 6e), indicating that groundwater is moderately suitable for irrigation. However, PI values less than 25% (Unsuitable level) exist in some parts of the northwest and south of the study area, thus the permeability and drainage capacity of the soil in these areas need more attention. Almost all EC values range from 750 to 2250 (Doubtful level) (Figure 6f), meaning the groundwater suitability for irrigation is doubtful when assessed by the EC index.
In conclusion, the utilization of shallow groundwater for agricultural irrigation in the study area will bring a low degree of sodium hazard but a high degree of salinity hazard, thus salt-resistant planting mode and sufficient drainage measures are required to solve the irrigation problems from shallow groundwater. Mg2+ concentration in irrigation water and the permeability and drainage capacity of soil should cause more attention. Combined with the actual situation of crop irrigation and utilization of groundwater in the study area, some effective measures are suggested to take such as making appropriate irrigation management policies and cultivating salinity-friendly crops. What’s more, it is significant to apply reasonable fertilizer according to the needs of crops and soil characteristics, to improve the crop yield and promote the long-term development of agriculture.

3.4. Suitability Evaluation for Drinking and Health Risk Assessment

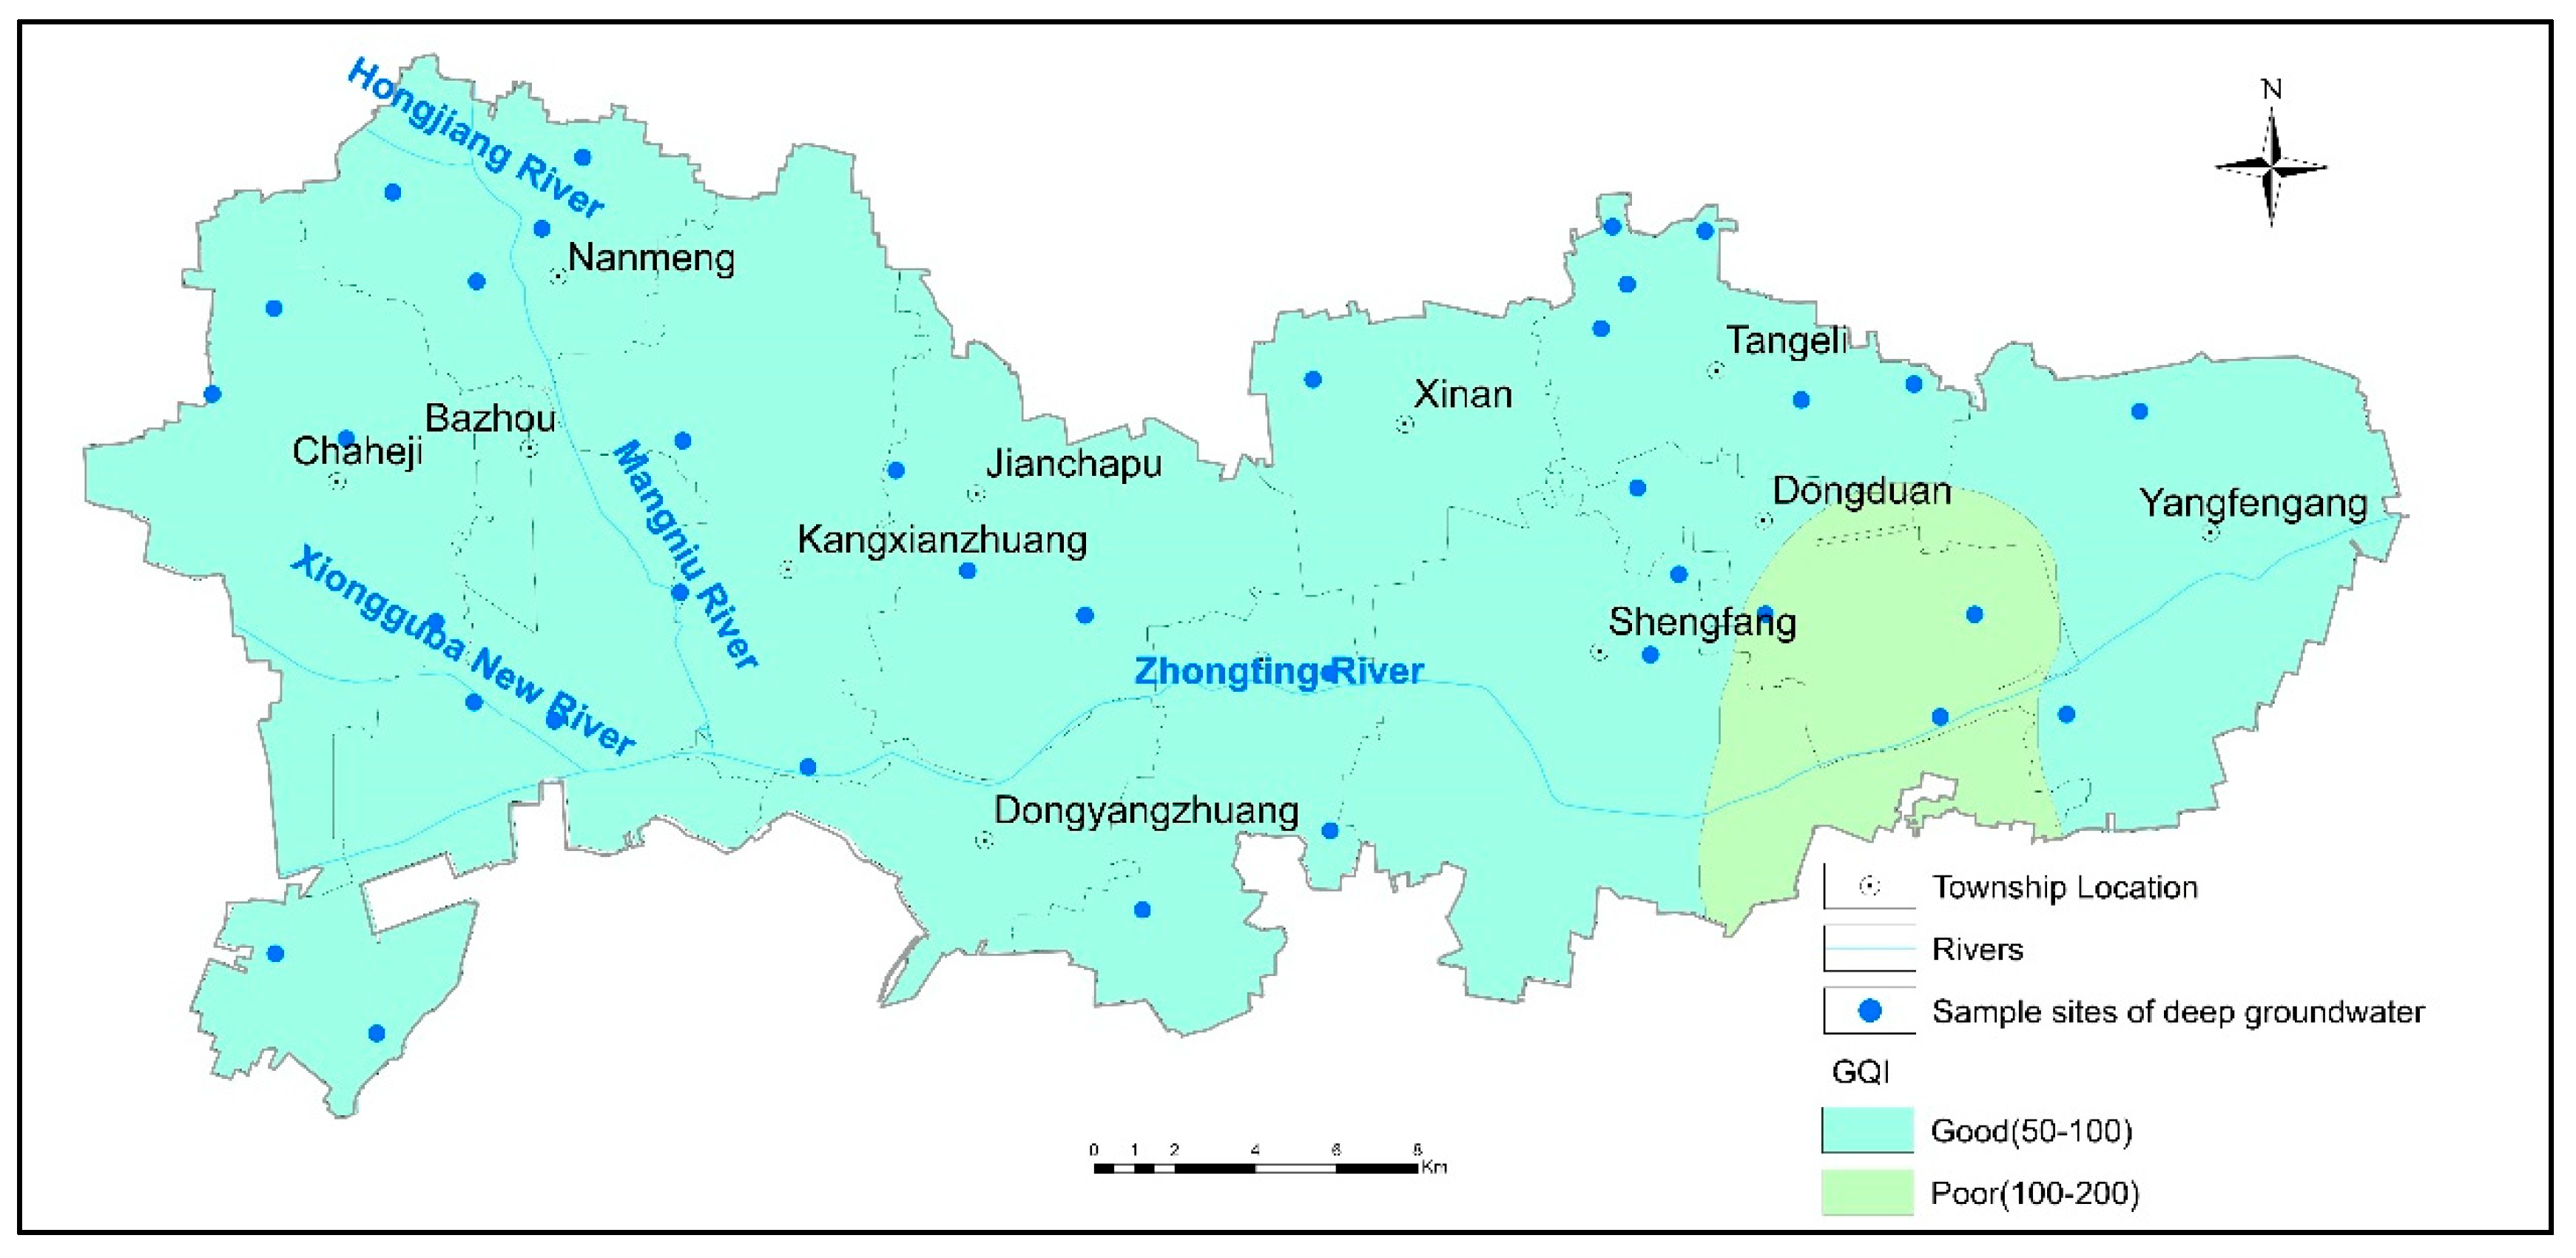
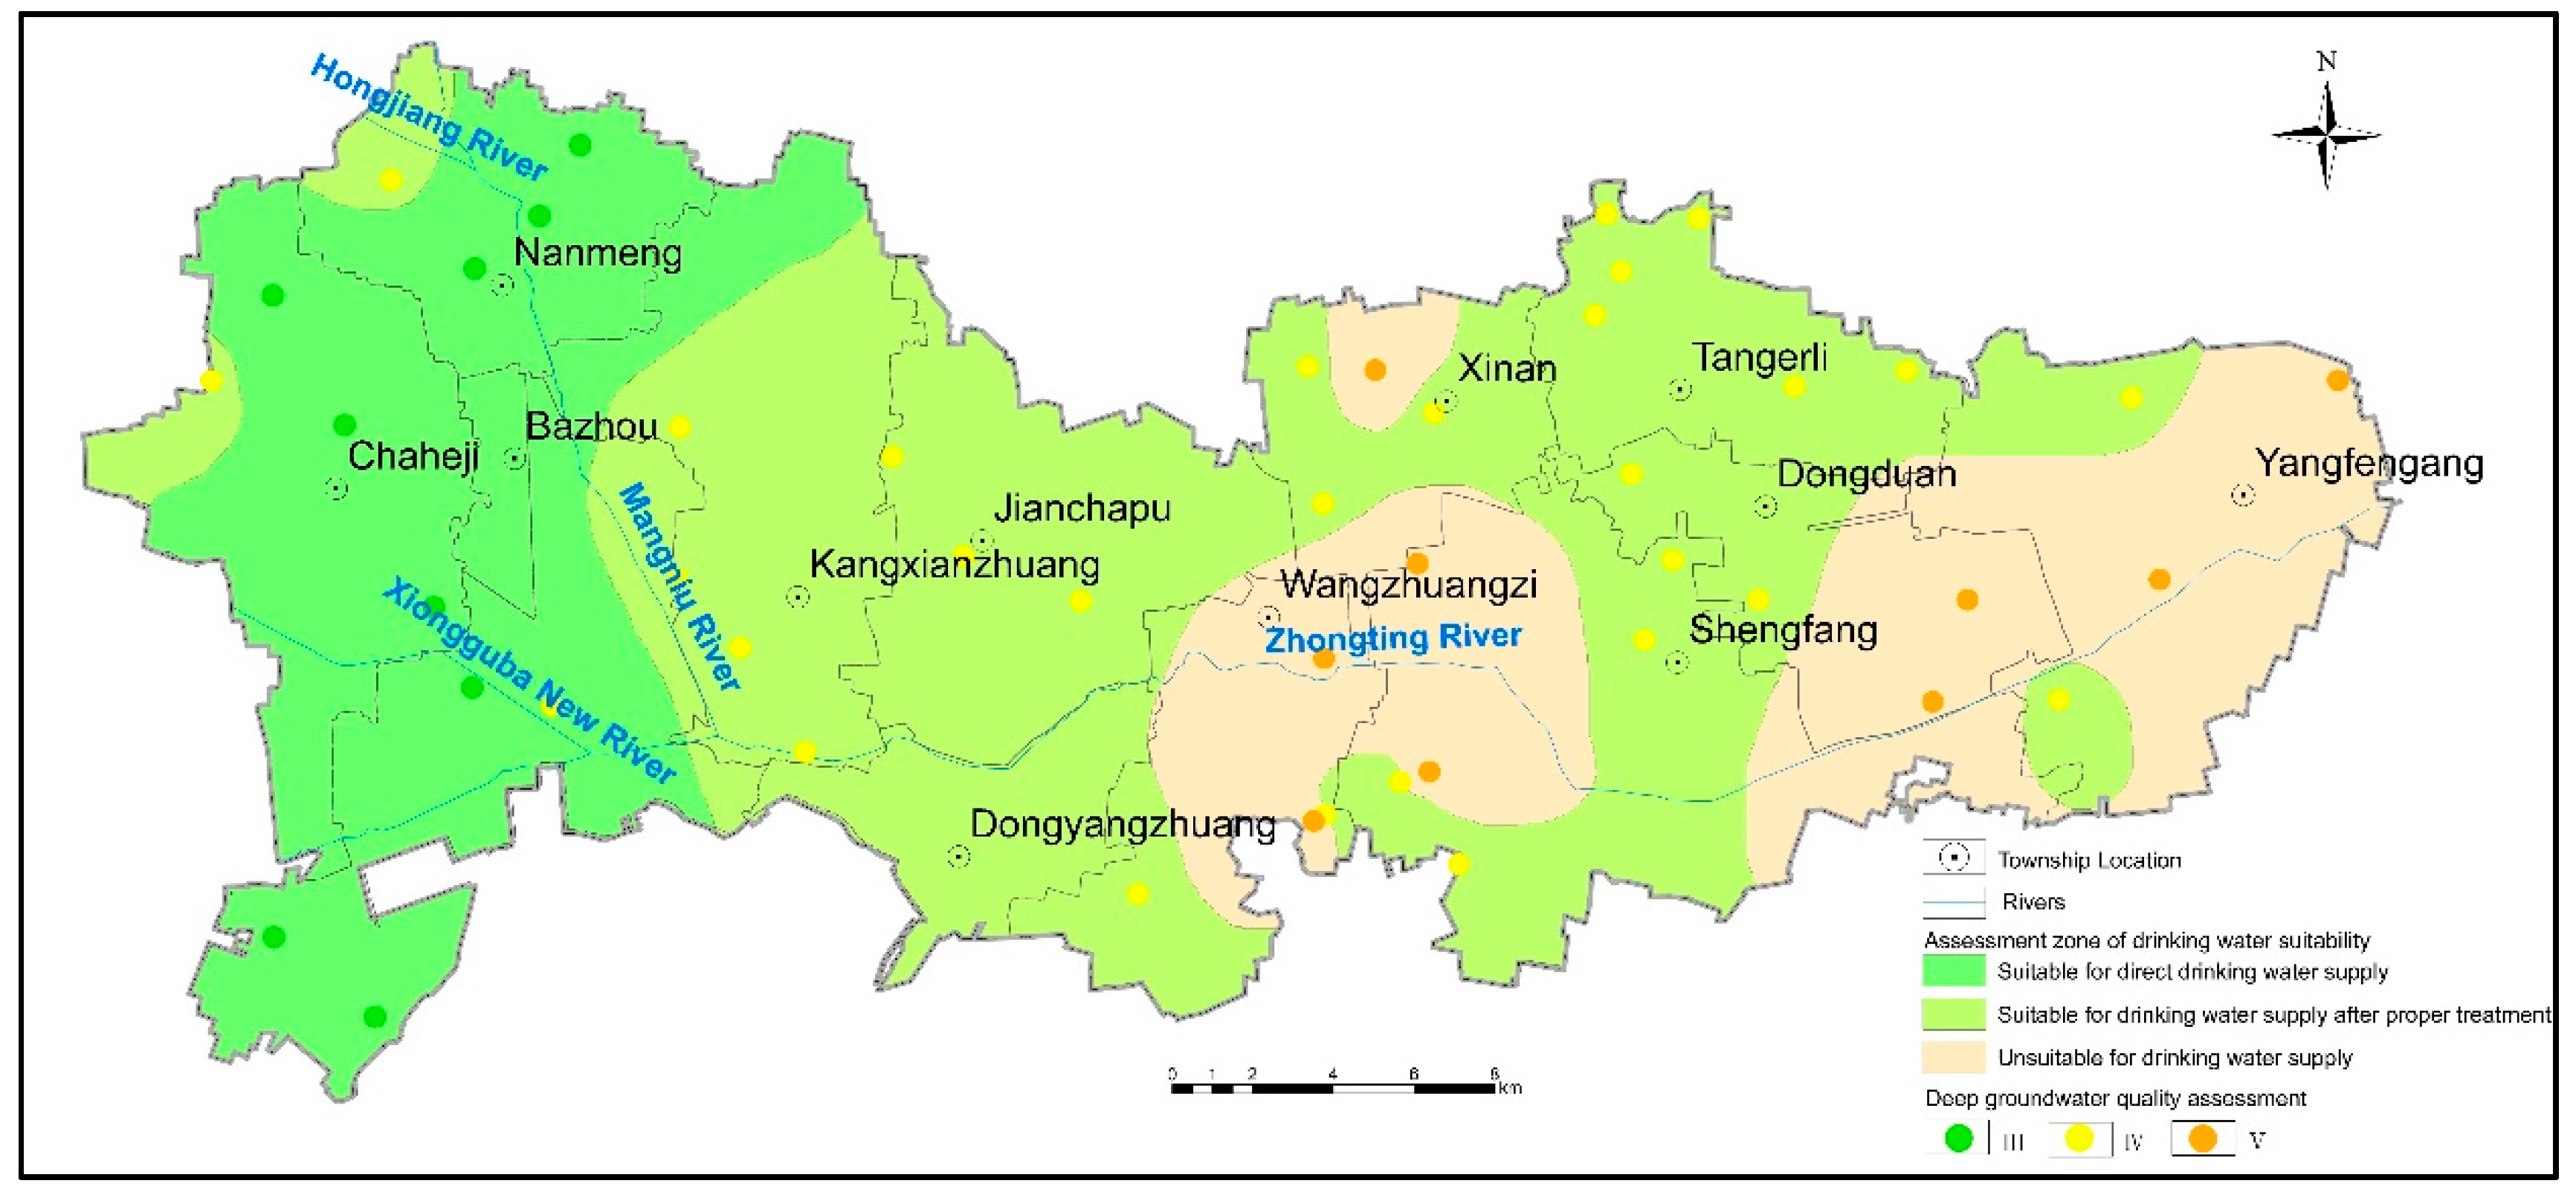
3.4.1. Suitability Evaluation for Drinking

Statistical analyses of the hydrochemical characteristics of groundwater and permissible limits of water quality are presented in Table 2. According to the SGQC and WHO, the permissible limit of pH is from 6.5 to 8.5. In the study area, 71.4% of the deep groundwater samples presented a high pH value exceeding 8.5. According to the suitability of groundwater based on hardness classification [13,30], the total hardness (TH) as CaCO3 (mg/L) could be divided into four types: soft (<75 mg/L), moderately hard (75–150 mg/L), hard (150–300 mg/L) and very hard (>300 mg/L). In this study area, 97.4% of the deep groundwater samples fell in the soft water category; 0.6% and 2% of the deep groundwater samples belonged to moderately hard and hard water, respectively. The main cations (Na+, K+, Ca2+ and Mg2+) and anions (Cl, SO42− and HCO3) in the deep groundwater samples were within the permissible concentration range in drinking water recommended by the WHO. The contents of CODMn, iron and manganese in the samples were lower than the Class III water limits of SGQC. NH4+, NO3, NO2 and PO43− in the samples were all below the permissible limits of drinking water recommended by the SGQC and WHO, reflecting little effect of agricultural activity on deep groundwater quality.
The physico-chemical basic parameters include pH, Cl, SO42−, HCO3, Ca2+, Mg2+, Na+, K+, TH, EC and TDS were calculated to get GQI values according to the WHO (2011). GQI values indicated the groundwater’s suitability for drinking purposes. The spatially distributed GQI values were interpolated using the Kriging interpolation method (Figure 7). It is shown that the GQI values of most deep groundwater samples range from 50 to 100, meaning the groundwater quality is good for drinking purposes and meets the World Health Organization (WHO) standard. The GQI values of groundwater in the east part of the study area range from 100 to 200, showing the poor quality of groundwater for drinking. The main reason is the higher content of Na+, Cl and TDS in groundwater of the east region.
The fluoride concentration of deep groundwater in the study area ranged from 0.29 to 4.21 mg/L and the mean value was 2.23 mg/L. We found 79.0% of the groundwater samples with a fluoride concentration higher than the Class III water limit of SGQC (1 mg/L) and 65.8% of the samples with a fluoride concentration exceeding the permissible limit-concentration specified by the WHO (1.5 mg/L), indicating that there is a risk of excessive fluoride in groundwater. Physical or chemical methods need to be used to reduce the fluorine concentration in the groundwater of the study area. Iodine test results showed that 21.1% of deep groundwater samples exceeded the Class III standard (0.08 mg/L) according to SGQC. Excessive iodine intake can cause diseases such as thyroid function disease [63]. Monitoring work for iodine concentration in food should be further strengthened, and it is significant to take iodine reduction measures such as stopping iodine salt and water source modification in high iodine areas.
Based on a comprehensive water quality evaluation method recommended by SGQC, 9 of the 38 groundwater sampling points in the study area were classified as the Class III category, which were mainly distributed in the west of the study area. Twenty of the deep groundwater samples were classified as Class IV, and nine were classified as Class V, which were mainly distributed in the east of the study area. According to the SGQC groundwater quality classification standard and the current situation of deep groundwater quality, the study area could be divided into three parts: Class III zone, where groundwater is suitable for direct drinking water supply; Class IV groundwater area, where groundwater is suitable for drinking water supply after proper treatment; Class V zone, where groundwater is unsuitable for drinking water supply. The spatial distribution of drinking water quality suitability was interpolated using the Kriging interpolation method and visualized using ArcGIS software (Figure 8). It can be seen that the deep groundwater quality in the western study area is suitable for direct drinking. The deep groundwater in the central parts of the study area including Kangxinzhuang Town, Jianchapu Town, Dongyangzhuang Town and Tangerli Town could be used as a drinking water supply source after proper treatment. The deep groundwater in the central and eastern parts of the study area including Dongduan Town, Yangfengang Town, Wangzhuangzi Town and Shengfang Town may be inappropriate for a drinking water supply. Fluorine is the main factor excessing the standard values in groundwater of these locations., The fluorine concentration in deep groundwater for long-term drinking water supply deserved close attention due to the risk of skeletal fluorosis.

3.4.2. Drinking Water Health Risk Assessment

This study focused on exposure assessment of drinking water intake and skin contact, in which drinking water intake is considered as the major pathway of chemicals entering the human body. Health risk assessment was conducted for different age groups (children, adult men and adult women) based on the results of deep groundwater quality analysis in the study area. The corresponding potential non-carcinogenic health risk values for F and I through ingestion of water and dermal absorption were evaluated according to the International Center for the Study of Cancer (IARC), as shown in Table 5.
According to Table 3, the HQ values of F and I in deep groundwater varied greatly in populations with different age groups (children, adult males and adult females). The health risk values of F ranged from 0.22 to 3.10 with an average value of 1.70 for children. Meanwhile, the HQ values of 71.1% of the deep groundwater sampling sites outstripped the acceptable safety limit. If groundwater is used directly for drinking purposes, significant health risks will be brought to children. For adult males, the HQ values of F ranged between 0.15 and 2.20, with the mean value 1.2, and the health risk of 65.8% of the deep groundwater sampling sites was unacceptable. For adult women, the HQ levels of F varied from 0.17 to 2.40 with the mean level of 1.3, and the HQ values of 65.8% of the deep groundwater sampling sites exceeded the acceptable safety limits. Chronic use of deep groundwater would pose potential harm to female adults. The HQ values of I ranged from 0.018 to 3.30 with an average value of 0.49 for children, and the HQ values of 18.4% of the deep groundwater sampling sites exceeded the safety limits. Long-term exposure to groundwater with a high iodine concentration can have potentially harmful and adverse effects on children. The HQ values of I for adult males ranged from 0.013 to 2.30 with an average value of 0.35, and the HQ values of 10.5% of the deep groundwater sampling sites were unacceptable. For adult women, the HQ levels of I varied from 0.014 to 2.50 with the mean level of 0.37, and the HQ values of 10.5% of the deep groundwater sampling sites exceeded the permissible level.
The above results indicated that children have a higher health risk from excessive intake of high fluoride and iodine in groundwater than in adults, in descending order of children, adult females and adult males. This phenomenon is mainly attributed to children’s bodies being more sensitive, lower weight and less immune than adults, so they are more susceptible to health risks by ingesting water containing high concentrations of fluoride and iodine. This finding is consistent with many previous studies in other regions such as China, India, Iran and so on [64,65,66]. Long-term drinking of high fluoride groundwater will endanger human health, so it is suggested that before groundwater is used as drinking water, adsorption method and chemical sedimentation method can be applied to reduce the concentration of fluorine and protect the safety of the drinking water environment.

3.5. Cause of High Fluoride Groundwater Formation

In terms of geological background, high fluorinated groundwater is mainly caused by weathering, dissolution and groundwater-rock interactions containing fluorine minerals (apatite, fluorite, mica, etc.) in Quaternary deposits [13,38,61]. The groundwater moves slowly in the study area because of the poor dynamic conditions, and deep groundwater in a closed environment moves more slowly, which is conducive to the enrichment of fluorine elements.
In terms of chemical type and chemical composition of groundwater, alkaline groundwater is conducive to the dissolution of fluorine-containing minerals. There are more OH, which are easy to replace F in fluorine-containing minerals. The alkalinity environment with high HCO3 and Na+ may accelerate the solubility of fluorite in groundwater in the study area, and competitive adsorption between fluoride and bicarbonate promoted the release of fluoride in the sediment, leading to an increased concentration of fluoride in groundwater [39,67]. The pH value of groundwater in the study area is about eight, which indicates the alkaline characteristics. Ca2+ and CO32− produce calcium carbonate precipitation, improving the molar concentration of Na+. The characteristics of high HCO3 and Na+ concentrations in the study area are conducive to the formation and stability of fluoride in groundwater.
The effect of human activity on the fluoride content in groundwater cannot be negligible. Fluorinated solid waste and wastewater emissions from industrial activity can lead to fluorine concentration increase in soil and groundwater. In addition, groundwater over-exploitation leads to water level decline and soil layer compression, which is another important factor for fluorine concentration increasing in groundwater [68,69]. With long-term exploitation of deep groundwater, the water level of the sand aquifer in the main exploitation layer is declining. Due to the difference in water level, water is released from the clay soil layer and the fluorine ions adsorbed by the clay soil are also released, increasing the fluorine content in the groundwater. It can be learned from this study that regions with higher F concentrations were consistent with regions of lower deep groundwater levels and larger ground subsidence based on spatial distribution analysis. Good correspondence was found between fluorine concentration changes with groundwater level and soil compression in deep groundwater in the Hebei Plain [70,71]. The layout and exploitation quantity of deep groundwater exploitation wells should be scientifically standardized because the soil layer compression caused by groundwater over-exploitation may increase the fluoride concentration in deep groundwater.

4. Conclusions

In this study, the suitability of shallow groundwater for irrigation and deep groundwater for drinking in a typical agricultural area of North China Plain were analyzed. What’s more, the human health risks associated with over-standard chemicals in groundwater were evaluated. The groundwater belongs to a Quaternary loose rock pore water aquifer. The depths of shallow groundwater wells are 20–150 m below the surface, while the depths of deep groundwater wells are 150–650 m. The main conclusions are as follows:
Hydrochemical analysis revealed that groundwater in the study area was generally in an alkaline environment. According to the analysis of SAR, Na% and RSC indexes, the shallow groundwater was suitable for irrigation in the study area. According to the irrigation water quality classification, 57.1% of the shallow groundwater samples fell into high salinity with a low sodium hazard zone, and 14.3% of the samples fell into very high salinity with a low sodium hazard zone. Crops with good salt tolerance and drainage measures were necessary for sustainable agricultural development.
The evaluation of drinking water quality suitability showed that F concentrations in 79.0% of the deep groundwater samples exceeded the Class III water limits of SGQC (1 mg/L) and 65.8% of the deep groundwater samples contained F levels exceeding the permissible value of 1.5 mg/L recommended by the WHO for drinking. Groundwater with a high concentration of fluoride was mainly distributed in the east of the study area.
The total hazard quotient HQ values of F exceeded the safety limits (HQ >1) in over half of the deep groundwater samples, and the degree of risk varied greatly in populations of different age groups, in descending order of children, adult females and adult males. Except for natural factors, the soil layer compression caused by groundwater over-exploitation is an important reason for high fluoride concentration in deep groundwater.
The rational exploitation of limited groundwater resources is a significant challenge. Effective measures about groundwater management should be strengthened, such as carrying out long-term groundwater quality investigation and monitoring, establishing specialized research projects about fluoride in groundwater and controlling the amount of groundwater exploitation for irrigation. Physical or chemical methods should be better used to reduce the fluorine concentration in groundwater and improve the quality of drinking water. The study on the relationship between fluorine concentration change and soil layer compression needs more attention. Although this study answers important questions about the suitability of groundwater quality for irrigation and drinking, its temporal trends in this region have remained unsolved. More research work about this subject is suggested to be conducted in the future.

Author Contributions

Conceptualization, H.G. and M.L.; data curation, H.G., L.W. and X.Z. (Xisheng Zang); formal analysis, H.G. and M.L.; funding acquisition, H.G., M.L. and Y.W.; investigation, Y.W., X.Z. (Xiaobing Zhao), H.G., M.L., H.W. and J.Z.; methodology, H.G. and M.L.; supervision, L.W.; writing—original draft, M.L. and H.G.; writing—review and editing, H.G., M.L. and L.W. All authors have read and agreed to the published version of the manuscript.

Funding

This work was supported by the National Natural Science Foundation of China (Grant No. 41877294) and the China Geological Survey (Grant Nos. DD20190679 and DD20160235).

Institutional Review Board Statement

Not applicable.

Informed Consent Statement

Not applicable.

Data Availability Statement

Not applicable.

Acknowledgments

The authors are appreciative of the valuable comments and advice given by editors and anonymous reviewers. The authors also thank Xin Yan for revising the English text of this manuscript.

Conflicts of Interest

The authors declare no conflict of interest.

References

  1. Beyene, G.; Aberra, D.; Fufa, F. Evaluation of the suitability of groundwater for drinking and irrigation purposes in Jimma Zone of Oromia, Ethiopia. Groundw. Sustain. Dev. 2019, 9, 1–11. [Google Scholar] [CrossRef]
  2. Karunanidhi, D.; Aravinthasamy, P.; Kumar, D.; Subramani, T.; Roy, P. Sobol sensitivity approach for the appraisal of geomedical health risks associated with oral intake and dermal pathways of groundwater fluoride in a semi-arid region of south India. Ecotoxicol. Environ. Saf. 2020, 194, 1–12. [Google Scholar] [CrossRef]
  3. Maghrebi, M.; Noori, R.; Partani, S.; Araghi, A.; Haghighi, A. Iran’s Groundwater Hydrochemistry. Earth Space Sci. 2021, 8, 1–17. [Google Scholar] [CrossRef]
  4. Noori, R.; Maghrebi, M.; Mirchi, A.; Tang, Q.; Bhattarai, R.; Sadegh, M.; Noury, M.; Haghighi, A.; Kløve, B.; Madani, K. Anthropogenic depletion of Iran’s aquifers. Proc. Natl. Acad. Sci. USA 2021, 118, 1–7. [Google Scholar] [CrossRef] [PubMed]
  5. Medici, G.; Baják, P.; West, L.; Chapman, P.; Banwart, S. DOC and nitrate fluxes from farmland; impact on a dolostone aquifer KCZ. J. Hydrol. 2021, 595, 125658. [Google Scholar] [CrossRef]
  6. Ghahremanzadeh, H.; Noori, R.; Baghvand, A.; Nasrabadi, T. Evaluating the main sources of groundwater pollution in the southern Tehran aquifer using principal component factor analysis. Environ. Geochem. Health 2018, 40, 1317–1328. [Google Scholar] [CrossRef] [PubMed]
  7. Bian, J.; Nie, S.; Wang, R.; Wan, H.; Liu, C. Hydrochemical characteristics and quality assessment of groundwater for irrigation use in central and eastern Songnen Plain, Northeast China. Environ. Monit. Assess. 2018, 190, 1–6. [Google Scholar] [CrossRef] [PubMed]
  8. Dev, R.; Bali, M. Evaluation of groundwater quality and its suitability for drinking and agricultural use in district Kangra of Himachal Pradesh, India. J. Saudi. Soc. Agric. Sci. 2019, 18, 462–468. [Google Scholar] [CrossRef]
  9. Jasmin, I.; Mallikarjuna, P. Evaluation of groundwater suitability for irrigation in the Araniar River Basin, South India—A case study using Gis approach. Irrig Drain. 2015, 64, 600–608. [Google Scholar] [CrossRef]
  10. Li, P.; Wu, J.; Qian, H. Assessment of groundwater quality for irrigation purposes and identification of hydrogeochemical evolution mechanisms in Pengyang County, China. Environ. Earth Sci. 2013, 69, 2211–2225. [Google Scholar] [CrossRef]
  11. Gowd, S. Assessment of groundwater quality for drinking and irrigation purposes: A case study of Peddavanka watershed, Anantapur District, Andhra Pradesh, India. Environ. Geol. 2005, 48, 702–712. [Google Scholar] [CrossRef]
  12. Srinivasamoorthy, K.; Vasanthavigar, M.; Vijayaraghavan, K.; Sarathidasan, R.; Gopinath, S. Hydrochemistry of groundwater in a coastal region of Cuddalore district, Tamilnadu, India: Implication for quality assessment. Arab. J. Geosci. 2013, 6, 441–454. [Google Scholar] [CrossRef]
  13. Aghazadeh, N.; Mogaddam, A. Assessment of groundwater quality and its suitability for drinking and agricultural uses in the Oshnavieh Area, Northwest of Iran. J. Environ. Prot. 2010, 1, 30–40. [Google Scholar] [CrossRef] [Green Version]
  14. Gu, X.; Xiao, Y.; Yin, S.; Hao, Q.; Liu, H.; Hao, Z.; Meng, G.; Pei, Q.; Yan, H. Hydrogeochemical characterization and quality assessment of groundwater in a long-term reclaimed water irrigation area, North China Plain. Water 2018, 10, 1209. [Google Scholar] [CrossRef] [Green Version]
  15. Anim-Gyampo, M.; Anornu, G.; Appiah-Adjei, E.; Agodzo, S. Quality and health risk assessment of shallow groundwater aquifers within the Atankwidi basin of Ghana. Groundw. Sustain. 2019, 9, 100217. [Google Scholar] [CrossRef]
  16. Chidambaram, S.; Prasanna, M.; Venkatramanan, S.; Nepolian, M.; Pradeep, K. Groundwater quality assessment for irrigation by adopting new suitability plot and spatial analysis based on fuzzy logic technique. Environ. Res. 2022, 204, 1–15. [Google Scholar]
  17. Subramani, T.; Elango, L.; Damodarasamy, S. Groundwater quality and its suitability for drinking and agricultural use in Chithar River Basin, Tamil Nadu, India. Environ. Geol. 2005, 47, 1099–1110. [Google Scholar] [CrossRef]
  18. Adimalla, N.; Li, P.; Venkatayogi, S. Hydrogeochemical evaluation of groundwater quality for drinking and irrigation purposes and integrated interpretation with water quality index studies. Environ. Process. 2018, 5, 363–383. [Google Scholar] [CrossRef]
  19. Adimalla, N.; Vasa, S.; Li, P. Evaluation of groundwater quality, Peddavagu in Central Telangana (PCT), South India: An insight of controlling factors of fluoride enrichment. Model. Earth Syst. Environ. 2018, 4, 841–852. [Google Scholar] [CrossRef]
  20. Abd El-Aziz, S. Evaluation of groundwater quality for drinking and irrigation purposes in the north-western area of Libya (Aligeelat). Environ. Earth Sci. 2017, 76, 1–7. [Google Scholar] [CrossRef]
  21. Ehya, F.; Marbouti, Z. Hydrochemistry and contamination of groundwater resources in the Behbahan plain, SW Iran. Environ. Earth Sci. 2016, 75, 1–13. [Google Scholar] [CrossRef]
  22. Zhang, L.; Huang, D.; Yang, J.; Wei, X.; Qin, J.; Ou, S.; Zhang, Z.; Zou, Y. Probabilistic risk assessment of Chinese residents’ exposure to fluoride in improved drinking water in endemic fluorosis areas. Environ. Pollut. 2017, 222, 118–125. [Google Scholar] [CrossRef]
  23. Aradpour, S.; Noori, R.; Tang, Q.; Bhattarai, R.; Hooshyaripor, F.; Hosseinzadeh, M.; Haghighi, A.; Klöve, B. Metal contamination assessment in water column and surface sediments of a warm monomictic man-made lake: Sabalan Dam Reservoir, Iran. Hydrol. Res. 2020, 51, 799–814. [Google Scholar] [CrossRef]
  24. Li, P.; He, X.; Li, Y.; Xiang, G. Occurrence and health implication of fluoride in groundwater of loess aquifer in the Chinese loess plateau: A case study of Tongchuan, Northwest China. Expo. Health 2019, 11, 95–107. [Google Scholar] [CrossRef]
  25. Yu, Y.; Yang, J. Health risk assessment of fluorine in fertilizers from a fluorine contaminated region based on the oral bioaccessibility determined by Biomimetic Whole Digestion-Plasma in-vitro Method (BWDPM). J. Hazard Mater. 2020, 383, 121124. [Google Scholar] [CrossRef] [PubMed]
  26. Emenike, C.; Tenebe, I.; Jarvis, P. Fluoride contamination in groundwater sources in Southwestern Nigeria: Assessment using multivariate statistical approach and human health risk. Ecotoxicol. Environ. Saf. 2018, 156, 391–402. [Google Scholar] [CrossRef] [PubMed] [Green Version]
  27. Zhai, Y.; Lei, Y.; Wu, J.; Teng, Y.; Wang, J.; Zhao, X.; Pan, X. Does the groundwater nitrate pollution in China pose a risk to human health? A critical review of published data. Environ. Sci. Pollut. Res. 2016, 24, 3640–3653. [Google Scholar] [CrossRef]
  28. Jianmin, B.; Yu, W.; Juan, Z. Arsenic and fluorine in groundwater in western Jilin Province, China: Occurrence and health risk assessment. Nat. Hazards 2015, 77, 1903–1914. [Google Scholar] [CrossRef]
  29. Qin, L.; Pang, X.; Zeng, H.; Liang, Y.; Mo, L.; Wang, D.; Dai, J. Ecological and human health risk of sulfonamides in surface water and groundwater of Huixian karst wetland in Guilin, China. Sci. Total Environ. 2020, 708, 134552. [Google Scholar] [CrossRef]
  30. Adimalla, N.; Qian, H. Groundwater quality evaluation using water quality index (WQI) for drinking purposes and human health risk (HHR) assessment in an agricultural region of Nanganur, south India. Ecotoxicol. Environ. Saf. 2019, 176, 153–161. [Google Scholar] [CrossRef]
  31. Aradpour, S.; Noori, R.; Naseh, M.; Hosseinzadeh, M.; Safavi, S.; Ghahraman-Rozegar, F.; Maghrebi, M. Alarming carcinogenic and non-carcinogenic risk of heavy metals in Sabalan dam reservoir, Northwest of Iran. Environ. Pollut. Bioavailab. 2021, 33, 278–291. [Google Scholar] [CrossRef]
  32. Fang, H.; Lin, Z.; Fu, X. Spatial variation, water quality, and health risk assessment of trace elements in groundwater in Beijing and Shijiazhuang, North China Plain. Environ. Sci. Pollut. Res. 2021, 28, 57046–57059. [Google Scholar] [CrossRef]
  33. Liu, J.; Gao, Z.; Zhang, Y.; Sun, Z.; Sun, T. Hydrochemical evaluation of groundwater quality and human health risk assessment of nitrate in the largest peninsula of China based on high-density sampling: A case study of Weifang. J. Clean. Prod. 2021, 322, 1–12. [Google Scholar] [CrossRef]
  34. Zhai, Y.; Zhao, X.; Teng, Y.; Li, X.; Zhang, J.; Wu, J.; Zuo, R. Groundwater nitrate pollution and human health risk assessment by using HHRA model in an agricultural area, NE China. Ecotoxicol. Environ. Saf. 2017, 137, 130–142. [Google Scholar] [CrossRef]
  35. Adimalla, N.; Li, P. Occurrence, health risks, and geochemical mechanisms of fluoride and nitrate in groundwater of the rockdominant semi-arid region, Telangana State, India. Hum. Ecol. Risk Assess. 2019, 25, 81–103. [Google Scholar] [CrossRef]
  36. Aghapour, S.; Bina, B.; Tarrahi, M.; Amiri, F.; Ebrahimi, A. Distribution and health risk assessment of natural fluoride of drinking groundwater resources of Isfahan, Iran, using GIS. Environ. Monit. Assess. 2018, 190, 1–3. [Google Scholar] [CrossRef] [PubMed]
  37. Li, P.; Qian, H.; Wu, J.; Chen, J.; Zhang, Y.; Zhang, H. Occurrence and hydrogeochemistry of fluoride in alluvial aquifer of Weihe River, China. Env. Earth Sci. 2014, 71, 3133–3145. [Google Scholar] [CrossRef]
  38. Narsimha, A.; Sudarshan, V. Assessment of fluoride contamination in groundwater from Basara, Adilabad District, Telangana State, India. Appl. Water. Sci. 2017, 7, 2717–2725. [Google Scholar] [CrossRef] [Green Version]
  39. Li, J.; Zhou, H.; Qian, K.; Xie, X.; Xue, X.; Yang, Y.; Wang, Y. Fluoride and iodine enrichment in groundwater of North China Plain: Evidences from speciation analysis and geochemical modeling. Sci. Total Environ. 2017, 598, 239–248. [Google Scholar] [CrossRef]
  40. Fallahzadeh, R.; Miri, M.; Taghavi, M.; Gholizadeh, A.; Anbarani, R. Spatial variation and probabilistic risk assessment of exposure to fluoride in drinking water. Food Chem. Toxicol. 2018, 113, 314–321. [Google Scholar] [CrossRef] [PubMed]
  41. Yadav, K.; Kumar, V.; Gupta, N.; Kumar, S.; Rezania, S.; Singh, N. Human health risk assessment: Study of a population exposed to fluoride through groundwater of Agra city, India. Regul. Toxicol. Pharmacol. 2019, 106, 68–80. [Google Scholar] [CrossRef]
  42. Gu, X.; Xiao, Y.; Yin, S.; Pan, X.; Niu, Y.; Shao, J.; Cui, Y.; Zhang, Q.; Hao, Q. Natural and anthropogenic factors affecting the shallow groundwater quality in a typical irrigation area with reclaimed water, North China Plain. Environ. Monit. Assess. 2017, 189, 1–12. [Google Scholar] [CrossRef]
  43. Liu, H.; Guo, H.; Yang, L.; Wu, L.; Li, F.; Li, S.; Ni, P.; Liang, X. Occurrence and formation of high fluoride groundwater in the Hengshui area of the North China Plain. Environ. Earth Sci. 2015, 74, 2329–2340. [Google Scholar] [CrossRef]
  44. Zhao, X.; Guo, H.; Wang, Y.; Wang, G.; Wang, H.; Zang, X.; Zhu, J. Groundwater hydrogeochemical characteristics and quality suitability assessment for irrigation and drinking purposes in an agricultural region of the North China plain. Environ. Earth Sci. 2021, 80, 162. [Google Scholar] [CrossRef]
  45. Shi, S.; Zhang, J. The current situation and countermeasures about the utilization of groundwater resources in Bazhou. Hebei Water Res. 2010, 32, 1–2. (In Chinese) [Google Scholar]
  46. Zhang, G.; Yan, X.; Tian, Y.; Yan, M.; Wang, W. Response characteristic and mechanism of shallow groundwater level on the successive years with less rainfall in the agricultural areas of the central Hebei piedmont plain. J. Earth Sci. Environ. 2015, 37, 68–74, (In Chinese with English abstract). [Google Scholar]
  47. Yan, L.; Qin, Y.; Yang, H.; Zhang, J.; Le, Z. Characteristics of Bazhou ground temperature change from 1964–2015 and its relationship with temperature and precipitation. Mod. Agricult. Sci. Technol. 2018, 3, 223–229. (In Chinese) [Google Scholar]
  48. Zhang, Z.; Shi, D.; Fuhong, R.; Yin, Z.; Sun, J.; Zhang, C. Evolution of quaternary groundwater system in North China Plain. Sci. China 1997, 40, 276–283. [Google Scholar] [CrossRef]
  49. Xing, L.; Guo, H.; Zhan, Y. Groundwater hydrochemical characteristics and processes along flow paths in the North China Plain. J. Asian Earth Sci. 2013, 70–71, 250–264. [Google Scholar] [CrossRef]
  50. Najafzadeh, M.; Homaei, F.; Mohamadi, S. Reliability evaluation of groundwater quality index using data-driven models. Environ. Sci. Pollut. Res. 2021. [Google Scholar] [CrossRef]
  51. Raju, N. Hydrogeochemical parameters for assessment of groundwater quality in the upper Gunjanaeru River basin, Cuddapah District, Andhra Pradesh, South India. Environ. Geol. 2007, 52, 1067–1074. [Google Scholar] [CrossRef]
  52. Abboud, I. Geochemistry and quality of groundwater of the Yarmouk basin aquifer, north Jordan. Environ. Geochem. Health 2018, 40, 1405–1435. [Google Scholar] [CrossRef]
  53. USSL Salinity Laboratory. Diagnosis and Improvement of Saline and Alkaline Soils; US Department of Agriculture Handbook; No. 60; US Department of Agriculture: Washington, DC, USA, 1954.
  54. Wilcox, L. Classification and Use of Irrigation Water, 4th ed.; USDA, Circular: Washington, DC, USA, 1955; p. 969.
  55. WHO Guidelines for Drinking Water Quality: Fourth Edition Incorporating the First Addendum; World Health Organization: Geneva, Switzerland, 2017.
  56. WHO Guidelines for Drinking-Water Quality; World Health Organization: Geneva, Switzerland, 2011.
  57. U.S. EPA. Risk Assessment Guidance for Superfund Volume I—Human Health Evaluation Manual; Office of Emergency and Remedial Response: Washington, DC, USA, 1989.
  58. U.S. EPA. Risk Assessment Guidance for Superfund Volume I: Human Health Evaluation Manual; Office of Superfund Remediation and Technology Innovation, U.S. Environmental Protection Agency: Washington, DC, USA, 2004.
  59. Li, C.; Gao, X.; Wang, Y. Hydrogeochemistry of high-fluoride groundwater at Yuncheng Basin, northern China. Sci. Total Environ. 2015, 508, 155–165. [Google Scholar] [CrossRef]
  60. Alaya, M.; Saidi, S.; Zemni, T.; Zargouni, F. Suitability assessment of deep groundwater for drinking and irrigation use in the Djeffara aquifers (Northern Gabes, south-eastern Tunisia). Environ. Earth Sci. 2014, 71, 3387–3421. [Google Scholar] [CrossRef] [Green Version]
  61. Narsimha, A.; Sudarshan, V. Contamination of fluoride in groundwater and its effect on human health: A case study in hard rock aquifers of Siddipet, Telangana State, India. Appl. Water Sci. 2017, 7, 2501–2512. [Google Scholar] [CrossRef] [Green Version]
  62. Wu, J.; Li, P.; Qian, H. Hydrochemical characterization of drinking groundwater with special reference to fluoride in an arid area of China and the control of aquifer leakage on its concentrations. Environ. Earth Sci. 2015, 73, 8575–8588. [Google Scholar] [CrossRef]
  63. Li, J.; Wang, Y.; Xie, X.; Depaolo, D. Effects of water-sediment interaction and irrigation practices on iodine enrichment in shallow groundwater. J. Hydrol. 2016, 543, 293–304. [Google Scholar] [CrossRef] [Green Version]
  64. Mahmood, Y.; Asghari, F.B.; Zuccarello, P.; Conti, G.O.; Ejlali, A.; Mohammadi, A.A.; Ferrante, M. Spatial Distribution Variation and Probabilistic Risk Assessment of Exposure to Fluoride in Ground Water Supplies: A Case Study in an Endemic Fluorosis Region of Northwest Iran. Int. J. Environ. Res. Public Health 2019, 16, 564. [Google Scholar]
  65. Rao, N.; Sunitha, B.; Sun, L. Mechanisms controlling groundwater chemistry and assessment of potential health risk: A case study from South India. Chemie. Der Erde–Geochem. 2019, 80, 125568. [Google Scholar]
  66. Gao, Z.; Han, C.; Xu, Y.; Zhao, Z.; Luo, Z.; Liu, J. Assessment of the water quality of groundwater in Bohai Rim and the controlling factors—a case study of northern Shandong Peninsula, north China. Environ. Pollut. 2021, 285, 117482. [Google Scholar] [CrossRef] [PubMed]
  67. Narsimha, A.; Rajitha, S. Spatial distribution and seasonal variation in fluoride enrichment in groundwater and its associated human health risk assessment in Telangana State, South India. Hum. Ecol. Risk Assess. Int. J. 2018, 24, 2119–2132. [Google Scholar] [CrossRef]
  68. Guo, H.; Zhang, Z.; Cheng, G.; Li, W.; Li, T.; Jiao, J. Groundwater-derived land subsidence in the North China Plain. Environ Earth Sci. 2015, 74, 1415–1427. [Google Scholar] [CrossRef]
  69. Han, Y.; Zhai, Y.; Guo, M.; Cao, X.; Lu, H. Hydrochemical and Isotopic Characterization of the impact of water diversion on water in drainage channels, groundwater, and Lake Ulansuhai in China. Water 2021, 13, 3033. [Google Scholar] [CrossRef]
  70. Wang, Y.; Chen, Z.; Fei, Y.; Liu, J.; Wei, W. Estimation of water released from aquitard compaction indicated by fluorine in Cangzhou. J. Jilin Univ. 2011, 41, 298–302, (In Chinese with English Abstract). [Google Scholar]
  71. Zhang, R. Study of fluorine increase mechanism in deep groundwater in the Eastern Hebei Plain. Hydrogeol. Engin. Geol. 1991, 18, 56–58, (In Chinese with English Abstract). [Google Scholar]
Figure 1. Location of the study area and the sampling sites ((a) China, (b) the North China Plain, (c) the study area and the sampling sites).
Water 13 03426 g001
Figure 2. Hydrogeological cross-section along A–A’.
Water 13 03426 g002
Figure 3. Piper diagram showing the groundwater hydrochemical types.
Water 13 03426 g003
Figure 4. Proportion of groundwater suitable for irrigation based on different indexes: (a) sodium adsorption ratio (SAR), (b) sodium percentage (%Na), (c) residual sodium carbonate (RSC), (d) magnesium hazard (MH), (e) permotic index (PI) and (f) electrical conductivity (EC).
Water 13 03426 g004aWater 13 03426 g004b
Figure 5. (a) USSL diagram and (b) Wilcox diagram showing the irrigation water quality classification.
Water 13 03426 g005
Figure 6. Classification of groundwater suitability for irrigation based on different indexes of (a) sodium adsorption ratio (SAR), (b) sodium percentage (%Na), (c) residual sodium carbonate (RSC), (d) magnesium hazard (MH), (e) permotic index (PI), and (f) electrical conductivity (EC).
Water 13 03426 g006aWater 13 03426 g006bWater 13 03426 g006c
Figure 7. Spatially distributed groundwater quality index (GQI) values in the study area.
Water 13 03426 g007
Figure 8. Division diagram of deep groundwater suitable for drinking.
Water 13 03426 g008
Table 1. Classification of groundwater suitability for agricultural irrigation.
Index Range ClassificationIndex Range ClassificationIndex Range ClassificationStandard FormulasReferences
SAR (meq/L)<10Excellent SAR = Na + Ca 2 + + Mg 2 + 2 Richards (1954)
10–18Good
18–26Doubtful
>26Unsuitable
%Na (%)<20Excellent % Na = ( Na + + K + ) Ca 2 + + Mg 2 + + Na + + K +   ×   100 % Wilcox (1955)
20–40Good
40–60Permissible
60–80Doubtful
>80Unsuitable
RSC (meq/L)<1.25Good RSC = ( HCO 3 + CO 3 2 ) ( Ca 2 + + Mg 2 + ) Richards (1954)
1.25–2.5Doubtful
>2.5Unsuitable
MH (%)<50Desirable MH = Mg 2 + Ca 2 + + Mg 2 +   ×   100 % Szaboles and Darab (1964)
>50Undesirable
PI (%)<25Unsuitable PI = Na + + HCO 3 Ca 2 + + Mg 2 + + Na +   ×   100 % Doneen (1964)
25–75Moderately suitable
>75Suitable
EC (us/cm)<250ExcellentMeasured by instrumentsWilcon (1955)
250–750Good
750–2250Doubtful
>2250Unsuitable
The concentrations of Na+, K+, Ca2+, Mg2+, HCO3 and CO32− are expressed in meq/L; SAR, %Na, RSC, MH and PI indicate the sodium adsorption ratio, sodium percentage, residual sodium carbonate, magnesium hazard and permeability index, respectively.
Table 2. The WHO (2011) standards for groundwater quality parameters and the weight values.
ParametersWHO Standards (S)Weight (wi)Relative Weight (Wi)
Cl250 (mg/L)30.083
SO42−200 (mg/L)40.112
HCO3150 (mg/L)30.083
pH6.5–9.2 (mg/L)40.112
TDS500 (mg/L)50.139
EC500 (us/cm)50.139
Na+200 (mg/L)20.055
K+10 (mg/L)20.055
Mg2+30 (mg/L)20.055
Ca2+75 (mg/L)20.055
TH100 (mg/L)40.112
Total weight 361
Table 3. Groundwater quality classifications for drinking based on GQI values.
GQI Type of Water
<50 Excellent
50–100Good
100–200Poor
200–300Very poor
>300Water unsuitable for drinking
Table 4. Statistical summary of hydrochemical characteristics of groundwater.
ParameterShallow GroundwaterDeep GroundwaterStandard Values
MinMaxMeanSDCVMinMaxMeanSDCVGBWG
pH7.31 8.50 7.85 0.34 0.04 8.20 9.15 8.60 0.17 0.02 6.5–8.56.5–8.5
EC (µs/cm)3.563717.10 1709.77 730.56 0.43 1.59 1556.0 698.95 269.50 0.39 1500
Total hardness (mg/L)18.73 1482.85 673.82 351.95 0.52 10.12 82.96 24.81 14.67 0.59 450500
Total alkalinity (mg/L)268.76712.1494.2120.830.24185.19418.35286.6751.080.18
CODMn (mg/L)0.66 5.58 1.74 1.09 0.63 0.37 1.66 0.67 0.24 0.36 3
Soluble silica (mg/L)3.60 21.20 13.24 4.69 0.35 9.80 15.90 12.67 1.13 0.09
Carbon dioxide (mg/L)0.00 85.40 38.64 27.52 0.71 0.00 2.20 0.06 0.35 6.08
K+ (mg/L)0.30 31.402.49 6.51 2.61 0.20 29.10 1.22 4.59 3.76 12
Na+ (mg/L)44.80569.70 240.88 134.48 0.56 40.58 314.60 160.48 49.62 0.31 200200
Ca2+ (mg/L)4.70 331.20 122.91 81.78 0.67 2.90 327.10 14.44 51.49 3.57 200
Mg2+ (mg/L)1.70 175.60 89.14 40.69 0.46 0.70 9.60 2.62 2.07 0.79 150
Cl (mg/L)55.30 550.50 220.30 132.42 0.60 13.80 231.10 53.83 48.62 0.90 250250
SO42− (mg/L)16.00 1037.36 344.71 307.02 0.89 0.35 50.07 26.43 12.09 0.46 250250
CO32− (mg/L)0.00 12.00 1.57 3.16 2.01 0.00 31.20 7.59 5.48 0.72
HCO3 (mg/L)315.50 868.30 599.39 147.50 0.25 213.60 491.80 334.09 62.24 0.19 500
F (mg/L)0.35 2.15 1.02 0.50 0.49 0.29 4.21 2.23 1.20 0.54 11.5
I (mg/L)0.00 0.25 0.05 0.08 1.48 0.00 0.36 0.05 0.08 1.52 0.08
NH4+ (mg/L)0.04 0.40 0.12 0.07 0.60 0.00 0.16 0.08 0.05 0.56 0.5
NO3 (mg/L)0.00 126.80 18.16 31.83 1.75 0.00 7.63 0.62 1.67 2.69 2050
NO2 (mg/L)0.00 0.36 0.05 0.08 1.68 0.00 0.10 0.01 0.02 2.64 13
PO43− (mg/L)0.02 0.57 0.08 0.12 1.50 0.02 0.46 0.20 0.10 0.51 30
Fe (mg/L)0.01 0.07 0.02 0.02 0.91 0.01 0.10 0.02 0.02 0.87 0.3
Mn (mg/L)0.00 0.60 0.08 0.14 1.87 0.00 0.04 0.01 0.01 1.39 0.10.4
SD: standard deviation, CV: variation coefficient, GB: class III water limits (suitable for drinking directly) stipulated by the Standard for Groundwater Quality of China (GB/T 14848-2017), WG: WHO guideline (2017).
Table 5. Personal health risk values of typical pollutants in the deep groundwater.
StatisticsFI
HQcHQdHQHQcHQdHQ
Children
Min0.220.000370.220.0000310.0180.018
Max3.10.00543.10.00563.33.3
Mean1.70.00291.70.000840.490.49
Male
Min0.150.000280.150.0000230.0130.013
Max2.20.0042.20.00422.32.3
Mean1.20.00211.20.000620.350.35
Female
Min0.170.000280.170.0000230.0140.014
Max2.40.00412.40.00422.52.5
Mean1.30.00221.30.000630.370.37
HQc and HQd are non-carcinogens hazard quotient through ingestion of water and dermal absorption of water, respectively. HQ is the total hazard quotient including exposure routes of drinking water and dermal absorption of water. HQ = HQc + HQd.
Publisher’s Note: MDPI stays neutral with regard to jurisdictional claims in published maps and institutional affiliations.

