Article

Energy Exchange and Evapotranspiration over the Ejina Oasis Riparian Forest Ecosystem with Different Land-Cover Types

1
Key Laboratory of Remote Sensing of Gansu Province, Heihe Remote Sensing Experimental Research Station, Northwest Institute of Eco-Environment and Resources, Chinese Academy of Sciences, Lanzhou 730000, China
2
Key Laboratory of Land Surface Process and Climate Change in Cold and Arid Regions, Chinese Academy of Sciences, Lanzhou 730000, China
*
Author to whom correspondence should be addressed.
Water 2021, 13(23), 3424; https://doi.org/10.3390/w13233424
Submission received: 13 October 2021 / Revised: 26 November 2021 / Accepted: 1 December 2021 / Published: 3 December 2021
(This article belongs to the Special Issue Evapotranspiration Measurements and Modeling)

Abstract

:
Investigating the energy and water vapor exchange in oasis riparian forest ecosystems is of significant importance to improve scientific understanding of land surface processes in extreme arid regions. The Heihe Watershed Allied Telemetry Experimental Research (HiWATER) provided many observations of water vapor and heat fluxes from riparian forest ecosystem by using a network of eddy-covariance (EC) systems installed over representative surfaces in the Ejina Oasis, which is located in the downstream areas of the Heihe River Basin, northwestern China. Based on EC flux measurements and meteorological data performed at five stations and covering representative surface types of Populus euphratica tree with associated Tamarix chinensis shrub, Tamarix chinensis shrubland, cantaloupe cropland, and barren-land, this study explored the spatio-temporal patterns of heat and water vapor fluxes over the Ejina Oasis riparian forest ecosystem with five different surface types over the course of a growing season in 2014. Energy balance closure of the flux data was evaluated; footprint analysis for each EC site was also performed. Results showed that energy balance closure for the flux data was reasonably good, with average energy balance ratio (EBR) of 1.03. The seasonal variations in net radiation (Rn), latent (LE), and sensible heat flux (H) over the five contrasting surfaces were similar, and a reverse seasonal change was observed in energy partitioning into LE and H. Remarkable differences in Rn, LE, and H between the five surfaces were explored preliminarily, associated closely with the soil properties and foliage phenology. Over the growing season (May–October) in 2014, the total ET ranged 622–731 mm for mixed forest of P. euphratica trees with associated T. chinensis shrubs with average daily ET of 3.6–4.2 mm; ET from T. chinensis shrubland was about 541 mm, with average daily ET of 3.6 mm. ET for barren-land was 195 mm. The total ET in irrigated cantaloupe cropland with plastic mulch was 431 mm for its four-month growing period with a total average of 3.8 mm d−1. Determination of ET over riparian forest ecosystem helps to improve reasonable use of limited water resource in the Ejina Oasis.

1. Introduction

Many important processes of terrestrial ecosystems, such as photosynthesis and evapotranspiration, are associated with the energy and mass exchange between the land surface and atmosphere [1,2,3,4]. Understanding the exchange processes of water vapor and energy between the terrestrial ecosystem and atmosphere is important in modeling ecosystem production, water balance of terrestrial ecosystems, and atmospheric circulation [4,5]. The terrestrial ecosystem latent and sensible heat fluxes strongly interact with the overlaying atmosphere and consequently affect the characteristics of the planetary boundary layer [6], ultimately influencing the local and even regional climate [1,3,7,8]. In return, the water vapor and energy fluxes can be altered by local environmental variables that affecting a variety of physical and physiological processes in plants [3,4,5,7]. The latent and sensible heat fluxes are two crucial variables in meteorological, hydrological, and ecological analyses [9]. Among them, land evapotranspiration (ET)/latent heat flux (in form of energy) is an essential component of the energy and water budgets in terrestrial ecosystems. ET includes transpiration (T) from the plant and evaporation (E) from soil, inland water, and canopy interception [10]. Accurate quantification of ET is of great importance to water resources management, particularly in areas of water scarcity [11,12].
Currently, the commonly used methods for obtaining ET are ground-based observation and model estimation/simulation. The ET estimation models available in the literature may be broadly classified as (1) fully physically based combination models that account for mass and energy conservation principles; (2) semi-physically based models that deal with either mass or energy conservation; and (3) black-box models based on artificial neural networks, empirical relationships, and fuzzy and genetic algorithms [13,14,15,16,17]. Among these models, remote-sensing-based ET models have been widely used for estimating land ET at field to regional scales and even at the global scale [14,16,17,18]. However, given several uncertainties in model mechanism, model inputs, parameterization schemes, and scaling issues [19], the accuracy of ET derived from remote-sensing satellite data varies over space and time [14,18,20]. Therefore, the performance of remote-sensing ET models must be evaluated and improved using ground-based measurements to provide accurate ET products for wide applications.
The eddy-covariance (EC) method provides a direct measure of carbon dioxide, water vapor, and heat fluxes between the terrestrial ecosystem and atmosphere [21,22,23,24,25]. At present, the EC method is being commonly deployed at a global-scale network of flux measurements, FLUXNET [22,25]. The EC method has the potential of quantifying how whole ecosystems respond to a spectrum of climate regimes [22]. Furthermore, comprehensive flux data from a regional network of EC sites installed over a variety of different land-cover types can be used to improve model algorithms effectively and well validate remote-sensing ET products, which is produced by bio-geochemical models and relevant remote-sensing ET models [23,26].
In recent decades, many studies on water vapor and energy exchange using the EC method have been performed at different time scales in the boreal, temperate, and tropical forests [3,4,7,25,27,28], grasslands [5,27,29,30,31], steppe [1,9,32], savanna [4], agricultural ecosystems [2,5,9,27,33,34], deserts [35,36,37], and tundra [27] across a spectrum of climate and geographical regions of the Earth. These studies have made great progress in investigating the environmental mechanisms controlling energy budgets and water cycles, quantifying spatial-temporal patterns of energy and water exchanges over diverse terrestrial ecosystems on seasonal and annual time scales. However, less attention has been given to the groundwater-dependent ecosystems, such as groundwater-dependent riparian forest ecosystem [38,39] in extreme arid regions where mean annual precipitation is often less than 60–100 mm [40].
The riparian forest ecosystem, dominated by Populus euphratica and Tamarix chinensis species, mainly distributes along the riverside of the inland river downstream areas, such as the first and second largest inland river basin in northwestern China, the Tarim River Basin (TRB) and Heihe River Basin (HRB) [41,42]. Riparian forest not only has significant biological functions to the biodiversity conservation, but also has important significance in safeguarding the ecological security of the northern China, particularly for the Ejina Oasis in the downstream area of HRB [43,44,45]. The landscape of HRB changes from glacier and alpine biomes in the upper reaches, through steppes and agricultural ecosystems in the middle reaches, to riparian ecosystems surrounded by vast areas of desert in the lower reaches [42,46]. As the water consumption in the up- and midstream areas of HRB increased dramatically, the amount of surface water entering the downstream oasis areas decreased sharply from the 1950s to 2000 [45]. Since the 1990s, the Ejina Oasis has experienced severe ecosystem deterioration, such as the drying-up of two terminal lakes and the large area death of Populus euphratica forests [44,45]. In 2000, an Ecological Water Diversion Project (EWDP) was implemented in the HRB to restore the deteriorated ecosystems in the Ejina Oasis. Since the reallocation of surface water, the dried-up terminal lake (Sogo Nuur) has been recharged with water since 2002 [47]. Consequently, the spatiotemporal distribution of water resources in the Ejina Oasis has changed dramatically, and the riparian forest ecosystem has been restored to some degree [48,49,50,51]. Furthermore, the area of cropland has also been expanded extensively, resulting in the overextraction of groundwater and inappropriate use of surface water for agriculture [46,51]. Quantification of ET over the Ejina Oasis ecosystem with different land-cover types is thus crucial to reasonable allocation of the limited water resources for ecosystem rehabilitation [45].
To date, several pioneering works on surface energy and water exchange of riparian forest ecosystem under extreme arid regions have been conducted [52,53,54,55,56,57,58,59]. Yuan et al. [54] found the seasonal processes of energy and water exchanges over a riparian Tamarix stand with the vegetation cover of 0.65 and leaf area index (LAI) of 1.15 in the lower TRB were highly related with plant phenology, and ET depend on the groundwater, rather than the precipitation. Yuan et al. [55] compared the ET and its controlling mechanism over the Tamarix shrubland and a Populus euphratica forest (with vegetation cover of 0.49 and LAI of 0.57) in the lower TRB, and found temporal patterns of ET over the two species were similar, but the water consumption of Populus euphratica was much higher. In the lower HRB, Si et al. [52] measured the ET over Tamarix stand (with LAI of 3.2) by using the Bowen ratio method, and the mean daily ET was 1.62 mm over a 153-day growing season. Hou et al. [53] estimated the ET over a Populus euphratica forest with the canopy density of 0.8 using the Bowen ratio method; the maximum daily ET reached to 6.7 mm, and the variation pattern of crop coefficient (Kc) was similar to that of ET during the growing season. Yu et al. [56,57] measured the riparian forest ET of Tamarix (with vegetation cover of 0.52 and LAI of 1.97) and the Populus euphratica (with vegetation cover of 0.47 and LAI of 2.15) using the EC method, and found that the measured daily ET (with a mean of 2.8 mm) over Tamarix shrubland was comparable to the results from the TRB; while the Populus euphratica daily ET was 4.0 mm on average, its seasonal pattern was associated with the LAI. Additionally, the water use between the two contrasting riparian forest in the lower HRB was comparable without consideration of soil evaporation [58]. Moreover, the differences in ET between two different aged Populus euphratica forests (with vegetation cover of 0.52 and 0.3, LAI of 2.27 and 1.78) were mainly related to flood irrigation by surface water from Heihe River [59]. The above-mentioned results demonstrated that groundwater influences the processes of ET by controlling the growth and spatial distribution of riparian forests. Nevertheless, these studies just focused on Populus euphratica forests and Tamarix chinensis shrublands. Therefore, new and long-term energy and water exchange studies on riparian forest ecosystem with various land covers, including cropland, are needed to improve the understanding of the eco-hydrological processes and biophysical functioning of these groundwater-dependent ecosystems. Such studies will bridge considerable knowledge gaps in understanding surface energy exchange and evapotranspiration over these contrasting landscapes in extreme arid regions.
The main objective of this study was to further explore and better understand the temporal and spatial patterns of water vapor and energy exchanges over the Ejina Oasis riparian forest ecosystem with a variety of surface types, including riparian forests of Populus euphratica with associated Tamarix chinensis, Tamarix chinensis shrubland, cropland, and barren-land. Based on surface water vapor and energy flux observations performed at five EC sites and covering all representative surface types, continuous measurements of meteorological factors and soil moisture, and groundwater depth observations made at the riparian forest ecosystem in the Populus euphratica forest reserve of Ejina Oasis in 2014, the present study (1) evaluated the surface energy balance closure and spatial representativeness of the multi-site EC flux measurements to ensure a high-quality flux data; (2) characterized and compared the temporal and spatial variation in energy flux partitioning and evapotranspiration in the riparian forest ecosystem with five contrasting surface types over the course of a growing season to explore the exchange patterns of surface energy and water vapor; and (3) identified the main factors controlling evapotranspiration and energy flux over these five contrasting landscapes to further understand the land surface processes of the riparian forest ecosystem in the Ejina Oasis.

2. Materials and Methods

2.1. Study Area and Site Description

The study area is located in the Ejina Oasis (Figure 1a), which is in the downstream areas of the HRB (97°09′36″–102°58′48″ E, 37°52′12″–43°39′00″ N). This oasis is one of the most arid regions in China according to local meteorological data from 1990 to 2010, with mean annual precipitation of less than 50 mm and annual potential evaporation of approximately 3755 mm [42]. Mean annual air temperature is around 9.7 °C [46]. Natural vegetation in this oasis is dominated by the species of Populus euphratica (P. euphratica) with associated Tamarix chinensis (T. chinensis) and other desert species. The P. euphratica trees reach 4–20 m in height, and the T. chinensis shrubs have a height in the range of 1–5 m [60]. In this oasis, the P. euphratica tree’s leaf area reaches a maximum value from July through August, then its leaves go through senescence and subsequent fall stage by late October [61]. For the T. chinensis shrub, the leaves sprout at the end of April and start to go into senescent stage in mid-September. The agricultural crop is dominated by the cantaloupe (a type of muskmelon). In 2017, the total production area of cantaloupe in the Ejina Oasis was more than 4000 hectares, with an annual yield of more than 110,000 tons. The cantaloupe grows rapidly by early July, reaches its maximum height of approximately 0.4 m within one month, and is harvested at late September. The plastic mulch is usually used by farmers on crop field to conserve soil moisture and reduce soil evaporation. The crop field is irrigated regularly with local groundwater. Throughout the crop growing period in 2014, there are usually four rounds of irrigation (around 11 June, 17 July, 2 August, and 18 August) [62].
During the Heihe Watershed Allied Telemetry Experimental Research (HiWATER [42]), the region from Erdaoqiao (Bridge-2) to Qidaoqiao (Bridge-7) in the oasis (known as ‘the core area of the P. euphratica forest reserve’) was selected as the HRB downstream investigation area (Figure 1b). A key area in this reserve (centered at 101°08′00″ E, 42°00′00″ N) has been selected for intensive and long-term observations since July 2013 (Figure 1b). The intensive observation area located in the Sidaoqiao (Bridge-4), approximately 3 × 3 km2, has land cover that is 38% T. chinensis, 13% P. euphratica, and 39% barren-land, as well as 7% cropland and 3% grass (Figure 1c). In this intensive observation area, two paths of large aperture scintillometer (LAS) systems (named LAS_E and LAS_W; BLS900, Scintec, Germany) were installed parallelly to measure the path-averaged sensible heat fluxes across the intensive observation area. Each path of a LAS system consists of a pair of transmitter and receiver, as shown in Figure 1c. These two LAS systems measure over a sparse riparian forest with same measurement height of 25.5 m and path lengths of 2390 and 2380 m, respectively. Along the two LAS transects, five observation sites were deployed over the dominant surface types within this area. Spatial distribution of each site is shown in Figure 1c, with CL of T. chinensis shrubland, MF of P. euphratica and associated T. chinensis, PF of sparse P. euphratica with associated T. chinensis, CL of cantaloupe field, and BL of barren-land (Table 1).
Each observation site was equipped with an eddy-covariance (EC) system and an automatic weather station (AWS) to observe the sensible and latent heat fluxes, carbon dioxide fluxes, and meteorological elements. Details of the EC system equipment at the five observation sites are given in Table 1. Measurements made at each AWS tower included a four-component net radiation (downward/upward shortwave and longwave radiation), wind speed and direction, air temperature and relative humidity, air pressure, precipitation, soil temperature and moisture depth profile, and soil heat flux. Further details on the meteorological instruments equipped at each AWS are listed in Table 2. The shrubland station (SL) was equipped with wind speed/air temperature/relative humidity measurements at heights of 5, 7, 10, 15, 20, and 28 m, and soil temperature and moisture measurements at 0.02, 0.04, 0.1, 0.2, 0.4, 0.8, 1.2, and 1.6 m depths. During the experimental period from 20 to 31 July 2014, soil samples were also taken at these depths in the vicinity of each tower for the measurements of soil moisture. The LAI of T. chinensis shrubs and cantaloupe was measured using a LAI-2200 canopy analyzer (LI-COR; Lincoln, NE, USA) [63]. The mean LAI values of T. chinensis at SL and cantaloupe at CL were 3.47 and 3.07, respectively. At each observation station, soil heat flux was measured with three heat flux plates installed 0.06 m below the surface. In addition, three groups of thermal dissipation sap flow probes (TDPs) were installed to measure the canopy transpiration of P. euphratica tree (Figure 1c). Nine representative trees with diameters ranging from 33.8 to 51 cm at breast height were selected in the vicinity of the observation sites. To monitor the spatial and temporal variations in shallow groundwater depth, five groundwater wells have been dug with a depth of 6 m and, respectively, equipped with a HOBO Water Level Logger (U20-001-04; Onset, Bourne, MA, USA) since June 2014 [62], as shown by the numbers from 1 to 5 in Figure 1c.

2.2. Data Processing

Ten-minute AWS observations were averaged to half-hour periods. AWS data were removed during times of known instrument malfunction and if values exceeded physically reasonable ranges. Soil heat flux measurements at the depth of 0.06 m were corrected to surface values using the methods proposed by Liebethal et al. [64] and Xu et al. [65].
EC raw data sampled at 10 Hz were processed carefully using the free EddyPro software (Version 7.0; Lincoln, NE, USA). Data processing procedures included spike removal, time lag correction, coordinate rotation (2D rotation), sonic virtual temperature correction, frequency response correction, and corrections for density fluctuation [66,67,68]. Data quality assessment for every 30 min turbulent fluxes was performed according to the flagging scheme with three different quality control levels (0, 1, and 2) [69]. The 30 min flux data with flag 0 and 1 were selected for the latter analysis; those with flag 2 representing low-quality data were discarded. The flux data within 1 h of precipitation were also rejected. The nonlinear regression method (establishing a regression between the net radiation and latent or sensible heat flux) was used to gap-fill the missing 30 min latent- and sensible heat fluxes. When calculating the accumulative ET, the half-hourly latent heat fluxes were converted to ET by dividing by the coefficient of latent heat vaporization ( λ ), which is calculated with air temperature. The daily total ET was obtained by summing the 30 min ET observations of each day.

2.3. Data Analysis

Considering the time period for instrument recalibration and crop filed management in this oasis, all observations including the half-hourly EC flux measurements and simultaneous meteorological data taken during the growing season from mid-May to October 2014 were selected for the detailed analysis.

2.3.1. Footprint Analysis of EC Flux Measurements

Footprint models have been regarded as diagnostic tools to quantify the representativeness of flux tower measurements [70,71]. In this study, the Kljun’s parametrization Flux Footprint Prediction (FFP) [72], a sophisticated backward Lagrangian footprint model, was applied to calculate the flux footprint of EC measurements. For the calculation of the EC flux footprints with FFP model, the values of the input parameters were directly obtained from the corresponding EC measurements, which include measurement height, wind direction, wind speed, friction velocity, Obukhov length, and standard deviation of lateral velocity fluctuations. Other required parameters, such as the roughness height and zero-plane displacement, were obtained using the method referred to Chehbouni et al. [73]. Here, 70% of the total flux contribution source area was set to limit the extent of footprints [74]. The normalized flux footprints of each EC site were separately superimposed on a 0.61 m spatial resolution land-cover classification map to determine the relative contribution of all land-cover classes in the footprint to the total flux measured by EC.

2.3.2. Energy Balance Closure Assessment

The energy balance equation expresses the partitioning of net energy into energy and mass fluxes between the land surface and the atmosphere. The surface energy balance equation can be written as follows (all units in W m−2):
R n G 0 Δ S = H + L E
where Rn is the net radiation, G0 is the soil surface heat flux, H is the sensible heat flux, LE is the latent heat flux, and ΔS is the heat storage term, including soil and canopy heat storage, the energy storage by photosynthesis, and respiration.
Net radiation is the sum of net short radiation and net longwave radiation [75]:
R n = K K + L L
where K and K are the downward and upward shortwave radiation at the surface, respectively, L and L are the downward and upward longwave radiation, respectively. Downward longwave radiation originates from the atmosphere, both from the clear sky and from clouds; upward longwave radiation is mainly emitted by Earth’s surface.
The energy balance closure for the EC flux measurements (H and LE) were evaluated by the energy balance ratio (EBR). The Rn and G0 were measured by using the four-component net radiometer and heat flux plates at each site. As reported in the literature, the heat storage terms ΔS represent about 2–3% of the net radiation, particularly in the environments with lower canopy and leaf density [65,76]. In this study, the ΔS in Equation (1) was neglected in the EBR [76,77]. The EBR was obtained according to the ordinary least squares (OLS) method, which is the linear regression between the sum of the 30 min turbulent energy fluxes (H and LE) and the available energy (Rn minus G0). The linear regression coefficients (slope and intercept) for energy balance closure can be derived from the ordinary least squares (OLS) method. Ideal energy budget closure is when the intercept is zero, and the regression slope and coefficient of determination (R2) are equal to one [65,77]. In this study, the linear regression is used to assess the EBR and is performed by forcing the slope through zero with an intercept of 0, following the work of [78].

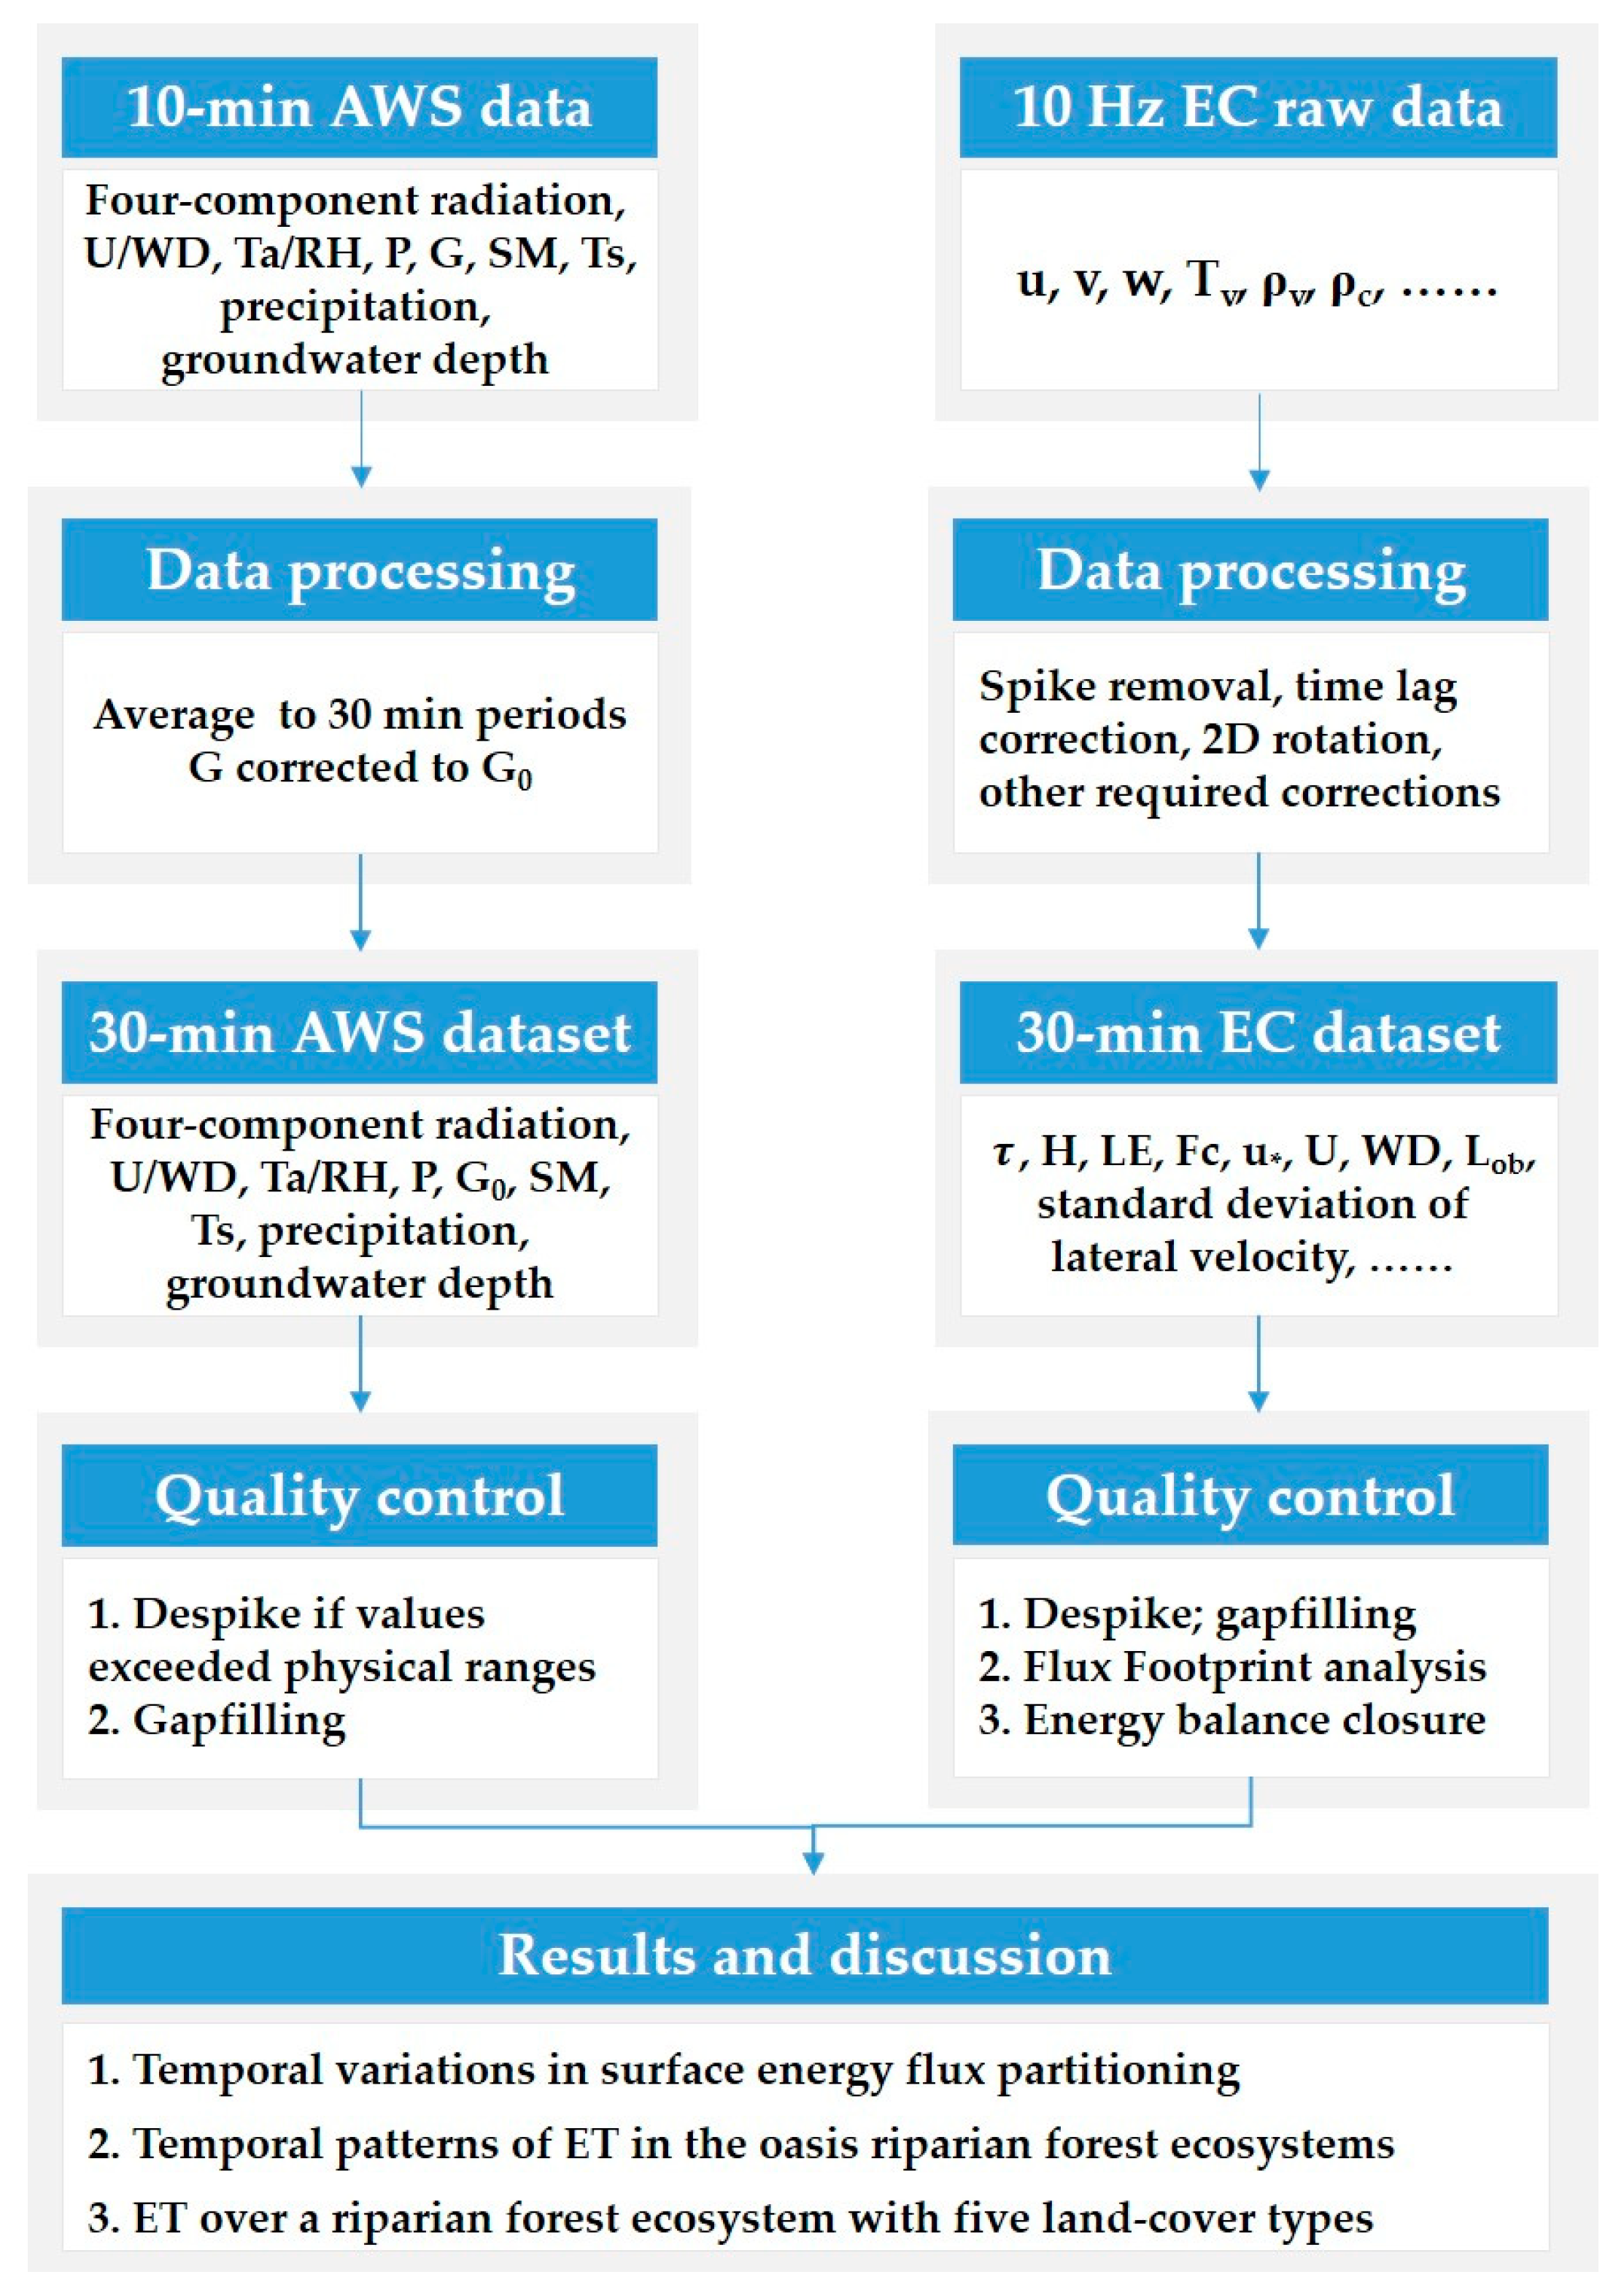
2.4. Flowchart of This Study

Figure 2 presents the flowchart of this study. Careful data processing and quality control for the AWS and EC raw data were performed to ensure high-quality meteorological measurements and turbulent fluxes. Based on continuous measurements of meteorological factors, water vapor and energy flux, and groundwater depth, this study focused on investigating the temporal patterns of energy fluxes exchanges and evapotranspiration over the Ejina Oasis riparian forest ecosystem with five contrasting surface types.

3. Results and Discussion

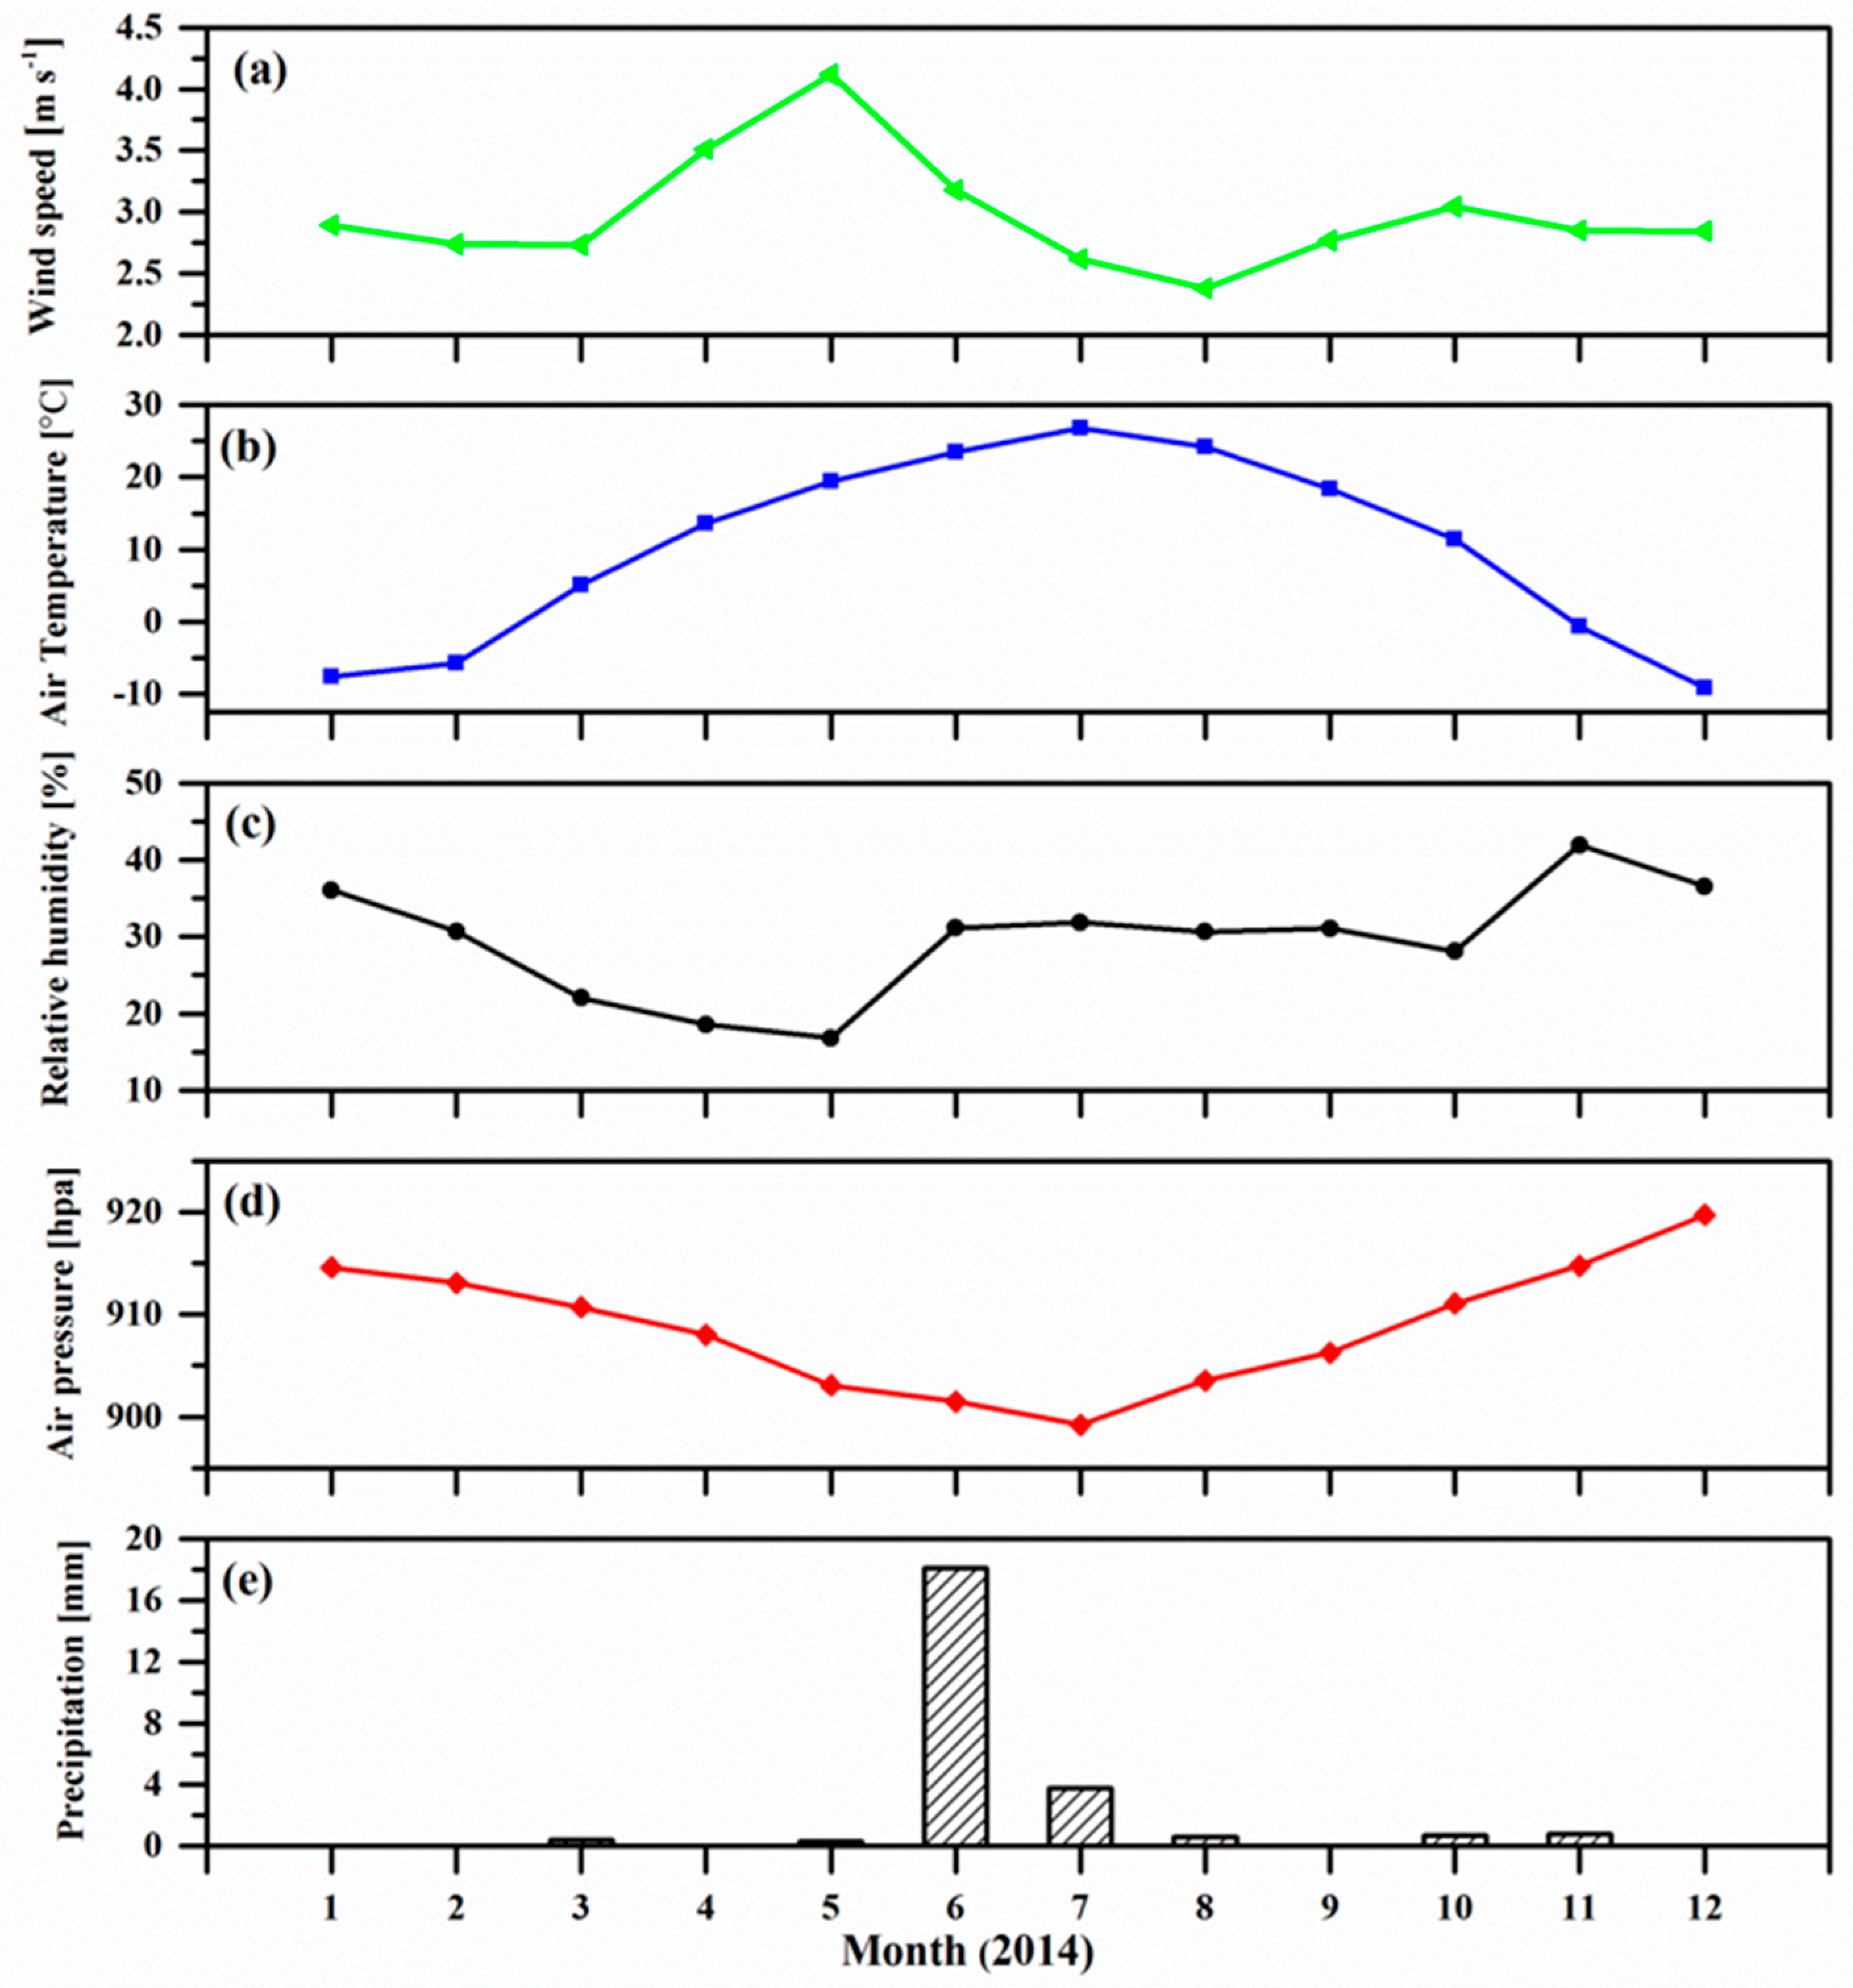
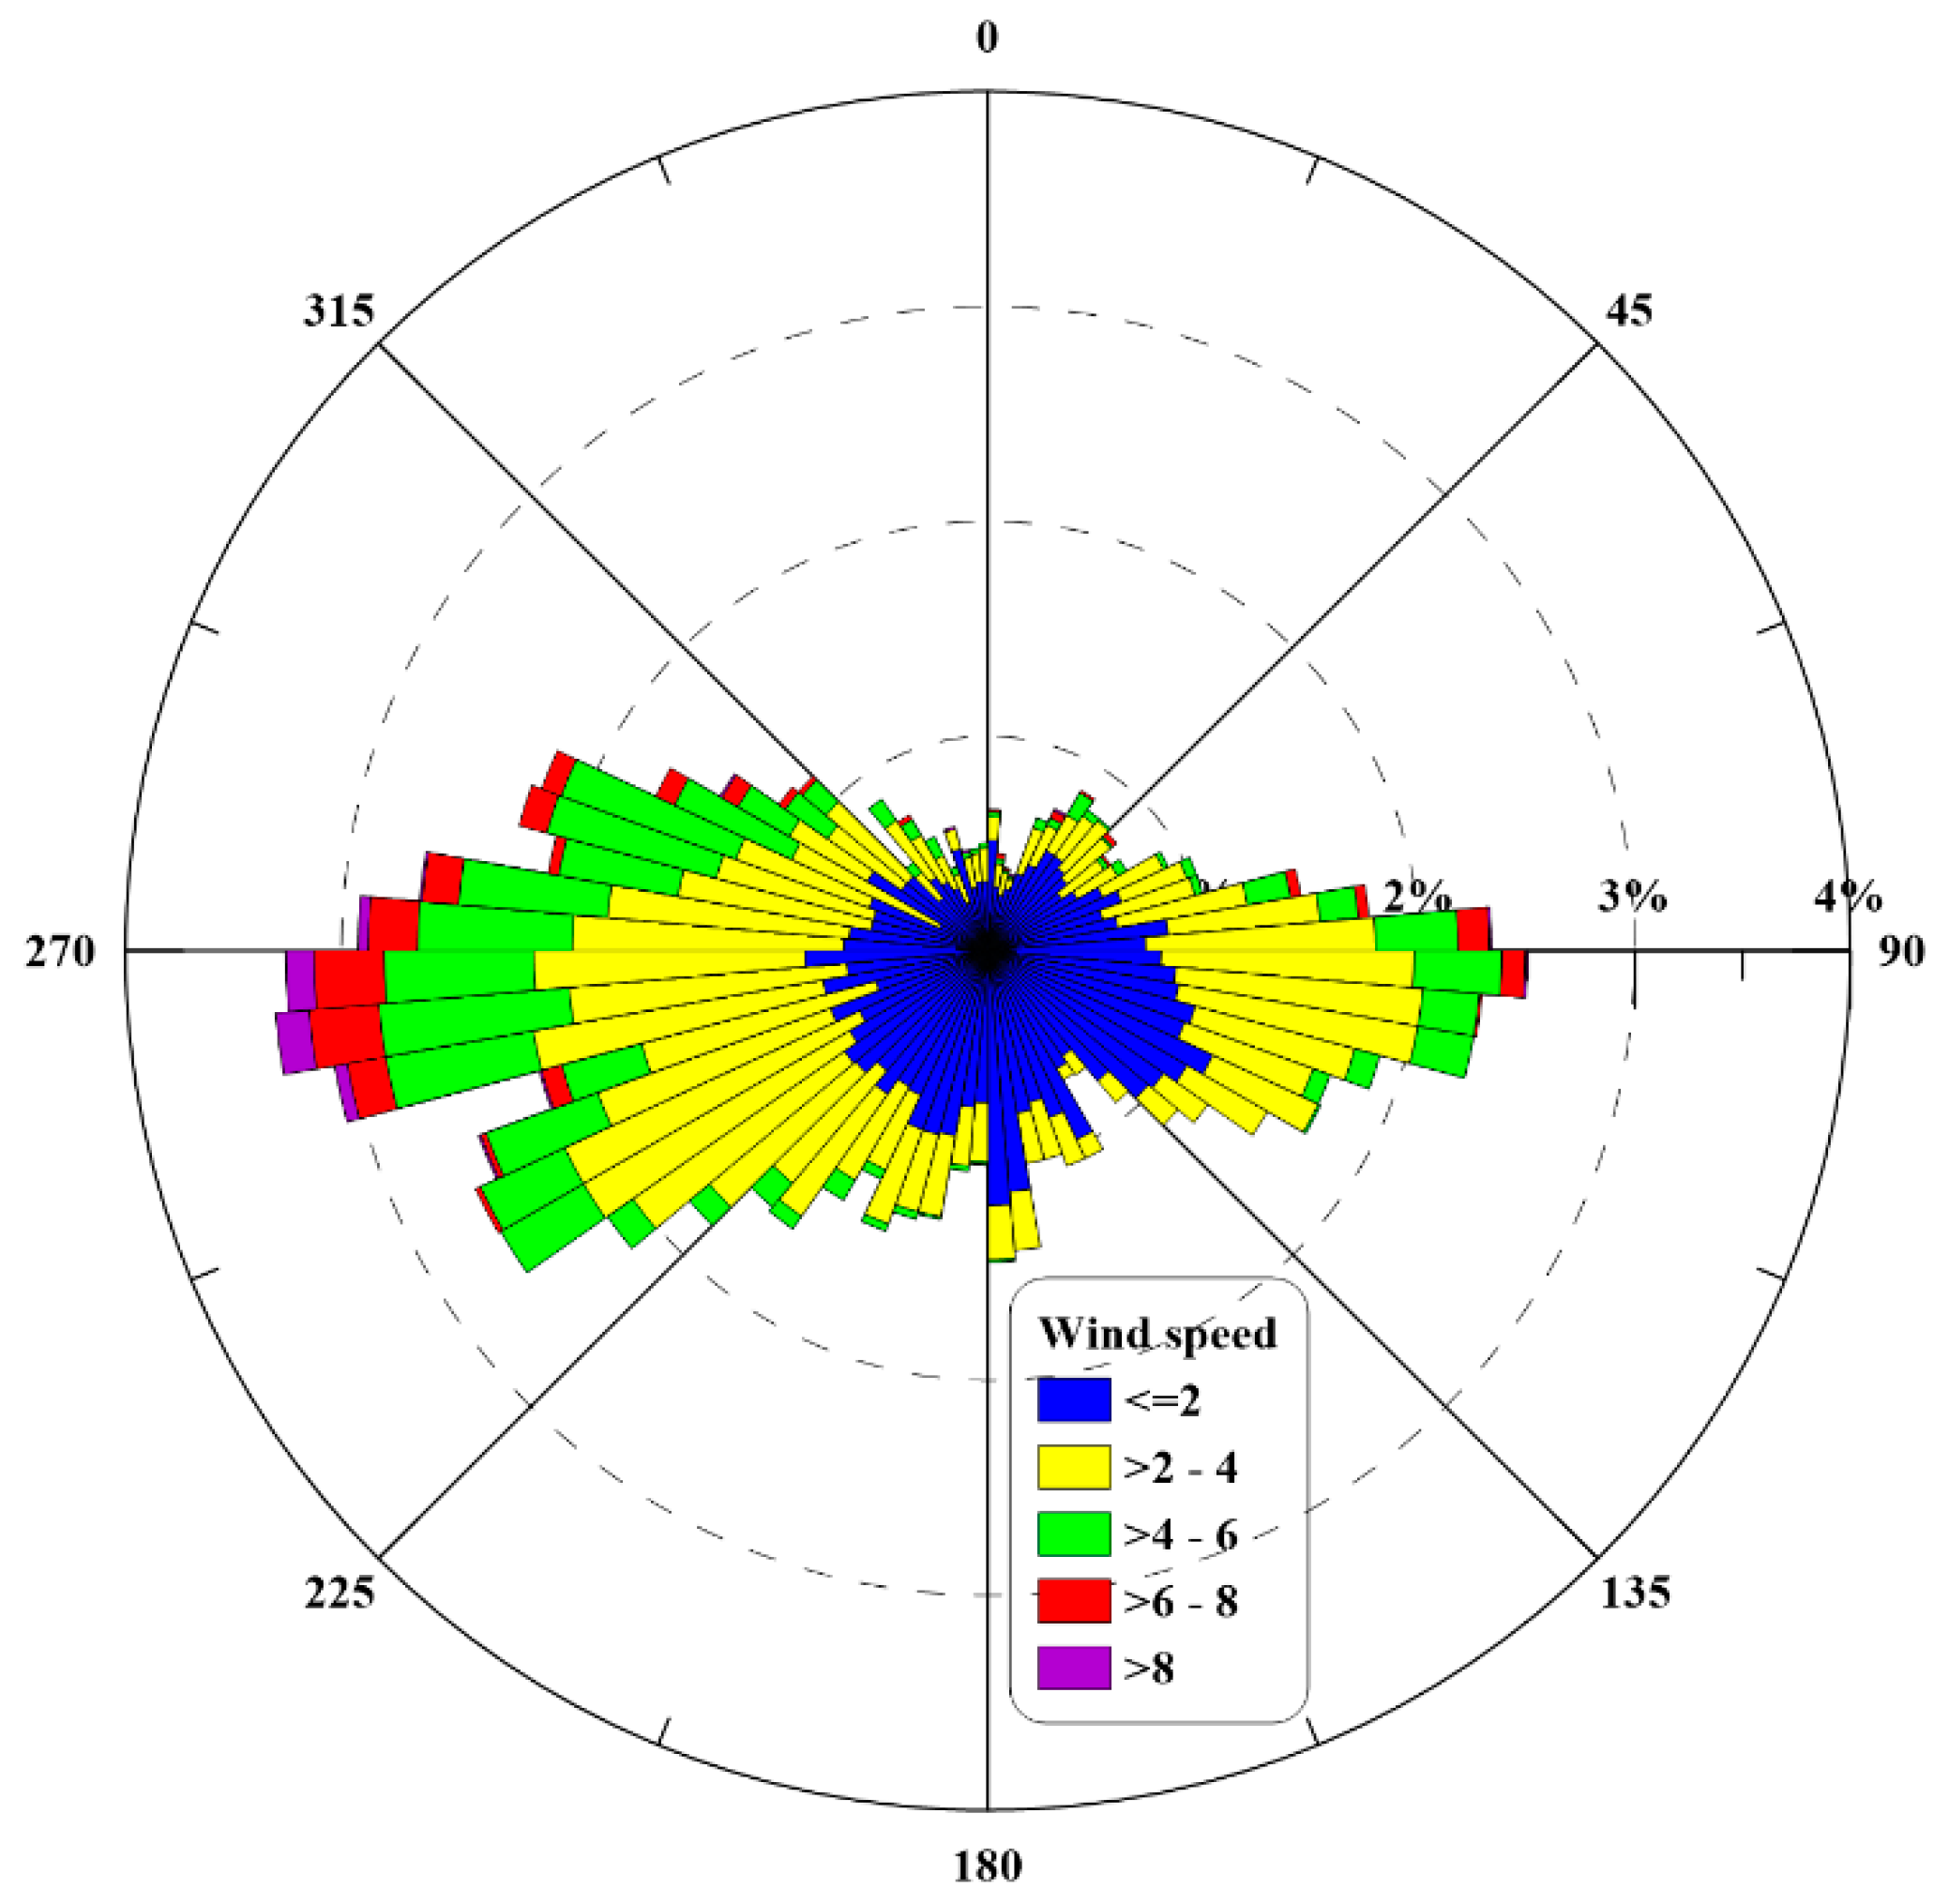
3.1. Meteorological Conditions

The seasonal variations in the wind speed, air temperature, relative humidity, and pressure as well as cumulative precipitation in 2014 is shown in Figure 3. The maximum wind speed occurred in May, with a monthly average of 4.1 m s−1. Wind speed decreased gradually with the increase in vegetation coverage in this area and reached a minimum average of 2.4 m s−1 in August (Figure 3a). The annual average wind speed was 3 m s−1 in 2014. Air temperature increased from winter to summer, with the highest values (23–27 °C) during June–August, and the annual average was about 10 °C (Figure 3b); whereas the air pressure exhibited a distinctly opposite variation, with a lowest value of 899 hpa in July (Figure 3d). In Figure 3c, the relative humidity of air throughout the whole year was almost less than 40%. The total precipitation was 25 mm in this area. Scarce precipitation had less impact on the increase in air humidity during June–August. All in all, the study area experienced a hot and dry summer in 2014. As shown in Figure 4, there are two prevailing wind directions at this area, namely northwesterly and southeasterly winds. The maximum frequencies of northwesterly and southeasterly winds were about 3% and 2.5%, respectively. Both wind speeds and frequencies of northwesterly winds were a little larger those of southeasterly winds. For northwesterly winds, its wind speed can reach a maximum value larger than 8 m s−1.

3.2. Representativeness of EC Flux Matrix Measurements

The spatial representativeness of the five EC sites in the intensive observation area were performed by overlaying the flux footprint with a land-cover classification map. Table 3 lists the relative contribution of all land-cover classes present in the daytime-averaged footprint (70% flux contribution source area). For Cropland station (CL) and Barren-land station (BL), the surface types dominated in their footprint areas were cantaloupe cropland and barren-land, respectively. For Shrubland station (SL), the T. chinensis occupied large proportion of its source area; while for Mixed forest station (MF) and Populus forest station (PF), the dominant vegetation types present in their source areas were P. euphratica and T. chinensis. The barren-land also contributed greatly to the total flux, particularly for PF, indicating that major part of the surface within its footprint area was even free of vegetation.
For the three natural vegetation covered stations (SL, MF, and PF), the relative weight of natural vegetation within their flux footprint areas varied slightly as the prevailing wind direction changed. When winds were southeasterly, at SL, the relative contribution of T. chinensis shrubland to the total flux was about 0.92. For MF and PF, the total weights of P. euphratica and T. chinensis in their footprint areas were 0.74 and 0.53, respectively. However, their total contributions to the measured flux altered to 0.81 and 0.47, respectively, when wind directions became northwesterly; and the flux contribution of T. chinensis decreased to 0.62 for SL. The results indicated that, in general, the EC flux matrix measurements in the intensive observation area of HiWATER were representative of the dominant surface types within the oasis riparian forest ecosystem.

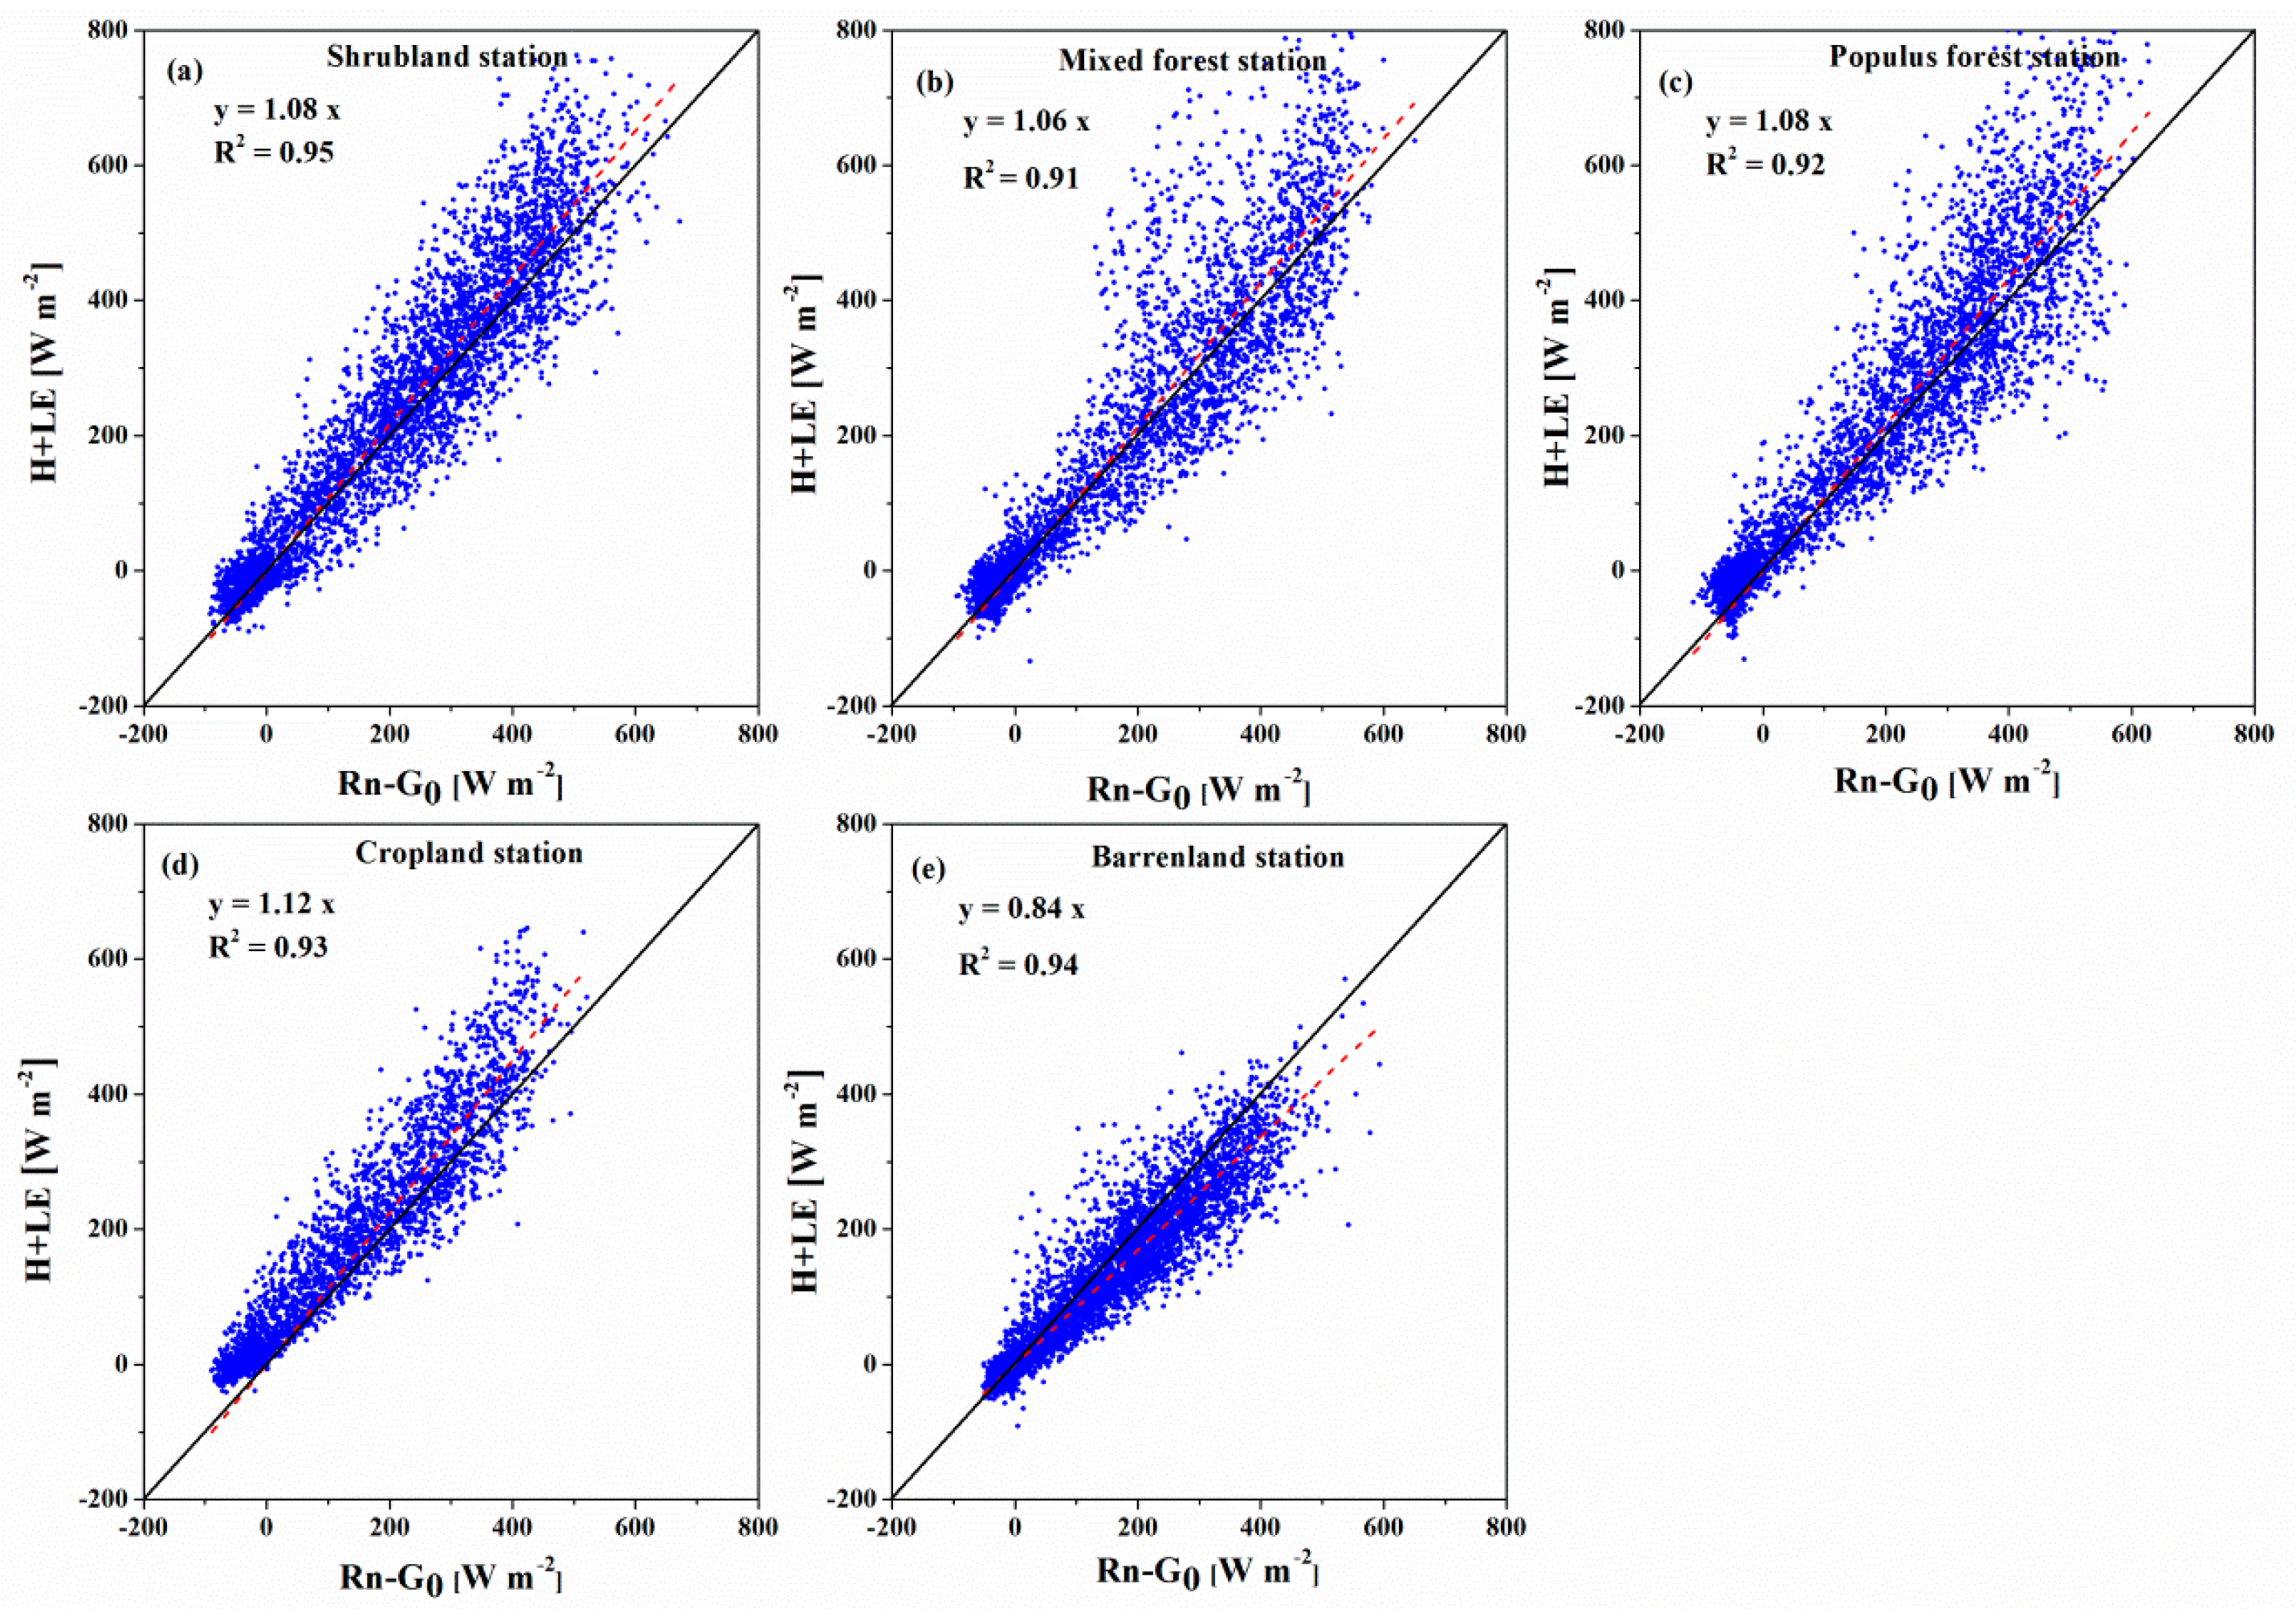
3.3. Energy Balance Closure of the EC Flux Measurements

Figure 5 presents a scatter plot of the half-hourly available energy (Rn-G0) and the sum of the turbulent heat fluxes (H + LE) at five EC sits during the period from mid-May to October in 2014. For the five EC sites in the intensive observation area, the average EBR during the five and half months was 1.03. The Barren-land station has the lowest EBR (0.84) (Figure 5e). The EBR for other four vegetation covered sites is a little larger than 1. As shown in Figure 5, both the Shrubland station and the Populus forest station showed an EBR of 1.08; while the EBR values in the Mixed forest station and the Cropland station were 1.06 and 1.12, respectively.
An energy deficit of 10% was still observed in EBEX-2000 even after considering all the possible influences [79]. The energy imbalance may be attributed to the mesoscale or secondary circulations induced by spatial heterogeneity [80,81,82,83]. The EC systems and radiometers used in the data analysis were inter-compared over an even and open Gobi Desert before the HiWATER intensive observation experiment was conducted [67]. Additionally, careful maintenances were performed for all instruments during the intensive observation period. Agam et al. [84] found spatial variation in the soil heat flux is remarkable under sparse/clumped vegetation covered sites, and inadequate spatial sampling of soil heat flux measurements in the observation sites may lead to the surface energy imbalance. Furthermore, an EBR larger than 1 may be attributed to the impact of wave phase difference in each surface energy balance component [85].
The average EBR in this study was similar to, or a little higher than, the results of previous studies in diverse ecosystems. For instance, the EBR was 0.86 for a barren surface in LITFASS-98 [86]; 0.7–0.8 for a cropland surface in LITFASS-2003 [87]; 0.39–1.69 (mean EBR of 0.84) for several surfaces in the FLUXNET [88]; 0.58–1.00 for several surfaces in the ChinaFLUX [89]; 0.92 for an annual grassland and 0.87 for the oak-grass savanna in a semi-arid region of California, USA [4]; 0.76–0.91 for the forest and cropland surfaces in the Haihe River Basin, China [90]; 0.79–0.87 for the grassland, forest, and cropland in the Heihe River Basin, China [68]; 0.71–1.00 (averaged 0.88) for a variety of surfaces in HiWAETR-2012 [65]; 0.76–1.09 (annual average of 0.93) for a semi-arid savanna in South Africa [77]; 0.70–0.84 at a variety of ecosystems in Central Europe [78]; and 0.87–1.00 (annual value of 0.75) for a seasonally dry tropical forest in a semi-arid land of Brazil [76].
The ERB for the five selected EC sites was reasonably good as compared to the former results obtained from other ecosystems in semi-arid and arid regions, indicating the measurement systems provide reliable estimates of surface energy balance components. Thus, the energy imbalance in the EC flux measurements used in this study was not corrected by using any energy-balance correction methods [91].

3.4. Temporal Variations in Energy Flux Partitioning over a Riparian Forest Ecosystem

To investigate the variation in net radiation (Rn), sensible (H), and latent (LE) heat fluxes during the growing season, half-hourly measurements of Rn, H, and LE taken at five sites (SL, MF, PF, CL, and BL) over the period through May to October in 2014 were selected. Figure 6 gives the variations in daily averages of Rn, H, and LE over five typical surfaces (riparian forests of P. euphratica with associated T. chinensis, T. chinensis shrubland, cropland, and barren-land) in the Ejina Oasis. The ratios of monthly H and LE to Rn over these five surfaces are summarized in Table 4.
In Figure 6, the net radiation increased gradually from May, reached the maximum in July, and then declined gradually, starting at the end of August. The temporal variations in turbulent energy fluxes (H, LE) over the four contrasting vegetation covered surfaces showed very similar patterns for the growing season. The temporal pattern of the sensible heat flux showed maximum values in May and a gradual decrease through June to August, increasing slowly in early September (Figure 6b). In contrast, the latent heat flux exhibited a gradual increase from May to August as plants leafed out and quickly developed, and in mid-September it started to decline (Figure 6c). As shown in Table 4, the ratios of H/Rn for the four vegetation covered sites were relatively greater than that of LE/Rn in May and October. Nevertheless, during the period of June–September, a large proportion of Rn was partitioned into LE. For barren-land, more than 40% of net radiation was partitioned into sensible heat flux for the whole growing season.
There were distinct differences in Rn, H, and LE over the five contrasting surfaces (Figure 6). By comparison, the cropland had the lowest net radiation, followed by the barren-land, while the mixed forest exhibited the highest net radiation, followed by the shrubland and the P. euphratica forest (Figure 6a). No significant relationship was found between net radiation and elevation, as the terrain of the study area is almost even (Table 1), while cloud cover and types of clouds have considerable effect on the day-to-day variability of surface solar radiation, as well as the net radiation [75]. The downward and upward longwave radiation and albedo of the five surfaces were compared in Figure 7. In Figure 7a, the DLR increased gradually due to an increase in air temperature (Figure 3b) and humidity (Figure 3c). There was very small difference in DLR between the five contrasting surfaces as a result of their similar air temperature. However, little difference in ULR between the five surfaces was obviously observed, particularly in July and August, indicating that the differences in surface temperature increases; and the vegetation covered surfaces emitted less longwave radiation than the barren-land (Figure 7b) as the surface temperature of the plants was lower, particularly for CL. This in turn is due to the fact the plants use a large part of the available energy for evapotranspiration, rather than to heat up their leaves [75]. Figure 7c presents the temporal variations of the albedo for the five surfaces. In addition to CL, the albedo decreased gradually as the vegetation canopy greened and grew, starting in May, and remained more or less steady in July, increasing sharply late in the season. The temporal pattern of the albedo had a great impact on the temporal trend in Rn. The values of the albedo for the five surfaces differed markedly (Figure 7c). Furthermore, the cropland had much larger albedo as compared to the barren-land, mainly associated with the plastic mulch used on the fields, which would enhance the surface reflection and thus result in lower net radiation. Dramatic differences in albedo and surface temperature between the five surfaces provide a partial explanation for the observed differences in Rn across sites (Figure 6a), as net effects of the lower albedo and lower surface temperature of the vegetated surface are responsible for the retainment of more energy [4].
Significant differences in the energy partitioning into sensible and latent heat flux between the five surfaces can be found (Figure 6 and Table 4). The sensible heat flux over the barren-land was much larger than latent heat flux throughout the growing season as compared to the vegetation covered surfaces, as a large part of the available energy was used for heating up the soil. In addition, the latent heat flux increased a little after rainfall events or flood irrigation by the water from the Heihe River (Figure 6d). Over the T. chinensis shrubland (SL), the sensible heat flux accounted for a large proportion of the net radiation (65–78%) in May and October, while during June to September, more net radiation was partitioned into latent heat flux, and the ratios of LE to Rn ranged between 0.48 and 0.80. Values of LE/Rn ratio for SL resembled data reported for other T. chinensis shrubland in the Tarim River Basin [92]. The temporal patterns of the sensible and latent heat fluxes at MF and PF were similar to the behavior observed over SL, but with much higher LE/Rn values (Table 4). Consistent finding was reported by Yuan et al. [55] The above-mentioned results showed that the surface heat and water vapor exchange of riparian forest ecosystem was mainly controlled by the phenology of vegetation regardless of soil water content, as reported by Hao et al. [1] in the Inner Mongolia steppe.
The Cropland station (CL) was covered by the artificially planted cantaloupe. The first round of flood irrigation with groundwater over the fields was conducted before planting (about 11 June in 2014, Figure 6d) to provide ample soil moisture for crop growth (Figure 7d). For this irrigation period, the latent heat flux was much larger than the sensible heat flux (Figure 6c). In mid-June the cantaloupe began to plant. As a result of its rapid growth and subsequent second round of groundwater irrigation, LE increased dramatically and even exceeded to Rn in August (Figure 6c and Table 4); meanwhile, many negative H values occurred, mostly attributed to significant advection of heat from the surrounding dry land [93]. As wet evaporation surfaces can become cooler than the air above, when this condition occurs, the sensible heat is extracted from the warm air and used in evapotranspiration [3,94]. This special phenomenon, known as the ‘oasis effect’, was distinctly observed in the oasis agroecosystem on clear days in summer [2,68,93,95].

3.5. Temporal Patterns of Evapotranspiration in the Oasis Riparian Forest Ecosystems

Time series of daily ET under five contrasting surface conditions for the 2014 growing season are shown in Figure 8. Between May and October, day-to-day variation in ET resulted from the temporal variation in atmospheric conditions (Figure 3 and Figure 6a) and vegetation growth. The ET increased significantly on days when rainfall event occurred, particularly in June. The barren-land had the smallest ET values throughout the growing season, but showed a much stronger response to the rainfall events, with a rapid increase in ET on rainy days. The barren-land ET increased a little in mid-October due to flood irrigation by the surface water from the Heihe River (Figure 8). Over the vegetated surfaces, the daily sums of ET showed very similar patterns for the growing season, where ET values increased rapidly in May and reached the maximum in July, declining gradually at the end of August. The groundwater depth at the vegetated area increased gradually during the plant growing period until the groundwater was replenished greatly by large amount of surface water from the Heihe River in mid-September (Figure 9), according to the streamflow observed at Langxinshan gauging station (Figure 1). It indicated that a gradual increase in the groundwater depth occurred in response to the uptake of groundwater by riparian forest ecosystem via evaporation and transpiration. This finding corresponds well with other reports on riparian forests given by Wang et al. [39]. As shown in Figure 9, the groundwater depth increased to some extent in mid-July, particularly observed at No.5 well nearby the river, as the surface water from Heihe River entered the key area of P. euphratica forest reserve. According to the streamflow observed at Langxinshan gauging station, this round of water allocation lasted about 10 days. Since 9 September, the amount of surface water entering the Ejina Oasis increased dramatically until late October. This revealed that the surface water from Heihe River and groundwater are two main water sources to sustain the natural growth of oasis riparian forests [53,96,97].
The daily ET values at the five study sites were remarkably different (Figure 8). The differences in ET of the five ecosystems during the growing period could be attributed primarily to the differences in vegetation coverage (Table 3) and soil moisture conditions (Figure 7d). Consistent findings have been reported in the grasslands and agricultural ecosystems [5] as well as the Leymus chinensis steppe [1]. For the cropland, the greatest values of ET occurred in August (7–8 mm d−1), associated closely with the highest rate of crop growth and abundant available water via flood irrigation with groundwater, which was applied four times throughout the whole crop growth period (Figure 8). The four rounds of flood irrigation through pumping the groundwater resulted in the decline of the groundwater depth until the flood irrigation with the water from the Heihe River was conducted over the cropland in mid-October (Figure 9).
The T. chinensis shrubland exhibited higher ET rates in July (6–7 mm d−1), where the atmospheric conditions were warm (reaching 25 °C) with high air humidity (averaged 30%) and ample soil moisture (~40%), see Figure 3 and Figure 7d. The mixed forest of P. euphratica and T. chinensis (MF and PF) showed larger values of ET as compared to SL, particularly early in the season when the tree was leafed out and well developed. This difference is also observed by Yu et al. [58]. In the Ejina Oasis, a previous study shows that more than 90% of water transpired from P. euphratica trees comes from the groundwater, when its depth ranges between 2 and 2.5 m [98]. Here, the groundwater depth at the intensive observation area ranged between 1.5 and 3.5 m (Figure 9), which is within the optimal depth of 3–5 m for the survival of P. euphratica tree [96,99,100]. It showed that the groundwater table at this area was high enough to provide abundant available water for natural growth of P. euphratica in the reserve. In addition, greater soil moisture occurred at 0.8 m depth (36%) under the areas covered by the P. euphratica tree, presumably due to its highest absorbent root density at 0.8–1.0 m depth [101,102] and its ability to uptake deeper water sources [4].

3.6. Evapotranspiration over a Riparian Forest Ecosystem with Different Land-Cover Types

The monthly cumulative ET for the five surfaces from May to October in 2014 is listed in Table 5. The monthly ET presented a distinctly temporal variation throughout the growing season, with higher values in July and August. The main reason is that the highest rate of plant growth occurs over these two months and vegetation water use increases dramatically [103]. In May, monthly ET values were much greater for the mixed forest (54–58 mm). By September, the monthly sums of ET declined considerably, partly due to the occurrence of leaf senescence resulting in general lower water use by the vegetation. In October, monthly ET from riparian forests was close to that of barren-land, attributed to the dormant and leafless P. euphratica trees and T. chinensis shrubs with no transpiration.
For five and a half months (11 May to 30 October) in 2014, the monthly ET over the barren-land increased from 14.6 mm in May to 52.2 mm in July and decreased to 20.65 mm in September for a total of 194.5 mm. For the irrigated cantaloupe cropland, the total ET from June to September was 431.5 mm, with mean ET of 3.8 mm d−1, which is comparable to the results estimated from remote sensing based ET model by Zhou et al. [104]. Nevertheless, for the whole growing season, total ET was 545 mm, and mean daily ET value 3.4 mm d−1 over an irrigated maize field in the HRB [2]. In comparison, total ET was from 503.1 to 562.4 mm, and mean ET values from 3.47 to 3.54 mm d−1 in an irrigated maize field with plastic mulch (with mean LAI of 3.1) in the Hexi Corridor of northwestern China [34]. Differences in ET over irrigated crop fields are mainly affected by the atmospheric conditions (such as solar radiation and air temperature), crop phenology, and field management.
For the T. chinensis shrubland, monthly ET increased from 23.7 mm in May to 161.3 mm in July and declined rapidly to 86.2 mm in September. The total ET from May to September was about 516 mm with a total average value of 3.6 mm d−1. Yu et al. [58] observed a total ET of 548 mm from May to October, and a mean daily ET of 3.6 mm d−1 in a T. chinensis shrubland with LAI of 1.97 under the same climate in the HRB (location: 42°01′ N, 101°03′ E, 926 m). The results of our study were comparable with that study site mainly due to similar EC technique. However, total ET in an entire growing season (April to October) was about 500 mm and the mean daily ET of 3.8 mm d−1 under an T. chinensis shrubland (with LAI of 1.15) in the TRB (location: 40°27′ N, 87°54′ E, 846 m; [54]), which is smaller than our results. This difference might be attributed to the canopy structure and groundwater depth.
Over the mixed forest of P. euphratica trees with associated T. chinensis shrubs, total ET between May and October was from 622.4 to 731.4 mm and mean daily values from 3.6 to 4.2 mm. Our result was a little lower than the mean ET of the P. euphratica forest (4. 5 mm d−1) in the TRB (location: 40°25′59″ N, 88°01′34″ E; 844 m; [55]). Yu et al. [57,59] observed a total ET of 766.4 mm and a mean ET of 4.0 mm d−1 over a middle-aged P. euphratica forest within the same study area (location: 41°59′ N, 101°10′ E, 920 m), which is greater than the results in our study sites. One possible reason is that the transpiration rate is greater for the young tree as compared to the older tree [22,105].
All in all, for the five and a half months growing period in 2014, the total ET was highest for the mixed forest of P. euphratica trees with associated T. chinensis shrubs (622–731 mm), followed by the T. chinensis shrubland (541 mm); the total ET over the irrigated cantaloupe cropland from June to September (431.5 mm) was close to that of T. chinensis shrubland (492.1 mm). Thus, more concern should be raised regarding the large amount of water consumption of cropland in the Ejina Oasis. Since the allocation of water resources to the Ejina Oasis for restoring its natural ecosystem, the expansion of cropland can be considered an inappropriate use of water resources in the HRB [46].

4. Conclusions

Based on the HiWATER project, the exchanges of heat and water vapor over an oasis riparian forest ecosystem were measured by a network of EC systems installed over five representative surfaces. The energy balance closure for the EC flux measurements at the five study sites was generally good, with average EBR of 1.03 over the observation period between May and October in 2014. Throughout the growing season, the temporal variations in net radiation (Rn), sensible heat flux (H), and latent heat flux (LE) showed very similar patterns for the five study sites, with a gradual increase in Rn and LE for the early season, followed by a gradual decline in the late season, while the daily H exhibited a gradual decline trend. Remarkable differences in Rn and energy flux partitioning into H and LE over the five surfaces were related mostly to the soil properties (e.g., soil temperature and moisture), the phenology of the P. euphratica and T. chinensis, and the local cropland field management. About 70–90% of Rn at riparian forest was partitioned into LE over the course of the middle growing season (June–August).
The daily ET showed significantly temporal variations for diverse surface types within the riparian forest ecosystem, with higher values in July and August. Moreover, the total ET showed considerable differences at a variety of surface types. For five and a half months in 2014, ET ranged 622–731 mm for the mixed forest of P. euphratica tree with associated T. chinensis shrub, with the average daily ET of 3.6–4.2 mm; for the T. chinensis shrubland, the total ET was close to 541 mm and the average daily ET was 3.6 mm, which were comparable to the results of other study sites in extreme arid regions of northwestern China. ET for the barren-land was approximately 195 mm. The total ET in irrigated cantaloupe cropland with plastic mulch was 431.5 mm for its four-month growing period with a total average of 3.8 mm d−1. Clearly, more attention should be paid to the large amount of water consumption of cropland in the Ejina Oasis.
Investigating the energy and water vapor exchange in an oasis riparian forest is quite important to improve scientific understanding of land surface processes of the groundwater-dependent ecosystems in extreme arid regions. Additionally, this work will play a crucial role in developing the algorithms and improve the parameterization schemes of relevant remote-sensing based ET models and land surface process models. Quantification of ET over Ejina Oasis riparian forest ecosystem can provide fundamental indications for allocating the limited water resources reasonably for its ecosystem rehabilitation. Furthermore, this work will be extended to the water balance study of the oasis riparian forest ecosystems, which is significantly practical for hydrology modeling and basin water resource management.

Author Contributions

Conceptualization, W.W. and J.W.; methodology, F.X.; software, F.X.; validation, W.W., J.W. and F.X.; formal analysis, F.X.; investigation, F.X.; resources, F.X.; writing—original draft preparation, F.X.; writing—review and editing, W.W.; supervision, W.W. and J.W.; project administration, W.W.; funding acquisition, W.W. All authors have read and agreed to the published version of the manuscript.

Funding

This work was supported by the National Science and Technology Major project of China’s High Resolution Earth Observation System (No. 21-Y20B01-9001-19/22); the National Natural Science Foundation of China (grant number 42101411); Key Laboratory of Land Surface Process and Climate Change in Cold and Arid Regions, Chinese Academy of Sciences.

Data Availability Statement

All the meteorological data and the flux measurements from eddy-covariance systems used in this study are available at http://data.tpdc.ac.cn on request (accessed on 12 October 2021).

Acknowledgments

We express our sincere appreciation to the editor and two anonymous reviewers for their constructive comments that significantly improved the presentation of this paper. We also appreciate all the scientists, engineers, and students who participated in the HiWATER field campaigns. The dataset is provided by National Tibetan Plateau Data Center (http://data.tpdc.ac.cn (accessed on 12 October 2021)).

Conflicts of Interest

The authors declare no conflict of interest.

References

  1. Hao, Y.; Wang, Y.; Huang, X.; Cui, X.; Zhou, X.; Wang, S.; Niu, H.; Jiang, G. Seasonal and interannual variation in water vapor and energy exchange over a typical steppe in Inner Mongolia, China. Agric. For. Meteorol. 2007, 146, 57–69. [Google Scholar] [CrossRef]
  2. Zhang, Y.; Zhao, W.; He, J.; Zhang, K. Energy exchange and evapotranspiration over irrigated seed maize agroecosystems in a desert-oasis region, northwest China. Agric. For. Meteorol. 2016, 223, 48–59. [Google Scholar] [CrossRef]
  3. Baldocchi, D.; Kelliher, F.; Black, T.A.; Jarvis, P. Climate and vegetation controls on boreal zone energy exchange. Glob. Chang. Biol. 2000, 6, 69–83. [Google Scholar] [CrossRef] [Green Version]
  4. Baldocchi, D.D.; Xu, L.; Kiang, N. How plant functional-type, weather, seasonal drought, and soil physical properties alter water and energy fluxes of an oak–grass savanna and an annual grassland. Agric. For. Meteorol. 2004, 123, 13–39. [Google Scholar] [CrossRef] [Green Version]
  5. Burba, G.G.; Verma, S.B. Seasonal and interannual variability in evapotranspiration of native tallgrass prairie and cultivated wheat ecosystems. Agric. For. Meteorol. 2005, 135, 190–201. [Google Scholar] [CrossRef]
  6. Norman, J.; Kustas, W.; Prueger, J.; Diak, G. Surface flux estimation using radiometric temperature: A dual-temperature-difference method to minimize measurement errors. Water Resour. Res. 2000, 36, 2263–2274. [Google Scholar] [CrossRef] [Green Version]
  7. Zhu, G.; Lu, L.; Su, Y.; Wang, X.; Li, C. Energy flux partitioning and evapotranspiration in a sub-alpine spruce forest ecosystem. Hydrol. Process. 2014, 28, 5093–5104. [Google Scholar]
  8. Xu, T.; He, X.; Bateni, S.; Auligne, T.; Shaomin, L.; Xu, Z.; Zhou, J.; Mao, K. Mapping regional turbulent heat fluxes via variational assimilation of land surface temperature data from polar orbiting satellites. Remote Sens. Environ. 2019, 221, 444–461. [Google Scholar] [CrossRef]
  9. Chen, S.; Chen, J.; Lin, G.; Zhang, W.; Miao, H.; Wei, L.; Huang, J.; Han, X. Energy balance and partition in Inner Mongolia steppe ecosystems with different land use types. Agric. For. Meteorol. 2009, 149, 1800–1809. [Google Scholar] [CrossRef]
  10. Lian, X.; Piao, S.; Huntingford, C.; Li, Y.; Zeng, Z.; Wang, X.; Ciais, P.; McVicar, T.R.; Peng, S.; Ottlé, C.; et al. Partitioning global land evapotranspiration using CMIP5 models constrained by observations. Nat. Clim. Chang. 2018, 8, 640–646. [Google Scholar] [CrossRef]
  11. Anderson, M.C.; Allen, R.G.; Morse, A.; Kustas, W.P. Use of Landsat thermal imagery in monitoring evapotranspiration and managing water resources. Remote Sens. Environ. 2012, 122, 50–65. [Google Scholar] [CrossRef]
  12. Allen, R.G.; Tasumi, M.; Trezza, R. Satellite-based energy balance for mapping evapotranspiration with internalized calibration (METRIC)—Model. J. Irrig. Drain. Eng. 2007, 133, 380–394. [Google Scholar] [CrossRef]
  13. Douglas, E.M.; Jacobs, J.M.; Sumner, D.M.; Ray, R.L. A comparison of models for estimating potential evapotranspiration for Florida land cover types. J. Hydrol. 2009, 373, 366–376. [Google Scholar] [CrossRef]
  14. Srivastava, A.; Sahoo, B.; Raghuwanshi, N.S.; Singh, R. Evaluation of variable-infiltration capacity model and MODIS-Terra satellite-derived grid-scale evapotranspiration estimates in a river basin with tropical monsoon-type climatology. J. Irrig. Drain. Eng. 2017, 143, 04017028. [Google Scholar] [CrossRef] [Green Version]
  15. Wang, K.; Dickinson, R.E. A review of global terrestrial evapotranspiration: Observation, modeling, climatology, and climatic variability. Rev. Geophys. 2012, 50, 2011RG000373. [Google Scholar] [CrossRef]
  16. Jung, M.; Koirala, S.; Weber, U.; Ichii, K.; Gans, F.; Camps-Valls, G.; Papale, D.; Schwalm, C.; Tramontana, G.; Reichstein, M. The FLUXCOM ensemble of global land-atmosphere energy fluxes. Sci. Data 2019, 6, 74. [Google Scholar] [CrossRef] [PubMed] [Green Version]
  17. Chen, J.M.; Liu, J. Evolution of evapotranspiration models using thermal and shortwave remote sensing data. Remote Sens. Environ. 2020, 237, 111594. [Google Scholar] [CrossRef]
  18. Mu, Q.; Heinsch, F.A.; Zhao, M.; Running, S.W. Development of a global evapotranspiration algorithm based on MODIS and global meteorology data. Remote Sens. Environ. 2007, 111, 519–536. [Google Scholar] [CrossRef]
  19. Jia, Z.; Liu, S.; Xu, Z.; Chen, Y.; Zhu, M. Validation of remotely sensed evapotranspiration over the Hai River Basin, China. J. Geophys. Res. Atmos. 2012, 117, D13113. [Google Scholar] [CrossRef]
  20. Liu, S.; Xu, Z.; Song, L.; Zhao, Q.; Ge, Y.; Xu, T.; Ma, Y.; Zhu, Z.; Jia, Z.; Zhang, F. Upscaling evapotranspiration measurements from multi-site to the satellite pixel scale over heterogeneous land surfaces. Agric. For. Meteorol. 2016, 230, 97–113. [Google Scholar] [CrossRef]
  21. Baldocchi, D.D.; Hincks, B.B.; Meyers, T.P. Measuring biosphere-atmosphere exchanges of biologically related gases with micrometeorological methods. Ecology 1988, 69, 1331–1340. [Google Scholar] [CrossRef]
  22. Baldocchi, D.; Falge, E.; Gu, L.; Olson, R.; Hollinger, D.; Running, S.; Anthoni, P.; Bernhofer, C.; Davis, K.; Evans, R. FLUXNET: A new tool to study the temporal and spatial variability of ecosystem-scale carbon dioxide, water vapor, and energy flux densities. Bull. Am. Meteorol. Soc. 2001, 82, 2415–2434. [Google Scholar] [CrossRef]
  23. Baldocchi, D. Assessing the eddy covariance technique for evaluating carbon dioxide exchange rates of ecosystems: Past, present and future. Glob. Chang. Biol. 2003, 9, 479–492. [Google Scholar] [CrossRef] [Green Version]
  24. Yu, G.; Fu, Y.; Sun, X.; Wen, X.; Zhang, L. Recent progress and future directions of ChinaFLUX. Sci. China Ser. D Earth Sci. 2006, 49 (Suppl. II), 1–23. [Google Scholar] [CrossRef]
  25. Aubinet, M.; Grelle, A.; Ibrom, A.; Rannik, Ü.; Moncrieff, J.; Foken, T.; Kowalski, A.S.; Martin, P.; Berbigier, P.; Bernhofer, C.; et al. Estimates of the annual net carbon and water exchange of forests: The EUROFLUX methodology. In Advances in Ecological Research; Fitter, A., Raffaelli, D., Eds.; Academic Press: New York, NY, USA, 2000; Volume 30, pp. 113–175. [Google Scholar]
  26. Xu, F.; Wang, W.; Wang, J.; Xu, Z.; Qi, Y.; Wu, Y. Area-averaged evapotranspiration over a heterogeneous land surface: Aggregation of multi-point EC flux measurements with a high-resolution land-cover map and footprint analysis. Hydrol. Earth Syst. Sci. 2017, 21, 4037–4051. [Google Scholar] [CrossRef] [Green Version]
  27. Law, B.E.; Falge, E.; Gu, L.; Baldocchi, D.D.; Bakwin, P.; Berbigier, P.; Davis, K.; Dolman, A.J.; Falk, M.; Fuentes, J.D.; et al. Environmental controls over carbon dioxide and water vapor exchange of terrestrial vegetation. Agric. For. Meteorol. 2002, 113, 97–120. [Google Scholar] [CrossRef] [Green Version]
  28. McCaughey, J.H.; Lafleur, P.M.; Joiner, D.W.; Bartlett, P.A.; Costello, A.M.; Jelinski, D.E.; Ryan, M.G. Magnitudes and seasonal patterns of energy, water, and carbon exchanges at a boreal young jack pine forest in the BOREAS northern study area. J. Geophys. Res. Atmos. 1997, 102, 28997–29007. [Google Scholar] [CrossRef]
  29. Liu, H.; Feng, J. Seasonal and interannual variations of evapotranspiration and energy exchange over different land surfaces in a semiarid area of China. J. Appl. Meteorol. Climatol. 2012, 51, 1875–1888. [Google Scholar]
  30. Trepekli, A.; Loupa, G.; Rapsomanikis, S. Seasonal evapotranspiration, energy fluxes and turbulence variance characteristics of a Mediterranean coastal grassland. Agric. For. Meteorol. 2016, 226, 13–27. [Google Scholar] [CrossRef]
  31. Krishnan, P.; Meyers, T.P.; Scott, R.L.; Kennedy, L.; Heuer, M. Energy exchange and evapotranspiration over two temperate semi-arid grasslands in North America. Agric. For. Meteorol. 2012, 153, 31–44. [Google Scholar] [CrossRef]
  32. Liu, S.; Li, S.G.; Yu, G.R.; Asanuma, J.; Sugita, M.; Zhang, L.M.; Hu, Z.M.; Wei, Y.F. Seasonal and interannual variations in water vapor exchange and surface water balance over a grazed steppe in central Mongolia. Agric. Water Manag. 2010, 97, 857–864. [Google Scholar] [CrossRef]
  33. Lei, H.; Yang, D. Interannual and seasonal variability in evapotranspiration and energy partitioning over an irrigated cropland in the North China Plain. Agric. For. Meteorol. 2010, 150, 581–589. [Google Scholar] [CrossRef]
  34. Ding, R.; Kang, S.; Li, F.; Zhang, Y.; Tong, L. Evapotranspiration measurement and estimation using modified Priestley–Taylor model in an irrigated maize field with mulching. Agric. For. Meteorol. 2013, 168, 140–148. [Google Scholar] [CrossRef]
  35. Hu, Y.; Su, C.; Zhang, Y. Research on the microclimate characteristics and cold island effect over a reservoir in the Hexi Region. Adv. Atmos. Sci. 1988, 5, 117–126. [Google Scholar] [CrossRef]
  36. Wang, J.; Liu, X.; Qi, Y. A preliminary study of turbulence transfer characteristics in Gobi area with an eddy correlation technique. Plateau Meteorol. 1990, 9, 120–129, (In Chinese with English Abstract). [Google Scholar]
  37. Hu, Y.; Yang, X.; Zhang, Q.; Zuo, H. The characters of energy budget on the Gobi and desert surface in Hexi region. Acta Meteorol. Sin. 1992, 6, 82–91. [Google Scholar]
  38. Smith, S.D.; Devitt, D.A.; Sala, A.; Cleverly, J.R.; Busch, D.E. Water relations of riparian plants from warm desert regions. Wetlands 1998, 18, 687–696. [Google Scholar] [CrossRef]
  39. Wang, P.; Grinevsky, S.O.; Pozdniakov, S.P.; Yu, J.; Dautova, D.S.; Min, L.; Du, C.; Zhang, Y. Application of the water table fluctuation method for estimating evapotranspiration at two phreatophyte-dominated sites under hyper-arid environments. J. Hydrol. 2014, 519, 2289–2300. [Google Scholar] [CrossRef]
  40. Noy-Meir, I. Desert ecosystems: Environment and producers. Annu. Rev. Ecol. Syst. 1973, 4, 25–51. [Google Scholar] [CrossRef]
  41. Chen, Y.; Chen, Y.; Li, W.; Zhang, H. Response of the accumulation of proline in the bodies of Populus euphratica to the change of groundwater level at the lower reaches of Tarim River. Chin. Sci. Bull. 2003, 48, 1995–1999. [Google Scholar] [CrossRef]
  42. Li, X.; Cheng, G.; Liu, S.; Xiao, Q.; Ma, M.; Jin, R.; Che, T.; Liu, Q.; Wang, W.; Qi, Y.; et al. Heihe Watershed Allied Telemetry Experimental Research (HiWATER): Scientific Objectives and Experimental Design. Bull. Am. Meteorol. Soc. 2013, 94, 1145–1160. [Google Scholar] [CrossRef]
  43. Zhao, W.; Chang, X.; He, Z. Responses of distribution pattern of desert riparian forests to hydrologic process in Ejina oasis. Sci. China Ser. D Earth Sci. 2004, 47, 21–31. [Google Scholar] [CrossRef]
  44. Yu, J.; Wang, P. Relationship between water and vegetation in the Ejina Delta. Bull. Chin. Acad. Sci. 2012, 26, 68–75. [Google Scholar]
  45. Cheng, G.; Li, X.; Zhao, W.; Xu, Z.; Feng, Q.; Xiao, S.; Xiao, H. Integrated study of the water-ecosystem-economy in the Heihe River Basin. Natl. Sci. Rev. 2014, 1, 413–428. [Google Scholar] [CrossRef] [Green Version]
  46. Li, X.; Cheng, G.; Ge, Y.; Li, H.; Han, F.; Hu, X.; Tian, W.; Tian, Y.; Pan, X.; Nian, Y. Hydrological cycle in the Heihe River Basin and its implication for water resource management in endorheic basins. J. Geophys. Res. Atmos. 2018, 123, 890–914. [Google Scholar] [CrossRef]
  47. Niu, Z.; Zhao, W.; Huang, W.; Chen, X. Impact of Ecological Water Diversion on temporal and spatial change of water resources in Heihe downstream. J. China Hydrol. 2011, 31, 52–56, (In Chinese with English Abstract). [Google Scholar]
  48. Si, J.; Qi, F.; Zhang, X.; Su, Y.; Zhang, Y. Vegetation changes in the lower reaches of the Heihe River after its water import. Acta Bot. Boreali-Occidential Sin. 2005, 25, 631–640, (In Chinese with English Abstract). [Google Scholar]
  49. Xi, H.; Feng, Q.; Si, J.; Chang, Z.; Su, Y. Response of NDVI to groundwater level change in the lower reaches of the Heihe River, China. J. Desert Res. 2013, 33, 574–582, (In Chinese with English Abstract). [Google Scholar]
  50. Nian, Y.; Li, X.; Zhou, J. Landscape changes of the Ejin Delta in the Heihe River Basin in Northwest China from 1930 to 2010. Int. J. Remote Sens. 2017, 38, 537–557. [Google Scholar] [CrossRef]
  51. Hu, X.L.; Lu, L.; Li, X.; Wang, J.H.; Lu, X.G. Ejin oasis land use and vegetation change between 2000 and 2011: The role of the ecological water diversion project. Energies 2015, 8, 7040–7057. [Google Scholar] [CrossRef]
  52. Si, J.; Feng, Q.; Zhang, X.; Liu, W.; Su, Y.; Zhang, Y. Growing season evapotranspiration from Tamarix ramosissima stands under extreme arid conditions in northwest China. Environ. Geol. 2005, 48, 861–870. [Google Scholar] [CrossRef]
  53. Hou, L.; Xiao, H.; Si, J.; Xiao, S.; Zhou, M.; Yang, Y. Evapotranspiration and crop coefficient of Populus euphratica Oliv forest during the growing season in the extreme arid region northwest China. Agric. Water Manag. 2010, 97, 351–356. [Google Scholar] [CrossRef]
  54. Yuan, G.; Zhang, P.; Shao, M.A.; Luo, Y.; Zhu, X. Energy and water exchanges over a riparian Tamarix spp. stand in the lower Tarim River basin under a hyper-arid climate. Agric. For. Meteorol. 2014, 194, 144–154. [Google Scholar] [CrossRef] [Green Version]
  55. Yuan, G.F.; Luo, Y.; Shao, M.A.; Zhang, P.; Zhu, X.C. Evapotranspiration and its main controlling mechanism over the desert riparian forests in the lower Tarim River Basin. Sci. China Earth Sci. 2015, 58, 1032–1042. [Google Scholar] [CrossRef]
  56. Yu, T.; Feng, Q.; Si, J.; Zhang, X.; Zhao, C. Tamarix ramosissima stand evapotranspiration and its association with hydroclimatic factors in an arid region in northwest China. J. Arid Environ. 2017, 138, 18–26. [Google Scholar] [CrossRef]
  57. Yu, T.; Feng, Q.; Si, J.; Zhang, X.; Zhao, C.Y. Evapotranspiration of a Populus euphratica Oliv. forest and its controlling factors in the lower Heihe River Basin, Northwest China. Sci. Cold Arid Reg. 2017, 9, 175–182. [Google Scholar]
  58. Yu, T.F.; Feng, Q.; Si, J.H.; Zhang, X.Y.; Xi, H.Y.; Zhao, C.Y. Comparable water use of two contrasting riparian forests in the lower Heihe River basin, Northwest China. J. For. Res. 2018, 29, 1215–1224. [Google Scholar] [CrossRef]
  59. Yu, T.F.; Feng, Q.; Si, J.H.; Xi, H.Y.; O’Grady, A.P.; Pinkard, E.A. Responses of riparian forests to flood irrigation in the hyper-arid zone of NW China. Sci. Total Environ. 2019, 648, 1421–1430. [Google Scholar] [CrossRef] [PubMed]
  60. Su, Y.; Qi, Y.; Wang, J.; Xu, F.; Zhang, J. Vegetation coverage classification and vegetation structure parameters of Populus euphratica forest in Ejina Oasis by LiDAR. J. Desert Res. 2017, 37, 689–697, (In Chinese with English Abstract). [Google Scholar]
  61. Yu, W. Characteristics of Phenology and Physiological Ecology of Populus euphratica Olive in Ejina. Ph.D. Thesis, Beijing Forestry University, Beijing, China, 2013. (In Chinese with English Abstract). [Google Scholar]
  62. Xu, F.; Wang, W.; Wang, J.; Huang, C.; Qi, Y.; Li, Y.; Ren, Z. Aggregation of area-averaged evapotranspiration over the Ejina Oasis based on a flux matrix and footprint analysis. J. Hydrol. 2019, 575, 17–30. [Google Scholar] [CrossRef]
  63. Song, Y.; Li, Y. HiWATER: Dataset of Leaf Area Index by LAI2200 in the Lower Reaches of the Heihe River Basin. A Big Earth Data Platform for Three Poles. 2015. Available online: http://data.tpdc.ac.cn/en/data/d6584b27-1e02-4bc7-90d1-8b360d9c69ab/ (accessed on 12 October 2021). [CrossRef]
  64. Liebethal, C.; Huwe, B.; Foken, T. Sensitivity analysis for two ground heat flux calculation approaches. Agric. For. Meteorol. 2005, 132, 253–262. [Google Scholar] [CrossRef]
  65. Xu, Z.; Ma, Y.; Liu, S.; Shi, W.; Wang, J. Assessment of the Energy balance closure under advective conditions and its impact using remote sensing data. J. Appl. Meteorol. Climatol. 2017, 56, 127–140. [Google Scholar] [CrossRef]
  66. Wang, J.; Zhuang, J.; Wang, W.; Liu, S.; Xu, Z. Assessment of uncertainties in eddy covariance flux measurement based on intensive flux matrix of HiWATER-MUSOEXE. IEEE Geosci. Remote Sens. Lett. 2015, 12, 259–263. [Google Scholar] [CrossRef]
  67. Xu, Z.; Liu, S.; Li, X.; Shi, S.; Wang, J.; Zhu, Z.; Xu, T.; Wang, W.; Ma, M. Intercomparison of surface energy flux measurement systems used during the HiWATER-MUSOEXE. J. Geophys. Res. D Atmos. 2013, 118, 13140–13157. [Google Scholar] [CrossRef]
  68. Liu, S.; Xu, Z.; Wang, W.; Jia, Z.; Zhu, M.; Bai, J.; Wang, J. A comparison of eddy-covariance and large aperture scintillometer measurements with respect to the energy balance closure problem. Hydrol. Earth Syst. Sci. 2011, 15, 1291–1306. [Google Scholar] [CrossRef] [Green Version]
  69. Mauder, M.; Foken, T. Documentation and Instruction Manual of the Eddy-Covariance Software Package TK3 (Update); Universität Bayreuth, Abt. Mikrometeorologie: Bayreuth, Germany, 2015. [Google Scholar]
  70. Horst, T.; Weil, J. Footprint estimation for scalar flux measurements in the atmospheric surface layer. Bound. Layer Meteorol. 1992, 59, 279–296. [Google Scholar] [CrossRef]
  71. Kim, J.; Guo, Q.; Baldocchi, D.; Leclerc, M.; Xu, L.; Schmid, H. Upscaling fluxes from tower to landscape: Overlaying flux footprints on high-resolution (IKONOS) images of vegetation cover. Agric. For. Meteorol. 2006, 136, 132–146. [Google Scholar] [CrossRef] [Green Version]
  72. Kljun, N.; Calanca, P.; Rotach, M.; Schmid, H. A simple two-dimensional parameterisation for Flux Footprint Prediction (FFP). Geosci. Model Dev. 2015, 8, 3695–3713. [Google Scholar] [CrossRef] [Green Version]
  73. Chehbouni, A.; Watts, C.; Lagouarde, J.-P.; Kerr, Y.; Rodriguez, J.-C.; Bonnefond, J.-M.; Santiago, F.; Dedieu, G.; Goodrich, D.; Unkrich, C. Estimation of heat and momentum fluxes over complex terrain using a large aperture scintillometer. Agric. For. Meteorol. 2000, 105, 215–226. [Google Scholar] [CrossRef] [Green Version]
  74. Kim, J.; Hwang, T.; Schaaf, C.L.; Kljun, N.; Munger, J.W. Seasonal variation of source contributions to eddy-covariance CO2 measurements in a mixed hardwood-conifer forest. Agric. For. Meteorol. 2018, 253, 71–83. [Google Scholar] [CrossRef]
  75. Moene, A.F.; Dam, J.C.V. Transport in the Atmosphere-Vegetation-Soil Continuum; Cambridge University Press: New York, NY, USA, 2014; p. 436. [Google Scholar]
  76. Campos, S.; Mendes, K.R.; da Silva, L.L.; Mutti, P.R.; Medeiros, S.S.; Amorim, L.B.; dos Santos, C.A.C.; Perez-Marin, A.M.; Ramos, T.M.; Marques, T.V.; et al. Closure and partitioning of the energy balance in a preserved area of a Brazilian seasonally dry tropical forest. Agric. For. Meteorol. 2019, 271, 398–412. [Google Scholar] [CrossRef]
  77. Majozi, N.P.; Mannaerts, C.M.; Ramoelo, A.; Mathieu, R.; Nickless, A.; Verhoef, W. Analysing surface energy balance closure and partitioning over a semi-arid savanna FLUXNET site in Skukuza, Kruger National Park, South Africa. Hydrol. Earth Syst. Sci. 2017, 21, 3401–3415. [Google Scholar] [CrossRef] [Green Version]
  78. McGloin, R.; Šigut, L.; Havránková, K.; Dušek, J.; Pavelka, M.; Sedlák, P. Energy balance closure at a variety of ecosystems in Central Europe with contrasting topographies. Agric. For. Meteorol. 2018, 248, 418–431. [Google Scholar] [CrossRef]
  79. Oncley, S.P.; Foken, T.; Vogt, R.; Kohsiek, W.; DeBruin, H.; Bernhofer, C.; Christen, A.; Van Gorsel, E.; Grantz, D.; Feigenwinter, C. The energy balance experiment EBEX-2000. Part I: Overview and energy balance. Bound. Layer Meteorol. 2007, 123, 1–28. [Google Scholar] [CrossRef]
  80. Foken, T. The energy balance closure problem: An overview. Ecol. Appl. 2008, 18, 1351–1367. [Google Scholar] [CrossRef]
  81. Foken, T.; Mauder, M.; Liebethal, C.; Wimmer, F.; Beyrich, F.; Leps, J.-P.; Raasch, S.; DeBruin, H.A.; Meijninger, W.M.; Bange, J. Energy balance closure for the LITFASS-2003 experiment. Theor. Appl. Climatol. 2010, 101, 149–160. [Google Scholar] [CrossRef]
  82. Zhou, Y.; Li, D.; Liu, H.; Li, X. Diurnal variations of the flux imbalance over homogeneous and heterogeneous landscapes. Bound. Layer Meteorol. 2018, 168, 417–442. [Google Scholar] [CrossRef]
  83. Eder, F.; De Roo, F.; Rotenberg, E.; Yakir, D.; Schmid, H.P.; Mauder, M. Secondary circulations at a solitary forest surrounded by semi-arid shrubland and their impact on eddy-covariance measurements. Agric. For. Meteorol. 2015, 211, 115–127. [Google Scholar] [CrossRef]
  84. Agam, N.; Kustas, W.P.; Evett, S.R.; Colaizzi, P.D.; Cosh, M.H.; McKee, L.G. Soil heat flux variability influenced by row direction in irrigated cotton. Adv. Water Resour. 2012, 50, 31–40. [Google Scholar] [CrossRef]
  85. Gao, Z.; Horton, R.; Liu, H. Impact of wave phase difference between soil surface heat flux and soil surface temperature on soil surface energy balance closure. J. Geophys. Res. Atmos. 2010, 115, D16112. [Google Scholar] [CrossRef]
  86. Beyrich, F.; Herzog, H.J.; Neisser, J. The LITFASS project of DWD and the LITFASS-98 experiment: The project strategy and the experimental setup. Theor. Appl. Climatol. 2002, 73, 3–18. [Google Scholar] [CrossRef]
  87. Mauder, M.; Liebethal, C.; Göckede, M.; Leps, J.P.; Beyrich, F.; Foken, T. Processing and quality control of flux data during LITFASS. Bound. Layer Meteorol. 2006, 121, 67–88. [Google Scholar] [CrossRef]
  88. Wilson, K.; Goldstein, A.; Falge, E.; Aubinet, M.; Baldocchi, D.; Berbigier, P.; Bernhofer, C.; Ceulemans, R.; Dolman, H.; Field, C. Energy balance closure at FLUXNET sites. Agric. For. Meteorol. 2002, 113, 223–243. [Google Scholar] [CrossRef] [Green Version]
  89. Li, Z.; Yu, G.-R.; Wen, X.; Zhang, L.M.; Ren, C.Y.; Fu, Y.L. Energy balance closure ChinaFLUX sites. Sci. China Ser. D Earth Sci. 2005, 48, 51–62. [Google Scholar]
  90. Liu, S.M.; Xu, Z.W.; Zhu, Z.L.; Jia, Z.Z.; Zhu, M.J. Measurements of evapotranspiration from eddy-covariance systems and large aperture scintillometers in the Hai River Basin, China. J. Hydrol. 2013, 487, 24–38. [Google Scholar] [CrossRef]
  91. Twine, T.E.; Kustas, W.; Norman, J.; Cook, D.; Houser, P.; Meyers, T.; Prueger, J.; Starks, P.; Wesely, M. Correcting eddy-covariance flux underestimates over a grassland. Agric. For. Meteorol. 2000, 103, 279–300. [Google Scholar] [CrossRef] [Green Version]
  92. Ma, H.; Chen, Y.; Li, W. Characteristics of Energy Balance of Riparian Tamarix Shrubs in Desert. J. Desert Res. 2014, 34, 108–117, (In Chinese with English Abstract). [Google Scholar]
  93. Hu, Y. Research advance about the energy budget and transportation of water vapor in the HEIFE area. Adv. Earth Sci. 1994, 9, 30–34, (In Chinese with English Abstract). [Google Scholar]
  94. Ward, H.C. Scintillometry in urban and complex environments: A review. Meas. Sci. Technol. 2017, 28, 064005. [Google Scholar] [CrossRef]
  95. Wang, J. Land surface process experiments and interaction study in China: From HEIFE to IMGRASS and GAME-Tibet/TIPEX. Plateau Meteorol. 1999, 18, 280–294, (In Chinese with English Abstract). [Google Scholar]
  96. Si, J.; Feng, Q.; Cao, S.; Yu, T.; Zhao, C. Water use sources of desert riparian Populus euphratica forests. Environ. Monit. Assess. 2014, 186, 5469–5477. [Google Scholar] [CrossRef] [PubMed]
  97. Chen, Y.; Cui, W.; Li, W.; Zhang, Y. Utilization of water resources and ecological protection in the Tarim River. Acta Geogr. Sin. 2003, 58, 215–222, (In Chinese with English Abstract). [Google Scholar]
  98. Zhu, Y.; Ren, L.; Skaggs, T.H.; Lü, H.; Yu, Z.; Wu, Y.; Fang, X. Simulation of Populus euphratica root uptake of groundwater in an arid woodland of the Ejina Basin, China. Hydrol. Process. 2009, 23, 2460–2469. [Google Scholar] [CrossRef]
  99. Jin, X.M.; Schaepman, M.E.; Clevers, J.G.; Su, Z.B.; Hu, G. Groundwater depth and vegetation in the Ejina area, China. Arid Land Res. Manag. 2011, 25, 194–199. [Google Scholar] [CrossRef]
  100. Zhou, H.; Chen, Y.; Li, W.; Chen, Y. Photosynthesis of Populus euphratica in relation to groundwater depths and high temperature in arid environment, northwest China. Photosynthetica 2010, 48, 257–268. [Google Scholar] [CrossRef]
  101. Feng, Q.; Si, J.; Li, J.; Xi, H. Feature of root distribution of Populus euphratica and its water uptake model in extreme arid region. Adv. Earth Sci. 2008, 23, 765–772, (In Chinese with English Abstract). [Google Scholar]
  102. Fu, A.; Chen, Y.; Li, W. Water use strategies of the desert riparian forest plant community in the lower reaches of Heihe River Basin, China. Sci. China Earth Sci. 2014, 57, 1293–1305. [Google Scholar] [CrossRef]
  103. Song, L.; Liu, S.; Kustas, W.P.; Nieto, H.; Sun, L.; Xu, Z.; Skaggs, T.H.; Yang, Y.; Ma, M.; Xu, T.; et al. Monitoring and validating spatially and temporally continuous daily evaporation and transpiration at river basin scale. Remote Sens. Environ. 2018, 219, 72–88. [Google Scholar] [CrossRef]
  104. Zhou, Y.; Li, X.; Yang, K.; Zhou, J. Assessing the impacts of an ecological water diversion project on water consumption through high-resolution estimations of actual evapotranspiration in the downstream regions of the Heihe River Basin, China. Agric. For. Meteorol. 2018, 249, 210–227. [Google Scholar] [CrossRef]
  105. Si, J.; Feng, Q.; Zhang, X.; Chang, Z.; Su, Y.; Xi, H. Sap flow of Populus euphratica in a desert riparian forest in an extreme arid region during the growing season. J. Integr. Plant Biol. 2007, 49, 425–436. [Google Scholar] [CrossRef]
Figure 1. (a,b) The location of the study area and (c) spatial distribution of all observation sites in the intensive observation area of the HiWATER in 2014. LAS_Es and LAS_Ws indicate the locations of LAS transmitter, LAS_Er and LAS_Wr the locations of paired receiver. The field pictures of five observation sites and LAS_E transmitter were also presented in (c).
Water 13 03424 g001
Figure 2. Flowchart of this study, including data processing and quality control. U: wind speed; WD: wind direction; Ta: air temperature; RH: relative humidity; P: pressure; G: soil heat flux; SM: soil moisture; Ts: surface and soil temperature; G0: surface heat flux; u, v, w: three-dimension wind speed; Tv: sonic virtual temperature; ρv: water vapor; ρc: carbon dioxide; τ : momentum flux; H: sensible heat flux; LE: latent heat flux; Fc: carbon dioxide flux; u*: friction velocity; and Lob: Obukhov length.
Water 13 03424 g002
Figure 3. Monthly averages of (a) wind speed, (b) air temperature, (c) relative humidity, (d) pressure, and (e) monthly cumulative precipitation in 2014. Measurements of the wind speed, air temperature, and relative humidity were taken at 10 m height at SL.
Water 13 03424 g003
Figure 4. Wind rose chart. It shows the wind speeds and frequencies of different wind directions. The measurements of wind speed and direction were made at SL in 2014.
Water 13 03424 g004
Figure 5. Relationships (including equations and R2) between the available energy (x axis) and the sum of turbulent energy fluxes (y axis) based on the 30 min EC data (May–October 2014) at the (a) Shrubland station, (b) Mixed forest station, (c) Populus forest station, (d) Cropland station, (e) Barrenland station, respectively. The black line is the 1:1 line, and the red dash line is the linear fit line determined using the OLSs.
Water 13 03424 g005
Figure 6. Temporal variation in daily (24-h) averages of (a) net radiation, (b) sensible heat flux, (c) latent heat flux, and (d) daily (24-h) cumulative precipitation. In (d) the blue arrows represent irrigations with groundwater over cropland site during the growing season in 2014; the red arrow indicates flood irrigation over the cropland with the water from the Heihe River. SL is T. chinensis shrubland, MF is mixed forest of P. euphratica and T. chinensis, PF is sparse P. euphratica forest with associated T. chinensis shrubland, CL is cropland, and BL is barren-land.
Water 13 03424 g006
Figure 7. Comparisons of daily-averaged (a) downward longwave radiation (DLR), (b) upward longwave radiation (ULR), (c) albedo, and (d) volumetric water content of soil at 0.02 m depth between the five stations. In (c) only daytime data (8:00–19:30 BST) are selected. The legend is consistent to Figure 6.
Water 13 03424 g007
Figure 8. Temporal variation in daily ET at five EC sites for the five and half months in 2014. The blue arrows represent irrigations during the growing season. The legend is consistent to Figure 4.
Water 13 03424 g008
Figure 9. Temporal variation in the measurements of groundwater depth at five observation wells. The red arrow represents the replenishment of groundwater by the surface water from the Heihe River.
Water 13 03424 g009
Table 1. Details of the eddy-covariance systems at each site within the intensive observation area in 2014.
Site Name
(Abbreviations)
Longitude,
Latitude
Altitude (m)Turbulence Sensors, ManufacturersSensor Height (m)Surface TypeDuration
Shrubland station a (SL)101°08′14″ E, 42°00′04″ N873CSAT3&LI7500, Campbell/LI-COR, USA8T. chinensis2013.7–
Mixed forest station (MF)101°08′00″ E, 41°59′28″ N874CSAT3&Li7500, Campbell/LI-COR, USA22P. euphratica and T. chinensis2013.7–
Populus forest station (PF)101°07′26″ E, 41°59′35″ E876CSAT3&LI7500, Campbell/LI-COR, USA22P. euphratica and sparse T. chinensis2013.7–2016.4
Cropland station (CL)101°08′01″ E, 42°00′17″ N875CSAT3&LI7500A, Campbell/LI-COR, USA3.5Cantaloupe2013.7–2015.11
Barren-land station (BL)101°07′57″ E, 41°59′57″ N878CSAT3&LI7500, Campbell/LI-COR, USA3Bare land2013.7–2016.3
a The shrubland station is the Sidaoqiao superstation.
Table 2. Details of the meteorological instruments at five AWSs within the intensive observation area in 2014.
Observation Items bSensorManufacturersHeight/Depth (m)Site Name
Air pressureCS100
AV-410BP
Campbell, Logan, UT, USA
Avalon, Atlanta, GA, USA
10
1.0
SL
MF
PrecipitationTR-525MTexas Electronics, Dallas, TX, USA28SL, MF
Wind speed/direction010C/020CMet One, Grants Pass, OR, USA5/7/10/15/20/28;15SL
WS03001R.M. Young, Traverse City, MI, USA28MF, PF
Air temperature/
relative humidity
HC2S3Campbell, Logan, UT, USA5/7/10/15/20/28SL
HMP45CVaisala, Vantaa, Finland28MF, PF
Four-component
radiation
CNR4Kipp & Zonen, The Netherland10(SL);24 (PF)SL, PF
CNR1Kipp & Zonen, The Netherland24MF
CNR4Kipp & Zonen, The Netherland6CL, BL, PF
Soil temperature109-LCampbell, Logan, UT, USA0/−0.02/−0.04/−0.1/
−0.2/−0.4/−0.8/−1.2/−1.6
SL
AV-10TAvalon, Atlanta, GA, USA0/−0.02/−0.04/−0.1/
−0.2/−0.4/−0.6/−1
MF
−0.02/−0.04PF, BL, CL
Soil moistureML2XDelta−T Devices, Cambridge, UK−0.02/−0.04/−0.1/
−0.2/−0.4/−0.8/−1.2/−1.6
SL
−0.02/−0.04/−0.1/
−0.2/−0.4/−0.6/−1
MF
−0.02/−0.04PF, BL, CL
Soil heat fluxHFP01SCHukseflux, Delft, The Netherlands
Campbell, Logan, UT, USA
−0.06SL, MF, PF,
BL, CL
HFP01
b The duration of meteorological measurement made at the SL, MF, PF, CL, and BL stations is consistent to that of the EC measurement, as listed in Table 1.
Table 3. Relative weight of each surface types in the flux footprint of each EC site for two prevailing wind directions.
Surface Type Southeasterly Winds
(Frequency: 2.5%)
Northwesterly Winds
(Frequency: 3%)
SLMFPFCLBLSLMFPFCLBL
P. euphratica0.460.270.360.35
T. chinensis0.920.280.260.020.620.450.12
cantaloupe1.000.011.00
barren-land0.080.260.470.980.380.190.521.00
Table 4. Ratios of monthly H and LE to Rn (8:30–18:30 BST; Beijing Standard Time) at the five sites during the growing season of May–October in 2014.
SitesMayJuneJulyAug.Sept.Oct.
SLH/Rn0.780.370.190.170.370.65
LE/Rn0.190.480.750.800.570.25
MFH/Rn0.600.290.080.130.280.55
LE/Rn0.400.700.90.800.570.24
PFH/Rn0.600.300.150.220.360.59
LE/Rn0.400.680.810.710.500.27
CLH/Rn0.400.25−0.040.28
LE/Rn0.470.741.240.83
BLH/Rn0.580.420.400.400.430.35
LE/Rn0.120.200.260.270.160.22
Table 5. Monthly variation in evapotranspiration (ET) over five surface types in the Ejina Oasis during the growing season in 2014.
Surface Type cET (mm)MayJuneJulyAug.Sept.Oct.Total
SLMean1.13.25.24.82.90.83.1
Sum23.795.1161.3149.586.225.2541.0
MFMean2.85.66.95.33.20.94.2
Sum58.6166.7215.6163.796.530.2731.4
PFMean2.64.46.24.32.51.03.6
Sum54.1131.9193.3133.976.532.6622.4
CLMean2.33.85.63.13.8
Sum47.5118.3173.392.4431.5
BLMean0.71.21.71.50.70.81.1
Sum14.636.752.245.120.625.3194.5
c SL is T. chinensis shrubland, MF is mixed forest of P. euphratica and T. chinensis, PF is sparse P. euphratica forest with associated T. chinensis shrubland, CL is cropland, and BL is barren-land.
Publisher’s Note: MDPI stays neutral with regard to jurisdictional claims in published maps and institutional affiliations.

