Article

HCH Removal in a Biochar-Amended Biofilter

1
Department of Applied Biology, Institute for Nanomaterials, Advanced Technologies and Innovation, Technical University of Liberec, Bendlova 7, 460 01 Liberec, Czech Republic
2
Faculty of Mechatronics, Informatics and Interdisciplinary Studies, Technical University of Liberec, 461 17 Liberec, Czech Republic
3
Institute of Genetics and Physiology SC MES RK, Al-Farabi 93, Almaty 050060, Kazakhstan
4
Department of Chemistry, Faculty of Science, Humanities and Education, Technical University of Liberec, Studentska 1402/2, 461 17 Liberec, Czech Republic
*
Author to whom correspondence should be addressed.
Water 2021, 13(23), 3396; https://doi.org/10.3390/w13233396
Submission received: 1 November 2021 / Revised: 26 November 2021 / Accepted: 29 November 2021 / Published: 1 December 2021

Abstract

:
This study evaluated the efficiency of two biofilter systems, with and without biochar chambers installed, at degrading and removing HCH and its isomers in natural drainage water. The biochar biofilter proved to be 96% efficient at cleaning HCH and its transformation products from drainage water, a significant improvement over classic biofilter that remove, on average, 68% of HCH. Although iron- and sulfur-oxidizing bacteria, such as Gallionella and Sulfuricurvum, were dominant in the biochar bed outflows, they were absent in sediments, which were rich in Simplicispira, Rhodoluna, Rhodoferax, and Flavobacterium. The presence of functional genes involved in the biodegradation of HCH isomers and their byproducts was confirmed in both systems. The high effectiveness of the biochar biofilter displayed in this study should further encourage the use of biochar in water treatment solutions, e.g., for temporary water purification installations during the construction of other long-term wastewater treatment technologies, or even as final solutions at contaminated sites.

1. Introduction

Hexachlorocyclohexane (HCH) isomers (especially lindane (γ-1, 2, 3, 4, 5, 6-hexachlorocyclohexane)) are highly persistent toxic compounds, and three of which are included on the Stockholm convention list [1]. Despite their known toxicity, HCH and its transformation products are virtually ubiquitous in the environment, with background concentrations at around ppb levels in a wide range of matrices [2,3,4,5,6]. In the 1960s and 1970s, when the toxicity of these substances became apparent, large amounts of waste HCH isomers were disposed of into unsecured subsurface dumps (see [7] for an inventory of HCH sites from 15 EU countries). Nevertheless, around 382,000 t of technical HCH, and 81,000 t of γ-HCH, were used for agricultural purposes in Europe between 1970 and 1996 [8].
A range of treatment technologies have been suggested for HCH-contaminated areas, and numerous studies focused on the chemical reduction and degradation of HCH isomers have been undertaken [9,10,11,12,13]. Over the last decade, however, increasing attention has been paid to the use of carbon-rich materials, such as charcoal, bio-coal, and activated carbon, for stabilizing organic pollutants in sediments and soils in situ [14,15,16]. Biochar, a charcoal produced from plant biomass, is an inexpensive and renewable adsorbent that has been used for a variety of applications, including soil conditioning and remediation, carbon sequestration, water treatment and the absorption of a variety of pollutants [17]. However, although biochar is rapidly gaining in popularity, only a limited number of studies have been published on the use of biochar for minimizing the bioavailability of pollutants, most of which have been laboratory based [18,19,20,21], and most concentrating on the factors affecting its ability to remove organic pollutants [22,23]. One exception was a recent study that sought to restore sediments contaminated by γ-HCH and hexachlorobenzene through amendment with carbon-rich materials, with the aim of sequestering the contaminants and rendering them biologically unavailable [24]. To date, however, nothing has been published on the use of biochar in constructed wetland systems for biodegradation and removal of pollutants, and particularly HCH isomers, at contaminated dumpsites. Theoretically, HCH accumulating in such biochar biofilters could undergo degradation by indigenous bacteria; however, to the best of our knowledge, nothing is known about the development of microbial consortia in biochar biofilter systems for HCH treatment. By comparison, detailed laboratory studies on aerobic [25] and anaerobic [26] microbial degradation of HCH isomers have been undertaken since the 1960s and a number of anaerobic bacteria capable of degrading HCH isomers have been identified, including Clostridium sphenoids, Clostridium butyricum, Clostridium pasteurianum, Citrobacter freundii, Desulfovibrio gigas, Desulfovibrio africanus, Desulfococcus multivorans, Dehalobacter sp., and Clostridium rectum [26], and strains of the Sphingomonadaceae family, capable of aerobic degradation of HCH, have been recorded as dominant at HCH dumpsites worldwide [27,28,29,30]. The primary reaction during HCH isomer (e.g., lindane) degradation is dehydrochlorination, and functional genes in the genus Sphingobium encoding the key enzymes have now been identified as HCH dehydrochlorinase (LinA), haloalkane dehalogenase (LinB, LinB-RT), and reductive dechlorinase (LinD), with Sphingomonas paucimobilis UT26 suggested as a possible lindane degradation pathway [31,32,33]. The dehydrochlorination reactions of γ-, α-, δ-, and β-HCH isomers catalyzed by LinA have also been described [34]. Most studies have recorded microbial biomass as increasing following biochar addition, with significant changes in microbial community composition and enzyme activity that may explain the biogeochemical effects of biochar. Nevertheless, very little is known about the mechanisms through which biochar affects microbial abundance and community composition. Changes in microbial community composition or activity induced by biochar may affect not only nutrient cycles and plant growth but also the cycling of soil organic matter [35,36,37].
The main objectives of this study, therefore, were (i) to evaluate and compare the efficiency of two horizontal flow constructed biofilter systems with and without biochar at HCH removal, and (ii) to elucidate the HCH biodegradation potential of biochar biofilters through detection of HCH transformation functional genes, DNA sequencing, and whole microbial community profiling.

2. Material and Methods

2.1. Biochar Characteristics

The biochar used in this study was produced by a commercial company (Biouhel, Zlin, Czech Republic) through pyrolysis of a mixture of waste agricultural biomass (one- to two-year plants) and digestate from a biogas plant, mixed at a ratio of 3:2. Pyrolysis was carried out for 50 min at a maximum temperature of 570 °C, producing a dry product (dry matter 99.9%) with a density of 0.59 kg L−1. Prior to installation of the biochar, laboratory tests were undertaken to determine sorption capacity for chlorobenzenes (ClB) at 100 mg g−1 and HCH at 4 mg g−1, and presence of polyaromatic hydrocarbons (PAH; none detected). Elemental composition, determined using a Vario EL cube analyzer (Elementar, Langenselbold, Germany), was N (0.3%), C (88.8%), H (0.8%), S (0.1%), and O (10%).

2.2. Site Description and Experimental Design

This study took place in the Hajek, Czech Republic (50°17′31.5″ N 12°53′35.2″ E). Since the 1960s, the site has been contaminated by a mixture of chemicals, primarily consisting of ballast isomers and ClB from HCH production, with long-term average concentrations in the outlet drainage channel reaching 100 µg L−1 sum of HCH, 700 µg L−1 sum of ClBs, and 28 µg L−1 sum of chlorophenols (ClPh). In August 2018, two parallel constructed biofilters (each 360 × 100 × 35 cm) were installed close to the waste sedimentation ponds in order to test potential water treatment measures against HCH contamination (Figure 1). One bed was filled with 750 kg of biochar (biochar biofilter), whereas the other was filled with a locally obtained soil/clay substrate with a shallow layer of natural water (control bed). Average temperatures at the site range from 17 to −3 °C and annual precipitation is around 849.3 mm (www.chmi.cz (accessed on 18 November 2020)).
Waste water from the industrial site was then allowed to trickle through the beds via gravitation, with water flow being assessed manually during sampling using stopwatches and calibrated vessels.

2.3. Sampling

Each month, water was sampled from each bed from inflow and outflow for chemical analysis using glass vials. In total, 20 water samples were obtained from each biofilter. Water (400 mL) was also sampled twice a year from the inflow and outflow of both beds for molecular biology analysis (i.e., amplicon 16S rRNA sequencing, qPCR; see below), while sediment samples for molecular biology analysis were taken from the control bed on 26 September 2018, and from the biochar test bed on 1 November 2019, with three samples taken in each case from different depths (i.e., upper inlet section—5 cm, middle section—15 cm, lower outlet section—30 cm). Water samples for molecular biology analysis were immediately filtered through a 0.2 µm membrane filter and later stored at −80 °C. All samples were transported to the laboratory in a cooled box.

2.4. Chemical Analysis

Concentrations of HCH isomers and their ClB and ClPh byproducts in water were determined using two GC-MS assemblies, in accordance with a previous study [13]. The first used an RSH/Trace 1310/TSQ 8000 GC-MS array (ThermoFisher Scientific, USA) with a Scion-5MS column for HCH, ClB and ClPh (Scion Instruments, Goes, The Netherlands), whereas the other was based on an CombiPal/CP3800/Saturn2200 GC-MS array (PAL, Zwingen, Switzerland; Varian, Palo Alto, USA) using a DB-624 column for benzene and monochlorobenzene determination (Agilent, Santa Clara, USA). In each case, limits of quantification (LOQ) were <0.005 µg/L for diClB, <0.015 µg/L for 1,2,4,5+1,2,3,5-tetraClB and pentaClB, <0.01 µg/L for 1,2,3,4-tetraClB, <0.25 µg/L for hexaClB, <0.025 µg/L for chlorophenols, and <0.01 µg/L for HCH. Samples were extracted using the headspace SPME technique, either using a PDMS/DVB fiber with a coating thickness of 100 µm (Supelco, Bellefonte, USA) or by directly injecting the sample in static headspace mode. Prior to extraction, samples were derivatized so that acetylated chlorophenols were formed (following EN 12673). Isotopically labeled compounds (γ-HCH D6, pentachlorophenol 13C6) were used as internal GC-MS/MS analysis standards.

2.5. Molecular Biology Analysis

DNA extraction was undertaken on all samples in duplicate using the DNeasy power Soil KIT (Qiagen, Netherlands). DNA yield and quality were then assessed using a Qubit fluorometer (Thermo Fisher Scientific, Waltham, MA, SUSA) and agarose gel electrophoresis.

2.5.1. Real-Time Quantitative PCR

DNA from was assessed for all samples using the primers LinA-F (5′AGCTCAACGGATGCATGAACT3′), LinA-R (5′ GGCGGTGCGAAATGAATG3′), LinB-F (5′ACCACGGGCCGAATGC3′), LinB-R (5′ACCGTGATTTCGGTCTGGTTT3′), LinB-RT-F (5′GCGATCCGATCCTCTTCCA3′) and LinB-RT-R (5′GCATGATATTGCGCCACAGA3′), LinD-F (5′GAACTGTTCCACTTCGTGTTCTCA3′), and LinD-R (5′GGTCACGCCCTTCTCCATTA3′) [26,38,39]. Total bacterial biomass was assessed by amplification of the 16S rDNA gene using the primers U16SRT-F (5′ACTCCTACGGGAGGCAGCAGT3′) and U16SRT-R (5′TATTACCGCGGCTGCTGGC3′) [40]. All qPCR reactions were run in the LightCycler 480 Real-Time PCR System (Roche, Basel, Switzerland) using white 96-well plates to increase sensitivity. Triplicate reactions of 20 µL consisted of 1 × SYBR Green I Master (Roche, Basel, Switzerland), 0.5 mM of both primers, and 2 mL of the template (0.4–16 ng). The program consisted of preincubation at 95 °C for 5 min, a melting cycle of 95 °C for 10 s, annealing for 15 s, elongation at 72 °C for 20 s, melting to 97 °C. Optimized annealing temperatures were 55 °C and 60 °C with a cycle number of 45. The data were displayed in the form of a heatmap of Ct values, the values of a particular primer being first divided into two sets comprised of values < 36 (low values) and ≥36, the latter being included in the detection boundary group. The second set, values < 36, was divided into three equally wide intervals, and gradually from the lowest values, the intervals were grouped into: high quantity, medium quantity, and small quantity. Ct values equal to 40 were considered below the LOQ. Individual groups (intervals) are presented in heat maps in appropriate colors [41].

2.5.2. Amplicon 16S rRNA Sequencing

The V4 region of the bacterial 16S rDNA gene was amplified using the primers 530F (5′TGCCAGCMGCNGCGG3′) and 802R (5′TACNVGGGTATCTAATCC3′) in a final volume of 50 µL [42,43]. The initial PCR program consisted of preincubation at 95 °C for 3 min, 15 cycles of melting at 98 °C for 20 s, annealing at 50 °C for 15 s, elongation at 72 °C for 45 s, and a final elongation at 72 °C for 1 min. PCR conditions for the second reaction consisted of preincubation at 95 °C for 3 min, 35 cycles of melting at 98 °C for 20 s, annealing at 50 °C for 15 s, elongation at 72 °C for 45 s, and a final elongation at 72 °C for 1 min. The amplicons were cleaned up using the Agencourt Ampure XP system (Beckman Coulter, Brea, USA). Barcoded sequencing adapters were ligated to the PCR products using the Ion Xpress Plus gDNA fragment library kit with Ion Xpress barcode adapters (Thermo Fisher Scientific, Waltham, MA, USA). Sequencing was performed using an Ion PGM Hi-Q Sequencing Kit with an Ion 314 Chip (Thermo Fisher Scientific, Waltham, MA, USA). Raw reads were then split into samples using Mothur software [44] and subsequently processed by the DADA2 software package, following the suggested pipeline for single-end reads [45]. Preprocessing of reads included removal of low-quality and short reads and chimeric sequences, based on taxonomy classification by DADA2 against the SILVA database v.132 (www.arb-silva.de (accessed on 20 September 2020)). Classification accuracy was evaluated against an artificial MOCK community sample created from four different species. OTU relative frequency was visualized on a heatmap showing only those OTUs with a frequency of relative abundance >5% at the genus and family level. Correlations between taxa and environmental data or 16S rRNA results were calculated using the microbiome Seq R library [46,47] and visualized as a bar chart with p-values calculated using Pearson’s correlation coefficient).

2.6. Statistical Analysis

Significant differences in pollutant concentrations in water, sediment, and biochar samples at the inlet, mid-point, and outlet of each bed were assessed using multivariate analysis of variance (MANOVA) based on the pairwise-adonis implementation with Bonferroni p-value correction in the R vegan package [48]. Correlations between values for chemical analysis and the most abundant taxa were identified using Spearman’s correlation, and correlations between taxa and environmental data or 16S rRNA results were calculated using the microbiome Seq R library [46,47], and visualized as a bar chart with p-values calculated using Pearson’s correlation coefficient. In all cases, a significant difference was assumed at p < 0.05, p < 0.01, and p < 0.001.

3. Results and Discussion

3.1. General Characteristics of Inflow Water

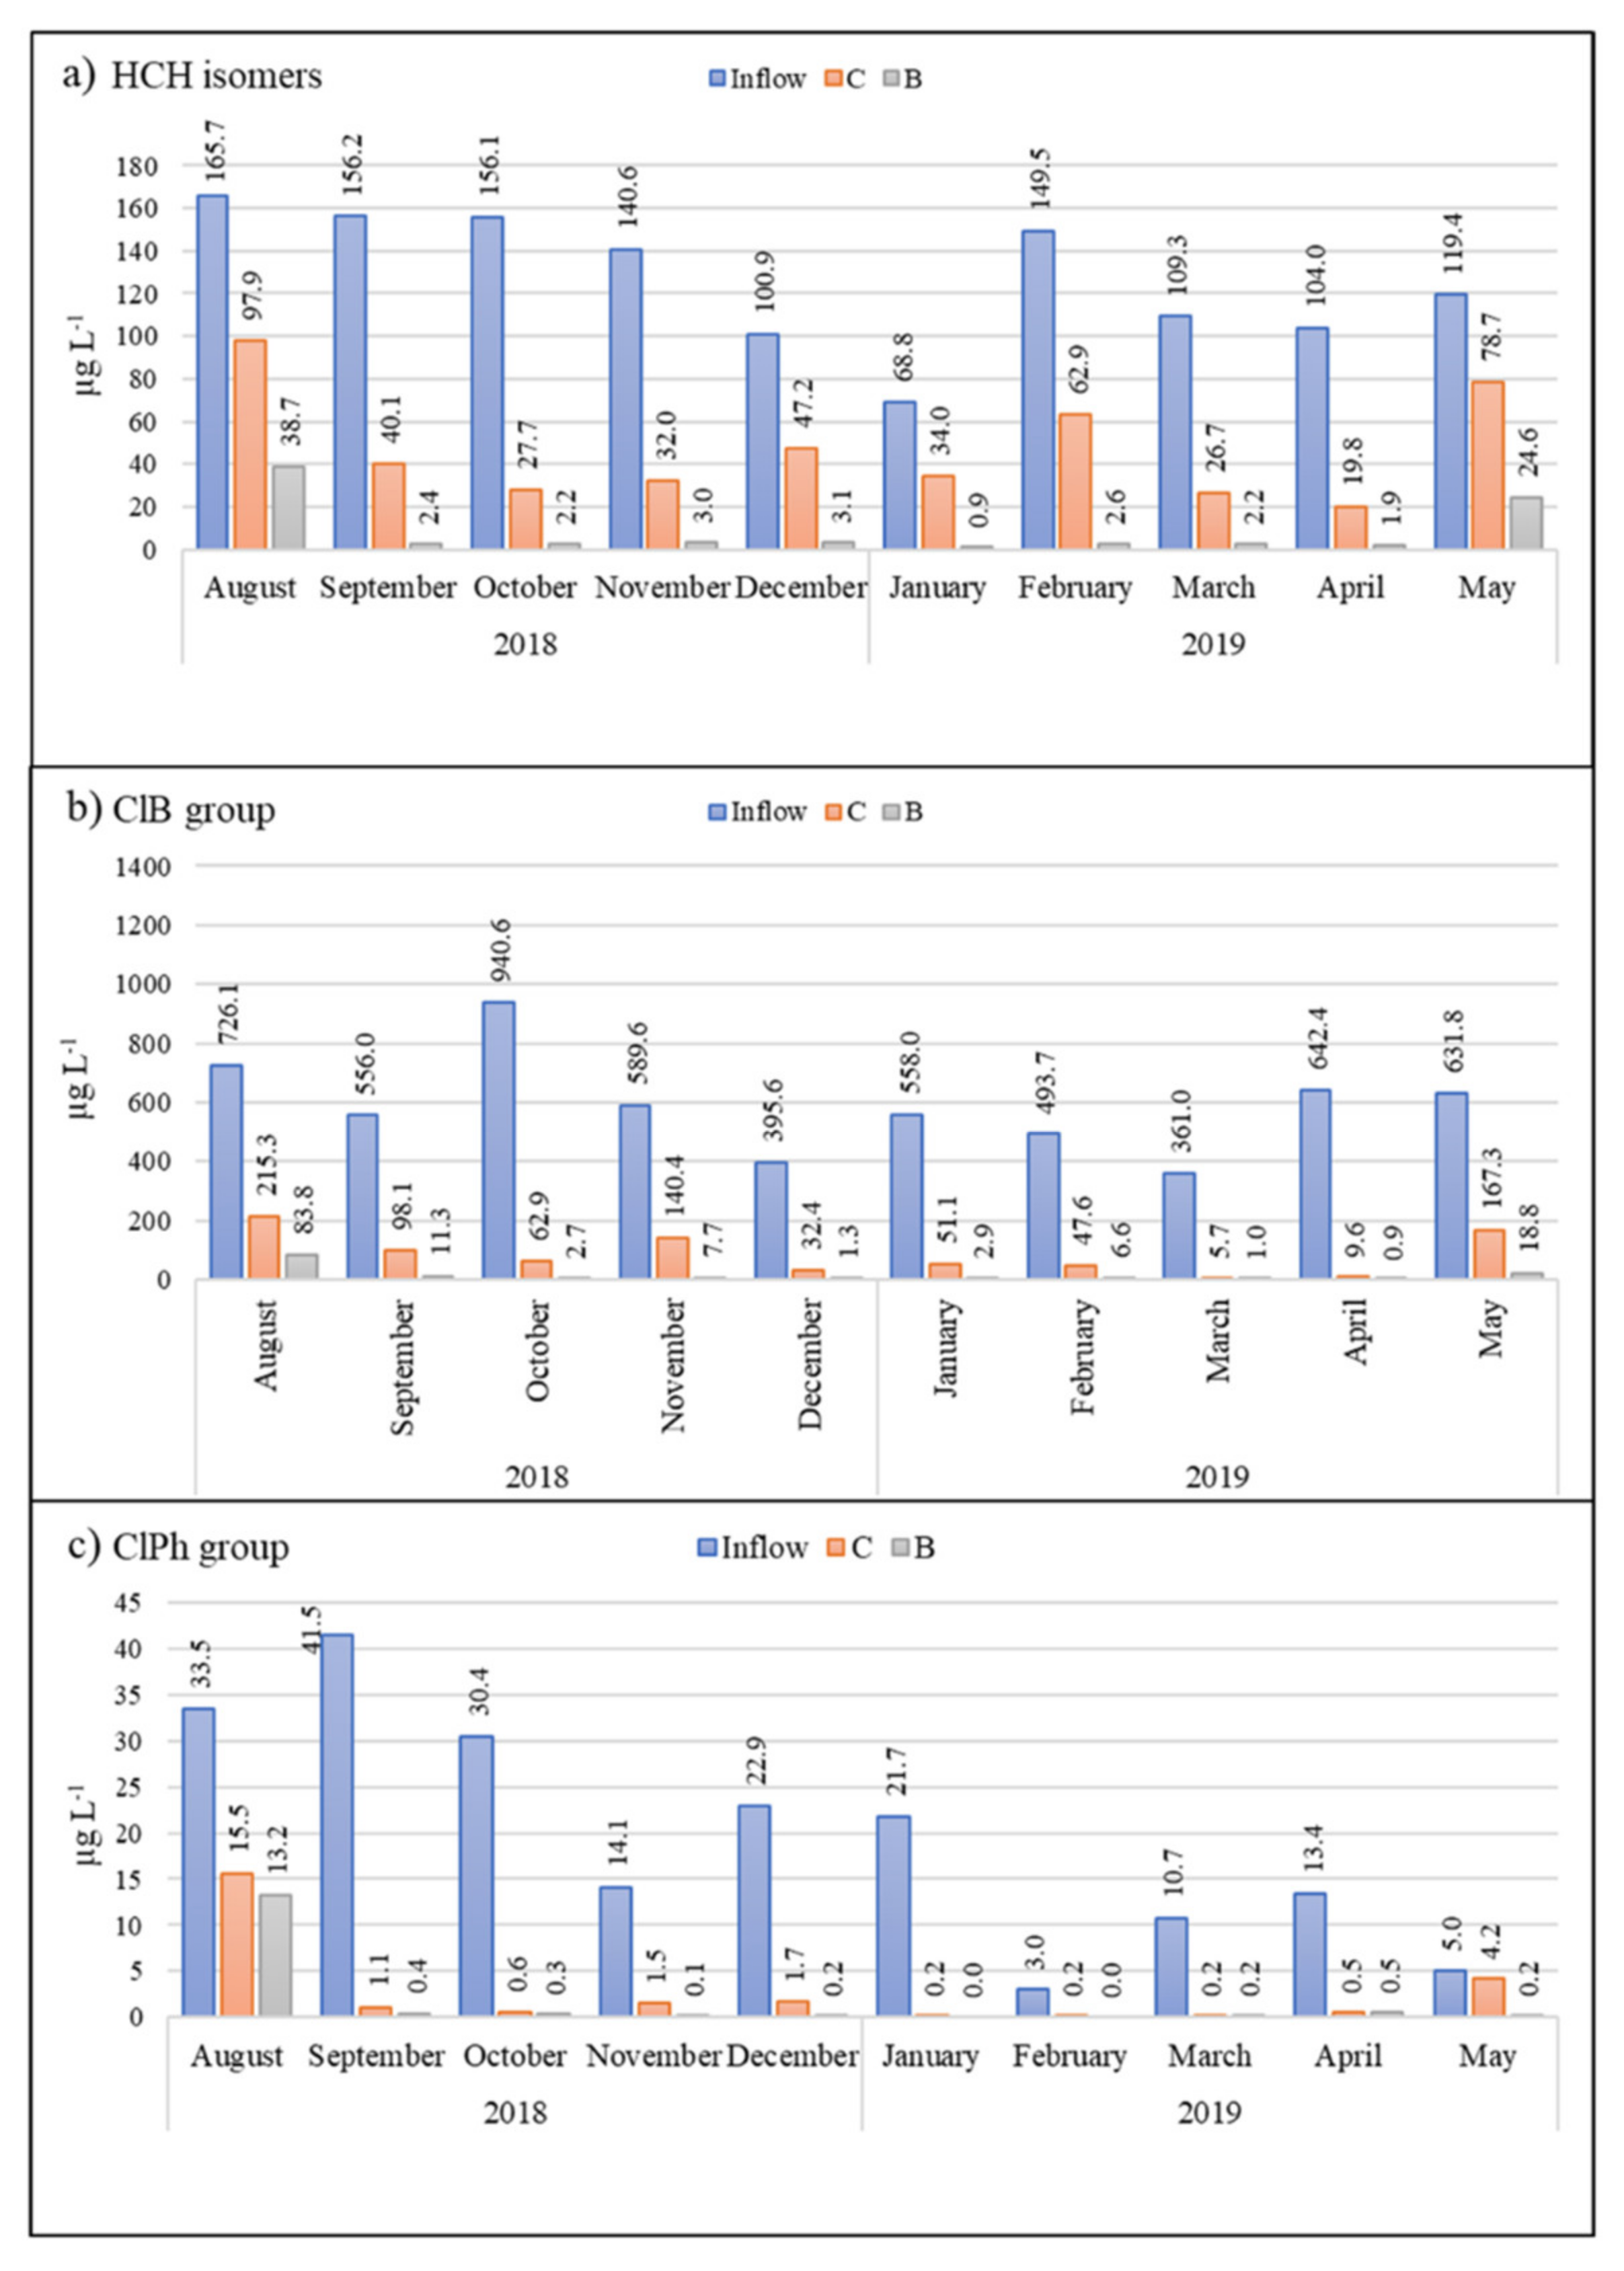
The inflow drainage water had a long-term average pH value of 7.3, with a high conductivity (1350 µS cm−1), high sulfate concentration (650 mg L−1), high total Fe concentration (20 mg L−1), and low F, NO2−, and NO3− concentrations (below LOD). Average concentrations of HCH, ClB, and ClPh in inflow water were 635.5, 13, and 115.5 µg L−1, respectively (Figure 2).

3.2. Pollutant Removal Efficiency

After passing through the biochar test bed, 90% of the HCH and other target pollutants had been removed from the drainage water (Figure 2). This already high efficiency was further increased to 96% after the initial high flow rate (15 L min−1) had decreased to 5 L min−1. In comparison, the classically constructed control biofilter with the clay/soil substrate removed around 80% of the HCH (Figure 2).
During analysis, the chemical compounds in outlet water samples of both biofilters were divided into three main groups, i.e., ClB, ClPh, and HCH. Approximately 98% of the total concentration of the ClB group comprised 1.4-diClB > chlorobenzene > 1.3-diClB > 1.2.4-triClB > 1.2-diClB > 1.3.5-triClB, with benzene, 1.2.3-triClB, 1.2.4.5+1.2.3.5-tetraClB, 1.2.3.4-tetraClB, penta-ClB, and hexa-ClB found at <1% of total concentration. In the ClPh group, approximately 89% of total concentration was represented by 4-ClPh > 2-ClPh; 2.4+2.5-diClPh > 3-ClPh > 3.5-diClPh. Finally, the average percentage content of each HCH isomer in the HCH group was δ-HCH (76.1%), ε-HCH (10%), α-HCH (6.7%), γ-HCH (5.1%), and β-HCH (2.1%).
Although we recorded no significant difference (p > 0.05) in outlet water ClB and ClPh concentrations between the control and biochar biofilters, there was a significant difference in HCH concentration (p < 0.01), with an average difference in removal efficiency of 45.3% between the control and biochar beds (see Figure 2), clearly indicating biochar’s greater ability to remove HCH.
In both the control bed and biochar bed, the degradation of pollutants is most likely to have been the result of microbial degradation, with biochar clearly being the more successful of the two methods. Previous studies have shown that the organic pollutant removal efficiency (sorption rate) depends a great deal on its origin (harvest waste, wood, rice husk, sugar industry wastes, etc.), in addition to its surface area, porosity, hydrophobicity, polarity, and pyrolysis temperature [22,23]. It has been shown, for example, that biochars obtained at temperatures > 500 °C become less polar and more aromatic than those obtained at 300 °C due to the loss of O- and H-containing functional groups [23]. Because the biochar used in this study was prepared at 570 °C, this would suggest that it had a lower polarity surface and was more aromatic, resulting in decreased sorption.

3.2.1. HCH Isomers

In the first month of the experiment, the total concentration of HCH in the biochar biofilter decreased by 76.6%, compared with 40.9%in the control (Figure 2). In both biofilters, a minor decrease was observed in β-HCH and ε-HCH for ten months. These two isomers are most hydrophobic of all the HCH isomers analyzed (log Kow 3.85 and 4.14, respectively), possibly explaining their low removal rate; however, their degradation rate may also have played a role. A previous study described the HCH isomer degradation rate as γ-HCH > α-HCH > δ-HCH > β-HCH [49], which partly confirms our own data. However, these authors did not analyze ε-HCH degradation times; hence, we would suggest an augmented sequence of γ-HCH > α-HCH > δ-HCH > β-HCH > ε-HCH. Removal of β-HCH and ε-HCH in the biochar bed reached 91.8% by the fourth month, and continued to increase as time went on, whereas removal of the same two isomers in the control bed was the lowest than all other isomers, reaching just 60.9% and 20.1%, respectively, after ten months. Thus, the decrease in these compounds repeated the tendency of ClB.
Interestingly, the decline in total HCH concentration in the control bed showed a non-linear trend, with percentage removal increasing from 40.9% to 82.2% over the first three months, then decreasing from 82.2% to 50.6% over the next four months, then increasing again from 50.6% to 81% over the next four months (Figure 2). This wave-like dynamic appeared to be dependent on monthly temperature differences, with temperatures ranging from 24.0 to 13.0 °C in the first quarter of the experiment, from 6.0 to 0.7 °C over the second quarter, and from −1.5 to 5.5 °C over the third quarter. In comparison, the concentration of α-HCH decreased by more than 99.7% in the biochar bed over the first ten months (except August), β-HCH by 88.5%, and γ-HCH by 98.4%, or they were not detected at all (α-HCH in 6 months, β-HCH and γ-HCH in 5 months).

3.2.2. Chlorobenzenes

In the ClB group, the following dynamics was observed: starting from August the efficiency was by 99.5% and 96.6% in control and biochar biofilter, respectively. Moreover, ClB was not detectable in all outflow water samples during the following ten months. The explanation of this pattern could be that chlorobenzene is less hydrophobic (log Kow 2.84) and volatile within the ClB group. During the following months the most significant decrease in concentrations in all biofilters was for 1.2-diClB (log Kow 3.43) and 1.2.4-triClB (log Kow 4.02), whereas a minor decrease was detected for 1.3-diClB (log Kow is 3.53) and 1.3.5-triClB (log Kow 4.19). Adsorption of organic compounds by biochar depends not only on the level of hydrophobicity but also on their polarity. Furthermore, there are two different mechanisms for the adsorption of two different types of compounds (polar and hydrophobic). Although the biochar applied to the restoration of the aquatic system was produced at 570 °C and became less polar and more aromatic, polar chemical compounds such as 1.2-diClB (0.91) [50] and 1.2.4-triClB (0.98) [51] were better adsorbed by biochar. At the same time, the adsorption and removal of the less polar compounds such as 1.3-diClB (0.85) [52] and 1.3.5-triClB (0.7) [53] were relatively smaller. The first month of the experiment (21 August 2018) showed a decrease in the total concentration of ClB in the control biofilter by 70.4%, and in B by 88.5% (Figure 2). Pairwise comparison evidenced the difference between two biofilters, and the p-value was <0.001. Unlike the biochar biofilter, the decrease in ClB in the control biofilter exceeded 90% only after four months (December 2018), and at the end of the experiment was 98.5%. This peculiarity can be explained by the drop in average monthly temperature from 24.0 to 3.8 °C and decreasing outflow rate (from 6.2 to 2.3 L min−1). By comparison, in the biochar biofilter, the decrease was more than 96% by the second month and at the end of the experiment almost reached 100% (99.9%).
Throughout the experiment, the behavior of 1.3.5-triClB in the control biofilter was interesting and might be explained by the fact that this compound is the most hydrophobic within the group (log Kow is 4.19):
The decrease in 1.3.5-triClB concentration remained the smallest during the whole period. Thus, it reduced the decrease percentage of the total concentration of ClB;
  • From August to November, the decrease was oscillatory (58.2%, 28%, 57.4%, and 41%, respectively);
  • From December (8.3%), its removal consistently increased and in April reached 84.4%.
Therefore, soil and clay substrate are not suitable for natural attenuation of high concentrations of 1.3.5-triClB. The biochar biofilter showed better efficiency 98.2% throughout the ten-month experiment.

3.2.3. Chlorophenols

Five dominant compounds (2-ClPh, 3-ClPh, and 2.4+2.5-ClPh) represent the group of detected ClPh. Total concentration of ClPh in control biofilter decreased within the first month by 53.9% and by 60.8% in biochar wetland (Figure 2). During the following ten months, the decrease in ClPh total concentration was not lower than 89.7% in the control and 96.4% in the biochar wetland. The smallest decrease was observed for 4-ClPh, which was the only detected ClPh from September in biochar wetland, with the exception in January and February—in these months, it was not detected at all. This tendency can be also explained by the polarity/polarizability level (π) and volatility of the compounds: 4-ClPh is a less polar contaminant within the group (0.72), whereas the π values of 2-ClPh, 3-ClPh, and 2.4+2.5-ClPh are 0.82, 0.77, and 0.87, respectively [54,55].

3.3. Microbial Community Structure and Function

The microbial community was analyzed in samples from inflow, control, and biochar biofilters in September 2018 and November 2019. Sediments for molecular biology analyses were taken from both biofilters.
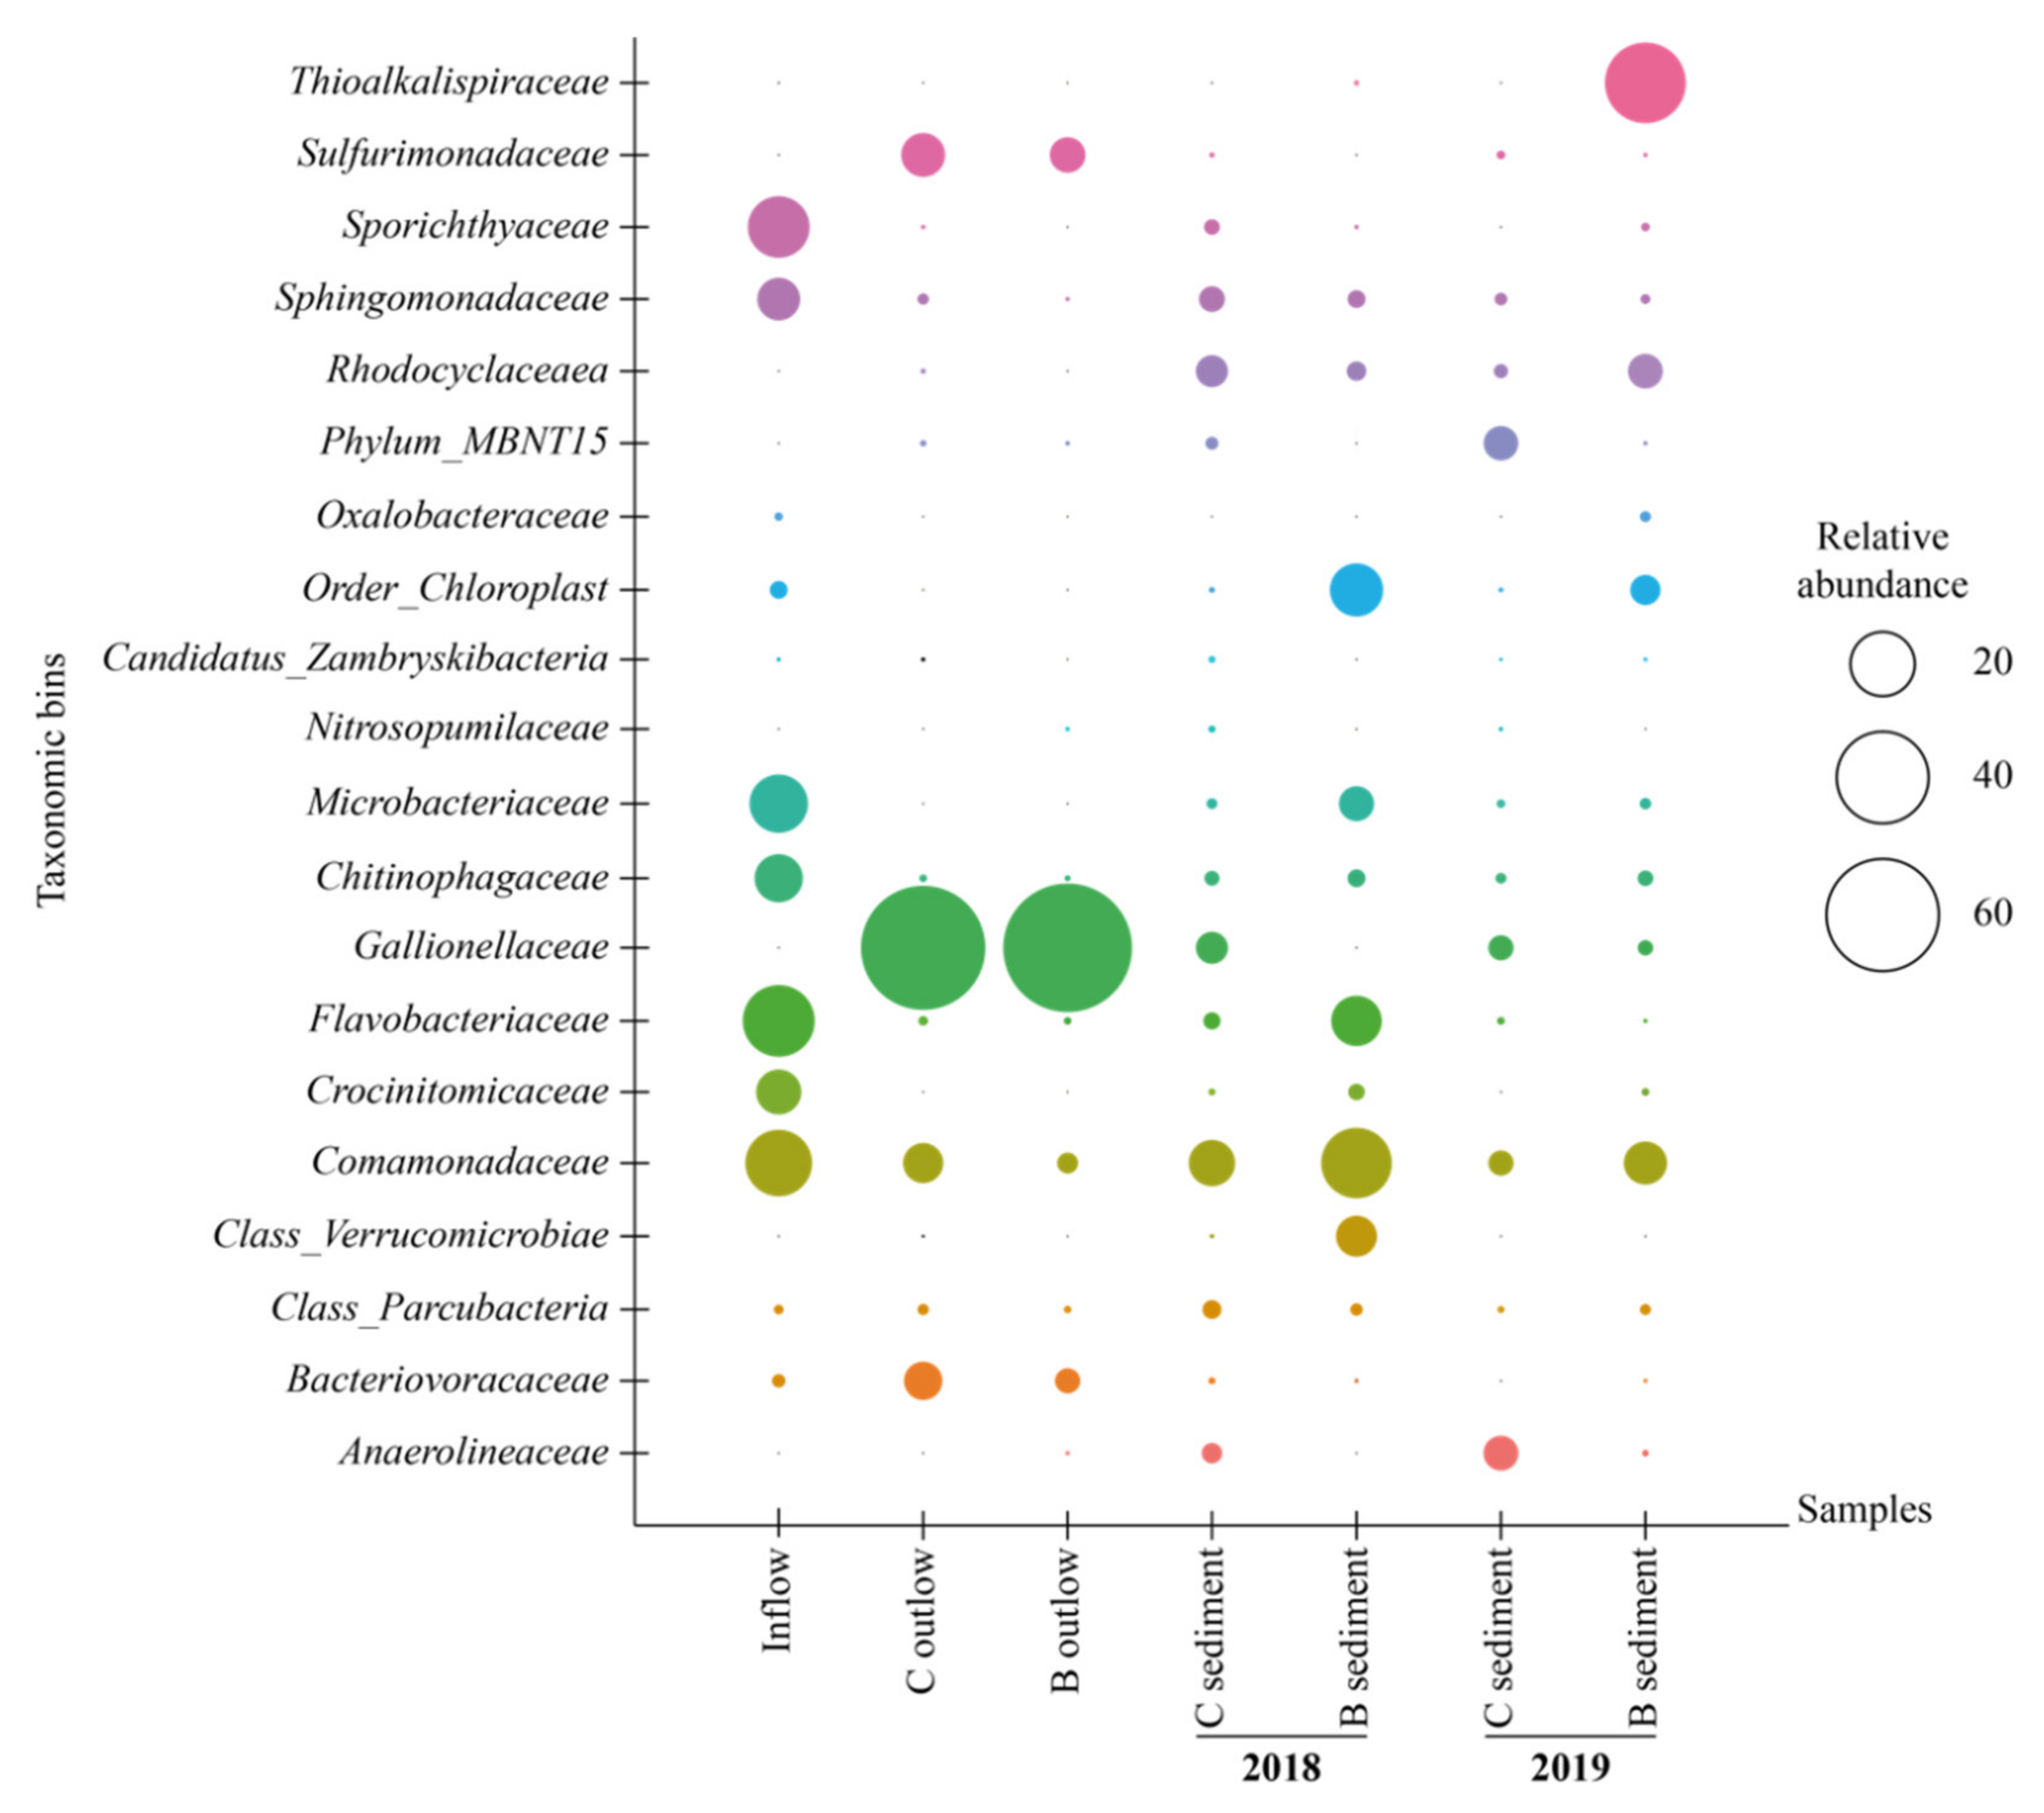
The relative representation of microorganisms at the family level is shown in Figure 3.
The dominant families in inflow water were Flavobacteriaceae, together with Sporithyaceae and Comamonadaceae. The population of Flavobacterium reached 26.1% of the total biomass in the inflow, whereas in outflow water from the control biofilter its percentage decreased to 0.3% (Figure S1) and from the biochar biofilter it was as low as 0.1% (Figure S2). Flavobacterium may be well adapted to higher HCH concentrations due to its possible ability to degrade high concentrations of tech-HCH (25 mg kg−1) in a microbial consortium containing Pseudomonas spp., Burkholderia, and Vibrio [56].
The Gallionellaceae family dominated water outflow samples of control and biochar biofilters (71.2% and 84.6%, respectively) in September 2018, most probably due to the high level of Fe2+ in the inflow water. Gallionella, Geobacter, and Sulfuricurvum appeared only in outflows due to a decrease in the pollutant’s total concentration (Figures S1 and S2). The genus Gallionella is characterized by its chemolithotrophic growth with ferrous iron as a donor of electrons. Chemical dichloroelimination of γ-HCH is relatively pH insensitive and can be mediated by iron sulfides (FeS) and activated carbon to generate di- and trichlorobenzene isomers as end products. Liu et al. [57] reported that the reducing agent FeS enhanced dichloroelimination of γHCH at a concentration of 10 g L−1.
The abundance of microorganisms in the control biofilter was very diverse in sediment and water samples (September 2018). In the sediment sample, aryl-halorespiring facultative anaerobic myxobacterium—Anaeromyxobacter was detected, whereas in the water the dominant genus was Sideroxydans, which is able to oxidize Fe2+ [58].
The abundance of the microbial community changed dramatically after one year. The presence of Galionella increased from 0.9% to 5% in sediment samples in the control biofilter (Figure S3). For the biochar biofilter, Gallionella was not detected in sediment samples in 2018, whereas in 2019, it increased to 1.2%. The abundance of the remaining microbial populations was different between the years. Sediment of the biochar biofilter hosted more Rhodocyclaceae (7.1%) than that of the control biofilter (1.5%). Dadwhal et al. [59] isolated Rhodocyclaceae from HCH-contaminated soil and suggested that members of this family may be involved in the removal of HCH.
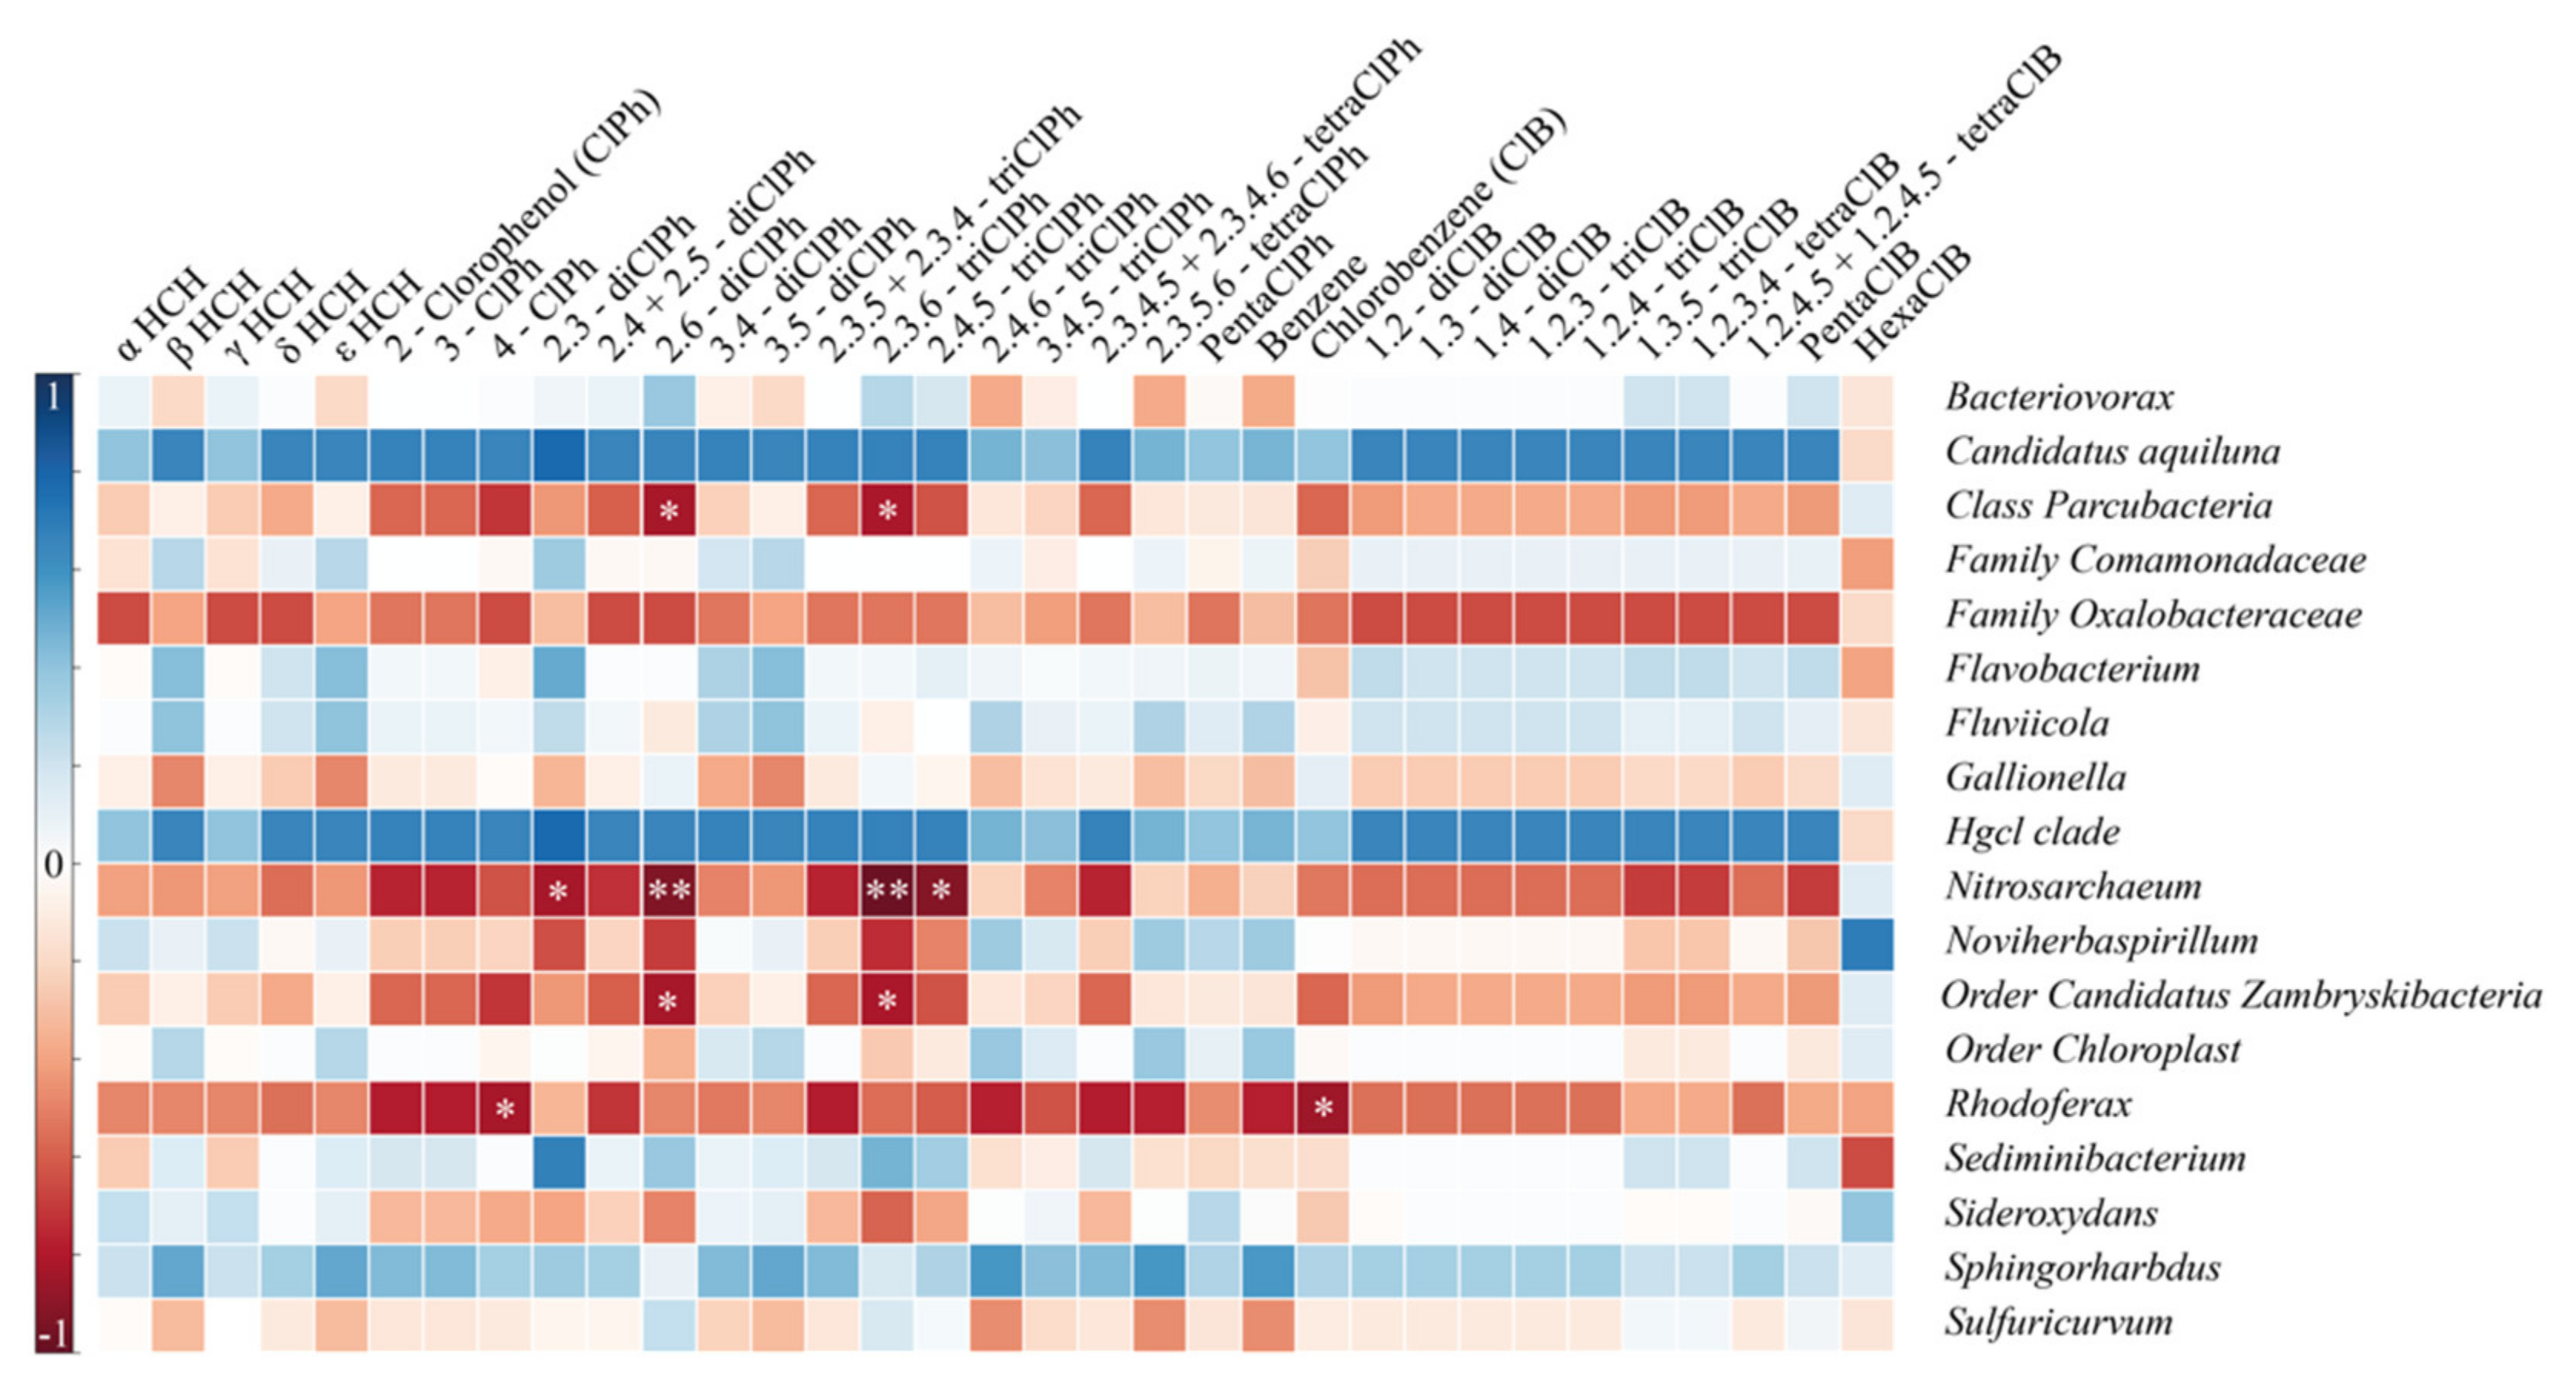
Spearman correlation analysis demonstrated a negative correlation between several families and chemical compounds (Figure 4). Parcubacteria and ZhambryskiiBacteria families negatively correlated with 2.6-diClPh and 2.3.6-triClPh (p < 0.05), i.e., while these two compounds’ concentrations increase, the abundance of Parcubacteria and ZhambryskiiBacteria families decreases. Nitrosarchaeum had a stronger negative correlation with the above compounds (p < 0.05), whereas its correlation with 2.3-diClPh and 2.4.5-triClPh was significant but weaker (p < 0.05). The Rhodoferax family was negatively correlated with ClB and 4-ClPh (p < 0.05). Thus, all detected correlations were negative and three of five families correlated with the 2.6-diClPh and 2.3.6-triClPh. Interestingly, three bacterial groups positively (although not significantly) correlated with all targeted pollutants. Candidatus Aquiluna (Microbacteriaceae) has been reported from a wide range of aquatic habitats from freshwaters to hypersaline waters [60]. Hgcl clade (Actinobacteria), was associated with soil and eutrophic waters and is able to use organic compounds for their metabolism and, most importantly, Sphingorhabdus is able to metabolize HCH.

3.4. Functional Genes Involved in HCH Biodegradation

The functional genes linA, linB, linB-RT, and linD encoding enzymes involved in aerobic and anaerobic γ-HCH biodegradation were detected in all sediment samples except those taken from the freshly installed biochar biofilter in 2018 (Table 1), suggesting that the microbial community was still not well developed one month after installation. In comparison, the highest levels of U16SRT, linA, LinB-RT, and LinD genes were detected in sediment from the control bed in 2018. However, it was the opposite in samples from the same biofilter in 2019, except for the U16SRT gene. There is clear experimental evidence that LinA dehydrochlorizes γ-, α- and δ-HCH, whereas LinB hydrolytically dechlorines β- and δ-HCH in all strains studied [25]. Within HCH isomers, the γ-HCH (lindane) displaying the fastest degradation rate.
The linB gene was detected in large quantities in all samples except in early biochar samples from 2018. The largest quantity of this gene was in sediment samples from biochar biofilter in 2019. The largest quantity of the linB-RT gene was found in sediment samples from the control biofilter in 2018 and sediment from biochar biofilter in 2019. In 2018, linD genes were most abundant in sediment samples taken from the control biofilter, but in 2019 the quantity was decreased, unlike in biochar biofilter, for which its quantity was greatest.
linD encoding reductive dechlorinase was first isolated from Sphingobium japonica UT26 [61]. Dehalogenation of HCH isomers and byproducts is also a significant reaction. LinB and linB-RT encode haloalkane dehalogenase and catalyzes the HCH hydrolytic dechlorination of 1.4-TCDN to 2.5-DDOL [62].
Overall, in 2019, lin genes were found in all samples, and the maximum quantity was found in samples taken from the biochar biofilter in 2019. Therefore, the removal of HCH isomers and their byproducts was not driven by sorption on biochar, but by biodegradation.

4. Conclusions

In this study, we compared the efficiency of removal of HCH and related compounds using biochar and control biofilters at a historically polluted site. Compared to ClPh and ClB compounds, HCH isomers are more persistent. Most of the ClPh and ClB compounds are volatile; therefore, the high rate of removal of these compounds was expected in both biofilters. The biochar biofilter was more efficient (98.2%) in the removal of HCH than the control wetland (81.0%), whereas higher efficiency was reached at a lower inflow water rate.
Interestingly, the chemical analysis of biochar showed the absence of any adsorbed HCH-related compounds. It can be therefore assumed that there were microorganisms able to degrade HCH, ClB, and ClPh. Analysis of sediment samples taken at the end of the study confirmed the presence of functional genes and bacterial genera capable of degrading HCH isomers and their byproducts. Most were detected in the lower part of the biochar biofilter and the control biofilter. In the control biofilter, the abundance of functional genes encoding key enzymes involved in the degradation of HCH isomers and their byproducts under aerobic conditions was significantly reduced after a year.
The main advantage of a biochar biofilter is its simplicity, effectiveness, and speed of installation in the field. To increase the efficiency of pesticide removal, combining biochar biofilter systems and phytoremediation processes would also be an economically interesting approach. However, further research into the usage of biochar beds, for example, as an additional installation for water purification during the construction of other wastewater treatment technologies as final solutions at contaminated sites, is thus required to better explore and attainment their potential.

Supplementary Materials

The following are available online at https://www.mdpi.com/article/10.3390/w13233396/s1: Figure S1. Relative representation of microorganisms at the family level (abundance > 5%) in the control biofilter inflow, outflow, and sediment samples on 26 September 2018; Figure S2. Relative representation of microorganisms at the family level (abundance > 5%) in the biochar bed inflow, outflow, and sediment samples on 26 September 2018; Figure S3. Relative representation of microorganisms at the family level (abundance > 2%) in control biofilter and biochar biofilter sediment samples on 1 November 2019; Table S1. Concentration of HCH isomers during experiment (LOQ < 0.01 µg L−1); Table S2. Concentration of Chlorobenzenes (ClBs) during experiment; Table S3. Concentration of Chlorophenols (ClPhs) during experiment.

Author Contributions

Conceptualization: A.A. and A.S.; data curation: R.S.; investigation: A.A. and A.M.; methodology: A.A. and P.H.; resources: P.H.; supervision: P.H.; validation: A.S.; visualization: R.S. and A.M.; writing—original draft: A.A. and A.M.; writing—review and editing: A.S. and A.M. All authors have read and agreed to the published version of the manuscript.

Funding

This work was supported by Research Infrastructure NanoEnviCz (Project No. LM2018124), supported by the Ministry of Education, Youth and Sports of the Czech Republic, and Investment Funds under the framework of Operational Programme Research, Development and Education—Project: Hybrid Materials for Hierarchical Structures “HyHi” (CZ.02.1.01/0.0/0.0/16_019/0000843).

Institutional Review Board Statement

Not applicable.

Informed Consent Statement

Not applicable.

Data Availability Statement

The data presented in this study are available under conditions on request from the corresponding author (P.H.).

Acknowledgments

The authors are thankful to Asel Kanatkaliyeva of the T.K. Zhurgenov Kazakh National Academy of Arts, Kazakhstan, for preparation of the schematic diagrams.

Conflicts of Interest

The authors declare no conflict of interest. The funders played no role in the design of the study; in the collection, analysis, or interpretation of data; in the writing of the manuscript, or in the decision to publish the results.

References

  1. Stockholm Convention—An Overview ScienceDirect Topics. Available online: https://www.sciencedirect.com/topics/earth-and-planetary-sciences/stockholm-convention (accessed on 21 June 2021).
  2. Bajpai, A.; Shukla, P.; Dixit, B.S.; Banerji, R. Concentrations of organochlorine insecticides in edible oils from different regions of India. Chemosphere 2007, 67, 1403–1407. [Google Scholar] [CrossRef] [PubMed]
  3. Chakraborty, P.; Zhang, G.; Li, J.; Sampathkumar, P.; Balasubramanian, T.; Kathiresan, K.; Shin Takahashi, S.; Subramanian, A.; Tanabe, S.; Jones, C.K. Seasonal variation of atmospheric organochlorine pesticides and polybrominated diphenyl ethers in Parangipettai, Tamil Nadu, India: Implication for atmospheric transport. Sci. Total Environ. 2019, 649, 1653–1660. [Google Scholar] [CrossRef] [PubMed] [Green Version]
  4. Erkmen, B.; Kolankaya, D. Determination of organochlorine pesticide residues in water, sediment, and fish samples from the Meriç Delta, Turkey. Int. J. Environ. Anal. Chem. 2006, 86, 161–169. [Google Scholar] [CrossRef]
  5. Rigét, F.; Bignert, A.; Braune, B.; Dam, M.; Dietz, R.; Evans, M.; Green, N.; Gunnlaugsdottir, H.; Hoydal, K.S.; Kucklick, J.; et al. Temporal trends of persistent organic pollutants in Arctic marine and freshwater biota. Sci. Total Environ. 2019, 649, 99–110. [Google Scholar] [CrossRef]
  6. Zhao, G.; Xu, Y.; Li, W.; Han, G.; Ling, B. PCBs and OCPs in human milk and selected foods from Luqiao and Pingqiao in Zhejiang, China. Sci. Total Environ. 2007, 378, 281–292. [Google Scholar] [CrossRef] [PubMed]
  7. ERA-Consult Madrid, Directorate-General for Internal Policies of the Union (European Parliament), M. Vega, D. Romano, and E. Uotila. Lindane (Persistant Organic Pollutant) in the EU. 30 January 2017. Available online: http://op.europa.eu/en/publication-detail/-/publication/8e37ab69-bd13-11e6-a237-01aa75ed71a1 (accessed on 24 May 2021).
  8. Breivik, K.; Pacyna, J.M.; Münch, J. Use of α-, β- and γ-hexachlorocyclohexane in Europe, 1970–1996. Sci. Total Environ. 1999, 239, 151–163. [Google Scholar] [CrossRef]
  9. Dominguez, C.M.; Parchão, J.; Rodriguez, S.; Lorenzo, D.; Romero, A.; Santos, A. Kinetics of Lindane Dechlorination by Zerovalent Iron Microparticles: Effect of Different Salts and Stability Study. Ind. Eng. Chem. Res. 2016, 55, 12776–12785. [Google Scholar] [CrossRef]
  10. Homolková, M.; Hrabák, P.; Kolář, M.; Černík, M. Degradability of hexachlorocyclohexanes in water using ferrate (VI). Water Sci. Technol. 2015, 71, 405–411. [Google Scholar] [CrossRef] [PubMed]
  11. Joo, S.H.; Zhao, D. Destruction of lindane and atrazine using stabilized iron nanoparticles under aerobic and anaerobic conditions: Effects of catalyst and stabilizer. Chemosphere 2008, 70, 418–425. [Google Scholar] [CrossRef]
  12. Merz, J.P.; Gamoke, B.C.; Foley, M.P.; Raghavachari, K.; Peters, D.G. Electrochemical reduction of (1R,2r,3S,4R,5r,6S)-hexachlorocyclohexane (Lindane) at carbon cathodes in dimethylformamide. J. Electroanal. Chem. 2011, 660, 121–126. [Google Scholar] [CrossRef]
  13. Wacławek, S.; Silvestri, D.; Hrabák, P.; Padil, V.V.; Torres-Mendieta, R.; Wacławek, M.; Černík, M.; Dionysiou, D. Chemical oxidation and reduction of hexachlorocyclohexanes: A review. Water Res. 2019, 162, 302–319. [Google Scholar] [CrossRef] [PubMed]
  14. Beesley, L.; Moreno-Jiménez, E.; Gomez-Eyles, J.L.; Harris, E.; Robinson, B.; Sizmur, T. A review of biochars’ potential role in the remediation, revegetation and restoration of contaminated soils. Environ. Pollut. 2011, 159, 3269–3282. [Google Scholar] [CrossRef] [PubMed]
  15. Denyes, M.J.; Langlois, V.S.; Rutter, A.; Zeeb, B.A. The use of biochar to reduce soil PCB bioavailability to Cucurbita pepo and Eisenia fetida. Sci. Total Environ. 2012, 437, 76–82. [Google Scholar] [CrossRef] [PubMed]
  16. Paul, A.; Ghosh, C.; Boettinger, W.J. Diffusion Parameters and Growth Mechanism of Phases in the Cu-Sn System. Metall. Mater. Trans. A 2011, 42, 952–963. [Google Scholar] [CrossRef]
  17. Mohan, D.; Sarswat, A.; Ok, Y.S.; Pittman, C.U. Organic and inorganic contaminants removal from water with biochar, a renewable, low cost and sustainable adsorbent—A critical review. Bioresour. Technol. 2014, 160, 191–202. [Google Scholar] [CrossRef] [PubMed]
  18. Gomez-Eyles, J.L.; Sizmur, T.; Collins, C.D.; Hodson, M.E. Effects of biochar and the earthworm Eisenia fetida on the bioavailability of polycyclic aromatic hydrocarbons and potentially toxic elements. Environ. Pollut. 2011, 159, 616–622. [Google Scholar] [CrossRef]
  19. Silvani, L.; Cornelissen, G.; Hale, S.E. Sorption of α-, β-, γ- and δ-hexachlorocyclohexane isomers to three widely different biochars: Sorption mechanisms and application. Chemosphere 2019, 219, 1044–1051. [Google Scholar] [CrossRef] [PubMed] [Green Version]
  20. Xu, X.; Shi, Z.; Li, D.; Rey, A.; Ruan, H.; Craine, J.M.; Liang, J.; Zhou, J.; Luo, Y. Soil properties control decomposition of soil organic carbon: Results from data-assimilation analysis. Geoderma 2016, 262, 235–242. [Google Scholar] [CrossRef] [Green Version]
  21. Zimmerman, A.R.; Gao, B.; Ahn, M.-Y. Positive and negative carbon mineralization priming effects among a variety of biochar-amended soils. Soil Biol. Biochem. 2011, 43, 1169–1179. [Google Scholar] [CrossRef]
  22. Ali, I.; Asim, M.; Khan, T.A. Low cost adsorbents for the removal of organic pollutants from wastewater. J. Environ. Manag. 2012, 113, 170–183. [Google Scholar] [CrossRef]
  23. Ahmad, M.; Rajapaksha, A.U.; Lim, J.E.; Zhang, M.; Bolan, N.; Mohan, D.; Vithanage, M.; Lee, S.S.; Ok, Y.S. Biochar as a sorbent for contaminant management in soil and water: A review. Chemosphere 2014, 99, 19–33. [Google Scholar] [CrossRef]
  24. Grgić, M.; Maletić, S.; Beljin, J.; Isakovski, M.K.; Rončević, S.; Tubić, A.; Agbaba, J. Lindane and hexachlorobenzene sequestration and detoxification in contaminated sediment amended with carbon-rich sorbents. Chemosphere 2019, 220, 1033–1040. Available online: https://agris.fao.org/agris-search/search.do?recordID=US201900062586 (accessed on 1 May 2020). [CrossRef]
  25. Lal, R.; Pandey, G.; Sharma, P.; Kumari, K.; Malhotra, S.; Pandey, R.; Raina, V.; Kohler, H.-P.E.; Holliger, C.; Jackson, C.; et al. Biochemistry of Microbial Degradation of Hexachlorocyclohexane and Prospects for Bioremediation. Microbiol. Mol. Biol. Rev. MMBR 2010, 74, 58–80. [Google Scholar] [CrossRef] [PubMed] [Green Version]
  26. Bala, K.; Sharma, P.; Lal, R. Sphingobium quisquiliarum sp. nov., a hexachlorocyclohexane (HCH)-degrading bacterium isolated from an HCH-contaminated soil. Int. J. Syst. Evol. Microbiol. 2010, 60, 429–433. [Google Scholar] [CrossRef] [PubMed]
  27. Böltner, D.; Moreno-Morillas, S.; Ramos, J.-L. 16S rDNA phylogeny and distribution of lin genes in novel hexachlorocyclohexane-degrading Sphingomonas strains. Environ. Microbiol. 2005, 7, 1329–1338. [Google Scholar] [CrossRef]
  28. Mohn, W.W.; Mertens, B.; Neufeld, J.D.; Verstraete, W.; Lorenzo, V.D. Distribution and phylogeny of hexachlorocyclohexane-degrading bacteria in soils from Spain. Environ. Microbiol. 2006, 8, 60–68. [Google Scholar] [CrossRef] [PubMed]
  29. Saxena, A.; Anand, S.; Dua, A.; Sangwan, N.; Khan, F.; Lal, R. Novosphingobium lindaniclasticum sp. nov., a hexachlorocyclohexane (HCH)-degrading bacterium isolated from an HCH dumpsite. Int. J. Syst. Evol. Microbiol. 2013, 63, 2160–2167. [Google Scholar] [CrossRef] [PubMed]
  30. Nagata, Y.; Miyauchi, K.; Takagi, M. Complete analysis of genes and enzymes for γ-hexachlorocyclohexane degradation in Sphingomonas paucimobilis UT26. J. Ind. Microbiol. Biotechnol. 1999, 23, 380–390. [Google Scholar] [CrossRef] [PubMed]
  31. Oakley, A.J.; Klvaňa, M.; Otyepka, M.; Nagata, Y.; Wilce, M.C.J.; Damborský, J. Crystal Structure of Haloalkane Dehalogenase LinB from Sphingomonas paucimobilis UT26 at 0.95 Å Resolution:  Dynamics of Catalytic Residues. Biochemistry 2004, 43, 870–878. [Google Scholar] [CrossRef] [PubMed]
  32. Okai, M.; Kubota, K.; Fukuda, M.; Nagata, Y.; Nagata, K.; Tanokura, M. Crystal Structure of γ-Hexachlorocyclohexane Dehydrochlorinase LinA from Sphingobium japonicum UT26. J. Mol. Biol. 2010, 403, 260–269. [Google Scholar] [CrossRef]
  33. Brittain, D.R.B.; Pandey, R.; Kumari, K.; Sharma, P.; Pandey, G.; Lal, R.; Coote, M.L.; Oakeshott, J.G.; Jackson, C.J. Competing SN2 and E2 reaction pathways for hexachlorocyclohexane degradation in the gas phase, solution and enzymes. Chem. Commun. 2010, 47, 976–978. [Google Scholar] [CrossRef] [PubMed]
  34. Li, X.; Wang, T.; Chang, S.X.; Jiang, X.; Song, Y. Biochar increases soil microbial biomass but has variable effects on microbial diversity: A meta-analysis. Sci. Total Environ. 2020, 749, 141593. [Google Scholar] [CrossRef] [PubMed]
  35. Cui, L.; Yin, C.; Chen, T.; Quan, G.; Ippolito, J.A.; Liu, B.; Yan, J.; Ding, C.; Hussain, Q.; Umer, M. Remediation of organic halogen- contaminated wetland soils using biochar. Sci. Total Environ. 2019, 696, 134087. [Google Scholar] [CrossRef]
  36. Odedishemi, F.O.; Wang, H.-C.; Guadie, A.; Ajibade, T.F.; Fang, Y.-K.; Sharif, H.M.A.; Liu, W.-Z.; Wang, A.-J. Total nitrogen removal in biochar amended non-aerated vertical flow constructed wetlands for secondary wastewater effluent with low C/N ratio: Microbial community structure and dissolved organic carbon release conditions. Bioresour. Technol. 2021, 322, 124430. [Google Scholar] [CrossRef] [PubMed]
  37. Deng, C.; Huang, L.; Liang, Y.; Xiang, H.; Jiang, J.; Wang, Q.; Hou, J.; Chen, Y. Response of microbes to biochar strengthen nitrogen removal in subsurface flow constructed wetlands: Microbial community structure and metabolite characteristics. Sci. Total Environ. 2019, 694, 133687. [Google Scholar] [CrossRef] [PubMed]
  38. Gupta, S.K.; Lal, D.; Lata, P.; Sangwan, N.; Garg, N.; Holliger, C.; Lal, R. Changes in the bacterial community and lin genes diversity during biostimulation of indigenous bacterial community of hexachlorocyclohexane (HCH) dumpsite soil. Microbiology 2013, 82, 234–240. [Google Scholar] [CrossRef]
  39. Suar, M.; van der Meer, J.R.; Lawlor, K.; Holliger, C.; Lal, R. Dynamics of Multiple lin Gene Expression in Sphingomonas paucimobilis B90A in Response to Different Hexachlorocyclohexane Isomers. Appl. Environ. Microbiol. 2004, 70, 6650–6656. [Google Scholar] [CrossRef] [Green Version]
  40. Clifford, R.J.; Milillo, M.; Prestwood, J.; Quintero, R.; Zurawski, D.V.; Kwak, Y.I.; Waterman, P.E.; Lesho, E.P.; Mc Gann, P. Detection of Bacterial 16S rRNA and Identification of Four Clinically Important Bacteria by Real-Time PCR. PLoS ONE 2012, 7, e48558. [Google Scholar] [CrossRef]
  41. Nechanická, M.D.L.; Dolinová, I. Use of Nanofiber Carriers for Monitoring of Microbial Biomass. In Topical Issues of Rational Use of Natural Resources: Proceedings of the International Forum-Contest of Young Researchers, St. Petersburg, Russia, 18–20 April 2018; CRC Press: Boca Raton, FL, USA, 2018; p. 361. Available online: https://www.routledge.com/Topical-Issues-of-Rational-Use-of-Natural-Resources-Proceedings-of-the/Litvinenko/p/book/9780367027438 (accessed on 18 November 2020).
  42. Claesson, M.J.; Wang, Q.; O’Sullivan, O.; Greene-Diniz, R.; Cole, J.R.; Ross, R.; O’Toole, P. Comparison of two next-generation sequencing technologies for resolving highly complex microbiota composition using tandem variable 16S rRNA gene regions. Nucleic Acids Res. 2010, 38, e200. [Google Scholar] [CrossRef]
  43. Dowd, S.E.; Callaway, T.R.; Wolcott, R.D.; Sun, Y.; McKeehan, T.; Hagevoort, R.G.; Edrington, T.S. Evaluation of the bacterial diversity in the feces of cattle using 16S rDNA bacterial tag-encoded FLX amplicon pyrosequencing (bTEFAP). BMC Microbiol. 2008, 8, 125. [Google Scholar] [CrossRef] [Green Version]
  44. Schloss, P.D.; Westcott, S.L.; Ryabin, T.; Hall, J.R.; Hartmann, M.; Hollister, E.B.; Lesniewski, R.A.; Oakley, B.B.; Parks, D.H.; Robinson, C.J.; et al. Introducing mothur: Open-Source, Platform-Independent, Community-Supported Software for Describing and Comparing Microbial Communities. Appl. Environ. Microbiol. 2009, 75, 7537–7541. [Google Scholar] [CrossRef] [Green Version]
  45. Callahan, B.J.; McMurdie, P.J.; Rosen, M.J.; Han, A.W.; Johnson, A.J.A.; Holmes, S.P. DADA2: High-resolution sample inference from Illumina amplicon data. Nat. Methods 2016, 13, 581–583. [Google Scholar] [CrossRef] [PubMed] [Green Version]
  46. Ssekagiri, A.; Sloan, W.T.; Ijaz, U.Z. microbiomeSeq: An R package for analysis of microbial communities in an environmental context. In Proceedings of the ISCB Africa ASBCB Conference, Kumasi, Ghana, 10–12 October 2017. [Google Scholar] [CrossRef]
  47. Torondel, B.; Ensink, J.H.; Gundogdu, O.; Ijaz, U.Z.; Parkhill, J.; Abdelahi, F.; Nguyen, V.-A.; Sudgen, S.; Gibson, W.; Walker, A.W.; et al. Assessment of the influence of intrinsic environmental and geographical factors on the bacterial ecology of pit latrines. Microb. Biotechnol. 2016, 9, 209–223. [Google Scholar] [CrossRef] [Green Version]
  48. Oksanen, J.; Kindt, R.; Legendre, P.; Minchin, P.R.; O’Hara, B.; Simpson, G.L.; Solymos, P.; Stevens, H.; Henry, M.; Wagner, H. The Vegan Package; R Core Team: Vienna, Austria, 2009. [Google Scholar]
  49. Buser, H.-R.; Mueller, M.D. Isomer and Enantioselective Degradation of Hexachlorocyclohexane Isomers in Sewage Sludge under Anaerobic Conditions. Environ. Sci. Technol. 1995, 29, 664–672. [Google Scholar] [CrossRef]
  50. Wypych, G. Handbook of Solvents; ChemTec Publishing: Scarborough, ON, Canada, 2001. [Google Scholar]
  51. Arey, J.S.; Green, W.H.; Gschwend, P.M. The Electrostatic Origin of Abraham’s Solute Polarity Parameter. J. Phys. Chem. B 2005, 109, 7564–7573. [Google Scholar] [CrossRef]
  52. Lamarche, O.; Platts, J.A.; Hersey, A. Theoretical prediction of the polarity/polarizability parameter π2H. Phys. Chem. Chem. Phys. 2001, 3, 2747–2753. [Google Scholar] [CrossRef]
  53. Chen, W.; Wei, R.; Ni, J.; Yang, L.; Qian, W.; Yang, Y. Sorption of chlorinated hydrocarbons to biochars in aqueous environment: Effects of the amorphous carbon structure of biochars and the molecular properties of adsorbates. Chemosphere 2018, 210, 753–761. [Google Scholar] [CrossRef]
  54. Marcus, Y. Linear solvation energy relationships. Correlation and prediction of the distribution of organic solutes between water and immiscible organic solvents. J. Phys. Chem. 1991, 95, 8886–8891. [Google Scholar] [CrossRef]
  55. Yang, K.; Wu, W.; Jing, Q.; Zhu, L. Aqueous Adsorption of Aniline, Phenol, and their Substitutes by Multi-Walled Carbon Nanotubes. Environ. Sci. Technol. 2008, 42, 7931–7936. [Google Scholar] [CrossRef]
  56. Murthy, H.M.R.; Manonmani, H.K. Aerobic degradation of technical hexachlorocyclohexane by a defined microbial consortium. J. Hazard. Mater. 2007, 149, 18–25. [Google Scholar] [CrossRef]
  57. Liu, X.; Peng, P.; Fu, J.; Huang, W. Effects of FeS on the Transformation Kinetics of γ-Hexachlorocyclohexane. Environ. Sci. Technol. 2003, 37, 1822–1828. [Google Scholar] [CrossRef]
  58. Liu, J.; Wang, Z.; Belchik, S.M.; Edwards, M.J.; Liu, C.; Kennedy, D.W.; Merkley, E.D.; Lipton, M.S.; Butt, J.N.; Richardson, D.J.; et al. Identification and Characterization of MtoA: A Decaheme c-Type Cytochrome of the Neutrophilic Fe(II)-Oxidizing Bacterium Sideroxydans lithotrophicus ES-1. Front. Microbiol. 2012, 3, 37. [Google Scholar] [CrossRef] [Green Version]
  59. Dadhwal, M.; Singh, A.; Prakash, O.; Gupta, S.; Kumari, K.; Sharma, P.; Jit, S.; Verma, M.; Holliger, C.; Lal, R. Proposal of biostimulation for hexachlorocyclohexane (HCH)-decontamination and characterization of culturable bacterial community from high-dose point HCH-contaminated soils. J. Appl. Microbiol. 2009, 106, 381–392. [Google Scholar] [CrossRef]
  60. Leoni, C.; Volpicella, M.; Fosso, B.; Manzari, C.; Piancone, E.; Dileo, M.C.G.; Arcadi, E.; Yakimov, M.; Pesole, G.; Ceci, L.R. A Differential Metabarcoding Approach to Describe Taxonomy Profiles of Bacteria and Archaea in the Saltern of Margherita di Savoia (Italy). Microorganisms 2020, 8, 936. [Google Scholar] [CrossRef] [PubMed]
  61. Miyauchi, K.; Suh, S.-K.; Nagata, Y.; Takagi, M. Cloning and Sequencing of a 2,5-Dichlorohydroquinone Reductive Dehalogenase Gene Whose Product Is Involved in Degradation of γ-Hexachlorocyclohexane by Sphingomonas paucimobilis. J. Bacteriol. 1998, 180, 1354–1359. [Google Scholar] [CrossRef] [Green Version]
  62. Nagata, Y.; Nariya, T.; Ohtomo, R.; Fukuda, M.; Yano, K.; Takagi, M. Cloning and sequencing of a dehalogenase gene encoding an enzyme with hydrolase activity involved in the degradation of gamma-hexachlorocyclohexane in Pseudomonas paucimobilis. J. Bacteriol. 1993, 175, 6403–6410. [Google Scholar] [CrossRef] [Green Version]
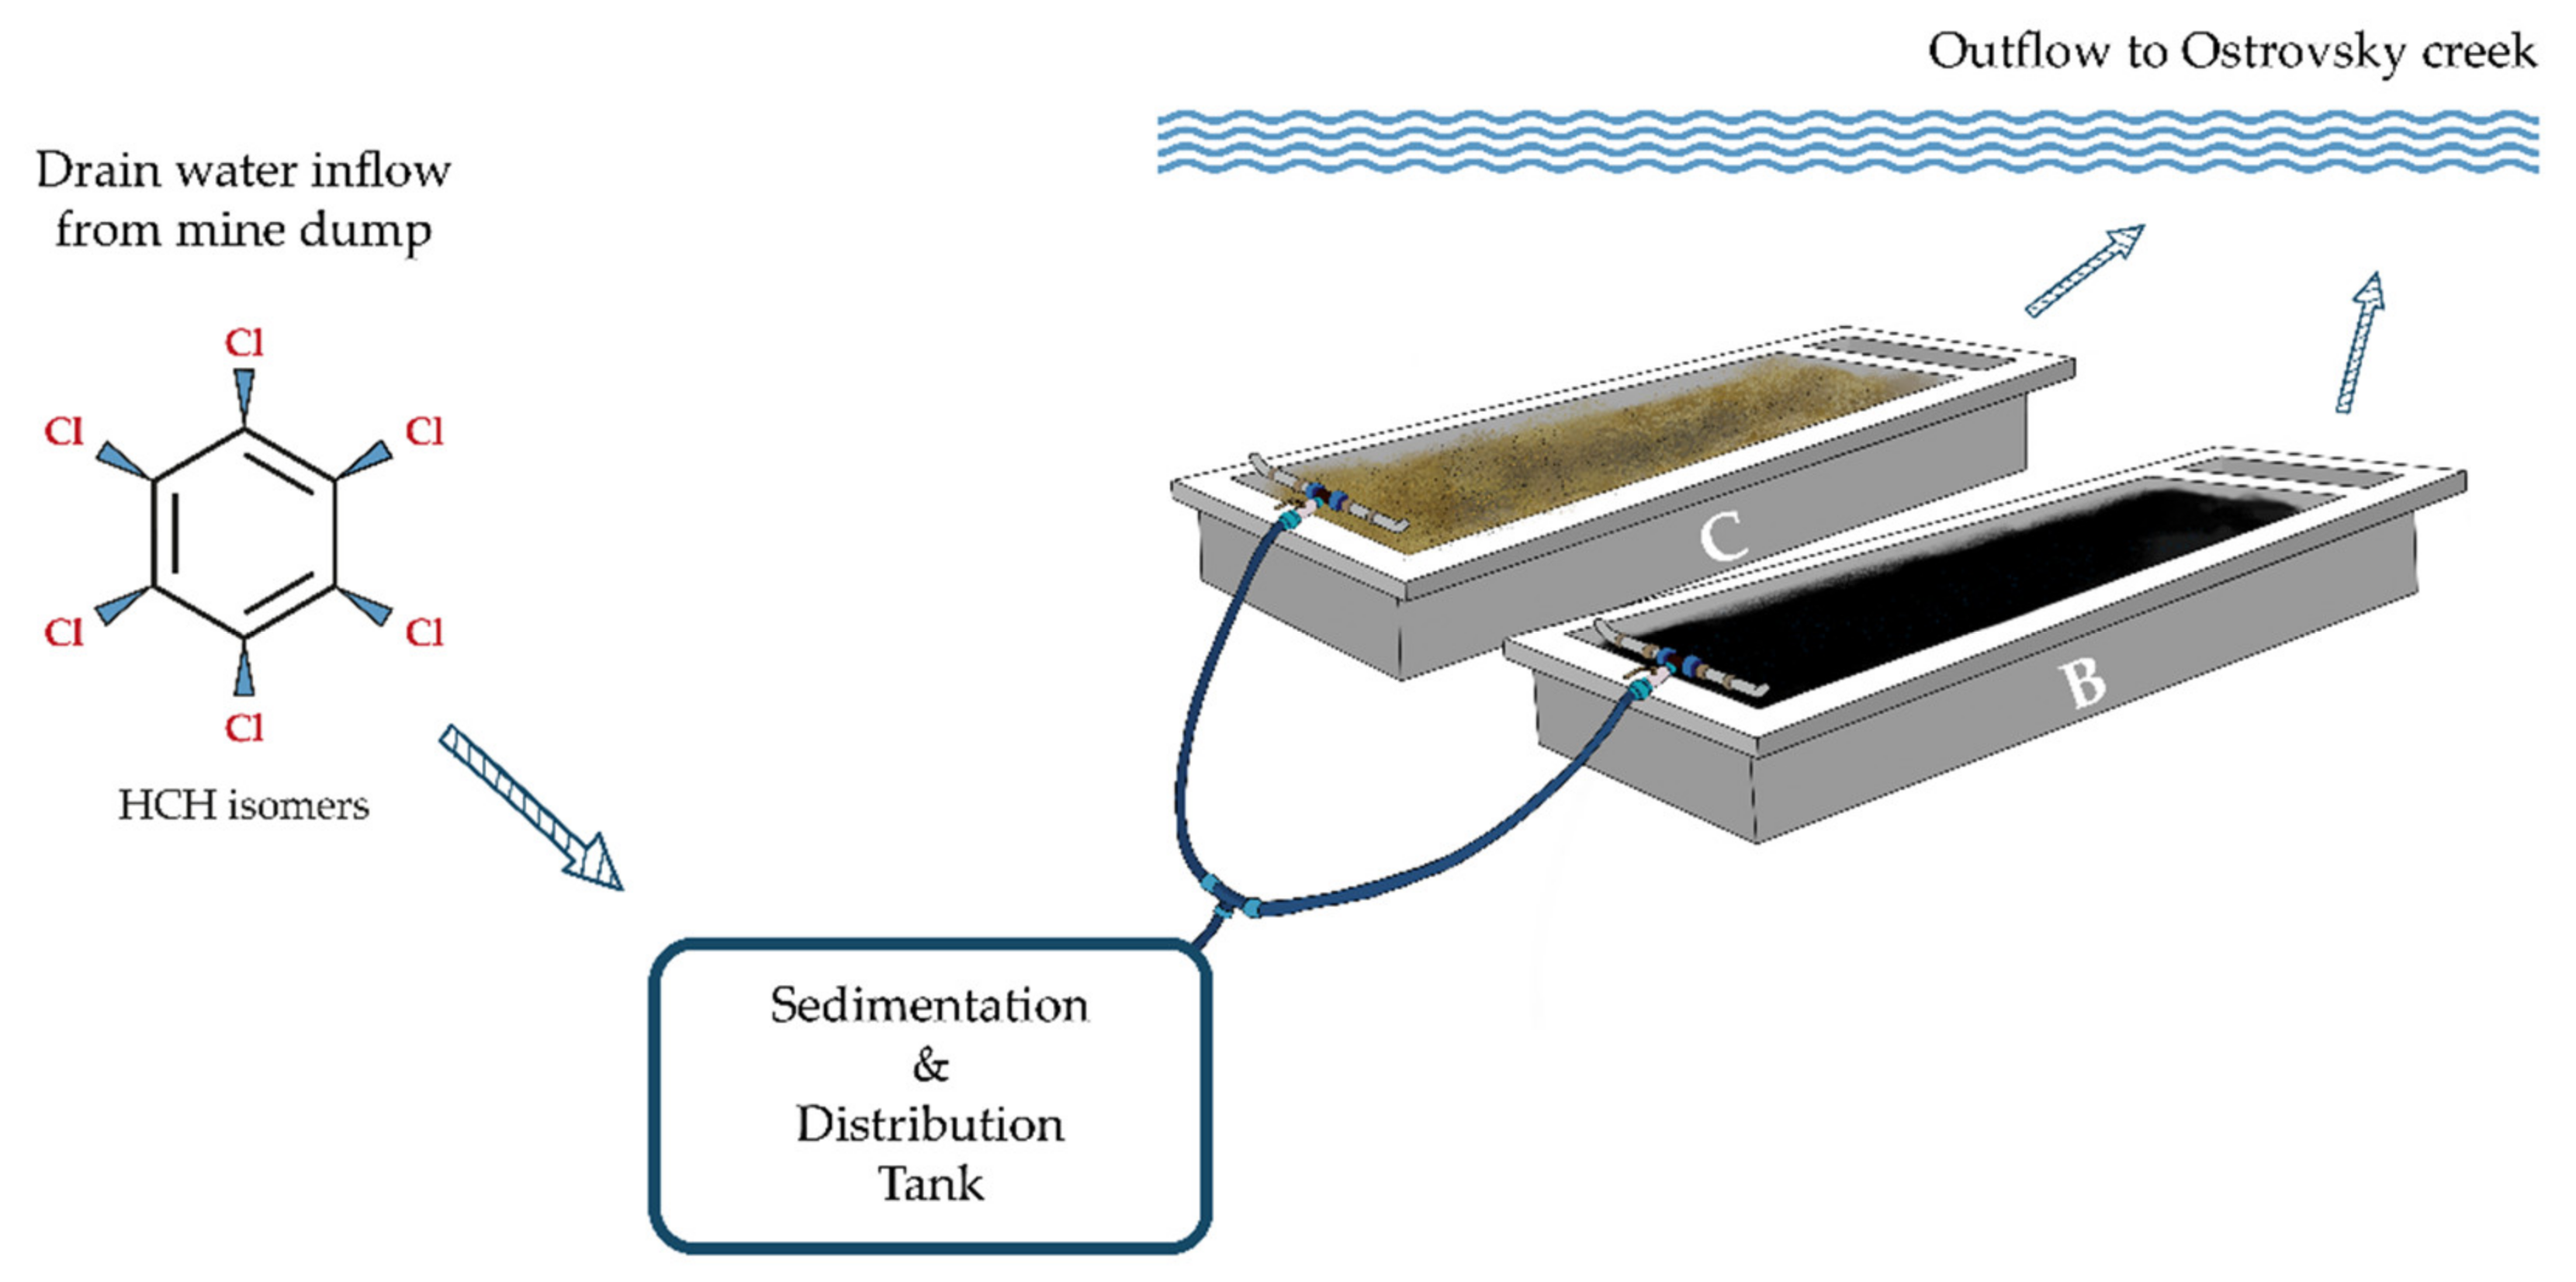
Figure 1. Schematic illustration of the constructed two-part biofilter used in this study, B—biochar biofilter, C—control biofilter filled with a soil/clay substrate and natural water.
Water 13 03396 g001
Figure 2. Monthly measurements of (a) HCH isomers (b) ClB, and (c) ClPh in polluted inflow water (blue), the control biofilter (C, orange), and the biochar biofilter (B, gray) over the course of the experiment.
Water 13 03396 g002
Figure 3. Relative abundance (>5%) of microorganisms (family level) in water and sediment samples. B = biochar biofilter, C = control biofilter.
Water 13 03396 g003
Figure 4. Spearman correlations for taxa to chemical compounds ** p < 0.01, * p < 0.05.
Water 13 03396 g004
Table 1. Relative abundance of genes indicating total bacterial biomass (16S rDNA), dehydrochlorinase (linA), haloalkane dehalogenase (linB, linB-RT), and reductive dechlorinase (linD) in the control biofilter (C, average of duplicate samples) and biochar sediments (B, average of duplicate samples). The color scale indicates the relative quantity of a given marker: red (+++) highest, orange (++) high, and yellow (+) intermediate quantity, ND = not detected or below the LOQ.
Gene
BiofilterU16SRTlinAlinBlinB-RTlinD
2018C++++++++++++++
B+NDNDNDND
2019C+++++++++++
B+++++++++++++++
Publisher’s Note: MDPI stays neutral with regard to jurisdictional claims in published maps and institutional affiliations.