
The Application of Low Impact Development Facility Chain on Storm Rainfall Control: A Case Study in Shenzhen, China


1
College of Environment and Ecology, Chongqing University, Chongqing 400044, China
2
School of Environment and Energy, Peking University Shenzhen Graduate School, Shenzhen 518055, China
3
China Resources Environmental Protection Technology Limited, Shenzhen 518001, China
4
Tianjin Academy of Eco-Environmental Sciences, Tianjin 300191, China
*
Author to whom correspondence should be addressed.
Water 2021, 13(23), 3375; https://doi.org/10.3390/w13233375
Submission received: 10 September 2021
/
Revised: 23 November 2021
/
Accepted: 25 November 2021
/
Published: 30 November 2021
(This article belongs to the Special Issue New Technology Development for Wastewater and Solid Waste Treatment)
Abstract
:In recent decades, low impact development (LID) has become an increasingly important concern as a state-of-the-art stormwater management mode to treat urban flood, preferable to conventional urban drainage systems. However, the effects of the combined use of different LID facilities on urban flooding have not been fully investigated under different rainfall characteristics. In this study, a residential, neighborhood-scale catchment in Shenzhen City, southern China was selected as a case study, where the effects of four LID techniques (bio-retention, bio-swale, rain garden and pervious pavement) with different connection patterns (cascaded, semi-cascaded and paralleled) on runoff reduction efficiency were analyzed by the storm water management model (SWMM), promoted by the U.S. EPA. Three kinds of designed storm events with different return periods, durations and time-to-peak ratios were forced to simulate the flood for holistic assessment of the LID connection patterns. The effects were measured by the runoff coefficient of the whole storm–runoff process and the peak runoff volume. The results obtained indicate that the cascaded connect LID chain can more effectively reduce the runoff than that in the paralleled connect LID chain under different storms. The performances of the LID chains in modeling flood process in SWMM indicate that the runoff coefficient and the peak runoff volume increase with the increase in the rain return periods and the decrease in rain duration. Additionally, the move backward of the peak rain intensity to the end of the storm event slightly affects the peak runoff volume obviously while gives slight influence on the total runoff volume. This study provides an insight into the performance of LID chain designs under different rainfall characteristics, which is essential for effective urban flood management.
1. Introduction
Urban flood induced by storms causes loss of life and property, many structural or nonstructural methods (i.e., change the land use structure, upgrade sewerage system and establish early-warning system, etc.) are adopted to minimize the risks of flood and their damages. As a kind of effective and practical mitigation measure, best management practices (BMPs) approaches are widely applied to treat urban stormwater. End-of-pipe treatment options, including extended detention ponds, constructed wetlands and infiltration basins, are designed to receive a specified dry-weather flow, which increases due to stormwater surface runoff conveyed in combined sewer systems [1,2]. Meanwhile, a different design response to the challenges facing stormwater management is “low impact development (LID)” [3]. LID technique is an alternative site design strategy that uses natural and engineered infiltration and storage techniques to control storm water where it is generated [4]. LID emphasizes small, distributed, at-source BMPs and incorporates, as part of stormwater management decisions, design of street layout, and the size, location and configuration of buildings [5]. In many parts of the world, LID facilities are almost the only acceptable way of sustainable stormwater management [6].
LID facilities such as green roof, bio-retention and pervious pavement have been widely used for control urban surface flow throughout many areas (in general, green roof, bioswale and rain garden are a kind of bioretention, and in this study, we give the different names of these bio-retentions in order to differentiate the size and locations where they were built in) [7,8]. Unlike the traditional surface flow control techniques, which rely on expanding and upgrading the existing storm drainage system to improve drainage capacity, LID options are proven to be sustainable, cost saving and practical, particularly in densely urbanized areas. The dominant approach to implement LID stormwater control measures is by using the infiltration rate of LID media to control hydrologic responses [9]. In general, LID techniques rely on distributed runoff management measures that seek to control stormwater by reducing imperviousness and retaining, infiltrating and reusing stormwater on the development site where it is generated [10,11]. Many studies recommended the LID techniques as an innovative solution for stormwater management [12,13,14].
Many laboratory, pilot and in situ full-scale studies have found that the LID techniques can reduce the surface runoff, peak flow and pollutant load, and increase the evapotranspiration and soil infiltration of precipitation [15,16,17]. Haghighatafshar et al. [18] studied the benefits of LID-provided static storage capacity in reducing peak flows and volumes of stormflow. Tirpak et al. [19] pointed out that the combined effects of the bioretention cell and the permeable pavement led to significant runoff mitigation from the parking lot, reducing both runoff depths and peak flow rates.
Studies also indicated that the LID facilities perform differently on runoff control under rainfall with different characteristics. Qin et al. [11] found that bioswales perform best during a storm event with an early peak, pervious pavements perform best with a middle peak and green roofs perform best with a late peak. Damodaram and Giacomoni et al. estimated the effects of LID options on the runoff in a small catchment located in the Texas A&M University campus [20] and found that LID techniques are able to control stormwater for small storms, while LID is not as effective as conventional detention ponds for flooding events. Hyun et al. investigated the use of LID facilities in a demonstration district in AsanTangjung New Town [21], and found that these facilities can reduce the flood peak discharges on 50 to 100 y return period. The reduction of flood peak discharge by each return period of storms was estimated to be about 7 to 15% at a wider catchment scale. Jemberie and Melesse [22] analyzed the impacts of urbanization and climate change on generated flood magnitude, using the urban hydrological model of SWMM and LID sustainable land use optimization technique, and pointed out that combined LID techniques have a significant impact on urban flood reduction of up to 75%. Samouei and Zger [23] investigated the hydrologic response of the catchment after replacing proportions of impervious surfaces with combinations of LID practices, and the results showed that implementing 5–20% of LIDs has a noticeable impact on runoff peak flow and volume reduction, especially in storm events with shorter return periods. Liang et al. [24] studied the performances of five design scenarios with different spatial distributions, but with the same sizes of LID controls, at the urban catchment scale, and the results confirmed that the hydrological performance was more sensitive to rainfall intensity along with the rainfall intensity increased.
Furthermore, researches based on field observation and modelling pointed out that LID approaches cannot completely substitute for the conventional urban drainage systems to control storm runoff [25,26] and should be incorporated into the conventional drainage system to provide control solutions for an entire spectrum of storm events [20,27].
Although many studies have been done on the performances of LIDs, the investigation on evaluating the effects surface runoff volumes control using the LID facilities that cascaded as a chain under the storms with different features has not been brought to the forefront. Therefore, a residential neighborhood scale catchment in Shenzhen City is selected as a case study to evaluate the effects of different LID chains on urban surface runoff production with variety rainfall characteristics, and also compare the differences of runoff reduction efficiency between the LID chain and distributed LID facilities via hydrological modeling, with a view to provide reference for the promotion and application of LID techniques.
2. Materials and Methods
2.1. Study Area Description
As the most economically developed city in China, Shenzhen City lies in the southern fringe of north subtropical zone. It has a mild maritime climate with annual mean rainfall of 1930 mm and mean annual temperature of 22.5 °C. The rainfall events mainly occur from April to September. As the most vulnerable coastal regions are invaded by typhoons in China, heavy storm rainfall often leads to urban flood and waterlogging disasters in Shenzhen from June to August. To resist the surface runoff from a heavy storm that may exceed the drainage capacity of the municipal pipe network system, many LID practices, such as green roofs, bio-retentions and rain gardens, are being applied in Shenzhen’s urban constructions in recent years.
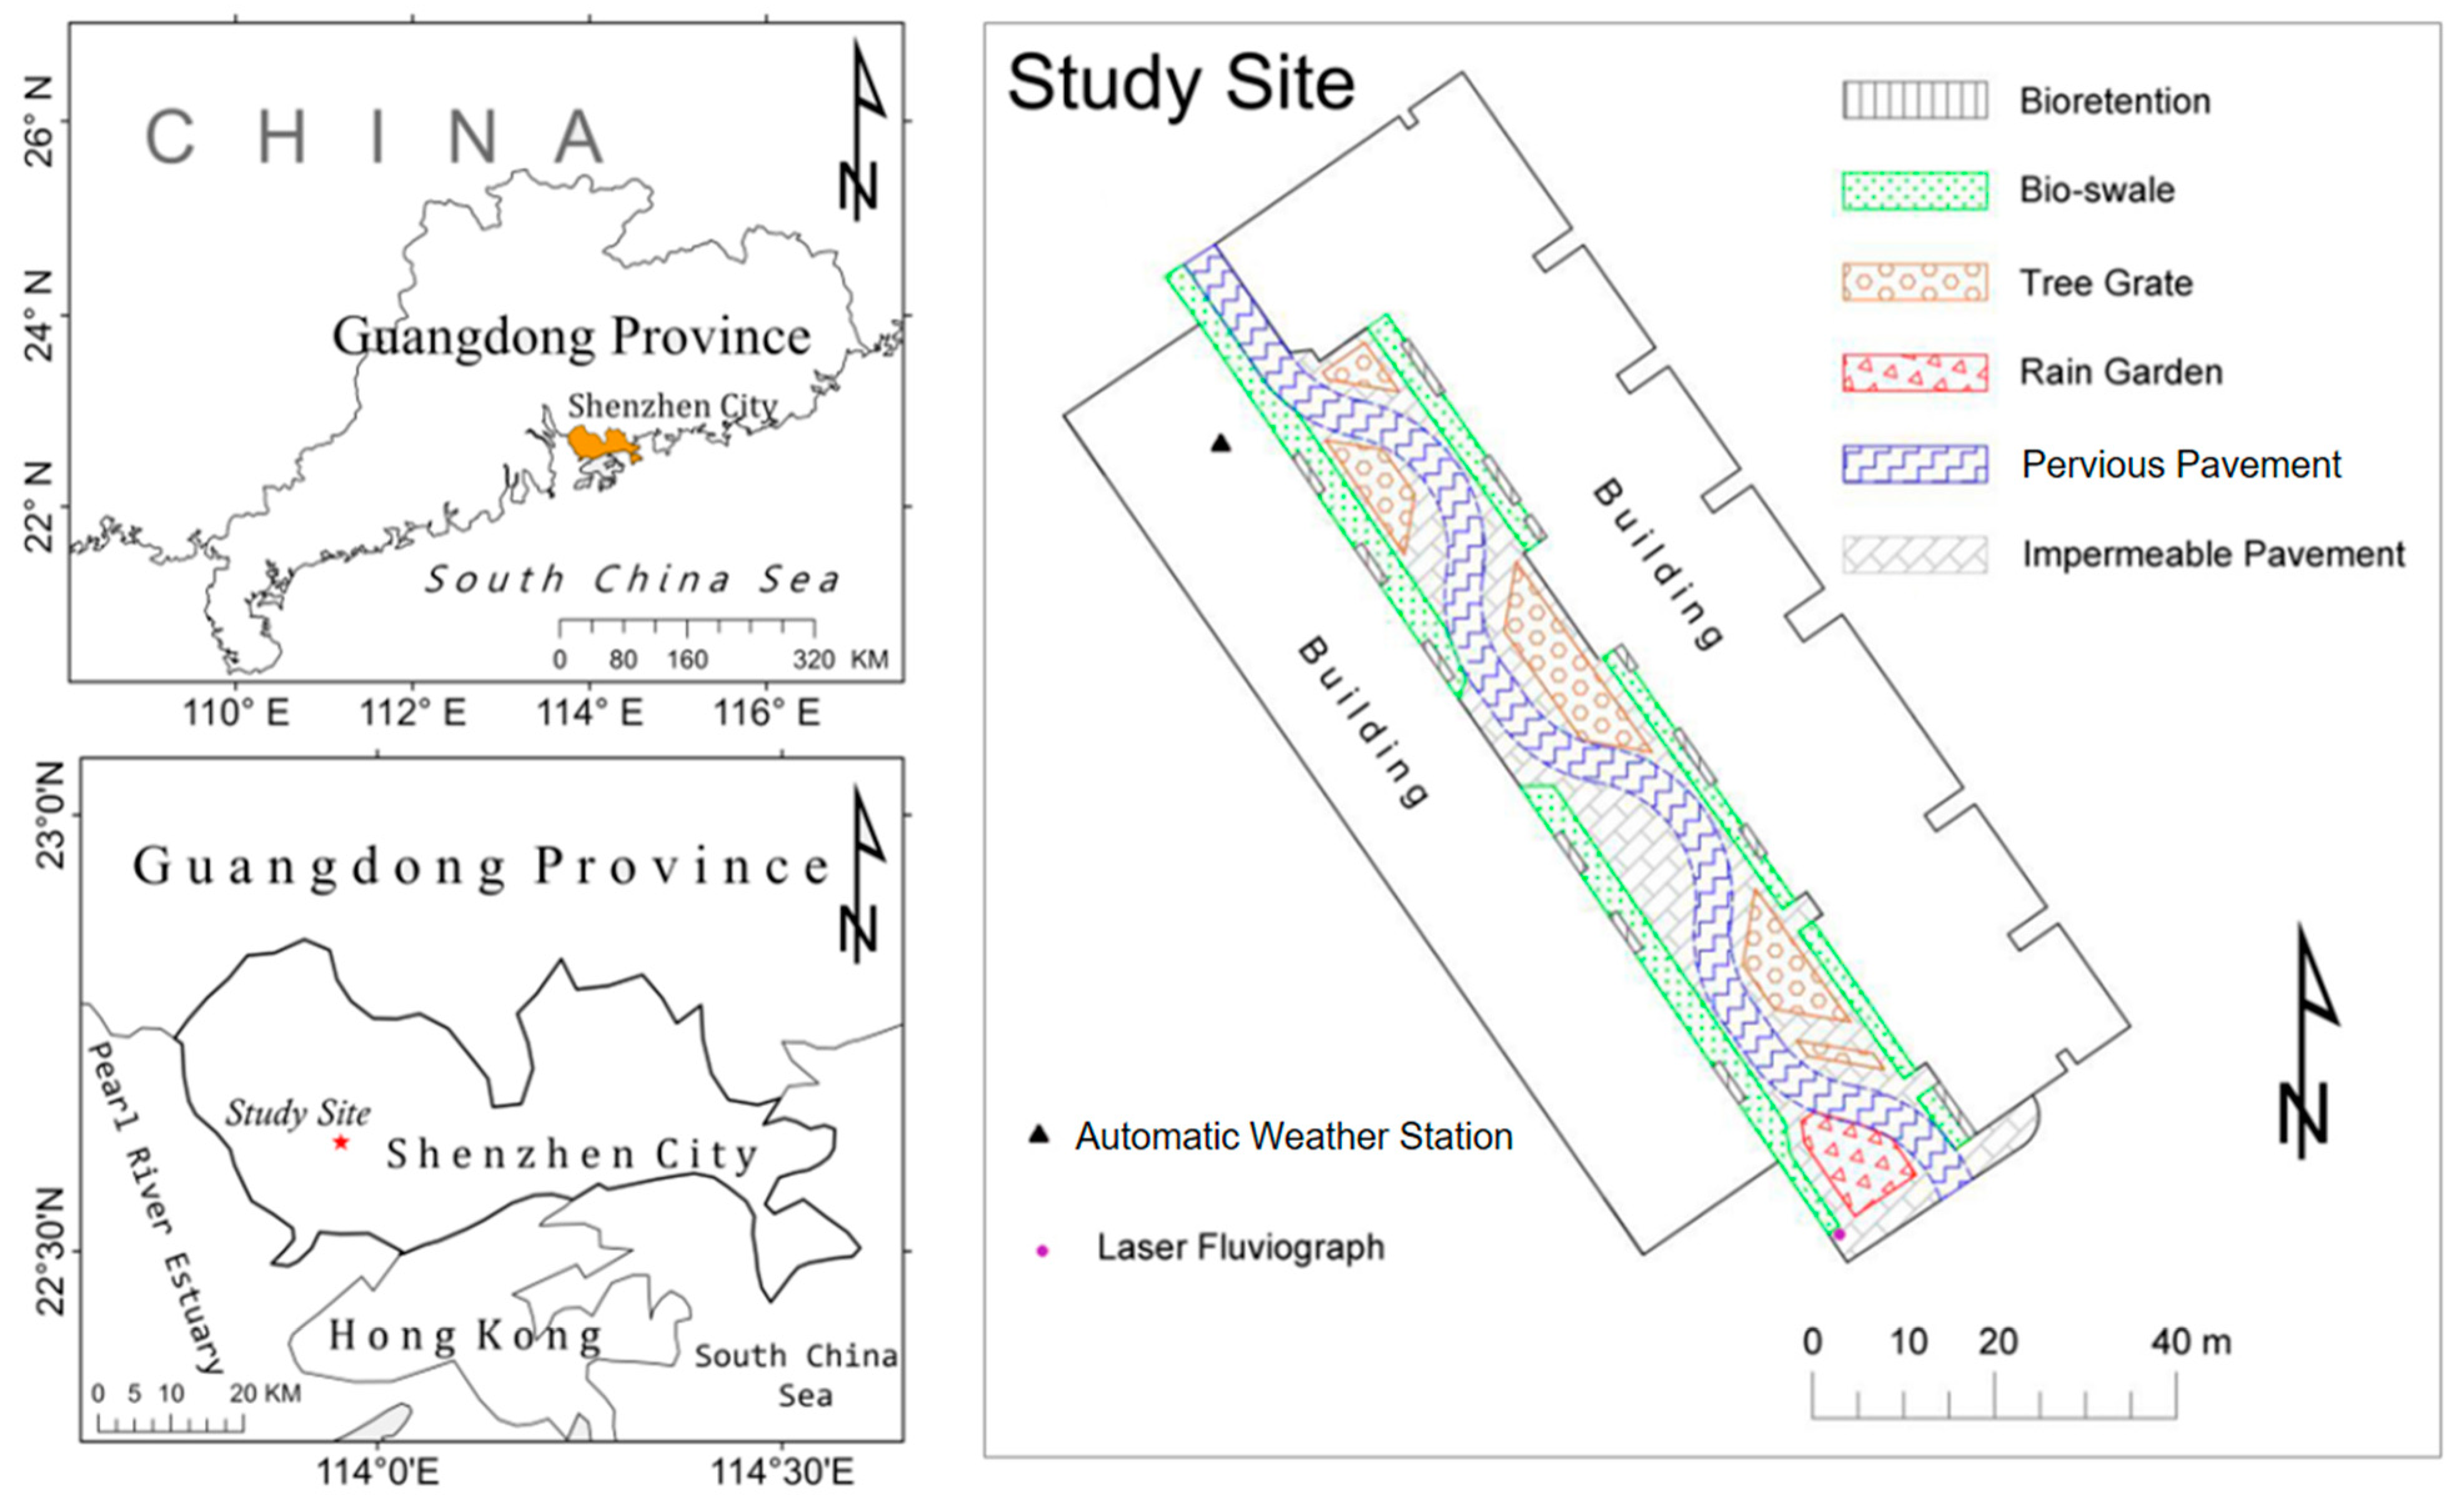
The study area is located in Makan Village (Figure 1), with drainage area of 5000 m2. The study site is a green belt in a residential neighborhood between two buildings, and the LID facilities used there include four kinds: pervious pavement, bio-retention, rain garden and bio-swale. The soil type of the experiment site is mainly sandy gravel with silty clay and mucky soil. The plant cultivated in the LID facilities are indigenous plants.
Table 1 gives a detailed description of the LID facilities constructed in the study area. Due to all the runoff produced by other LID facilities, which would flow into the rain garden, the drainage area of the rain garden is the whole study site.
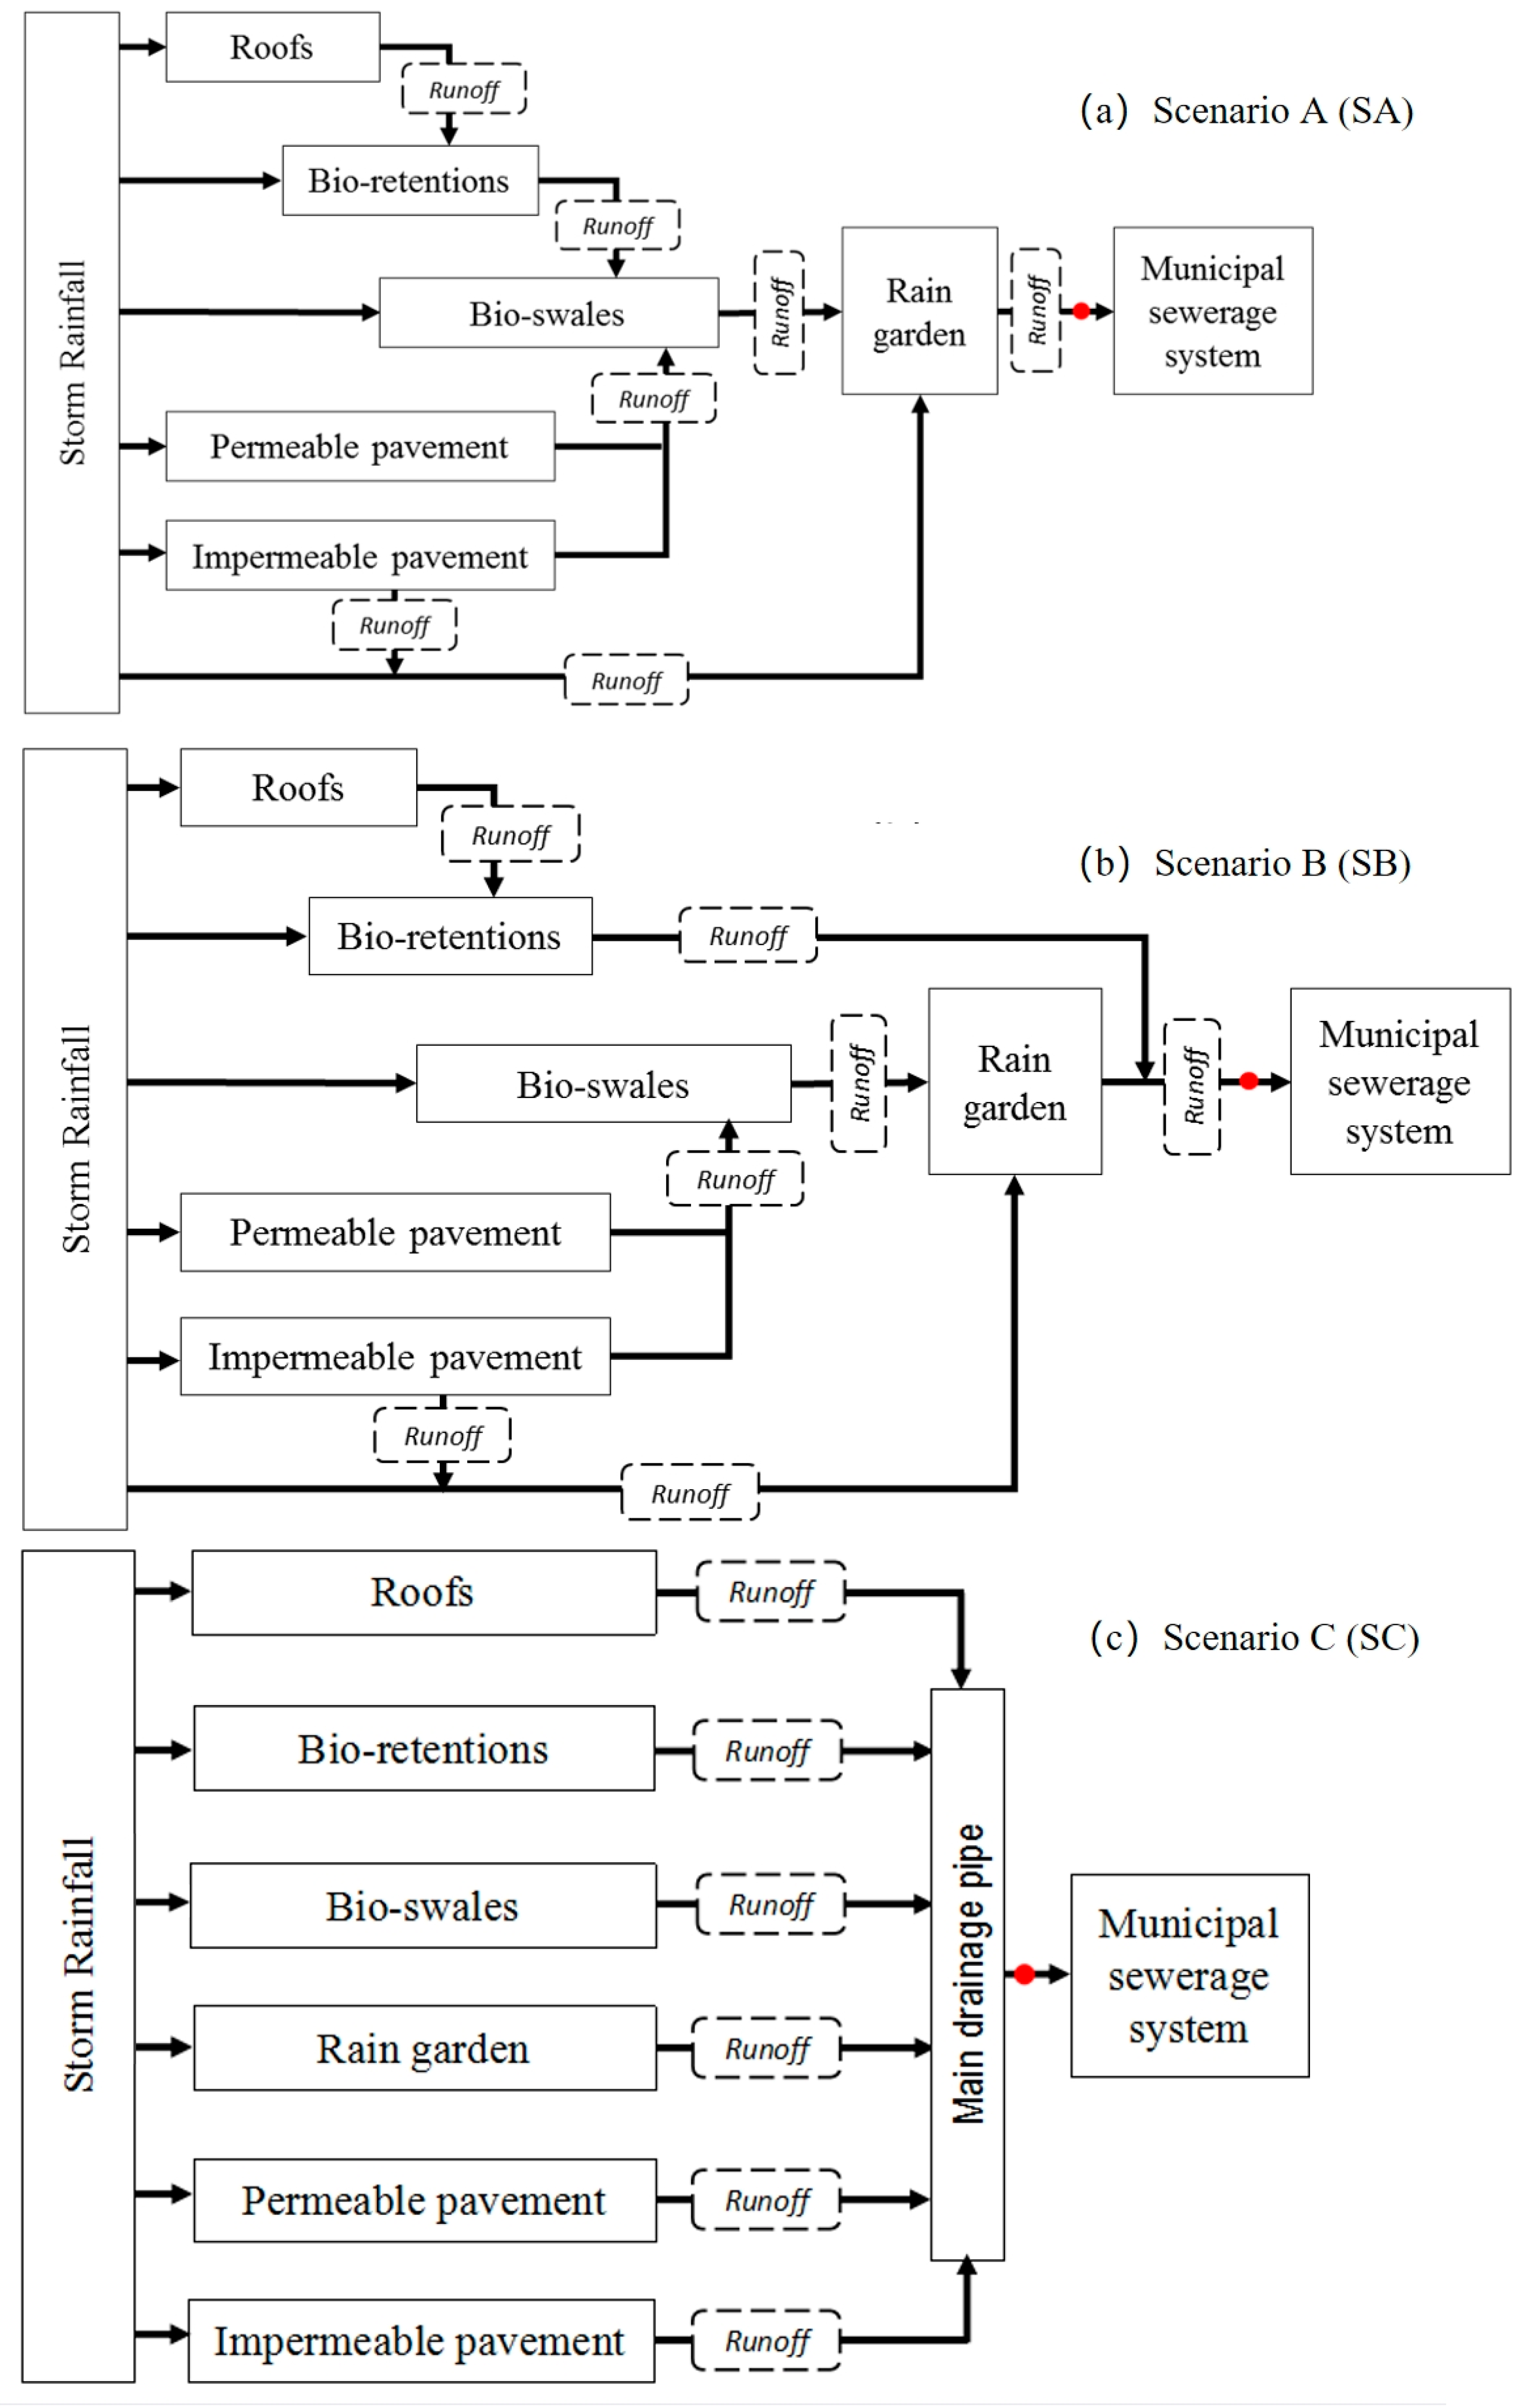
In the study area, the four kinds of LID facilities are cascade-connected as a chain, and the runoff passes through bio-retention/pervious pavement, bio-swale and rain garden in sequence before its final drainage into the municipal sewerage system. In the chain, each LID unit not only receives direct rainfall and runoff water from its own drainage area, but also receives the water from the upper-level LID unit (Figure 2a).
2.2. Data Monitoring
The meteorological data (rainfall and evaporation observed in the same period and monitoring frequency) used in this study were recorded by using the automatic meteorological station (DAVIS WeatherLink Vantage Pro2, Davis Instruments Corporation, Hayward, California, CA, USA) which was installed on the roof, and the hydrological data were measured as water level using the laser fluviograph (HOBO Water Level Logger U20-001-02, Onset Computer Corporation, Bourne, Massachusetts, MA, USA) at the end of the LID chain and then transformed into runoff (red dot in Figure 1). The hydrological and the meteorological data were monitored from July 2019 to November 2019 (lasting five months), without breaks, and the data were measured every five minutes.
Shenzhen locates the subtropical monsoon climate zone, with most rain falling in the wet season (April–September), 32 rainfall events were recorded including heavy, medium and small rainfalls, and 8 complete storm rainfall–runoff processes, characterized by long enough durations and high peaks, were carefully selected from the 32 rainfall events. Table 2 summarize the characteristics of the eight storm events—it is seen from the table that the eight carefully selected rainfall events were mainly recorded in June, July and August when heavy rain rolled through the city frequently. Therefore, the eight rain events with different characteristics (e.g., duration, rain volume and peak time) used in this study could be considered representative for the calibration and validation of the model.
Furthermore, the runoff coefficient indicated that the LID facilities constructed in the study site can store most of the rain (the mean runoff coefficients is 0.19) and release the stored rainwater slowly after the storm events (the runoff yielding time are much longer than the rainfall duration time). Furthermore, the rain garden located at the end of the south LID chain is effective in storing the rainwater and runoff produced by the upper-level LID facilities in the chain to reduce the runoff coefficient.
In addition, the soil layers of the LID facilities were composed by sandy soil, and the storage layers of the LID facilities were composed by sand and gravel, and the characteristics of sandy soil, sand and gravel determined that the LID facilities showed good drainage capacity. Therefore, we have not yet observed the surface flood produced by the LID facilities in Makan Village under the recorded storms, and the surface flood was not considered in this study.
2.3. LID Connection Scenarios Design
In order to evaluate the runoff reduction efficiency via LID facilities with different connection methods, two scenarios (Scenario B and C) of LID systems were designed in SWMM besides the LID chain for the study area (recognized as Scenario A (SA), Figure 2a). In scenario B (SB, Figure 2b), the rainwater was collected by the roofs flow through the bio-retentions and then afflux into the municipal sewerage system with the runoff from the rain garden, while the flow paths from other LID facilities remained unchanged. In scenario C (SC, Figure 2c), the four kinds of LID facilities were parallel-connected, and the runoff was produced by each unit only from its own drainage area, then converged into the main drainage pipe directly and then into the municipal sewerage system.
2.4. Hydrological Model
- (1)
- SWMM
The U.S. EPA’s storm water management model (SWMM) was applied in this study. SWMM is a common approach used by researchers for the modeling of urban stormwater movement at watershed scales [28]. It is a dynamic, lumped model, which simulates the rainfall–runoff process on a collection of sub-catchment areas which receive precipitation and generate runoff and pollutant loads, and transports the generated runoff through a system of pipes, channels, storage/treatment devices, pumps and regulators [29]. SWMM was developed based upon kinematic wave routing of overland flow using nonlinear reservoir routing to partition infiltration and evaporation from runoff, allowing for the use of Green-Ampt, SCS or Hortonian infiltration [30]. SWMM has an aquifer modeling routine that can be used to simulate the recession limb of hydrographs, as well as infiltration into pipes [9]. Since its development in 1971, the model has been widely applied to model storm rainfall–runoff, sanitary sewer networks and LID implementation in urban scale watersheds [31,32,33]. The LID control module in SWMM5 includes an option to add an underdrain for several types of LID’s (bio-retention cell, rain garden, green roof, infiltration trench, permeable pavement, rain barrel or vegetative swale). The underdrain is stated to have the intention of preventing flooding by controlling the outflow from the storage [29]. The LID module in SWMM works by performing and tracking moisture balances between different vertical layers that are defined by parameters in the graphical user interface.
As the objective of this study mainly focused on the evaluation of the hydrological response to storm water control in LID chain, SWMM was used to simulate the flow hydrograph under different scenarios, recommended by many studies [34,35,36]. The SWMM used in this study is version 5.1.0 which provides explicit LID routing algorithms.
- (2)
- Model Calibration
The objective function applied in calibrating SWMM is the residual sum of squares (RSS), as follows:
The SWMM was calibrated manually in the software, based on experience, by forcing the 8 observed storm events in turn; meanwhile, the rest of the 7 storms were used for validation, i.e., we calibrated the model 8 times and obtained 56 validation outputs. The Nash–Sutcliffe efficiency (NSE), relative error (RE), root mean square error (RMSE) and peak time error (Tpe) were used as goodness-of-fit measures to test the feasibility of SWMM and select the optimal parameter values [37,38,39]. The four evaluation criteria were as follows:
where Qsim,i and Qobs,i are the simulated and measured flows (m3/s) at time step i, and n is the total number of time steps. Tps is the simulated peak time; Tpo is the observed peak time; the positive and negative values of Tpe indicate the modelled runoff achieve its peak after and before the observed peak time, respectively.
2.5. Storm Rainfall Design
This study aimed to evaluate the runoff reduction efficiency in the LID systems scenarios under storm events with variety characteristics. The designed rainfall can easily show different rainfall characteristics, such as return period, storm duration and time-to-peak ratio, by changing parameters; therefore, the designed rainfall was used instead of the real rainfall events. The storm rainfall events were designed using the Chicago storm rainfall profile (Equation (6)) which is described by the rainfall intensity–duration–frequency equation of Shenzhen. The Chicago design storm was applicable to our study because it is recommended by The Shenzhen Storm Design Manual, which was formulated by The Shenzhen Meteorological Bureau.
where and are the rainfall intensity before and after the rainfall peak at time and , respectively; , and are parameters related to the frequency F of the rainfall events; is the time-to-peak ratio [11], which defines the location of the peak rain intensity, which is calculated by the specific value of the time before the peak to the total duration of the storm rainfall. values are located between zero and one—the larger , the closer the peak to the storm ending time, and vice versa.
Three groups of storm events were designed, based on Equation (6), using two storm events. As warm period, the 1st storm event lasted 2 hours with an accumulative rainfall amount of 75.2 mm and in each storm events group; meanwhile, the interval time between the 2 storm events in Group I, II and III was 72 h. In Group I, the 2nd storm events were designed with the same time-to-peak ratio () and duration (2 h), but different return periods (T = 0.5, 1, 2, 5, 10, 20, 50 and 100 years); in Group II, the second storm events were designed with the same rain amount (103 mm) and time-to-peak ratio () but different durations (1, 1.5, 2, 2.5, 3, 3.5, 4 and 5 h); in Group III, the 2nd storm events are designed with the same rain amount (103 mm) and duration (2 h) but the locations of the rain peaks changed (). The aims of the designed rainfall in the three groups were to investigate the characteristics of the surface runoff in the LID systems with different connection modes under the rain storms with different return periods, durations and peak locations.
3. Results
3.1. The Calibration and Validation Results of SWMM
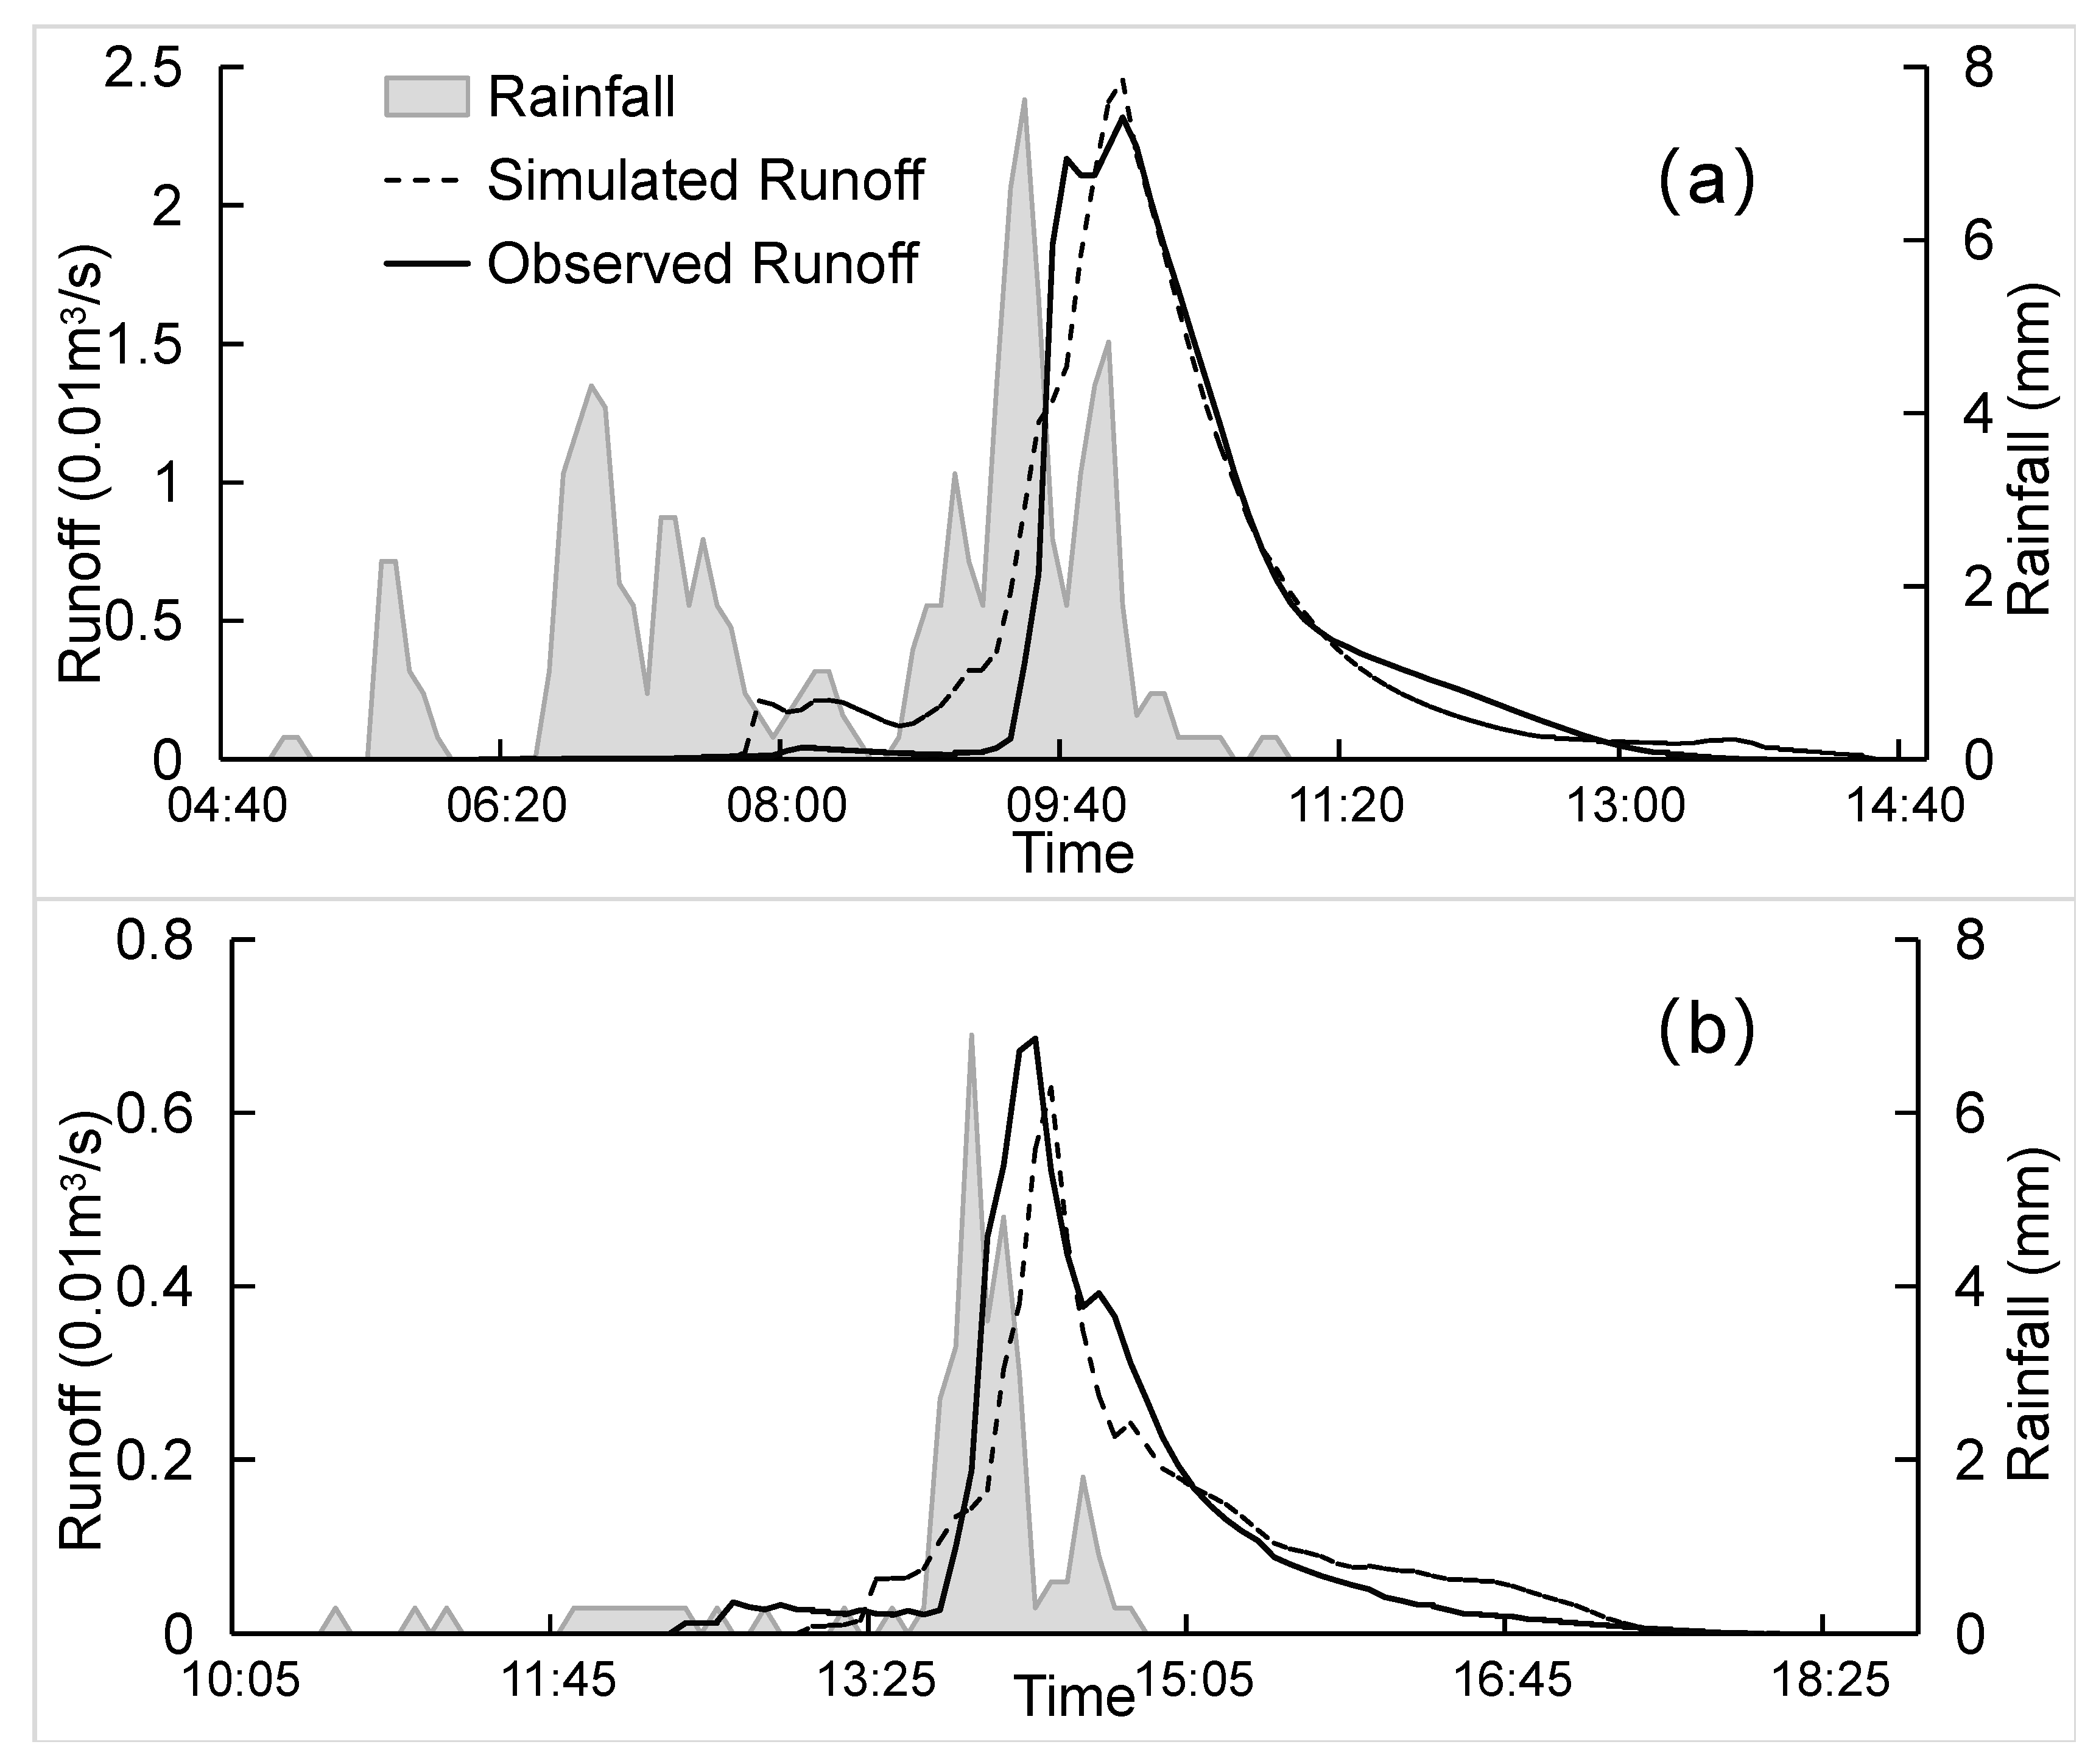
Table 3 shows that the model evaluation indicators (RE, RMSE, NSE and Tpe) are acceptable. NSE values were higher than 0.88 and 0.59 in calibration and validation period, respectively. The maximum Tpe value was –7 min. In general, the values of model evaluation indicators indicate that the SWMM was robust and suitable for modelling runoff in LID facilities in this study.
The SWMM applied in this study was aimed to model the field rainfall, and the impact of long-term rainfall on the LID facilities was not concerned. Therefore, the rainfall events characterized by long enough duration and high peaks, shown in Table 2, were used to calibrate and validate the model. The rainfall–runoff process on the 10 August 2019 (storm event 7 in Table 2, 82.6 mm rainfall lasted 255 min) gave the best model performances. The RE, RMSE, NSE and Tpe were 7.3%, 0.0018, 0.92 and 0 min for the LID chain in calibration period, while the values were –8.1%, 0.0067, 0.83 and 5 min for the best performed storm event in validation period on the 23 July 2019 (storm event 4 in Table 2). Table 4 shows the main parameters in the LID units’ soil layers and storage layers calibrated in the SWMM. Meanwhile, Table 5 shows the main parameters calibrated in modelling runoff–yield process and pipe flow (where N-Imperv—Manning’s N for impervious area; N-Perv—Manning’s N for pervious area; D-Imperv—depth of depression storage on impervious area; D-Perv—depth of depression storage on pervious area; Width—the sub-catchment width; %Z-Imperv—the percent of impervious area with no depression storage; CR—conduit roughness).
Figure 3 shows a hydrograph of the storm and the observed and modeled runoff. Figure 3a showed the rainfall event that output the best simulation results in calibration period. Furthermore, Figure 3b showed the rainfall which performed best in validation period using the parameters calibrated in the storm event showed in Figure 3a. It is seen that SWMM modeled the runoff volume with acceptable errors. Meanwhile, SWMM can simulate the peak flow values within an acceptable margin of error, as previous studies demonstrated [2,40,41]. In general, the acceptable values of RE, NSE and Tpe indicates that the SWMM is suitable for modelling the storm rainfall–runoff in the study site, and the low values of RMSE show that the optimal parameter values of the model have good potential in simulating the runoff processes, using the designed storm rainfall events. However, it should be noted that when SWMM is validated by forcing the relatively small storms (e.g., storm event 8 in Table 2, with 31.3 mm rainfall lasted 197 min), the model performance deteriorate obviously occasionally (e.g., the NSE value fall below 0.6).
3.2. The Impact of the Return Periods of Storms on Runoff in LID Chains
The effect of storm events with different rain volumes designed in Group I on the runoff processes is illustrated in Figure 4. It is seen that the three kinds of LID connection scenarios give runoff graphs with similar shapes under the rainfall with the return periods of 5 years (96 mm accumulated rainfall) and 20 years (120.2 mm accumulated rainfall). Each LID connection method can efficiently delay the start time of runoff, peak runoff occurrence time and prolong the stored water drainage time. However, the initial time of the runoff and the peak flow are obviously different. Figure 5 quantitatively describes the impact of return periods (rain amount) of storm events on runoff characteristics in different LID connection designs.
Figure 5a shows that the Rc increases obviously with more rainwater fall into the study area which indicates that more runoff volumes are produced. It is seen that the LID chain, designed in SA, produced the smallest runoff volumes under the rainfall with different rain amounts, while the LID chain designed in SC produced more runoff under the various designed storms in Group I. In SA, with the return periods of the storms increased from 0.5 year (64.8 mm rainfall) to 100 years (144.4 mm rainfall), the Rc values varied from 0.35 to 0.47. Meanwhile, the Rc values derived from SC vary from 0.38 to 0.51. Furthermore, the Rc derived from the three LID connection scenarios are obviously divided into two groups. Rc values from SA were similar to those from SB, while forces the storms in LID chains designed in SC produced quite different Rc values, especially when the return period was larger than five years.
In case of the peak runoff volume, Figure 5b clearly indicates that the depth of the peak runoff increased with the increase in the return periods of storm events, and, in comparison with the peak rainfall (which was computed using the summation of the rain amount in the time interval of [Tpeak − 5 min, Tpeak + 5 min], where Tpeak is the time when peak rainfall occurs), the three kinds of LID connection methods can effectively reduce the peak discharge volume, even if in extreme cases, the peak runoff is approximately one third of the peak rainfall forced by the storm with 100 years return period. However, Figure 5b shows a different phenomenon compared with Figure 5a; although the lowest and highest peak runoff volumes are computed from SA and SC, respectively, the peak runoff volumes derived from the three LID chain were similar when forcing the same storm event, except in the case using the storm with 100 years return period.
3.3. The Impact of Rainfall Durations on Runoff in LID Chains
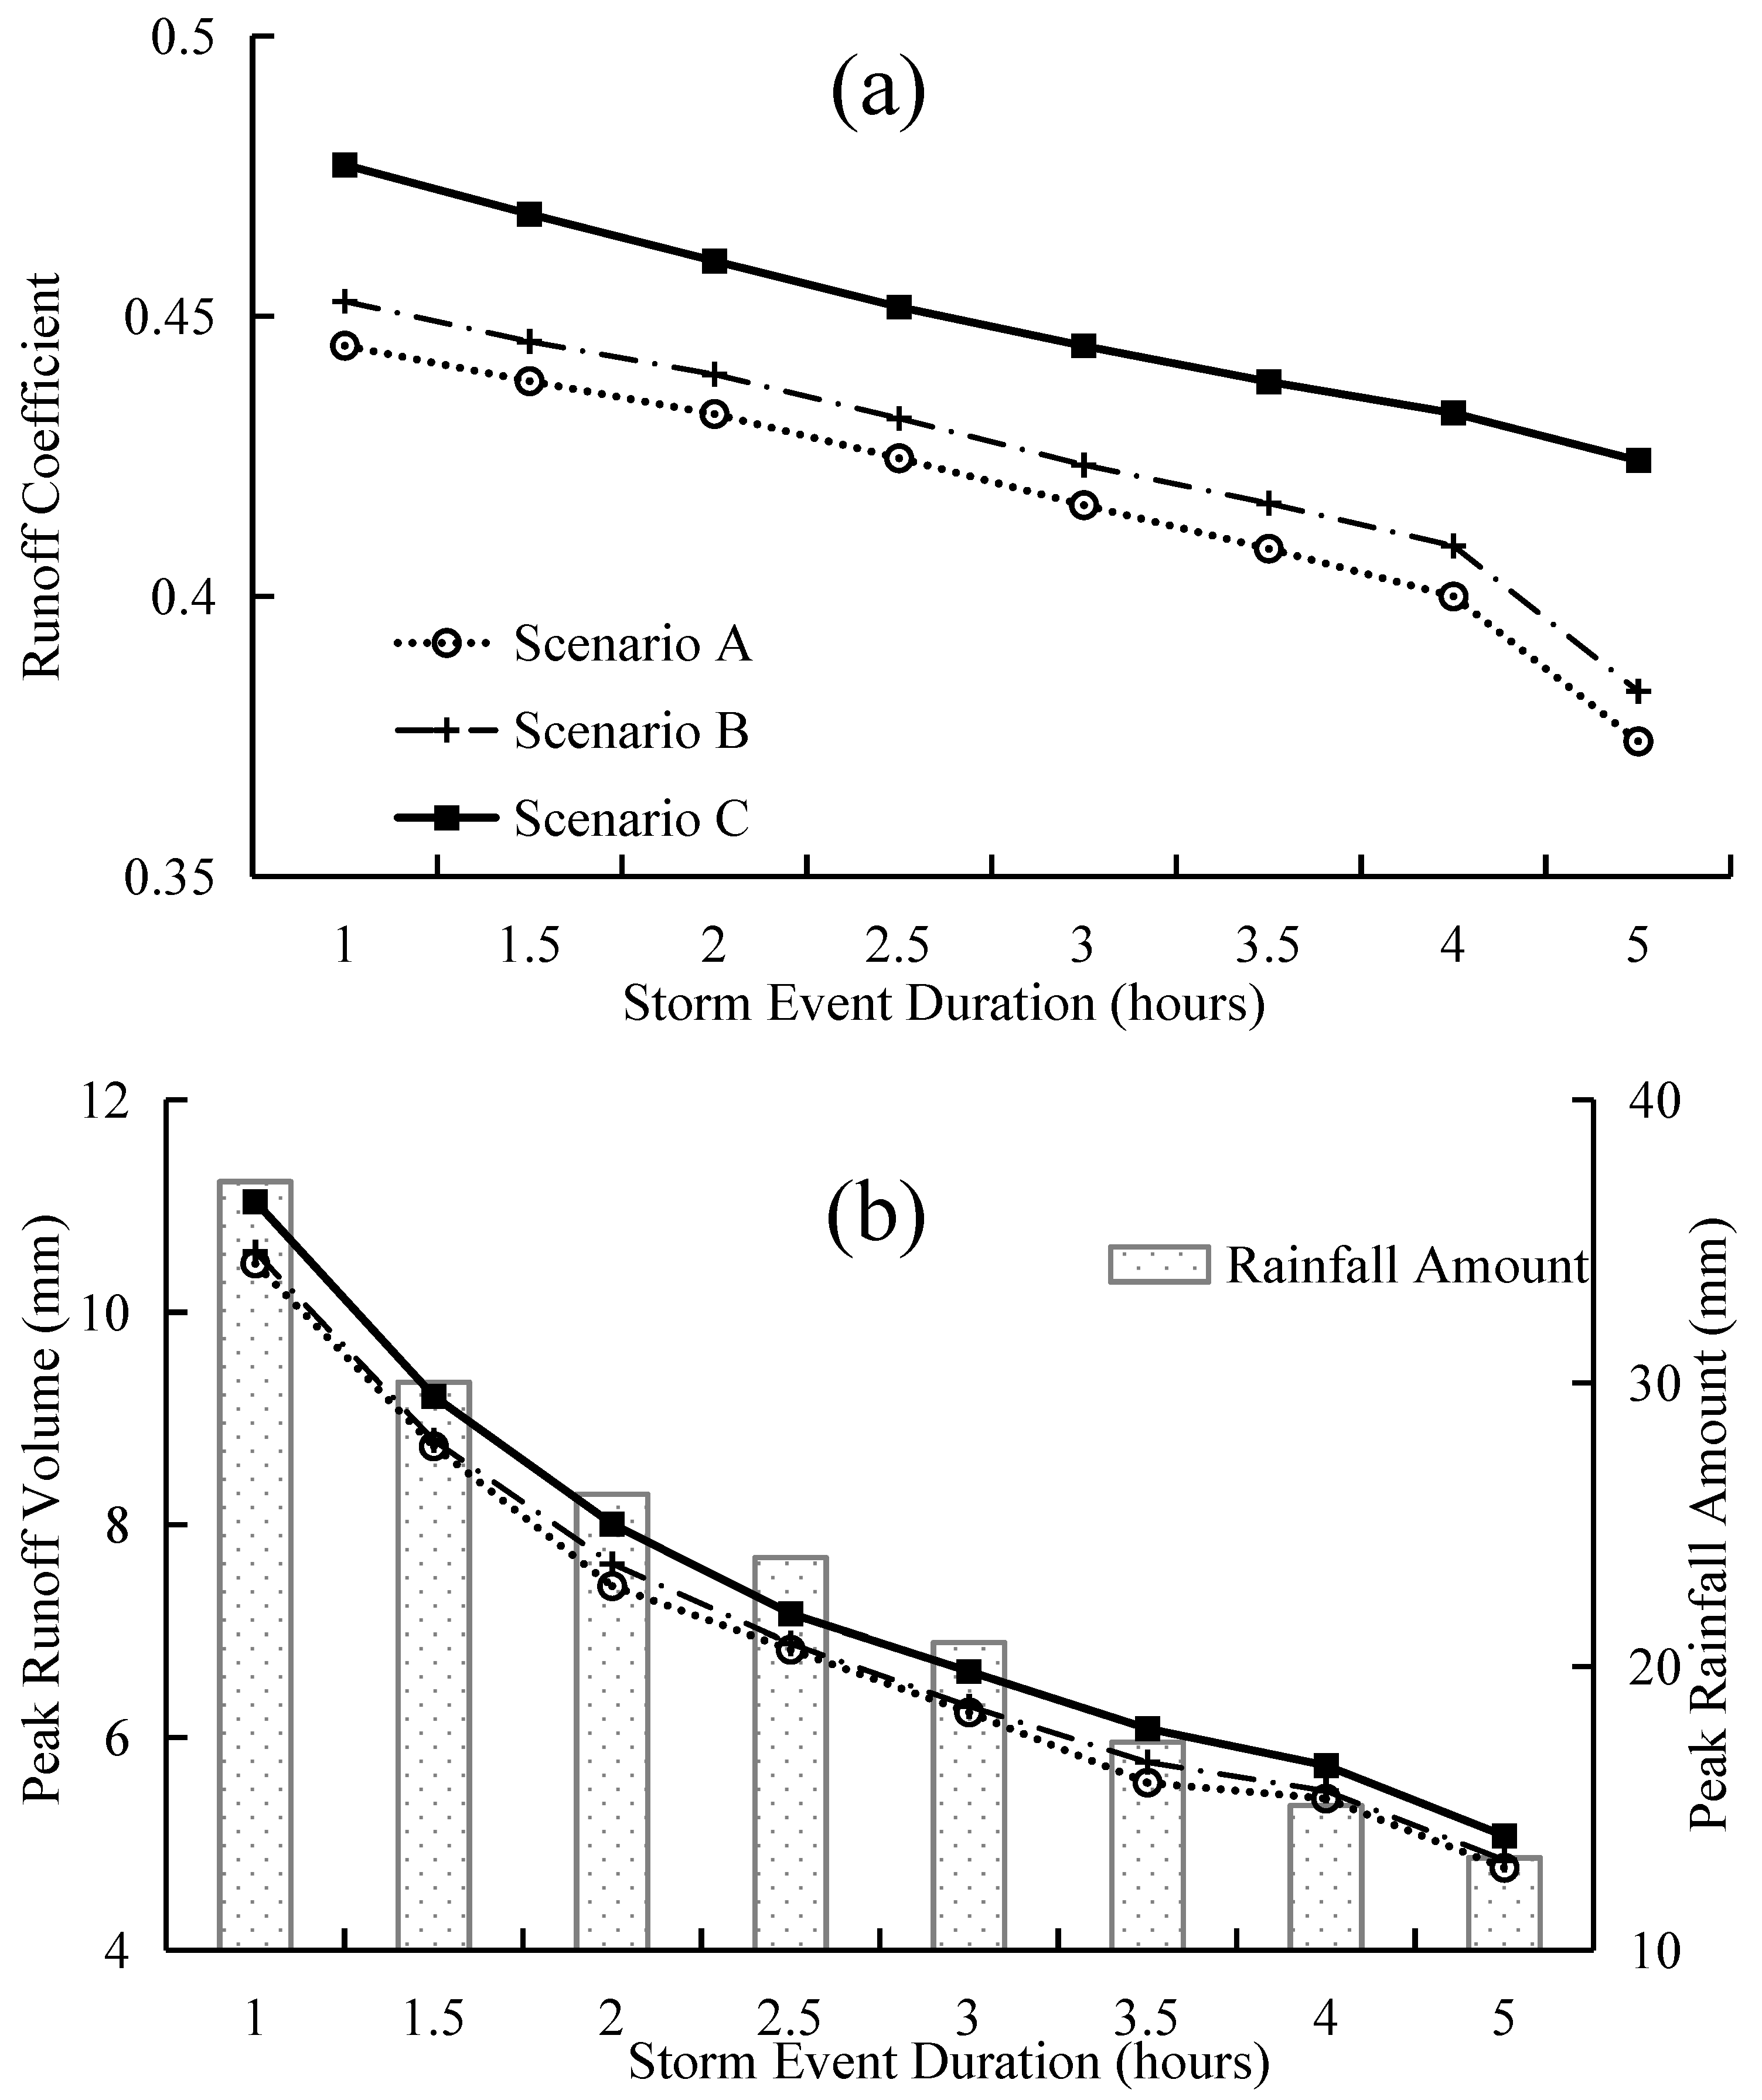
The effects of different LID chain designs on flood control by forcing Group II storm events with different rainfall durations are shown in Figure 6. In case of the Rc values computed during the storm events in Group II (Figure 6a), it is seen that the Rc values gradually decreased from 0.44–0.48 to 0.37–0.42 with the increase in the duration of the storm events from 1 hour to 5 hours for the 3 LID connection scenarios. Similar phenomenon can be observed from the figure, as in Figure 5a, the Rc values derived from the four LID chain scenarios are divided into two groups, Rc values from SA and SB are similar, while Rc values from SC are quite different.
In case of the peak runoff volume, Figure 6b shows an obvious trend that the Vp values decreased gradually from 10.6–11 mm to 4.8–5.1 mm with the decease of the peak rainfall amounts from 37.1 to 13.3 mm, as the storm durations increased from 0.5 h to 5 h. Additionally, the Vp values derived from the three LID chain scenarios are similar under the same storm event. However, a similar phenomenon, as shown in Figure 5b, is observed, in that the peak runoff volumes computed from SC were nearly the same as from SA, while the peak runoff volumes from SB were generally different from those derived from SA and SC.
3.4. The Impact of Time-to-Peak Ratios on Runoff in LID Chains
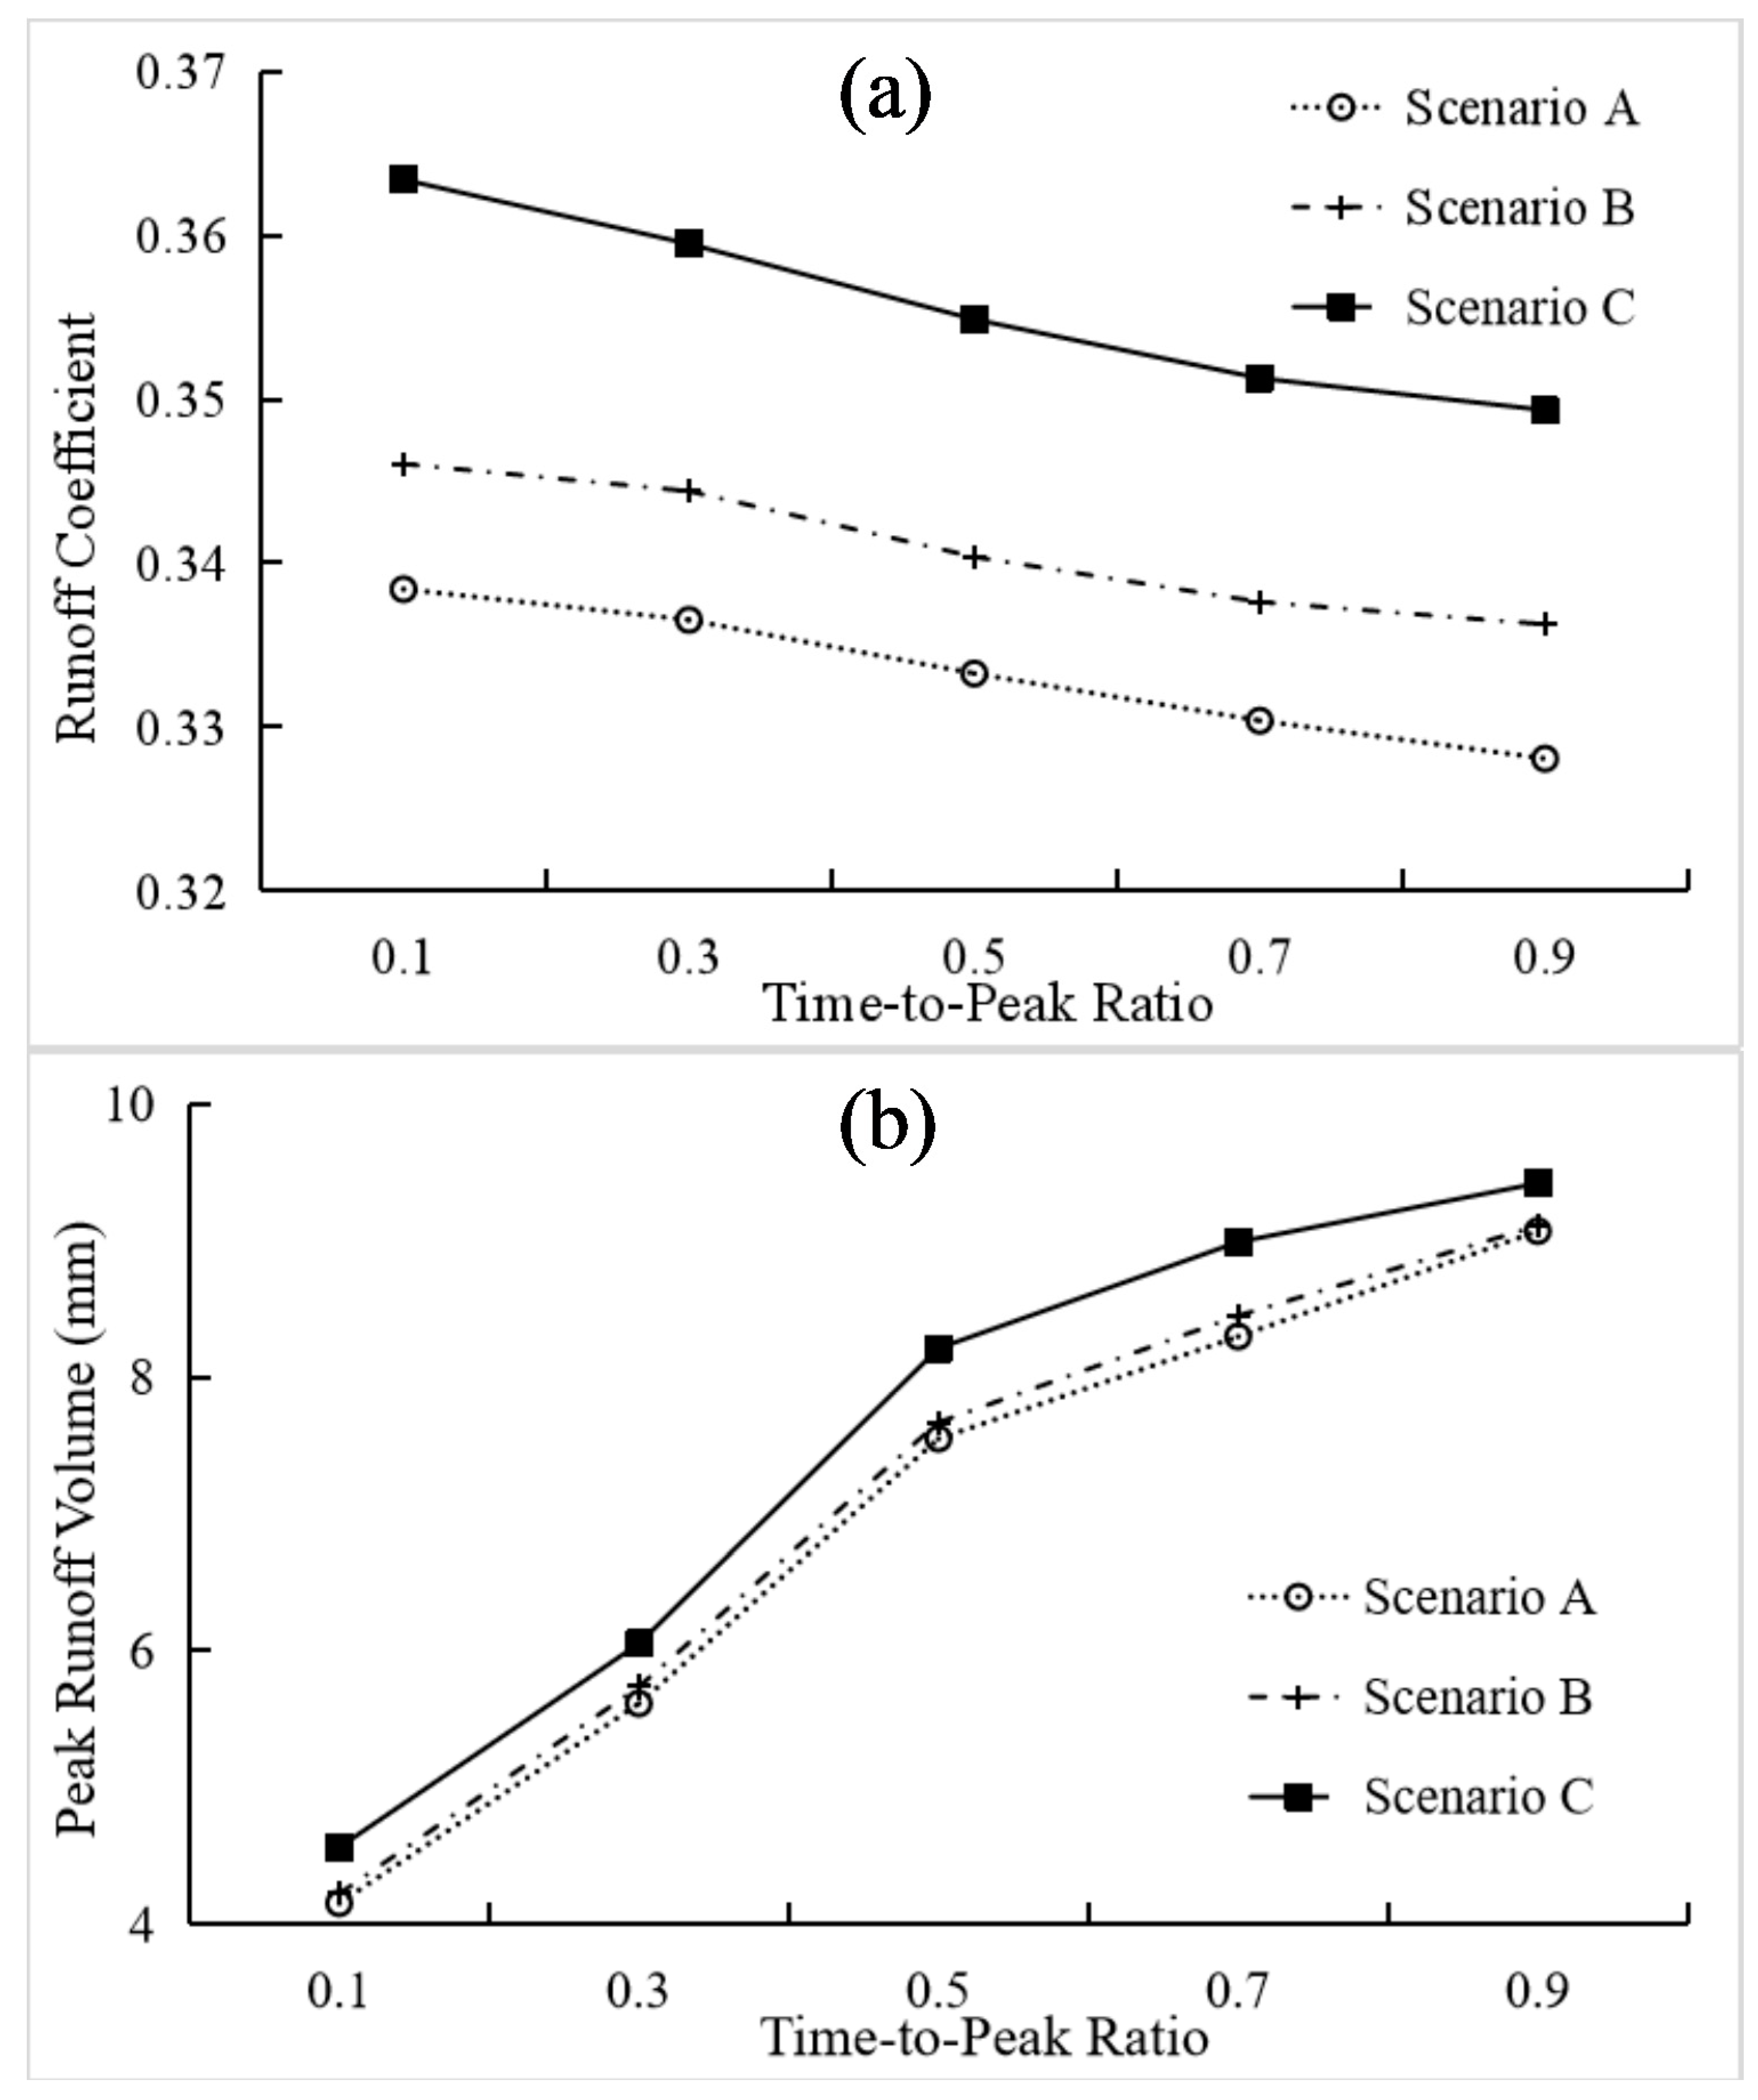
The effects of LID chain designs on flood control in Group III storm events with different time-to-peak rainfall ratios are shown in Figure 7. Figure 7a clearly shows that the location of peak rainfall can impact the runoff volume, to some extent, during the storm events. It is observed in the figure that SA gave the lowest Rc values while SC gave the highest Rc values. Meanwhile, Rc values from SB and SC were similar. However, the variation ranges of Rc values from each LID chain scenarios under rainfall with different rT−P were inconspicuous as peak rainfall moves to the end of the storm event (e.g., the Rc values vary from 0.363/357/346 to 0.349/0.343/0.336 in SA/SB/SC with the retrodisplacement of the peak rain locations).
In cases of the peak runoff volumes (Figure 7b), it is seen that the locations of rain peaks played an important role in determining the peak runoff volumes. The peak runoff volumes increased gradually when the rain peaks moved backward. The Vp values grew from 4.2–4.6 mm to 9.1–9.4 mm as rT−P moved back. Meanwhile, the figure indicates that the peak runoff volumes from SC were always smaller than those of from SA and SB. Furthermore, corresponding to Figure 7a, it can be easily inferred that the later the peak rain occurs, the higher proportion the peak runoff volumes take of the total runoff volumes during the whole rainfall–runoff processes.
4. Discussion
The figures clearly show that the flood derived from the three LID connection scenarios under the storm events with regularly varied rain amounts, durations and time-to-peak ratios give regular changed runoff characteristics, i.e., runoff coefficients and peak runoff volumes. Meanwhile, the figures also obviously indicate the connection patterns of the LID chains determine the runoff process characters due to the fact that the LID chain scenarios with different connection methods use the same LID facilities such as bio-retention, bio-swale, pervious pavement and rain garden, and each kind of LID facility has the same structure and physical parameters [42] (i.e., the same depth of soil layer and soil type, the same depth of storage layer, the same field capacity and saturated hydraulic conductivity, the same porosity in the soil layer and storage layer, etc.).
The cause of the formation of the different runoff volume characters can be explained by the input and output discharge volumes in the LID facilities. Assume VBR, VPP and VIPP are the total runoff volume produced from bio-retention, pervious pavement and impervious pavement under a storm event PS; while VBS_in, VRG_in, VBS_out and VRG_out are the inflow volume and outflow volume in bio-swale and rain garden under PS, respectively. In the four LID chain scenarios, the values of VBR, VPP and VIPP keep constant due to the drainage areas are not changed, and VIPP = V1IPP + V2IPP, where V1IPP and V2IPP (also remain unchanged under different LID connection scenarios) indicate the runoff flow into bio-swale and rain garden, respectively. However, the values of VBS_in, VRG_in, VBS_out, VRG_out and VT (the runoff volume at the observation site in Figure 2) are different in the four scenarios. In the case of SA:
In the case of SB:
In the case of SC:
Due to the fact that the LID facilities can store the runoff effectively, the outflow is always smaller than the inflow in a LID facility during the whole precipitation–runoff process, which indicates that and . Therefore, VBS_out and VRG_out can be written as follows:
where and are the runoff reduction coefficients and . As results, VT in Equations (5)–(7) can be transformed, as follows:
The physical character (e.g., field capacity, unsaturated hydraulic conductivity, porosity, etc.) of the padding material determines that the runoff volume produced in bio-retentions in unit time is smaller than that in pervious pavement, while the drainage area of bio-retentions is far larger than that of pervious pavement (Figure 1), which indicates that the total runoff volume produced by bio-retentions is far larger than that by pervious pavement (); meanwhile, the runoff yielding time of bio-retentions is obviously much longer than that of pervious pavement. From the results, it is seen that the runoff coefficients are ordered as Rc_SA < Rc_SB < Rc_SC, as seen in Figure 5a, Figure 6a and Figure 7a (where Rc_SA, Rc_SB and Rc_SC represent the values of runoff coefficient computed in SA, SB and SC); the peak runoff volumes are ordered as Vp_SA < Vp_SC < Vp_SB, as seen in Figure 5b, Figure 6b and Figure 7b (where Vp_* represent the peak runoff volume computed in SA, SB and SC).
Due to the fact that the water retention capacity in the LID chain is constant, it is easy to explain that the LID chains (SA, SB and SC) produced more total runoff volume and peak runoff volume as rain amount and peak rain amount increased (i.e., return period increased from 0.5 year to 100 years, Figure 5). Furthermore, the gradually flattened slope of the curves in Figure 5a indicates that the LID facilities gradually get saturated and lost the function of store the rainfall; therefore, the RC will not change when the rain volume exceeds a certain threshold.
The water cycle inside the LID facilities, as well as the water movement between LID facilities and the surroundings, determines the runoff process. Due to this reason, the ground under the LID facilities is pervious—the longer the rainfall duration, the more water in storage layer infiltrated into the ground; therefore, it is seen that as the duration time of the storm event with certain volume (103 mm) increases, the runoff coefficient and peak runoff volume decreases (Figure 6).
The unsaturated hydraulic conductivity is one of the main properties considered to govern flow [43], it is considerably influenced by soil moisture content. In general, the more water contains in the soil, the higher the obtained value of unsaturated hydraulic conductivity is. When the peak rainfall moves backward at the end of the storm event, the soil moisture content increases before the peak rainfall arrives, and the increased water content in the LID’s soil layer increases the permeability [44]; therefore, more rainwater is infiltrated into the storage layer and forms the peak runoff, while the total runoff volume do not change significantly.
5. Conclusions
This study investigated the impact of LID connection patterns on the runoff reduction efficiency in a catchment of residential neighborhood scale in China, where four kinds of LID chain pattern—which included the cascaded, semi-cascaded and paralleled connected LID facilities—and three groups of designed storms with different return periods, durations and time-to-peak ratios were considered for storm water management. This study demonstrated that the integrated usage of different LID facilities as a proper chain can effectively reduce the urban surface runoff and peak runoff under various rainfall types. As the cascade-connected LID chain brings each LID facility into full play in reducing the surface runoff, compared with that of the parallel connected LID chain—which gives the function as distributed LID facilities without any linkages—a cascade combination of various LID techniques would be a good choice in the design and construction of LID facilities in urban areas for flood control, which are equipped to consider the entire spectrum of storm events.
However, limited by the area of the research site, scenarios B and C were designed in the model, and we used the simulated runoff to analyze the impact of different LID connection methods on the runoff characteristics. Furthermore, the irrigation on the LID facilities impacted the water storage capacity of the LID facilities; more runoff volume would be produced if the LID facilities were irrigated before storm events; nevertheless, we ignored the irrigation, as it was difficult to account for the water consumption in the irrigation. In our future research, the soil moisture content will be measured accurately before storm events, to evaluate the water storage capacity of the soil layers and the storage layers of the LID facilities.
Author Contributions
Conceptualization and methodology, H.X.; SWMM modelling, Y.Z.; model validation, Y.Z. and H.L.; data curation, B.Z.; writing—original draft preparation, Y.Z. and H.X.; writing—review and editing, B.Z. All authors have read and agreed to the published version of the manuscript.
Funding
This research was funded by Shenzhen science and technology research and development funds, grant number ZDSYS20140509094114169.
Informed Consent Statement
Informed consent was obtained from all subjects involved in the study.
Data Availability Statement
The data used to support the findings of this study are available from the corresponding author upon request.
Acknowledgments
This study was funded by the Shenzhen Municipal Science and Technology Innovation Commission (Grant No. JCYJ20200109120416654).
Conflicts of Interest
The authors declare no conflict of interest.
References
- Meyer, D.; Molle, P.; Esser, D.; Stéphane, T.; Masi, F.; Dittmer, U. Constructed Wetlands for Combined Sewer Overflow Treatment—Comparison of German, French and Italian Approaches. Water 2013, 5, 1–12. [Google Scholar] [CrossRef]
- Baek, S.S.; Choi, D.H.; Jung, J.W.; Lee, H.J.; Lee, H.; Yoon, K.S.; Cho, K.H. Optimizing low impact development (LID) for stormwater runoff treatment in urban area, Korea: Experimental and modeling approach. Water Res. 2015, 86, 122–131. [Google Scholar] [CrossRef]
- Mijin, S.; Fouad, J.; Raghavan, S.; Jaehak, J. Evaluating the Impact of Low Impact Development (LID) Practices on Water Quantity and Quality under Different Development Designs Using SWAT. Water 2017, 9, 193. [Google Scholar]
- Low Impact Development Technologies. Available online: https://www.wbdg.org/resources/low-impact-development-technologies (accessed on 11 March 2016).
- Zimmer, C.A.; Heathcote, I.W.; Whiteley, H.R.; Schroter, H. Low-Impact-Development Practices for Stormwater: Implications for Urban Hydrology. Can. Water Resour. J. 2007, 32, 193–212. [Google Scholar] [CrossRef]
- Li, H.; Ding, L.; Ren, M.; Li, C.; Wang, H. Sponge City Construction in China: A Survey of the Challenges and Opportunities. Water 2017, 9, 594. [Google Scholar] [CrossRef] [Green Version]
- Mills, F.; Lawrence, T.; Rakheja, A.; Darwich, A.K. Green building practices around the world. Ashrae J. 2012, 54, 48–55. [Google Scholar]
- Chris, Z.; Dafang, F.; Assela, P. Transitioning to Sponge Cities: Challenges and Opportunities to Address Urban Water Problems in China. Water 2018, 10, 1230. [Google Scholar]
- Lucas, W.C.; Sample, D.J. Reducing combined sewer overflows by using outlet controls for Green Stormwater Infrastructure: Case study in Richmond, Virginia. J. Hydrol. 2015, 520, 473–488. [Google Scholar] [CrossRef]
- Graham, P.; Maclean, L.; Medina, D.; Patwardhan, A.; Vasarhelyi, G. The role of water balance modelling in the transition to low impact development. Water Qual. Res. J. Can. 2004, 39, 331–342. [Google Scholar] [CrossRef] [Green Version]
- Qin, H.P.; Li, Z.X.; Fu, G. The effects of low impact development on urban flooding under different rainfall characteristics. J. Environ. Manag. 2013, 129, 577–585. [Google Scholar] [CrossRef] [Green Version]
- Montalto, F.; Behr, C.; Alfredo, K.; Wolf, M.; Arye, M.; Walsh, M. Rapid assessment of the cost-effectiveness of low impact development for CSO control. Landsc. Urban Plan. 2007, 82, 117–131. [Google Scholar] [CrossRef]
- Li, J.; Banting, D.; Joksimovic, D.; Walters, M. Evaluation of Low Impact Development Stormwater Technologies and Water Reuse Options for the Lake Simcoe Regions. In Proceedings of the Low Impact Development 2010: Redefining Water in the City, San Francisco, CA, USA, 11–14 April 2010; pp. 1585–1596. [Google Scholar]
- Palhegyi, G.E. Designing Storm-Water Controls to Promote Sustainable Ecosystems: Science and Application. J. Hydrol. Eng. 2010, 15, 504–511. [Google Scholar] [CrossRef]
- Jeon, J.H.; Lim, K.J.; Choi, D.; Kim, T.D. Modeling the Effects of Low Impact Development on Runoff and Pollutant Loads from an Apartment Complex. Environ. Eng. Res. 2010, 15, 167–172. [Google Scholar] [CrossRef]
- Yao, L.; Wu, Z.; Wang, Y.; Sun, S.; Xu, Y. Does the spatial location of green roofs affects runoff mitigation in small urbanized catchments? J. Environ. Manag. 2020, 268, 110707. [Google Scholar] [CrossRef]
- Madrazo-Uribeetxebarria, E.; Garmendia, M.; Berrondo, J.A.; Andrés-Doménech, I. Sensitivity analysis of permeable pavement hydrological modelling in the Storm Water Management Model. J. Hydrol. 2021, 600, 126525. [Google Scholar] [CrossRef]
- Haghighatafshar, S.; Jes, L.C.J.; Aspegren, H.; Jönsson, K. Conceptualization and Schematization of Mesoscale Sustainable Drainage Systems: A Full-Scale Study. Water 2018, 10, 1048. [Google Scholar] [CrossRef] [Green Version]
- Tirpak, R.A.; Winston, R.J.; Simpson, I.M.; Dorsey, J.D.; Carpenter, D.D. Hydrologic impacts of retrofitted low impact development in a commercial parking lot. J. Hydrol. 2021, 592, 125773. [Google Scholar] [CrossRef]
- Chandana, D.; Marcio, H.; Giacomoni, C.; Prakash, K.; Hillary, H.; Andrea, R.; William, S.; Emily, M.Z. Simulation of Combined Best Management Practices and Low Impact Development for Sustainable Stormwater Management. J. Am. Water Resour. Assoc. 2010, 46, 907–918. [Google Scholar]
- Lee, J.M.; Hyun, K.H.; Choi, J.S.; Yoon, Y.J.; Geronimo, F.K.F. Flood reduction analysis on watershed of LID design demonstration district using SWMM5. Desalination Water Treat. 2012, 38, 255–261. [Google Scholar] [CrossRef]
- Jemberie, M.A.; Melesse, A.M. Urban Flood Management through Urban Land Use Optimization Using LID Techniques, City of Addis Ababa, Ethiopia. Water 2021, 13, 1721. [Google Scholar] [CrossRef]
- Samouei, S.; Zger, M. Evaluating the performance of low impact development practices in urban runoff mitigation through distributed and combined implementation. J. Hydroinformatics 2020, 22, 1506–1520. [Google Scholar] [CrossRef]
- Liang, C.; Zhang, X.; Xia, J.; Xu, J.; She, D. The Effect of Sponge City Construction for Reducing Directly Connected Impervious Areas on Hydrological Responses at the Urban Catchment Scale. Water 2020, 12, 1163. [Google Scholar] [CrossRef] [Green Version]
- Hamel, P.; Daly, E.; Fletcher, T.D. Source-control stormwater management for mitigating the impacts of urbanisation on baseflow: A review. J. Hydrol. 2013, 485, 201–211. [Google Scholar] [CrossRef]
- Sage, J.; Berthier, E.; Gromaire, M.C. Stormwater management criteria for on-site pollution control: A comparative assessment of international practices. Environ. Manag. 2015, 56, 66. [Google Scholar] [CrossRef] [PubMed] [Green Version]
- Dietz, M.E.; Clausen, J.C. Stormwater runoff and export changes with development in a traditional and low impact subdivision. J. Environ. Manag. 2008, 87, 560–566. [Google Scholar] [CrossRef] [PubMed]
- Hasan, H.H.; Razali, S.; Zaki, A.; Hamzah, F.M. Integrated hydrological-hydraulic model for flood simulation in tropical urban catchment. Sustainability 2019, 11, 6700. [Google Scholar] [CrossRef] [Green Version]
- Rossman, L.A.; Huber, W.C. Storm Water Management Model Reference Manual Volume I-Hydrology; U.S. EPA Office of Research and Development: Washington, DC, USA, 2016.
- Gorgoglione, A.; Bombardelli, F.A.; Pitton, B.; Oki, L.R.; Haver, D.L.; Young, T.M. Uncertainty in the parameterization of sediment build-up and wash-off processes in the simulation of sediment transport in urban areas. Environ. Model. Softw. 2019, 111, 170–181. [Google Scholar] [CrossRef]
- Guan, M.; Sillanpää, N.; Koivusalo, H. Modelling and assessment of hydrological changes in a developing urban catchment. Hydrol. Process. 2015, 29, 2880–2894. [Google Scholar] [CrossRef]
- Versini, P.A.; Ramier, D.; Berthier, E.; Gouvello, B.D. Assessment of the hydrological impacts of green roof: From building scale to basin scale. J. Hydrol. 2015, 524, 562–575. [Google Scholar] [CrossRef] [Green Version]
- Cipolla, S.S.; Maglionico, M.; Stojkov, I. A long-term hydrological modelling of an extensive green roof by means of SWMM. Ecol. Eng. 2016, 95, 876–887. [Google Scholar] [CrossRef]
- Yazdi, M.N.; Ketabchy, M.; Sample, D.J.; Scott, D.; Liao, H. An evaluation of HSPF and SWMM for simulating streamflow regimes in an urban watershed. Environ. Model. Softw. 2019, 118, 211–225. [Google Scholar] [CrossRef]
- Baek, S.S.; Ligaray, M.; Pyo, J.; Park, J.P.; Cho, K.H. A novel water quality module of the SWMM model for assessing low impact development (LID) in urban watersheds. J. Hydrol. 2020, 586, 124886. [Google Scholar] [CrossRef]
- Gorgoglione, A.; Castro, A.; Iacobellis, V.; Gioia, A. A Comparison of Linear and Non-Linear Machine Learning Techniques (PCA and SOM) for Characterizing Urban Nutrient Runoff. Sustainability 2021, 13, 2054. [Google Scholar] [CrossRef]
- Chen, H.; Luo, Y.; Potter, C.; Moran, P.J.; Grieneisen, M.L.; Zhang, M. Modeling pesticide diuron loading from the San Joaquin watershed into the SacramentoSan Joaquin Delta using SWAT. Water Res. 2017, 121, 374–385. [Google Scholar] [CrossRef]
- Moriasi, D.N. Model evaluation guidelines for systematic quantification of accuracy in watershed simulations. Trans. Asabe 2007, 50, 885–900. [Google Scholar] [CrossRef]
- Rodríguez, R.; Pastorini, M.; Etcheverry, L.; Chreties, C.; Gorgoglione, A. Water-Quality Data Imputation with a High Percentage of Missing Values: A Machine Learning Approach. Sustainability 2021, 13, 6318. [Google Scholar] [CrossRef]
- Barco, J.; Wong, K.M.; Stenstrom, M.K. Automatic Calibration of the U.S. EPA SWMM Model for a Large Urban Catchment. J. Hydraul. Eng. 2008, 134, 466–474. [Google Scholar] [CrossRef]
- Tsihrintzis, V.A.; Hamid, R. Runoff quality prediction from small urban catchments using SWMM. Hydrol. Process. 1998, 12, 311–329. [Google Scholar] [CrossRef]
- Jia, L.; Sample, D.J.; Bell, C.; Guan, Y. Review and Research Needs of Bioretention Used for the Treatment of Urban Stormwater. Water 2014, 6, 1069–1099. [Google Scholar]
- Ustohal, P.; Stauffer, F.; Dracos, T. Measurement and modeling of hydraulic characteristics of unsaturated porous media with mixed wettability. J. Contam. Hydrol. 1998, 33, 5–37. [Google Scholar] [CrossRef]
- Zhu, Z.; Chen, X. Evaluating the Effects of Low Impact Development Practices on Urban Flooding under Different Rainfall Intensities. Water 2017, 9, 548. [Google Scholar] [CrossRef]
Figure 1.
Study Area.

Figure 2.
The schematic diagrams of the cascade-connected LID facilities (a); the semi-cascade-connected LID facilities (b); and the parallel-connected LID facilities (c). Additionally, the red dot is the runoff observation site.
Figure 2.
The schematic diagrams of the cascade-connected LID facilities (a); the semi-cascade-connected LID facilities (b); and the parallel-connected LID facilities (c). Additionally, the red dot is the runoff observation site.

Figure 3.
The calibration (a) and validation (b) of SWMM using the observed storm rainfall event.

Figure 4.
Runoff processes derived from the three LID connection scenarios under the rainfall with the return periods of 5 years (a) and 20 years (b).
Figure 4.
Runoff processes derived from the three LID connection scenarios under the rainfall with the return periods of 5 years (a) and 20 years (b).
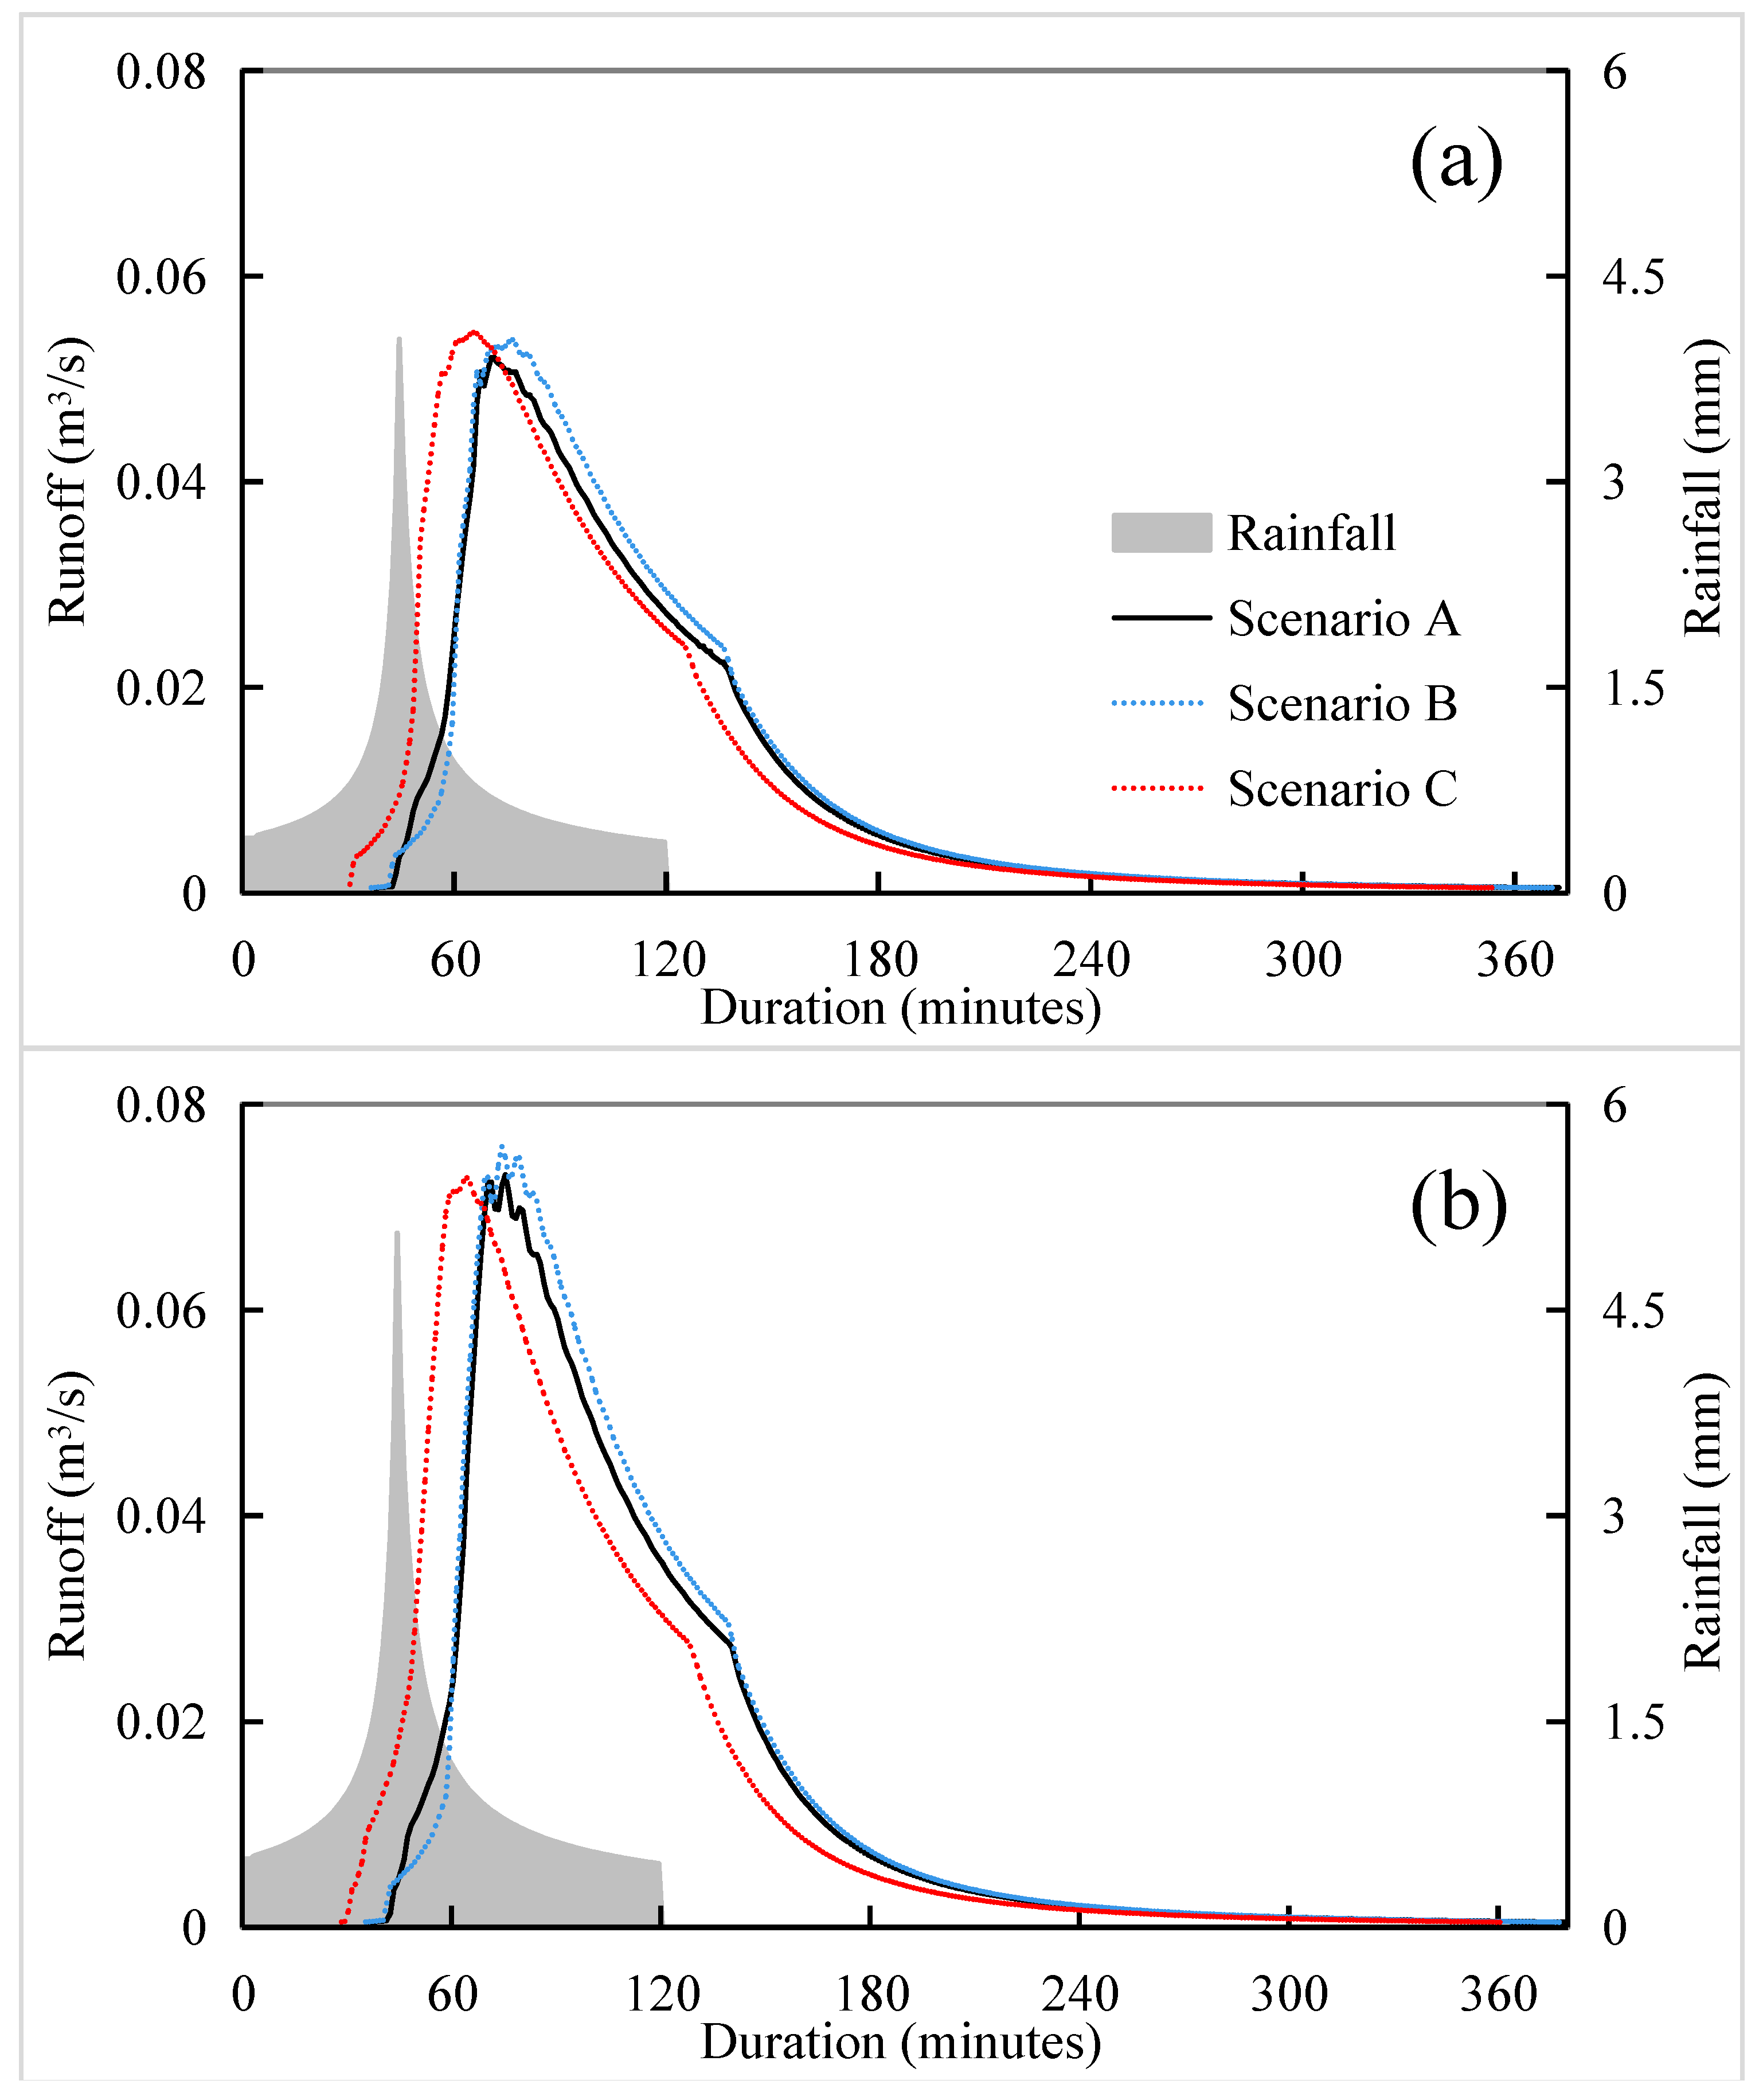
Figure 5.
The runoff coefficients (a) and peak runoff volumes (b) simulated in SWMM under the storms in Group I.
Figure 5.
The runoff coefficients (a) and peak runoff volumes (b) simulated in SWMM under the storms in Group I.
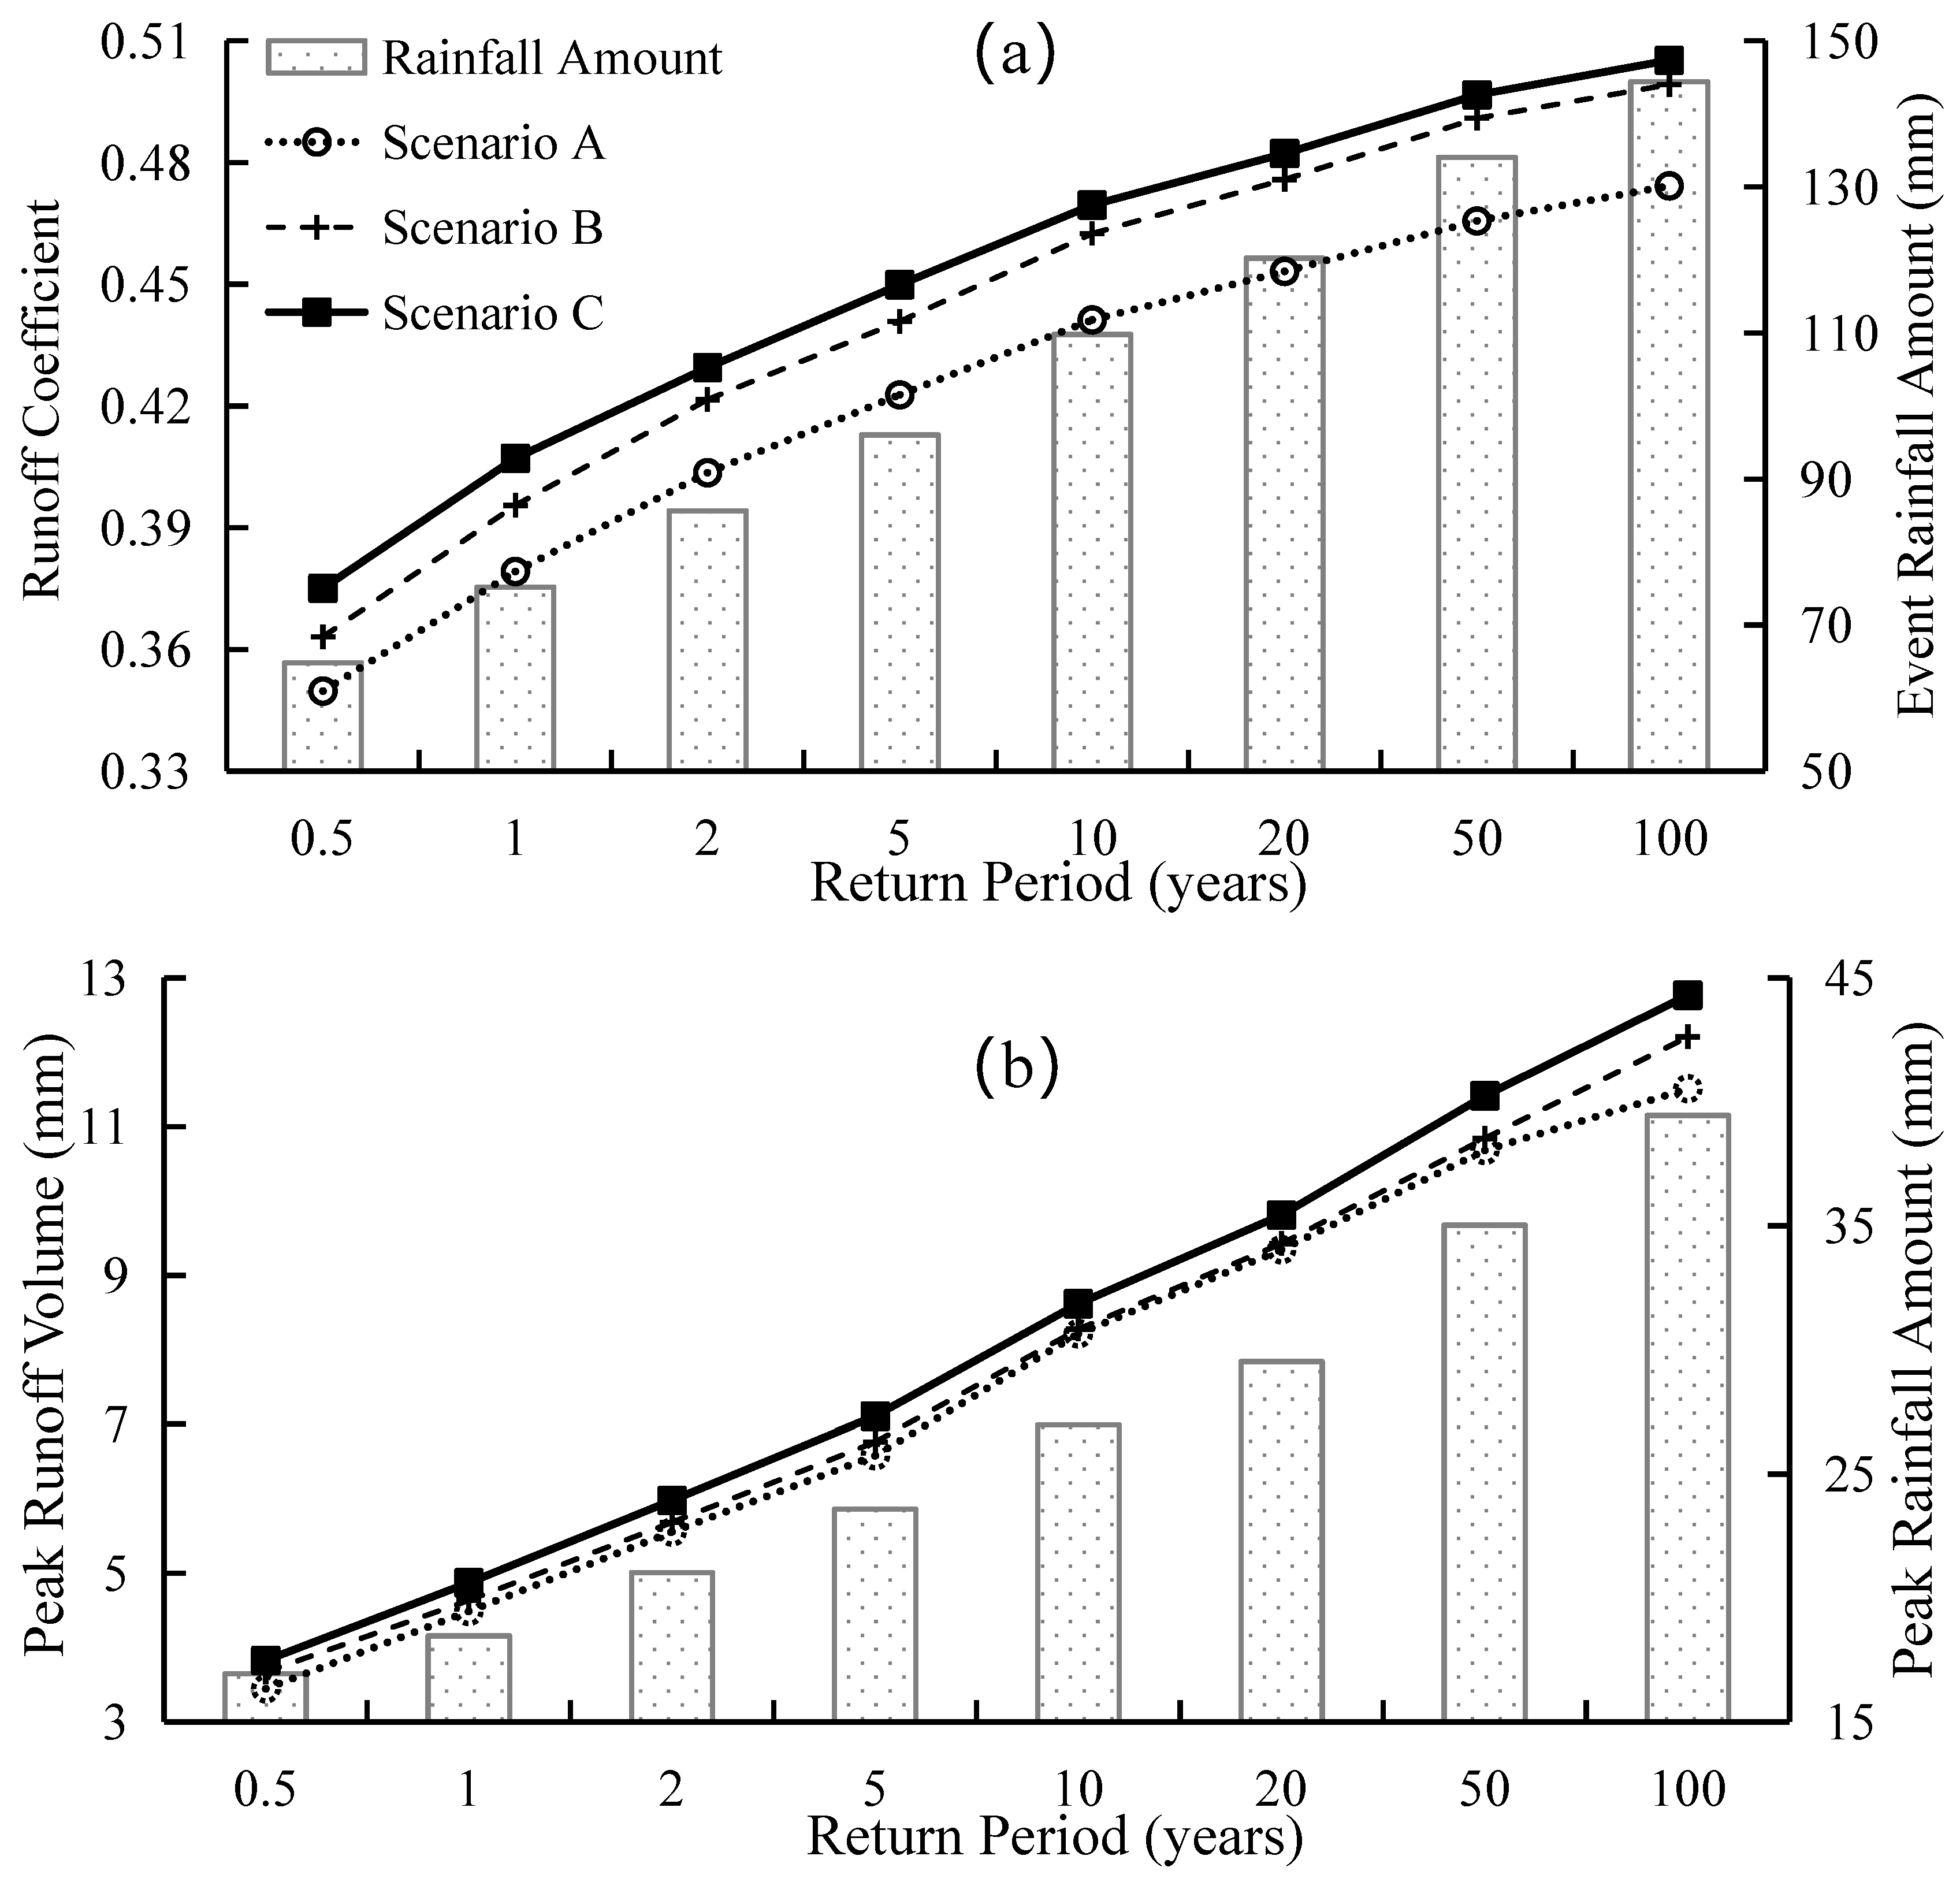
Figure 6.
The runoff coefficients (a) and peak runoff volumes (b) simulated in SWMM under the storms in Group II.
Figure 6.
The runoff coefficients (a) and peak runoff volumes (b) simulated in SWMM under the storms in Group II.

Figure 7.
The runoff coefficients (a) and peak runoff volumes (b) simulated in SWMM under the storms in Group III.
Figure 7.
The runoff coefficients (a) and peak runoff volumes (b) simulated in SWMM under the storms in Group III.


Table 1.
A brief introduction of LID units in the study site.
| LID Unit | Number | Total Area (m2) | Thickness of Soil Layer (mm) | Thickness of Storage Layer (mm) | Plant |
|---|---|---|---|---|---|
| Bio-retention | 13 | 15.6 | 400 | 400 | Hibiscus rosa-sinensis |
| Ixora chinensis | |||||
| Bio-swale | 2 | 384 | 300 | 400 | Zoysia japonica |
| Rain garden | 1 | 20 | 500 | 400 | Miscanthus |
| Hibiscus rosa-sinensis | |||||
| Wedelia chinensis | |||||
| Pervious pavement | 1 | 487 | 125 * | 100 | / |
* indicates the thickness of the pavement layer.
Table 2.
Summary of the eight selected storm rainfall–runoff events.
| Storm Event | Date | Event Precipitation (mm) | Runoff Coefficient | Peak Rainfall (mm/min) | Peak Discharge (m3/s) | Storm Duration (min) | Runoff Duration (min) |
|---|---|---|---|---|---|---|---|
| 1 | 2 July | 46.6 | 0.21 | 1.7 | 0.01 | 153 | 272 |
| 2 | 5 July | 69.7 | 0.32 | 1.9 | 0.017 | 119 | 204 |
| 3 | 16 July | 39.7 | 0.15 | 1.5 | 0.013 | 167 | 263 |
| 4 | 23 July | 33.9 | 0.11 | 1.4 | 0.006 | 195 | 286 |
| 5 | 2 August | 75.5 | 0.13 | 2.3 | 0.021 | 206 | 381 |
| 6 | 6 August | 65.3 | 0.22 | 1.8 | 0.019 | 188 | 405 |
| 7 | 10 August | 82.6 | 0.26 | 1.6 | 0.023 | 254 | 433 |
| 8 | 25 August | 31.3 | 0.16 | 1.5 | 0.012 | 197 | 311 |
| Average | -- | 55.6 | 0.19 | 1.7 | 0.015 | 185 | 319 |
Table 3.
Summary of the model evaluation indicators in calibrating and validating SWMM.
| RSS (10−5) | RE (%) | RMSE (10−2) | NSE | Tpe | |
|---|---|---|---|---|---|
| Calibration | 3.3–4.8 | –8.9–9.3 | 0.18–0.47 | 0.88–0.92 | –6–4 |
| Validation | 4.2–6.1 | –10.2–12.1 | 0.67–0.82 | 0.59–0.83 | –7–6 |
Table 4.
Main parameter values of LID units calibrated in SWMM.
| LID Unit | Soil Layer | Storage Layer | |||
|---|---|---|---|---|---|
| Porosity | Infiltration Rate (mm/h) | Field Capacity (%) | Porosity | Infiltration Rate (mm/h) | |
| Bio-retention | 0.53 | 142–155 | 11 | 0.39–0.43 | 252–267 |
| Bio-swale | 0.53 | 148 | 10 | 0.37 | 255 |
| Rain garden | 0.52 | 155 | 12 | 0.35 | 261 |
| Pervious pavement | 0.58 | 230 | 6 | 0.36 | 289 |
Table 5.
Main parameter values in computing runoff–yield process and pipe flow calibrated in SWMM.
| Parameter | N-Imperv | N-Perv | D-Imperv | D-Perv | Width | %Z-Imperv | CR |
|---|---|---|---|---|---|---|---|
| Value | 0.012 | 0.1 | 1.5 mm | 5 mm | 45.7 m | 23 | 0.013 |
Publisher’s Note: MDPI stays neutral with regard to jurisdictional claims in published maps and institutional affiliations. |
© 2021 by the authors. Licensee MDPI, Basel, Switzerland. This article is an open access article distributed under the terms and conditions of the Creative Commons Attribution (CC BY) license (https://creativecommons.org/licenses/by/4.0/).
Share and Cite
MDPI and ACS Style
Zhang, Y.; Xu, H.; Liu, H.; Zhou, B. The Application of Low Impact Development Facility Chain on Storm Rainfall Control: A Case Study in Shenzhen, China. Water 2021, 13, 3375. https://doi.org/10.3390/w13233375
AMA Style
Zhang Y, Xu H, Liu H, Zhou B. The Application of Low Impact Development Facility Chain on Storm Rainfall Control: A Case Study in Shenzhen, China. Water. 2021; 13(23):3375. https://doi.org/10.3390/w13233375
Chicago/Turabian StyleZhang, Ying, Hongliang Xu, Honglei Liu, and Bin Zhou. 2021. "The Application of Low Impact Development Facility Chain on Storm Rainfall Control: A Case Study in Shenzhen, China" Water 13, no. 23: 3375. https://doi.org/10.3390/w13233375
Note that from the first issue of 2016, this journal uses article numbers instead of page numbers. See further details here.